Burmese vs Immigrants from Serbia Family Poverty
COMPARE
Burmese
Immigrants from Serbia
Family Poverty
Family Poverty Comparison
Burmese
Immigrants from Serbia
7.3%
FAMILY POVERTY
99.7/ 100
METRIC RATING
25th/ 347
METRIC RANK
7.7%
FAMILY POVERTY
98.7/ 100
METRIC RATING
56th/ 347
METRIC RANK
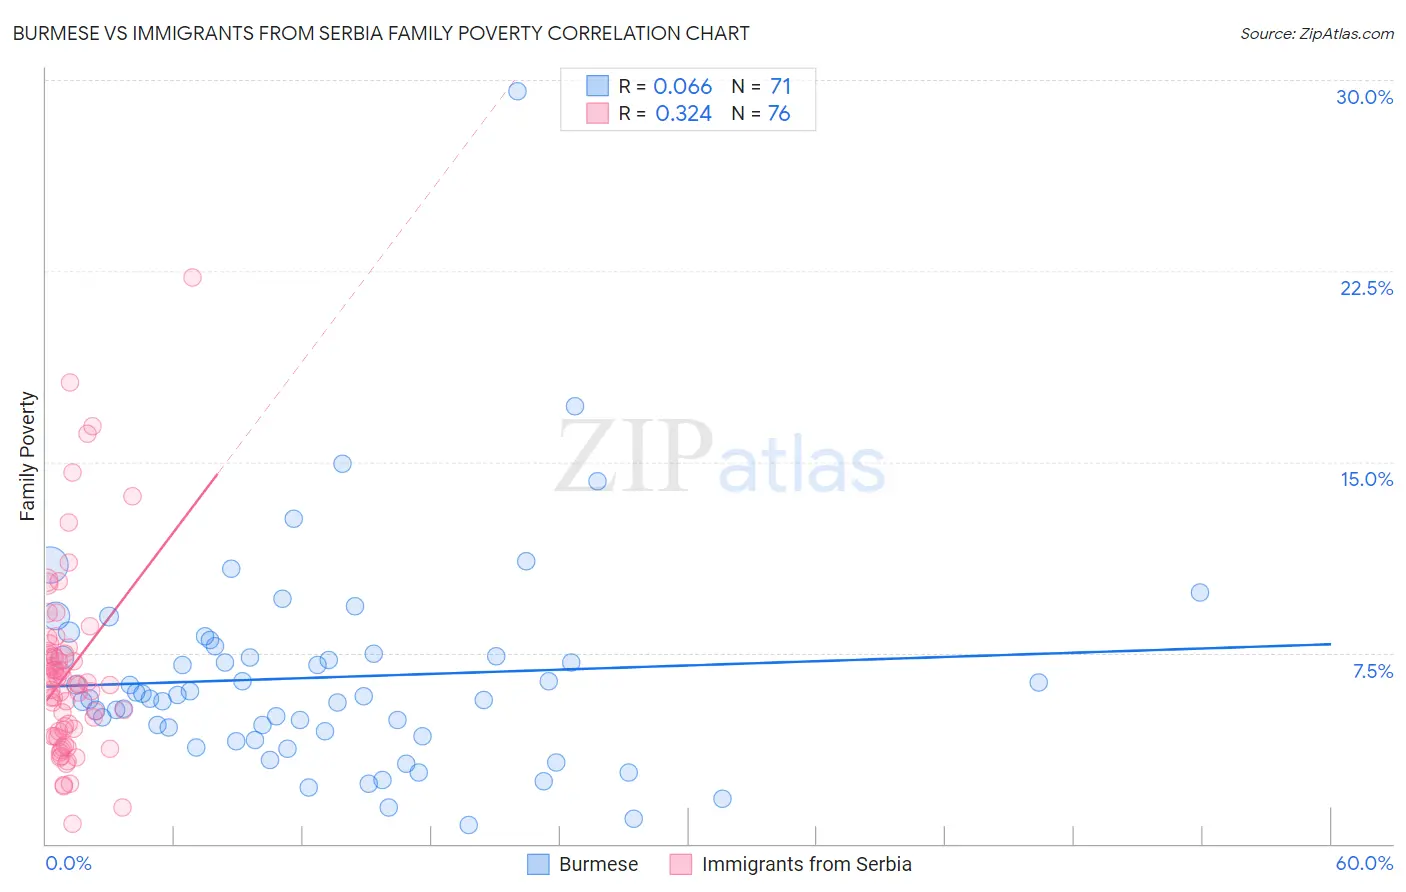
Burmese vs Immigrants from Serbia Family Poverty Correlation Chart
The statistical analysis conducted on geographies consisting of 463,380,335 people shows a slight positive correlation between the proportion of Burmese and poverty level among families in the United States with a correlation coefficient (R) of 0.066 and weighted average of 7.3%. Similarly, the statistical analysis conducted on geographies consisting of 131,659,331 people shows a mild positive correlation between the proportion of Immigrants from Serbia and poverty level among families in the United States with a correlation coefficient (R) of 0.324 and weighted average of 7.7%, a difference of 5.4%.
Family Poverty Correlation Summary
| Measurement | Burmese | Immigrants from Serbia |
| Minimum | 0.76% | 0.76% |
| Maximum | 29.5% | 22.2% |
| Range | 28.8% | 21.5% |
| Mean | 6.5% | 6.8% |
| Median | 5.8% | 6.3% |
| Interquartile 25% (IQ1) | 4.2% | 4.3% |
| Interquartile 75% (IQ3) | 7.5% | 7.5% |
| Interquartile Range (IQR) | 3.2% | 3.2% |
| Standard Deviation (Sample) | 4.2% | 3.8% |
| Standard Deviation (Population) | 4.2% | 3.8% |
Similar Demographics by Family Poverty
Demographics Similar to Burmese by Family Poverty
In terms of family poverty, the demographic groups most similar to Burmese are Croatian (7.3%, a difference of 0.0%), Cypriot (7.3%, a difference of 0.24%), Immigrants from Scotland (7.3%, a difference of 0.26%), Assyrian/Chaldean/Syriac (7.3%, a difference of 0.30%), and Danish (7.3%, a difference of 0.32%).
| Demographics | Rating | Rank | Family Poverty |
| Immigrants | Lithuania | 99.8 /100 | #18 | Exceptional 7.2% |
| Eastern Europeans | 99.7 /100 | #19 | Exceptional 7.2% |
| Immigrants | Hong Kong | 99.7 /100 | #20 | Exceptional 7.3% |
| Immigrants | Iran | 99.7 /100 | #21 | Exceptional 7.3% |
| Danes | 99.7 /100 | #22 | Exceptional 7.3% |
| Assyrians/Chaldeans/Syriacs | 99.7 /100 | #23 | Exceptional 7.3% |
| Croatians | 99.7 /100 | #24 | Exceptional 7.3% |
| Burmese | 99.7 /100 | #25 | Exceptional 7.3% |
| Cypriots | 99.6 /100 | #26 | Exceptional 7.3% |
| Immigrants | Scotland | 99.6 /100 | #27 | Exceptional 7.3% |
| Immigrants | Korea | 99.6 /100 | #28 | Exceptional 7.4% |
| Immigrants | Northern Europe | 99.6 /100 | #29 | Exceptional 7.4% |
| Italians | 99.6 /100 | #30 | Exceptional 7.4% |
| Czechs | 99.6 /100 | #31 | Exceptional 7.4% |
| Poles | 99.5 /100 | #32 | Exceptional 7.4% |
Demographics Similar to Immigrants from Serbia by Family Poverty
In terms of family poverty, the demographic groups most similar to Immigrants from Serbia are Immigrants from Eastern Asia (7.7%, a difference of 0.040%), Immigrants from Sweden (7.7%, a difference of 0.070%), Swiss (7.7%, a difference of 0.080%), Asian (7.7%, a difference of 0.090%), and Finnish (7.7%, a difference of 0.12%).
| Demographics | Rating | Rank | Family Poverty |
| Immigrants | Bolivia | 98.9 /100 | #49 | Exceptional 7.7% |
| Immigrants | North Macedonia | 98.9 /100 | #50 | Exceptional 7.7% |
| Immigrants | Moldova | 98.8 /100 | #51 | Exceptional 7.7% |
| Indians (Asian) | 98.8 /100 | #52 | Exceptional 7.7% |
| Swiss | 98.8 /100 | #53 | Exceptional 7.7% |
| Immigrants | Sweden | 98.8 /100 | #54 | Exceptional 7.7% |
| Immigrants | Eastern Asia | 98.7 /100 | #55 | Exceptional 7.7% |
| Immigrants | Serbia | 98.7 /100 | #56 | Exceptional 7.7% |
| Asians | 98.7 /100 | #57 | Exceptional 7.7% |
| Finns | 98.7 /100 | #58 | Exceptional 7.7% |
| Europeans | 98.7 /100 | #59 | Exceptional 7.7% |
| Immigrants | Greece | 98.7 /100 | #60 | Exceptional 7.7% |
| Immigrants | Netherlands | 98.6 /100 | #61 | Exceptional 7.7% |
| Macedonians | 98.6 /100 | #62 | Exceptional 7.8% |
| Zimbabweans | 98.4 /100 | #63 | Exceptional 7.8% |