Immigrants from North America vs Immigrants from Serbia Family Poverty
COMPARE
Immigrants from North America
Immigrants from Serbia
Family Poverty
Family Poverty Comparison
Immigrants from North America
Immigrants from Serbia
7.9%
FAMILY POVERTY
97.9/ 100
METRIC RATING
78th/ 347
METRIC RANK
7.7%
FAMILY POVERTY
98.7/ 100
METRIC RATING
56th/ 347
METRIC RANK
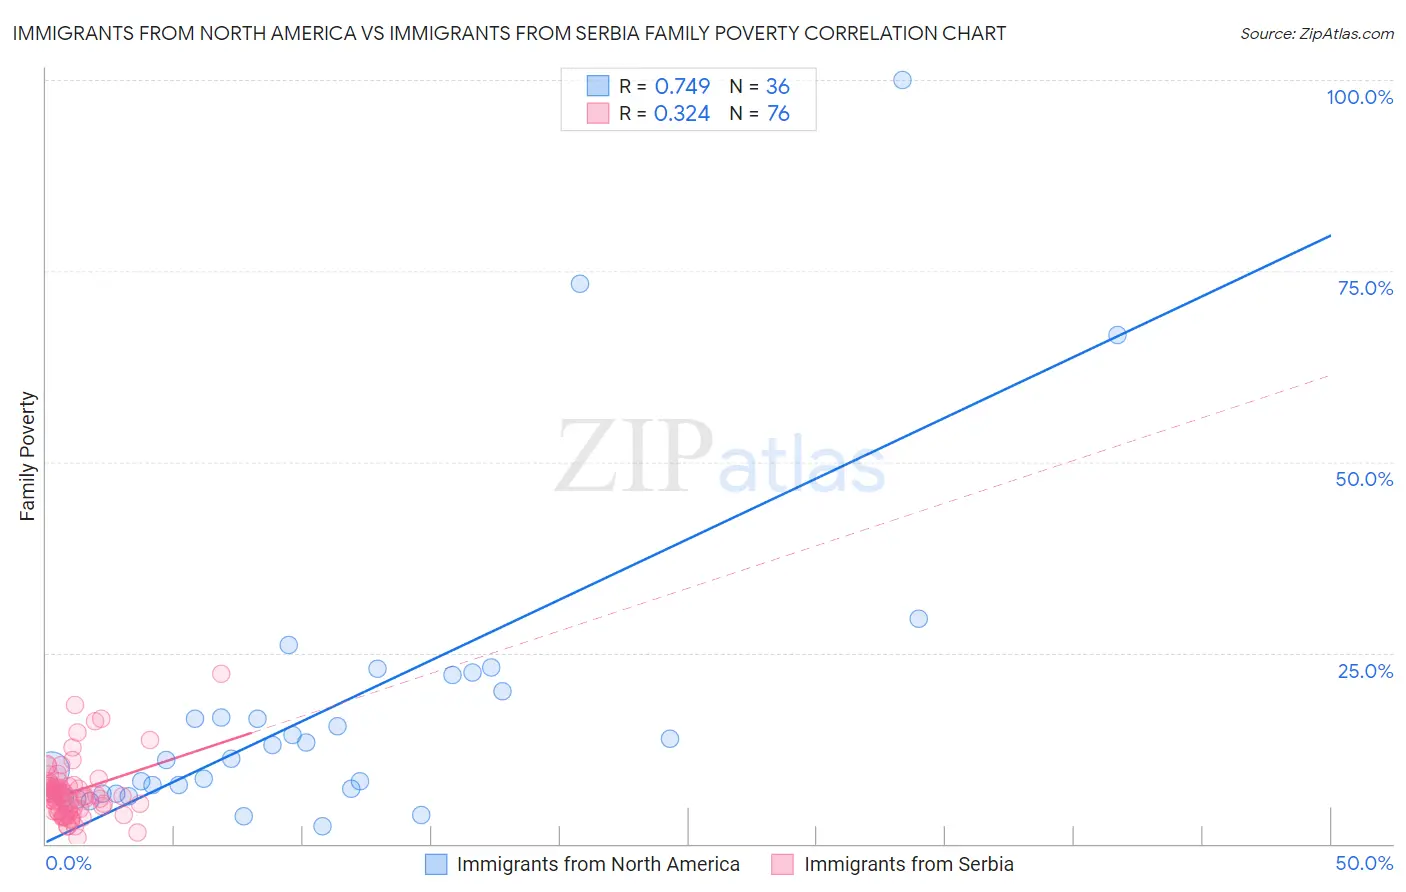
Immigrants from North America vs Immigrants from Serbia Family Poverty Correlation Chart
The statistical analysis conducted on geographies consisting of 460,351,855 people shows a strong positive correlation between the proportion of Immigrants from North America and poverty level among families in the United States with a correlation coefficient (R) of 0.749 and weighted average of 7.9%. Similarly, the statistical analysis conducted on geographies consisting of 131,659,331 people shows a mild positive correlation between the proportion of Immigrants from Serbia and poverty level among families in the United States with a correlation coefficient (R) of 0.324 and weighted average of 7.7%, a difference of 2.0%.
Family Poverty Correlation Summary
| Measurement | Immigrants from North America | Immigrants from Serbia |
| Minimum | 2.3% | 0.76% |
| Maximum | 100.0% | 22.2% |
| Range | 97.7% | 21.5% |
| Mean | 18.1% | 6.8% |
| Median | 12.1% | 6.3% |
| Interquartile 25% (IQ1) | 6.9% | 4.3% |
| Interquartile 75% (IQ3) | 21.0% | 7.5% |
| Interquartile Range (IQR) | 14.2% | 3.2% |
| Standard Deviation (Sample) | 20.6% | 3.8% |
| Standard Deviation (Population) | 20.3% | 3.8% |
Similar Demographics by Family Poverty
Demographics Similar to Immigrants from North America by Family Poverty
In terms of family poverty, the demographic groups most similar to Immigrants from North America are Immigrants from Europe (7.9%, a difference of 0.080%), Immigrants from Latvia (7.9%, a difference of 0.12%), Ukrainian (7.9%, a difference of 0.12%), English (7.9%, a difference of 0.14%), and Irish (7.9%, a difference of 0.15%).
| Demographics | Rating | Rank | Family Poverty |
| Cambodians | 98.2 /100 | #71 | Exceptional 7.8% |
| Immigrants | Romania | 98.2 /100 | #72 | Exceptional 7.8% |
| Austrians | 98.2 /100 | #73 | Exceptional 7.8% |
| Immigrants | China | 98.1 /100 | #74 | Exceptional 7.8% |
| Immigrants | Croatia | 98.1 /100 | #75 | Exceptional 7.8% |
| Immigrants | Latvia | 98.0 /100 | #76 | Exceptional 7.9% |
| Ukrainians | 98.0 /100 | #77 | Exceptional 7.9% |
| Immigrants | North America | 97.9 /100 | #78 | Exceptional 7.9% |
| Immigrants | Europe | 97.8 /100 | #79 | Exceptional 7.9% |
| English | 97.8 /100 | #80 | Exceptional 7.9% |
| Irish | 97.8 /100 | #81 | Exceptional 7.9% |
| Immigrants | Poland | 97.8 /100 | #82 | Exceptional 7.9% |
| Slovaks | 97.7 /100 | #83 | Exceptional 7.9% |
| British | 97.5 /100 | #84 | Exceptional 7.9% |
| Immigrants | Asia | 97.4 /100 | #85 | Exceptional 7.9% |
Demographics Similar to Immigrants from Serbia by Family Poverty
In terms of family poverty, the demographic groups most similar to Immigrants from Serbia are Immigrants from Eastern Asia (7.7%, a difference of 0.040%), Immigrants from Sweden (7.7%, a difference of 0.070%), Swiss (7.7%, a difference of 0.080%), Asian (7.7%, a difference of 0.090%), and Finnish (7.7%, a difference of 0.12%).
| Demographics | Rating | Rank | Family Poverty |
| Immigrants | Bolivia | 98.9 /100 | #49 | Exceptional 7.7% |
| Immigrants | North Macedonia | 98.9 /100 | #50 | Exceptional 7.7% |
| Immigrants | Moldova | 98.8 /100 | #51 | Exceptional 7.7% |
| Indians (Asian) | 98.8 /100 | #52 | Exceptional 7.7% |
| Swiss | 98.8 /100 | #53 | Exceptional 7.7% |
| Immigrants | Sweden | 98.8 /100 | #54 | Exceptional 7.7% |
| Immigrants | Eastern Asia | 98.7 /100 | #55 | Exceptional 7.7% |
| Immigrants | Serbia | 98.7 /100 | #56 | Exceptional 7.7% |
| Asians | 98.7 /100 | #57 | Exceptional 7.7% |
| Finns | 98.7 /100 | #58 | Exceptional 7.7% |
| Europeans | 98.7 /100 | #59 | Exceptional 7.7% |
| Immigrants | Greece | 98.7 /100 | #60 | Exceptional 7.7% |
| Immigrants | Netherlands | 98.6 /100 | #61 | Exceptional 7.7% |
| Macedonians | 98.6 /100 | #62 | Exceptional 7.8% |
| Zimbabweans | 98.4 /100 | #63 | Exceptional 7.8% |