Burmese vs Immigrants from Pakistan Female Poverty Among 18-24 Year Olds
COMPARE
Burmese
Immigrants from Pakistan
Female Poverty Among 18-24 Year Olds
Female Poverty Among 18-24 Year Olds Comparison
Burmese
Immigrants from Pakistan
18.9%
FEMALE POVERTY AMONG 18-24 YEAR OLDS
99.2/ 100
METRIC RATING
84th/ 347
METRIC RANK
17.0%
FEMALE POVERTY AMONG 18-24 YEAR OLDS
100.0/ 100
METRIC RATING
12th/ 347
METRIC RANK
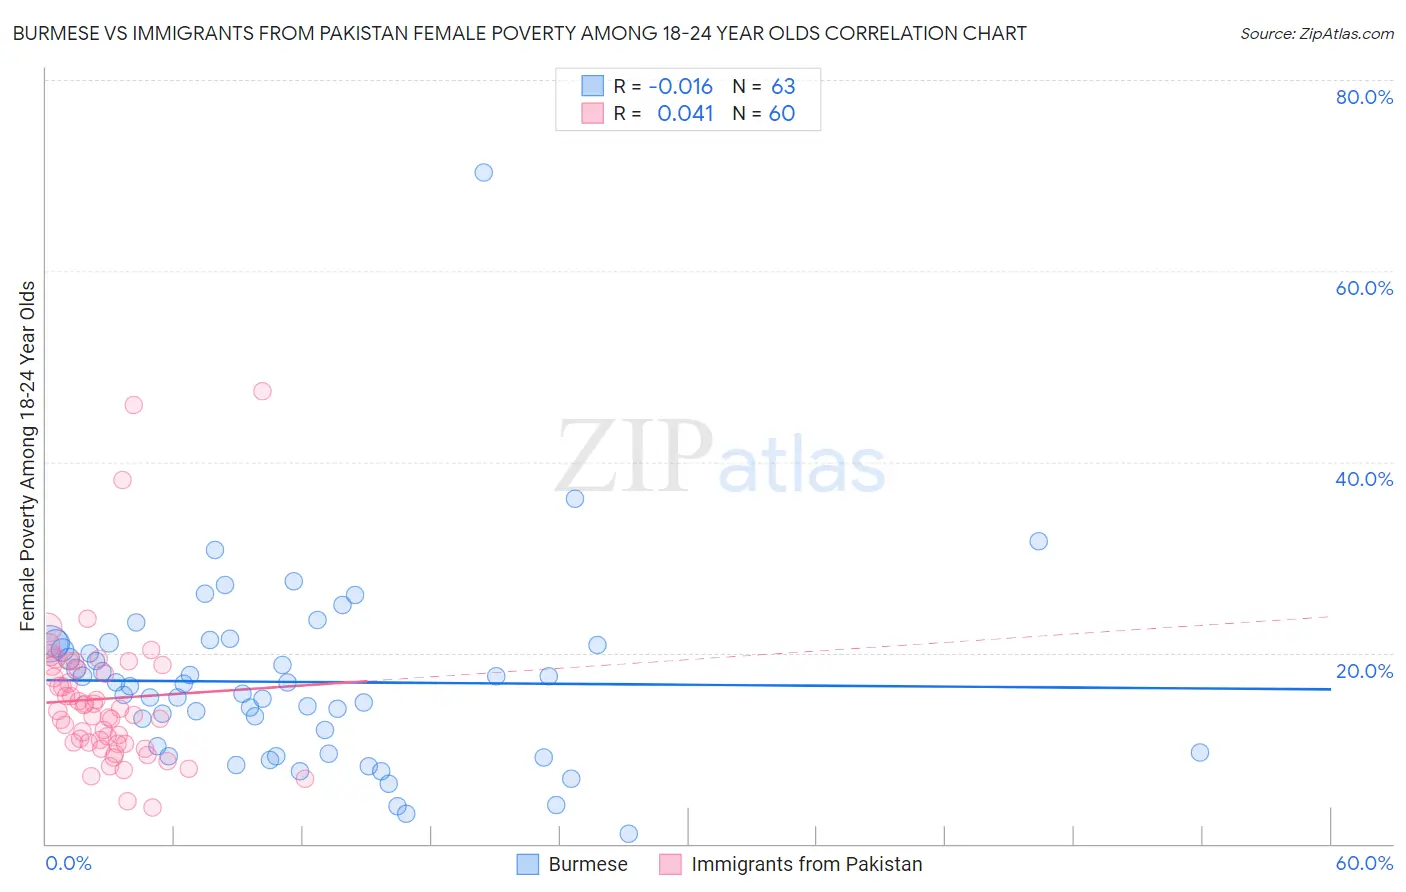
Burmese vs Immigrants from Pakistan Female Poverty Among 18-24 Year Olds Correlation Chart
The statistical analysis conducted on geographies consisting of 450,126,497 people shows no correlation between the proportion of Burmese and poverty level among females between the ages 18 and 24 in the United States with a correlation coefficient (R) of -0.016 and weighted average of 18.9%. Similarly, the statistical analysis conducted on geographies consisting of 279,566,412 people shows no correlation between the proportion of Immigrants from Pakistan and poverty level among females between the ages 18 and 24 in the United States with a correlation coefficient (R) of 0.041 and weighted average of 17.0%, a difference of 11.3%.
Female Poverty Among 18-24 Year Olds Correlation Summary
| Measurement | Burmese | Immigrants from Pakistan |
| Minimum | 0.99% | 3.8% |
| Maximum | 70.3% | 47.5% |
| Range | 69.3% | 43.6% |
| Mean | 16.9% | 15.2% |
| Median | 16.5% | 13.7% |
| Interquartile 25% (IQ1) | 9.5% | 10.5% |
| Interquartile 75% (IQ3) | 21.0% | 18.5% |
| Interquartile Range (IQR) | 11.5% | 7.9% |
| Standard Deviation (Sample) | 9.9% | 8.0% |
| Standard Deviation (Population) | 9.9% | 8.0% |
Similar Demographics by Female Poverty Among 18-24 Year Olds
Demographics Similar to Burmese by Female Poverty Among 18-24 Year Olds
In terms of female poverty among 18-24 year olds, the demographic groups most similar to Burmese are Immigrants from Armenia (18.9%, a difference of 0.030%), Immigrants from Iraq (18.9%, a difference of 0.11%), Immigrants from Jamaica (18.9%, a difference of 0.12%), Croatian (19.0%, a difference of 0.27%), and Immigrants from Indonesia (18.9%, a difference of 0.29%).
| Demographics | Rating | Rank | Female Poverty Among 18-24 Year Olds |
| Costa Ricans | 99.5 /100 | #77 | Exceptional 18.8% |
| Immigrants | Europe | 99.5 /100 | #78 | Exceptional 18.8% |
| Uruguayans | 99.5 /100 | #79 | Exceptional 18.8% |
| Palestinians | 99.5 /100 | #80 | Exceptional 18.8% |
| Japanese | 99.5 /100 | #81 | Exceptional 18.8% |
| Immigrants | Uruguay | 99.4 /100 | #82 | Exceptional 18.8% |
| Immigrants | Indonesia | 99.4 /100 | #83 | Exceptional 18.9% |
| Burmese | 99.2 /100 | #84 | Exceptional 18.9% |
| Immigrants | Armenia | 99.2 /100 | #85 | Exceptional 18.9% |
| Immigrants | Iraq | 99.2 /100 | #86 | Exceptional 18.9% |
| Immigrants | Jamaica | 99.2 /100 | #87 | Exceptional 18.9% |
| Croatians | 99.1 /100 | #88 | Exceptional 19.0% |
| Immigrants | Cabo Verde | 99.0 /100 | #89 | Exceptional 19.0% |
| Afghans | 99.0 /100 | #90 | Exceptional 19.0% |
| Romanians | 98.9 /100 | #91 | Exceptional 19.0% |
Demographics Similar to Immigrants from Pakistan by Female Poverty Among 18-24 Year Olds
In terms of female poverty among 18-24 year olds, the demographic groups most similar to Immigrants from Pakistan are Thai (17.0%, a difference of 0.090%), Korean (16.9%, a difference of 0.36%), Immigrants from Poland (17.1%, a difference of 0.66%), Immigrants from Peru (16.9%, a difference of 0.72%), and Tongan (17.1%, a difference of 0.83%).
| Demographics | Rating | Rank | Female Poverty Among 18-24 Year Olds |
| Immigrants | Portugal | 100.0 /100 | #5 | Exceptional 16.5% |
| Immigrants | Philippines | 100.0 /100 | #6 | Exceptional 16.7% |
| Immigrants | Azores | 100.0 /100 | #7 | Exceptional 16.7% |
| Immigrants | Bolivia | 100.0 /100 | #8 | Exceptional 16.7% |
| Immigrants | Peru | 100.0 /100 | #9 | Exceptional 16.9% |
| Koreans | 100.0 /100 | #10 | Exceptional 16.9% |
| Thais | 100.0 /100 | #11 | Exceptional 17.0% |
| Immigrants | Pakistan | 100.0 /100 | #12 | Exceptional 17.0% |
| Immigrants | Poland | 100.0 /100 | #13 | Exceptional 17.1% |
| Tongans | 100.0 /100 | #14 | Exceptional 17.1% |
| Cubans | 100.0 /100 | #15 | Exceptional 17.2% |
| Peruvians | 100.0 /100 | #16 | Exceptional 17.2% |
| Immigrants | Taiwan | 100.0 /100 | #17 | Exceptional 17.3% |
| Immigrants | Colombia | 100.0 /100 | #18 | Exceptional 17.3% |
| Immigrants | Lithuania | 100.0 /100 | #19 | Exceptional 17.4% |