German Russian vs Immigrants from Pakistan Female Poverty Among 18-24 Year Olds
COMPARE
German Russian
Immigrants from Pakistan
Female Poverty Among 18-24 Year Olds
Female Poverty Among 18-24 Year Olds Comparison
German Russians
Immigrants from Pakistan
25.2%
FEMALE POVERTY AMONG 18-24 YEAR OLDS
0.0/ 100
METRIC RATING
324th/ 347
METRIC RANK
17.0%
FEMALE POVERTY AMONG 18-24 YEAR OLDS
100.0/ 100
METRIC RATING
12th/ 347
METRIC RANK
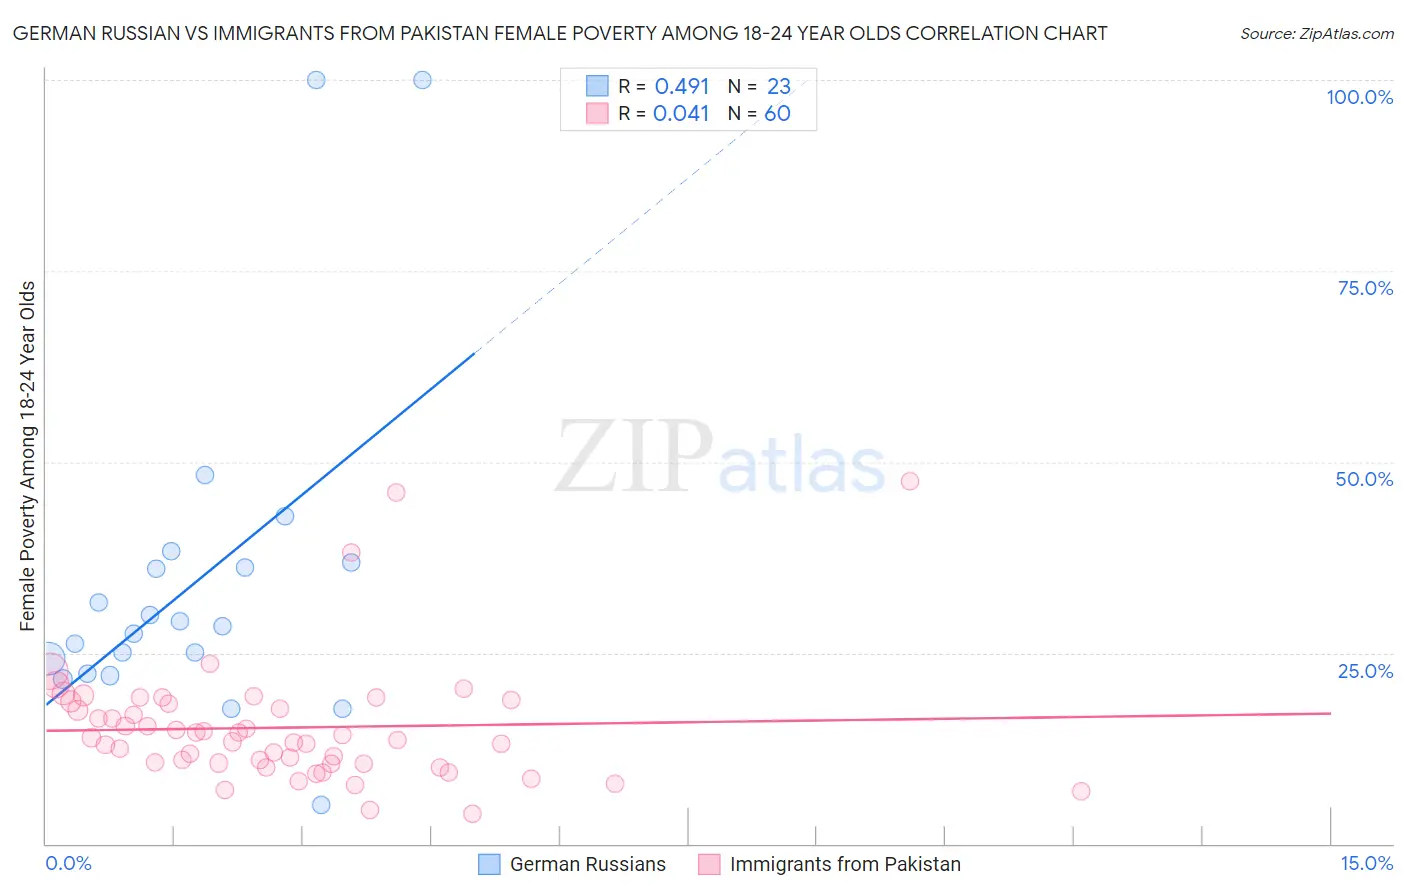
German Russian vs Immigrants from Pakistan Female Poverty Among 18-24 Year Olds Correlation Chart
The statistical analysis conducted on geographies consisting of 95,759,293 people shows a moderate positive correlation between the proportion of German Russians and poverty level among females between the ages 18 and 24 in the United States with a correlation coefficient (R) of 0.491 and weighted average of 25.2%. Similarly, the statistical analysis conducted on geographies consisting of 279,566,412 people shows no correlation between the proportion of Immigrants from Pakistan and poverty level among females between the ages 18 and 24 in the United States with a correlation coefficient (R) of 0.041 and weighted average of 17.0%, a difference of 48.2%.
Female Poverty Among 18-24 Year Olds Correlation Summary
| Measurement | German Russian | Immigrants from Pakistan |
| Minimum | 5.0% | 3.8% |
| Maximum | 100.0% | 47.5% |
| Range | 95.0% | 43.6% |
| Mean | 34.4% | 15.2% |
| Median | 28.4% | 13.7% |
| Interquartile 25% (IQ1) | 22.3% | 10.5% |
| Interquartile 75% (IQ3) | 36.9% | 18.5% |
| Interquartile Range (IQR) | 14.6% | 7.9% |
| Standard Deviation (Sample) | 22.6% | 8.0% |
| Standard Deviation (Population) | 22.1% | 8.0% |
Similar Demographics by Female Poverty Among 18-24 Year Olds
Demographics Similar to German Russians by Female Poverty Among 18-24 Year Olds
In terms of female poverty among 18-24 year olds, the demographic groups most similar to German Russians are Arapaho (25.2%, a difference of 0.030%), Somali (25.1%, a difference of 0.10%), Immigrants from Zaire (25.1%, a difference of 0.40%), Immigrants from Saudi Arabia (25.3%, a difference of 0.43%), and Yakama (25.3%, a difference of 0.68%).
| Demographics | Rating | Rank | Female Poverty Among 18-24 Year Olds |
| Osage | 0.0 /100 | #317 | Tragic 24.5% |
| Chickasaw | 0.0 /100 | #318 | Tragic 24.5% |
| Dutch West Indians | 0.0 /100 | #319 | Tragic 24.5% |
| Immigrants | Congo | 0.0 /100 | #320 | Tragic 24.6% |
| Immigrants | Zaire | 0.0 /100 | #321 | Tragic 25.1% |
| Somalis | 0.0 /100 | #322 | Tragic 25.1% |
| Arapaho | 0.0 /100 | #323 | Tragic 25.2% |
| German Russians | 0.0 /100 | #324 | Tragic 25.2% |
| Immigrants | Saudi Arabia | 0.0 /100 | #325 | Tragic 25.3% |
| Yakama | 0.0 /100 | #326 | Tragic 25.3% |
| Ute | 0.0 /100 | #327 | Tragic 25.4% |
| Natives/Alaskans | 0.0 /100 | #328 | Tragic 25.4% |
| Cajuns | 0.0 /100 | #329 | Tragic 25.7% |
| Immigrants | Somalia | 0.0 /100 | #330 | Tragic 25.7% |
| Chippewa | 0.0 /100 | #331 | Tragic 25.9% |
Demographics Similar to Immigrants from Pakistan by Female Poverty Among 18-24 Year Olds
In terms of female poverty among 18-24 year olds, the demographic groups most similar to Immigrants from Pakistan are Thai (17.0%, a difference of 0.090%), Korean (16.9%, a difference of 0.36%), Immigrants from Poland (17.1%, a difference of 0.66%), Immigrants from Peru (16.9%, a difference of 0.72%), and Tongan (17.1%, a difference of 0.83%).
| Demographics | Rating | Rank | Female Poverty Among 18-24 Year Olds |
| Immigrants | Portugal | 100.0 /100 | #5 | Exceptional 16.5% |
| Immigrants | Philippines | 100.0 /100 | #6 | Exceptional 16.7% |
| Immigrants | Azores | 100.0 /100 | #7 | Exceptional 16.7% |
| Immigrants | Bolivia | 100.0 /100 | #8 | Exceptional 16.7% |
| Immigrants | Peru | 100.0 /100 | #9 | Exceptional 16.9% |
| Koreans | 100.0 /100 | #10 | Exceptional 16.9% |
| Thais | 100.0 /100 | #11 | Exceptional 17.0% |
| Immigrants | Pakistan | 100.0 /100 | #12 | Exceptional 17.0% |
| Immigrants | Poland | 100.0 /100 | #13 | Exceptional 17.1% |
| Tongans | 100.0 /100 | #14 | Exceptional 17.1% |
| Cubans | 100.0 /100 | #15 | Exceptional 17.2% |
| Peruvians | 100.0 /100 | #16 | Exceptional 17.2% |
| Immigrants | Taiwan | 100.0 /100 | #17 | Exceptional 17.3% |
| Immigrants | Colombia | 100.0 /100 | #18 | Exceptional 17.3% |
| Immigrants | Lithuania | 100.0 /100 | #19 | Exceptional 17.4% |