British West Indian vs Zimbabwean Seniors Poverty Over the Age of 75
COMPARE
British West Indian
Zimbabwean
Seniors Poverty Over the Age of 75
Seniors Poverty Over the Age of 75 Comparison
British West Indians
Zimbabweans
17.4%
SENIORS POVERTY OVER THE AGE OF 75
0.0/ 100
METRIC RATING
330th/ 347
METRIC RANK
11.2%
SENIORS POVERTY OVER THE AGE OF 75
98.5/ 100
METRIC RATING
52nd/ 347
METRIC RANK
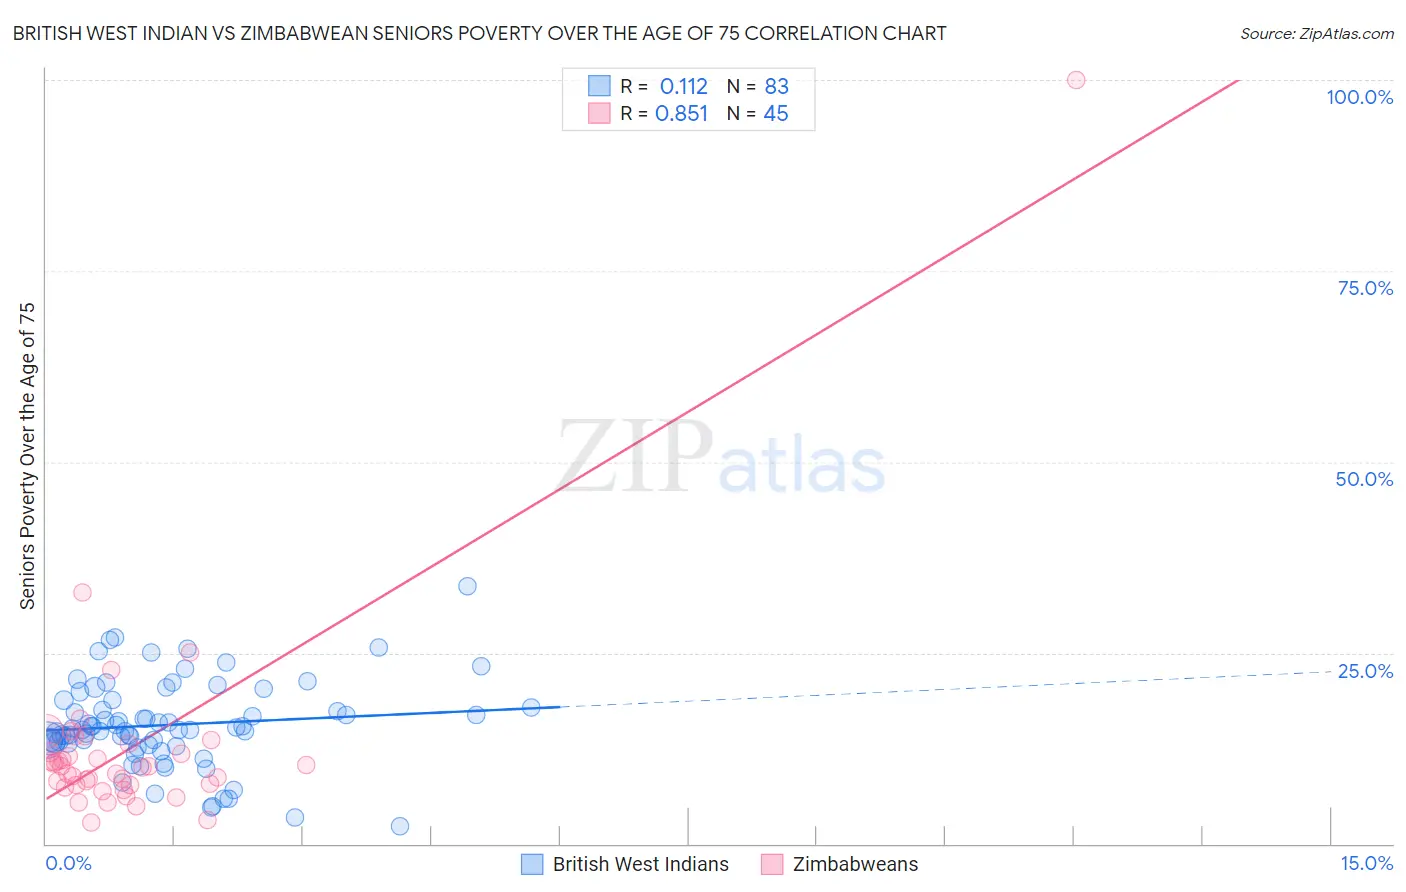
British West Indian vs Zimbabwean Seniors Poverty Over the Age of 75 Correlation Chart
The statistical analysis conducted on geographies consisting of 151,930,875 people shows a poor positive correlation between the proportion of British West Indians and poverty level among seniors over the age of 75 in the United States with a correlation coefficient (R) of 0.112 and weighted average of 17.4%. Similarly, the statistical analysis conducted on geographies consisting of 68,929,819 people shows a very strong positive correlation between the proportion of Zimbabweans and poverty level among seniors over the age of 75 in the United States with a correlation coefficient (R) of 0.851 and weighted average of 11.2%, a difference of 56.1%.
Seniors Poverty Over the Age of 75 Correlation Summary
| Measurement | British West Indian | Zimbabwean |
| Minimum | 2.3% | 2.7% |
| Maximum | 33.8% | 100.0% |
| Range | 31.5% | 97.3% |
| Mean | 15.6% | 12.7% |
| Median | 14.9% | 10.2% |
| Interquartile 25% (IQ1) | 13.2% | 7.6% |
| Interquartile 75% (IQ3) | 18.8% | 12.5% |
| Interquartile Range (IQR) | 5.7% | 4.9% |
| Standard Deviation (Sample) | 5.7% | 14.4% |
| Standard Deviation (Population) | 5.7% | 14.2% |
Similar Demographics by Seniors Poverty Over the Age of 75
Demographics Similar to British West Indians by Seniors Poverty Over the Age of 75
In terms of seniors poverty over the age of 75, the demographic groups most similar to British West Indians are Immigrants from Armenia (17.5%, a difference of 0.26%), Immigrants from St. Vincent and the Grenadines (17.5%, a difference of 0.52%), Immigrants from Nicaragua (17.6%, a difference of 0.99%), Immigrants from Dominica (17.0%, a difference of 2.4%), and Immigrants from Grenada (17.8%, a difference of 2.5%).
| Demographics | Rating | Rank | Seniors Poverty Over the Age of 75 |
| Central American Indians | 0.0 /100 | #323 | Tragic 16.5% |
| Immigrants | Uzbekistan | 0.0 /100 | #324 | Tragic 16.5% |
| Nicaraguans | 0.0 /100 | #325 | Tragic 16.6% |
| Pueblo | 0.0 /100 | #326 | Tragic 16.7% |
| Sioux | 0.0 /100 | #327 | Tragic 16.8% |
| Cape Verdeans | 0.0 /100 | #328 | Tragic 16.8% |
| Immigrants | Dominica | 0.0 /100 | #329 | Tragic 17.0% |
| British West Indians | 0.0 /100 | #330 | Tragic 17.4% |
| Immigrants | Armenia | 0.0 /100 | #331 | Tragic 17.5% |
| Immigrants | St. Vincent and the Grenadines | 0.0 /100 | #332 | Tragic 17.5% |
| Immigrants | Nicaragua | 0.0 /100 | #333 | Tragic 17.6% |
| Immigrants | Grenada | 0.0 /100 | #334 | Tragic 17.8% |
| Cubans | 0.0 /100 | #335 | Tragic 18.0% |
| Immigrants | Caribbean | 0.0 /100 | #336 | Tragic 18.2% |
| Yakama | 0.0 /100 | #337 | Tragic 18.3% |
Demographics Similar to Zimbabweans by Seniors Poverty Over the Age of 75
In terms of seniors poverty over the age of 75, the demographic groups most similar to Zimbabweans are Immigrants from England (11.2%, a difference of 0.070%), Immigrants from North Macedonia (11.1%, a difference of 0.16%), Serbian (11.1%, a difference of 0.18%), Samoan (11.1%, a difference of 0.29%), and Afghan (11.2%, a difference of 0.38%).
| Demographics | Rating | Rank | Seniors Poverty Over the Age of 75 |
| Carpatho Rusyns | 99.0 /100 | #45 | Exceptional 11.1% |
| Greeks | 99.0 /100 | #46 | Exceptional 11.1% |
| Hawaiians | 98.8 /100 | #47 | Exceptional 11.1% |
| French | 98.7 /100 | #48 | Exceptional 11.1% |
| Samoans | 98.7 /100 | #49 | Exceptional 11.1% |
| Serbians | 98.6 /100 | #50 | Exceptional 11.1% |
| Immigrants | North Macedonia | 98.6 /100 | #51 | Exceptional 11.1% |
| Zimbabweans | 98.5 /100 | #52 | Exceptional 11.2% |
| Immigrants | England | 98.4 /100 | #53 | Exceptional 11.2% |
| Afghans | 98.2 /100 | #54 | Exceptional 11.2% |
| Hungarians | 98.1 /100 | #55 | Exceptional 11.2% |
| Slavs | 98.1 /100 | #56 | Exceptional 11.2% |
| Immigrants | Canada | 97.9 /100 | #57 | Exceptional 11.2% |
| Yugoslavians | 97.9 /100 | #58 | Exceptional 11.2% |
| Immigrants | Netherlands | 97.8 /100 | #59 | Exceptional 11.2% |