Immigrants from the Azores vs Zimbabwean Seniors Poverty Over the Age of 75
COMPARE
Immigrants from the Azores
Zimbabwean
Seniors Poverty Over the Age of 75
Seniors Poverty Over the Age of 75 Comparison
Immigrants from the Azores
Zimbabweans
15.2%
SENIORS POVERTY OVER THE AGE OF 75
0.0/ 100
METRIC RATING
290th/ 347
METRIC RANK
11.2%
SENIORS POVERTY OVER THE AGE OF 75
98.5/ 100
METRIC RATING
52nd/ 347
METRIC RANK
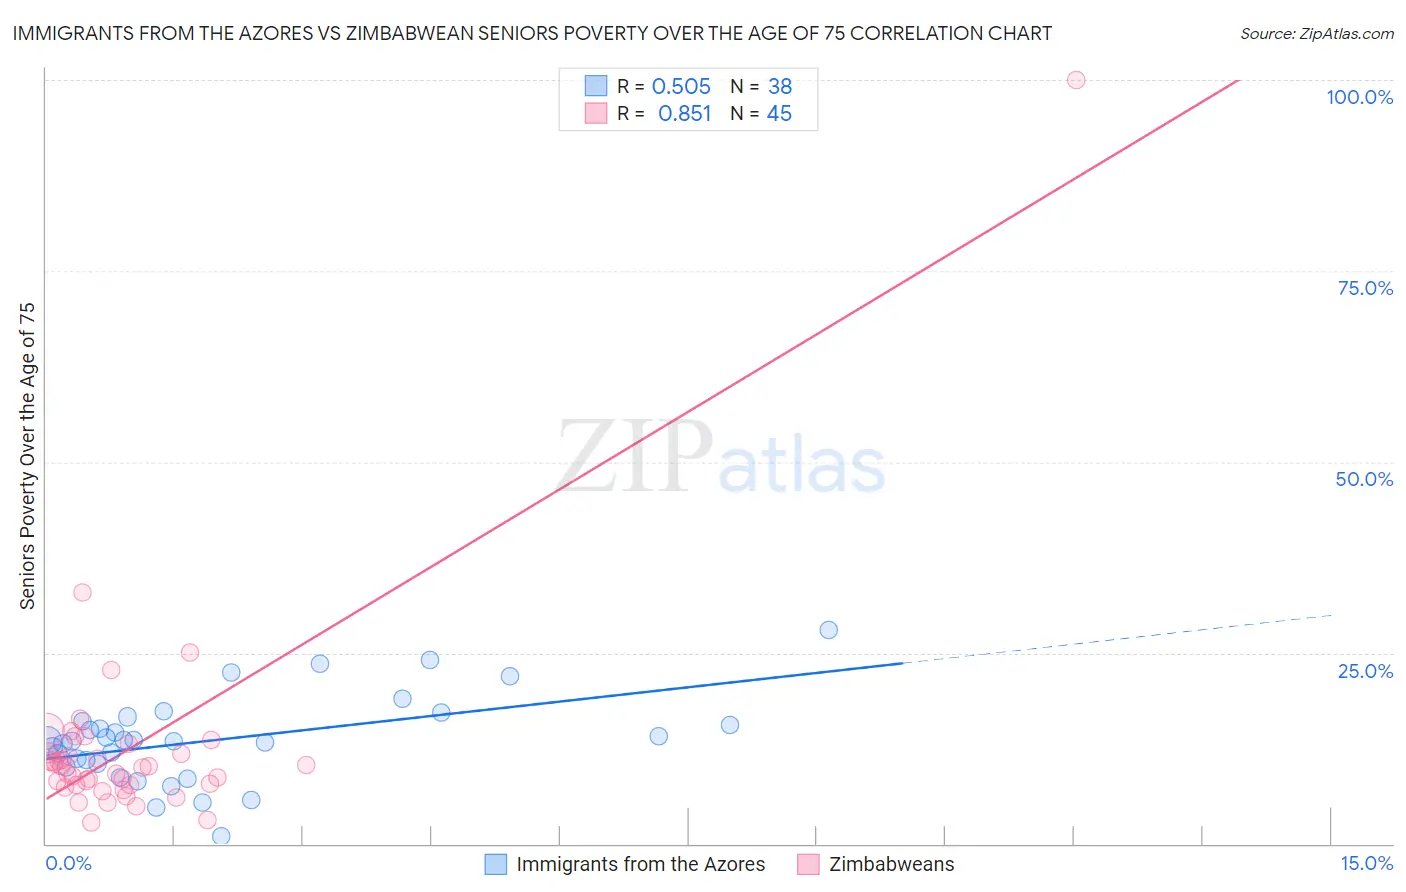
Immigrants from the Azores vs Zimbabwean Seniors Poverty Over the Age of 75 Correlation Chart
The statistical analysis conducted on geographies consisting of 46,090,908 people shows a substantial positive correlation between the proportion of Immigrants from the Azores and poverty level among seniors over the age of 75 in the United States with a correlation coefficient (R) of 0.505 and weighted average of 15.2%. Similarly, the statistical analysis conducted on geographies consisting of 68,929,819 people shows a very strong positive correlation between the proportion of Zimbabweans and poverty level among seniors over the age of 75 in the United States with a correlation coefficient (R) of 0.851 and weighted average of 11.2%, a difference of 36.1%.
Seniors Poverty Over the Age of 75 Correlation Summary
| Measurement | Immigrants from the Azores | Zimbabwean |
| Minimum | 0.91% | 2.7% |
| Maximum | 28.0% | 100.0% |
| Range | 27.1% | 97.3% |
| Mean | 13.6% | 12.7% |
| Median | 13.4% | 10.2% |
| Interquartile 25% (IQ1) | 10.5% | 7.6% |
| Interquartile 75% (IQ3) | 16.0% | 12.5% |
| Interquartile Range (IQR) | 5.5% | 4.9% |
| Standard Deviation (Sample) | 5.6% | 14.4% |
| Standard Deviation (Population) | 5.6% | 14.2% |
Similar Demographics by Seniors Poverty Over the Age of 75
Demographics Similar to Immigrants from the Azores by Seniors Poverty Over the Age of 75
In terms of seniors poverty over the age of 75, the demographic groups most similar to Immigrants from the Azores are Immigrants from Belize (15.2%, a difference of 0.020%), Paiute (15.2%, a difference of 0.020%), Colville (15.2%, a difference of 0.20%), Jamaican (15.1%, a difference of 0.28%), and Apache (15.3%, a difference of 0.60%).
| Demographics | Rating | Rank | Seniors Poverty Over the Age of 75 |
| Guatemalans | 0.0 /100 | #283 | Tragic 14.8% |
| Cheyenne | 0.0 /100 | #284 | Tragic 14.9% |
| Immigrants | Mexico | 0.0 /100 | #285 | Tragic 14.9% |
| Immigrants | Central America | 0.0 /100 | #286 | Tragic 15.0% |
| Immigrants | Guatemala | 0.0 /100 | #287 | Tragic 15.1% |
| Jamaicans | 0.0 /100 | #288 | Tragic 15.1% |
| Immigrants | Belize | 0.0 /100 | #289 | Tragic 15.2% |
| Immigrants | Azores | 0.0 /100 | #290 | Tragic 15.2% |
| Paiute | 0.0 /100 | #291 | Tragic 15.2% |
| Colville | 0.0 /100 | #292 | Tragic 15.2% |
| Apache | 0.0 /100 | #293 | Tragic 15.3% |
| Immigrants | Jamaica | 0.0 /100 | #294 | Tragic 15.3% |
| U.S. Virgin Islanders | 0.0 /100 | #295 | Tragic 15.4% |
| Yuman | 0.0 /100 | #296 | Tragic 15.4% |
| Hondurans | 0.0 /100 | #297 | Tragic 15.4% |
Demographics Similar to Zimbabweans by Seniors Poverty Over the Age of 75
In terms of seniors poverty over the age of 75, the demographic groups most similar to Zimbabweans are Immigrants from England (11.2%, a difference of 0.070%), Immigrants from North Macedonia (11.1%, a difference of 0.16%), Serbian (11.1%, a difference of 0.18%), Samoan (11.1%, a difference of 0.29%), and Afghan (11.2%, a difference of 0.38%).
| Demographics | Rating | Rank | Seniors Poverty Over the Age of 75 |
| Carpatho Rusyns | 99.0 /100 | #45 | Exceptional 11.1% |
| Greeks | 99.0 /100 | #46 | Exceptional 11.1% |
| Hawaiians | 98.8 /100 | #47 | Exceptional 11.1% |
| French | 98.7 /100 | #48 | Exceptional 11.1% |
| Samoans | 98.7 /100 | #49 | Exceptional 11.1% |
| Serbians | 98.6 /100 | #50 | Exceptional 11.1% |
| Immigrants | North Macedonia | 98.6 /100 | #51 | Exceptional 11.1% |
| Zimbabweans | 98.5 /100 | #52 | Exceptional 11.2% |
| Immigrants | England | 98.4 /100 | #53 | Exceptional 11.2% |
| Afghans | 98.2 /100 | #54 | Exceptional 11.2% |
| Hungarians | 98.1 /100 | #55 | Exceptional 11.2% |
| Slavs | 98.1 /100 | #56 | Exceptional 11.2% |
| Immigrants | Canada | 97.9 /100 | #57 | Exceptional 11.2% |
| Yugoslavians | 97.9 /100 | #58 | Exceptional 11.2% |
| Immigrants | Netherlands | 97.8 /100 | #59 | Exceptional 11.2% |