British West Indian vs Zimbabwean Average Family Size
COMPARE
British West Indian
Zimbabwean
Average Family Size
Average Family Size Comparison
British West Indians
Zimbabweans
3.32
AVERAGE FAMILY SIZE
99.8/ 100
METRIC RATING
79th/ 347
METRIC RANK
3.20
AVERAGE FAMILY SIZE
12.6/ 100
METRIC RATING
210th/ 347
METRIC RANK
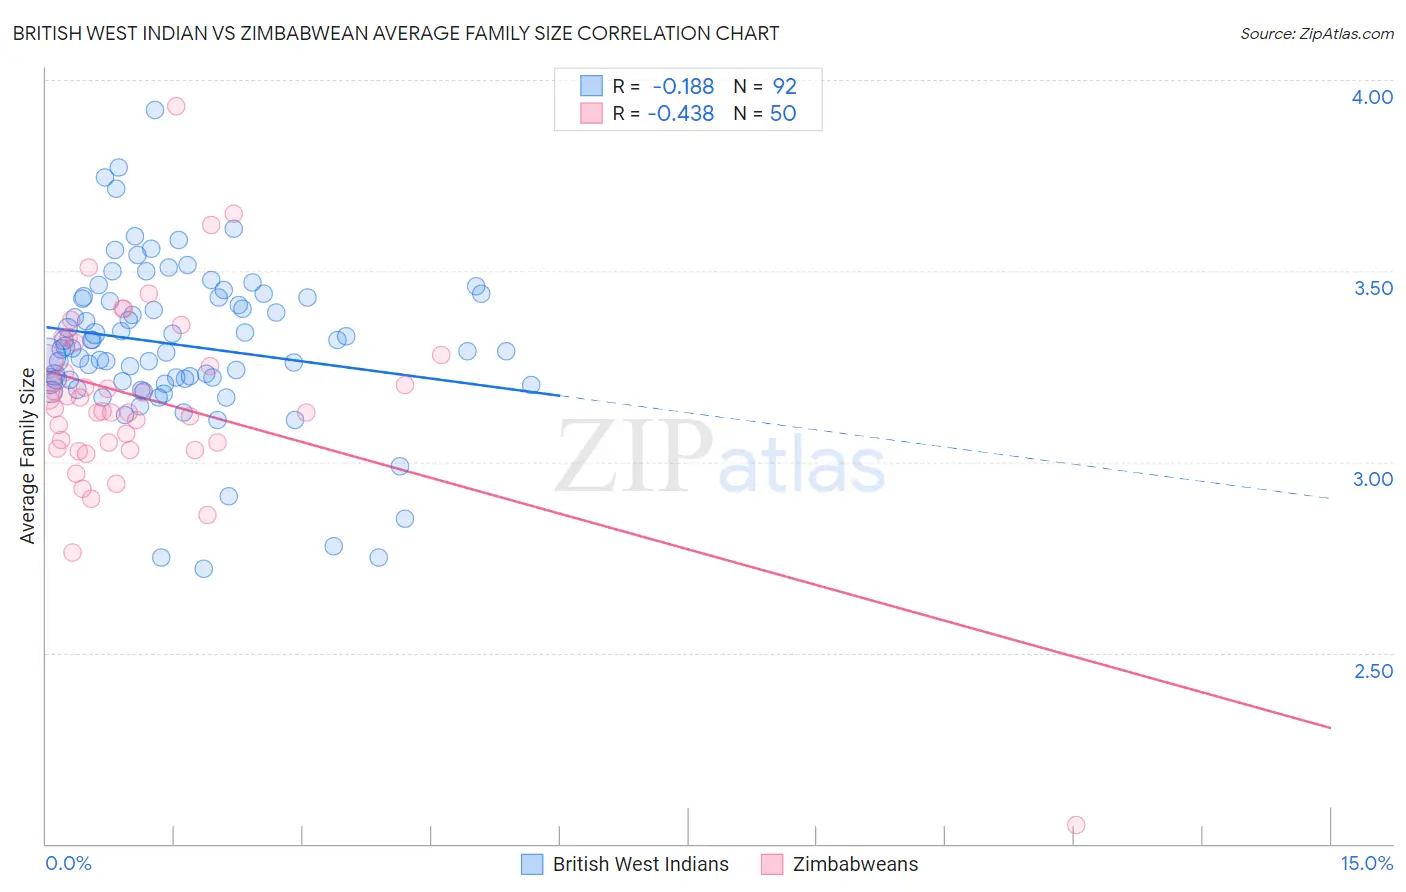
British West Indian vs Zimbabwean Average Family Size Correlation Chart
The statistical analysis conducted on geographies consisting of 152,638,321 people shows a poor negative correlation between the proportion of British West Indians and average family size in the United States with a correlation coefficient (R) of -0.188 and weighted average of 3.32. Similarly, the statistical analysis conducted on geographies consisting of 69,189,771 people shows a moderate negative correlation between the proportion of Zimbabweans and average family size in the United States with a correlation coefficient (R) of -0.438 and weighted average of 3.20, a difference of 3.8%.
Average Family Size Correlation Summary
| Measurement | British West Indian | Zimbabwean |
| Minimum | 2.72 | 2.05 |
| Maximum | 3.92 | 3.93 |
| Range | 1.20 | 1.88 |
| Mean | 3.31 | 3.16 |
| Median | 3.30 | 3.15 |
| Interquartile 25% (IQ1) | 3.21 | 3.05 |
| Interquartile 75% (IQ3) | 3.43 | 3.28 |
| Interquartile Range (IQR) | 0.22 | 0.23 |
| Standard Deviation (Sample) | 0.21 | 0.26 |
| Standard Deviation (Population) | 0.21 | 0.26 |
Similar Demographics by Average Family Size
Demographics Similar to British West Indians by Average Family Size
In terms of average family size, the demographic groups most similar to British West Indians are Immigrants from Micronesia (3.32, a difference of 0.010%), Lumbee (3.32, a difference of 0.020%), Immigrants from Ecuador (3.32, a difference of 0.050%), Trinidadian and Tobagonian (3.32, a difference of 0.060%), and Immigrants from Dominica (3.32, a difference of 0.060%).
| Demographics | Rating | Rank | Average Family Size |
| Immigrants | Caribbean | 99.9 /100 | #72 | Exceptional 3.33 |
| Yaqui | 99.9 /100 | #73 | Exceptional 3.32 |
| Immigrants | Sierra Leone | 99.9 /100 | #74 | Exceptional 3.32 |
| Immigrants | Barbados | 99.8 /100 | #75 | Exceptional 3.32 |
| Trinidadians and Tobagonians | 99.8 /100 | #76 | Exceptional 3.32 |
| Immigrants | Ecuador | 99.8 /100 | #77 | Exceptional 3.32 |
| Immigrants | Micronesia | 99.8 /100 | #78 | Exceptional 3.32 |
| British West Indians | 99.8 /100 | #79 | Exceptional 3.32 |
| Lumbee | 99.8 /100 | #80 | Exceptional 3.32 |
| Immigrants | Dominica | 99.8 /100 | #81 | Exceptional 3.32 |
| Ecuadorians | 99.8 /100 | #82 | Exceptional 3.32 |
| Immigrants | Afghanistan | 99.8 /100 | #83 | Exceptional 3.32 |
| Immigrants | Nigeria | 99.7 /100 | #84 | Exceptional 3.32 |
| Afghans | 99.7 /100 | #85 | Exceptional 3.31 |
| Jamaicans | 99.7 /100 | #86 | Exceptional 3.31 |
Demographics Similar to Zimbabweans by Average Family Size
In terms of average family size, the demographic groups most similar to Zimbabweans are Immigrants from Iran (3.20, a difference of 0.020%), Creek (3.20, a difference of 0.020%), Chippewa (3.20, a difference of 0.030%), Sudanese (3.20, a difference of 0.030%), and Filipino (3.20, a difference of 0.040%).
| Demographics | Rating | Rank | Average Family Size |
| Immigrants | Nepal | 18.1 /100 | #203 | Poor 3.21 |
| Immigrants | Poland | 16.6 /100 | #204 | Poor 3.20 |
| Paraguayans | 16.3 /100 | #205 | Poor 3.20 |
| Immigrants | Cabo Verde | 16.0 /100 | #206 | Poor 3.20 |
| Filipinos | 13.6 /100 | #207 | Poor 3.20 |
| Chippewa | 13.3 /100 | #208 | Poor 3.20 |
| Sudanese | 13.3 /100 | #209 | Poor 3.20 |
| Zimbabweans | 12.6 /100 | #210 | Poor 3.20 |
| Immigrants | Iran | 12.1 /100 | #211 | Poor 3.20 |
| Creek | 12.1 /100 | #212 | Poor 3.20 |
| Mongolians | 11.5 /100 | #213 | Poor 3.20 |
| Somalis | 11.2 /100 | #214 | Poor 3.20 |
| Delaware | 11.1 /100 | #215 | Poor 3.20 |
| Bermudans | 11.0 /100 | #216 | Poor 3.20 |
| Immigrants | Somalia | 10.3 /100 | #217 | Poor 3.20 |