Blackfeet vs Creek Male Poverty
COMPARE
Blackfeet
Creek
Male Poverty
Male Poverty Comparison
Blackfeet
Creek
14.0%
MALE POVERTY
0.0/ 100
METRIC RATING
298th/ 347
METRIC RANK
14.1%
MALE POVERTY
0.0/ 100
METRIC RATING
306th/ 347
METRIC RANK
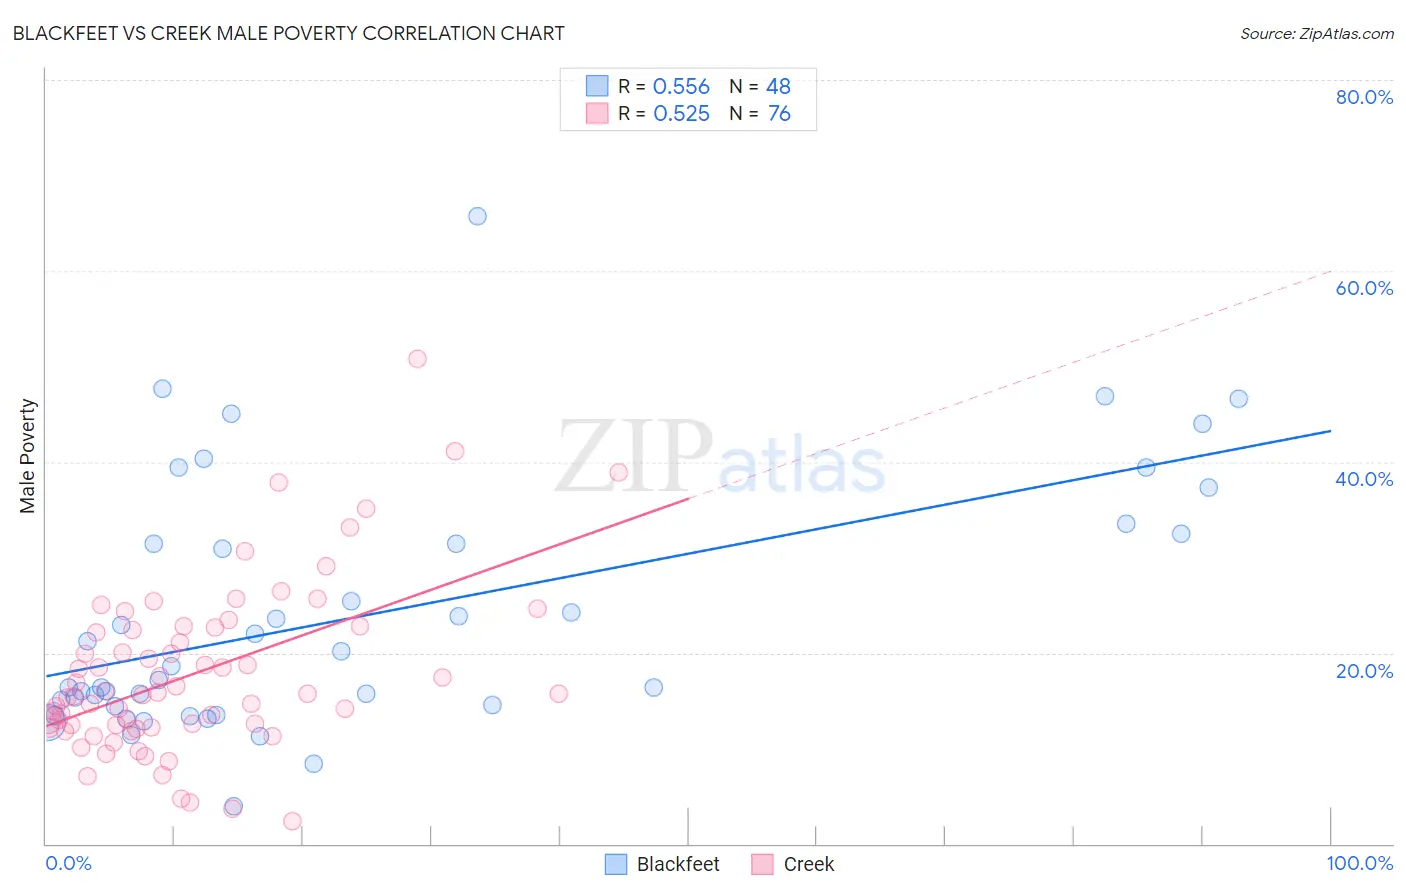
Blackfeet vs Creek Male Poverty Correlation Chart
The statistical analysis conducted on geographies consisting of 309,436,017 people shows a substantial positive correlation between the proportion of Blackfeet and poverty level among males in the United States with a correlation coefficient (R) of 0.556 and weighted average of 14.0%. Similarly, the statistical analysis conducted on geographies consisting of 178,404,623 people shows a substantial positive correlation between the proportion of Creek and poverty level among males in the United States with a correlation coefficient (R) of 0.525 and weighted average of 14.1%, a difference of 0.77%.
Male Poverty Correlation Summary
| Measurement | Blackfeet | Creek |
| Minimum | 3.9% | 2.3% |
| Maximum | 65.7% | 50.8% |
| Range | 61.8% | 48.5% |
| Mean | 23.9% | 17.8% |
| Median | 17.9% | 15.7% |
| Interquartile 25% (IQ1) | 14.4% | 12.3% |
| Interquartile 75% (IQ3) | 31.9% | 22.5% |
| Interquartile Range (IQR) | 17.5% | 10.2% |
| Standard Deviation (Sample) | 13.2% | 8.9% |
| Standard Deviation (Population) | 13.0% | 8.8% |
Demographics Similar to Blackfeet and Creek by Male Poverty
In terms of male poverty, the demographic groups most similar to Blackfeet are Inupiat (14.0%, a difference of 0.030%), Immigrants from Guatemala (14.0%, a difference of 0.10%), Immigrants from Mexico (14.0%, a difference of 0.22%), Immigrants from Senegal (14.0%, a difference of 0.29%), and Immigrants from Caribbean (14.0%, a difference of 0.34%). Similarly, the demographic groups most similar to Creek are Immigrants from Bangladesh (14.1%, a difference of 0.070%), Senegalese (14.1%, a difference of 0.29%), Bahamian (14.1%, a difference of 0.39%), Immigrants from Caribbean (14.0%, a difference of 0.43%), and Immigrants from Senegal (14.0%, a difference of 0.49%).
| Demographics | Rating | Rank | Male Poverty |
| Indonesians | 0.0 /100 | #292 | Tragic 13.8% |
| Immigrants | Belize | 0.0 /100 | #293 | Tragic 13.8% |
| Hispanics or Latinos | 0.0 /100 | #294 | Tragic 13.9% |
| Immigrants | Central America | 0.0 /100 | #295 | Tragic 13.9% |
| Cajuns | 0.0 /100 | #296 | Tragic 13.9% |
| Inupiat | 0.0 /100 | #297 | Tragic 14.0% |
| Blackfeet | 0.0 /100 | #298 | Tragic 14.0% |
| Immigrants | Guatemala | 0.0 /100 | #299 | Tragic 14.0% |
| Immigrants | Mexico | 0.0 /100 | #300 | Tragic 14.0% |
| Immigrants | Senegal | 0.0 /100 | #301 | Tragic 14.0% |
| Immigrants | Caribbean | 0.0 /100 | #302 | Tragic 14.0% |
| Bahamians | 0.0 /100 | #303 | Tragic 14.1% |
| Senegalese | 0.0 /100 | #304 | Tragic 14.1% |
| Immigrants | Bangladesh | 0.0 /100 | #305 | Tragic 14.1% |
| Creek | 0.0 /100 | #306 | Tragic 14.1% |
| Dutch West Indians | 0.0 /100 | #307 | Tragic 14.2% |
| Africans | 0.0 /100 | #308 | Tragic 14.2% |
| Somalis | 0.0 /100 | #309 | Tragic 14.3% |
| Seminole | 0.0 /100 | #310 | Tragic 14.3% |
| Hondurans | 0.0 /100 | #311 | Tragic 14.3% |
| Choctaw | 0.0 /100 | #312 | Tragic 14.4% |