Serbian vs Arapaho Family Poverty
COMPARE
Serbian
Arapaho
Family Poverty
Family Poverty Comparison
Serbians
Arapaho
8.0%
FAMILY POVERTY
97.2/ 100
METRIC RATING
88th/ 347
METRIC RANK
12.7%
FAMILY POVERTY
0.0/ 100
METRIC RATING
321st/ 347
METRIC RANK
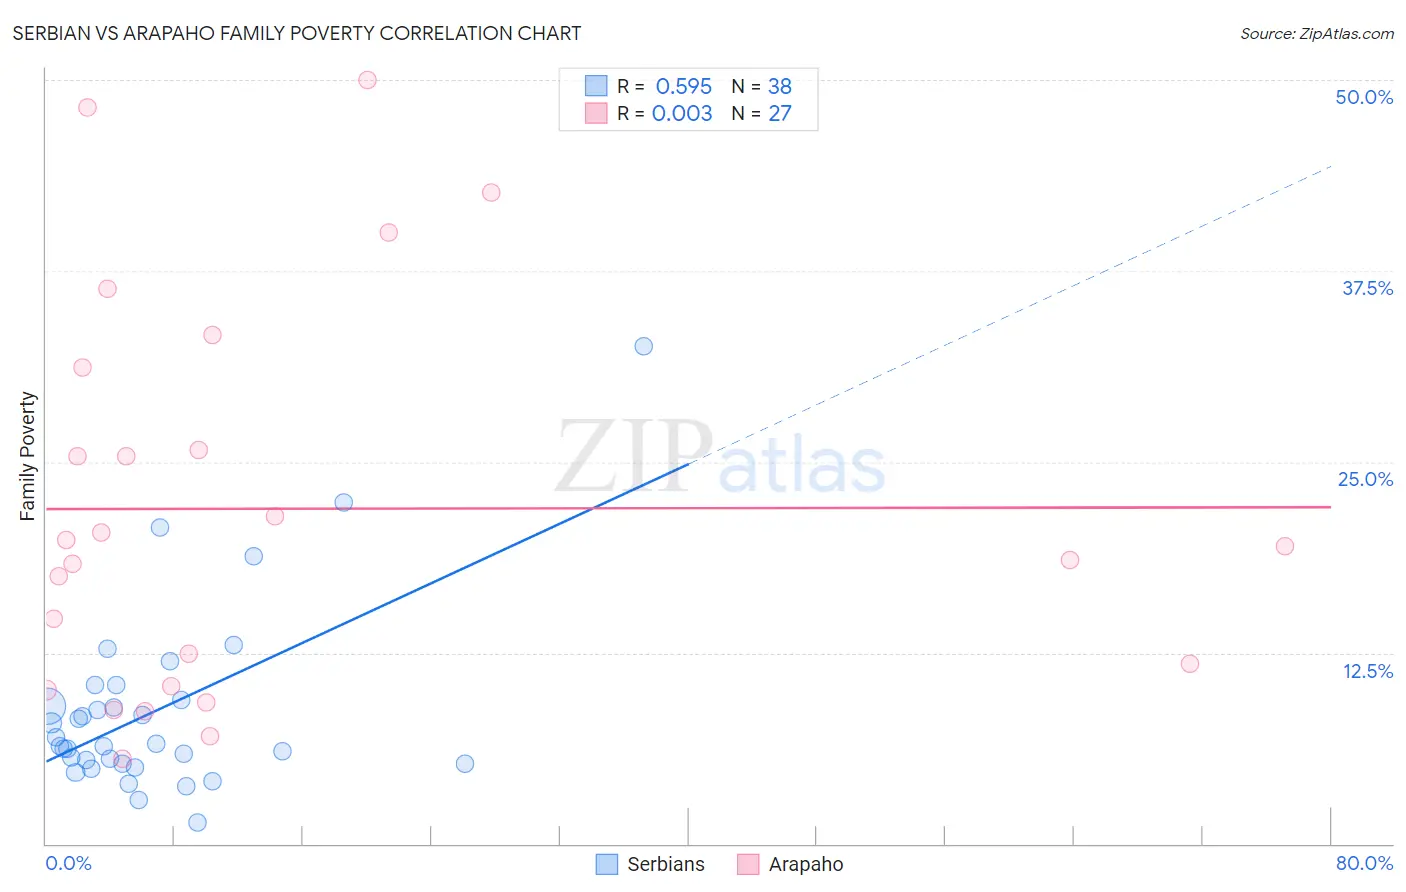
Serbian vs Arapaho Family Poverty Correlation Chart
The statistical analysis conducted on geographies consisting of 267,119,010 people shows a substantial positive correlation between the proportion of Serbians and poverty level among families in the United States with a correlation coefficient (R) of 0.595 and weighted average of 8.0%. Similarly, the statistical analysis conducted on geographies consisting of 29,764,504 people shows no correlation between the proportion of Arapaho and poverty level among families in the United States with a correlation coefficient (R) of 0.003 and weighted average of 12.7%, a difference of 59.0%.
Family Poverty Correlation Summary
| Measurement | Serbian | Arapaho |
| Minimum | 1.4% | 5.6% |
| Maximum | 32.6% | 50.0% |
| Range | 31.2% | 44.4% |
| Mean | 8.7% | 21.9% |
| Median | 6.5% | 19.5% |
| Interquartile 25% (IQ1) | 5.3% | 10.3% |
| Interquartile 75% (IQ3) | 9.4% | 31.2% |
| Interquartile Range (IQR) | 4.1% | 20.8% |
| Standard Deviation (Sample) | 6.1% | 12.8% |
| Standard Deviation (Population) | 6.0% | 12.6% |
Similar Demographics by Family Poverty
Demographics Similar to Serbians by Family Poverty
In terms of family poverty, the demographic groups most similar to Serbians are Belgian (8.0%, a difference of 0.070%), Scottish (7.9%, a difference of 0.15%), Immigrants from Denmark (8.0%, a difference of 0.15%), Immigrants from England (8.0%, a difference of 0.15%), and Immigrants from Asia (7.9%, a difference of 0.20%).
| Demographics | Rating | Rank | Family Poverty |
| Irish | 97.8 /100 | #81 | Exceptional 7.9% |
| Immigrants | Poland | 97.8 /100 | #82 | Exceptional 7.9% |
| Slovaks | 97.7 /100 | #83 | Exceptional 7.9% |
| British | 97.5 /100 | #84 | Exceptional 7.9% |
| Immigrants | Asia | 97.4 /100 | #85 | Exceptional 7.9% |
| Scottish | 97.3 /100 | #86 | Exceptional 7.9% |
| Belgians | 97.3 /100 | #87 | Exceptional 8.0% |
| Serbians | 97.2 /100 | #88 | Exceptional 8.0% |
| Immigrants | Denmark | 97.1 /100 | #89 | Exceptional 8.0% |
| Immigrants | England | 97.1 /100 | #90 | Exceptional 8.0% |
| Immigrants | Italy | 97.0 /100 | #91 | Exceptional 8.0% |
| Czechoslovakians | 96.8 /100 | #92 | Exceptional 8.0% |
| Tlingit-Haida | 96.7 /100 | #93 | Exceptional 8.0% |
| Immigrants | Pakistan | 96.6 /100 | #94 | Exceptional 8.0% |
| Immigrants | Philippines | 96.5 /100 | #95 | Exceptional 8.0% |
Demographics Similar to Arapaho by Family Poverty
In terms of family poverty, the demographic groups most similar to Arapaho are Immigrants from Honduras (12.7%, a difference of 0.10%), Menominee (12.7%, a difference of 0.65%), Immigrants from Dominica (12.7%, a difference of 0.72%), Inupiat (12.5%, a difference of 1.5%), and British West Indian (12.4%, a difference of 2.0%).
| Demographics | Rating | Rank | Family Poverty |
| Kiowa | 0.0 /100 | #314 | Tragic 12.2% |
| Immigrants | Mexico | 0.0 /100 | #315 | Tragic 12.3% |
| Hondurans | 0.0 /100 | #316 | Tragic 12.4% |
| Immigrants | Grenada | 0.0 /100 | #317 | Tragic 12.4% |
| U.S. Virgin Islanders | 0.0 /100 | #318 | Tragic 12.4% |
| British West Indians | 0.0 /100 | #319 | Tragic 12.4% |
| Inupiat | 0.0 /100 | #320 | Tragic 12.5% |
| Arapaho | 0.0 /100 | #321 | Tragic 12.7% |
| Immigrants | Honduras | 0.0 /100 | #322 | Tragic 12.7% |
| Menominee | 0.0 /100 | #323 | Tragic 12.7% |
| Immigrants | Dominica | 0.0 /100 | #324 | Tragic 12.7% |
| Paiute | 0.0 /100 | #325 | Tragic 13.0% |
| Colville | 0.0 /100 | #326 | Tragic 13.0% |
| Yakama | 0.0 /100 | #327 | Tragic 13.1% |
| Central American Indians | 0.0 /100 | #328 | Tragic 13.3% |