Belizean vs Lumbee Family Poverty
COMPARE
Belizean
Lumbee
Family Poverty
Family Poverty Comparison
Belizeans
Lumbee
11.3%
FAMILY POVERTY
0.0/ 100
METRIC RATING
280th/ 347
METRIC RANK
17.0%
FAMILY POVERTY
0.0/ 100
METRIC RATING
341st/ 347
METRIC RANK
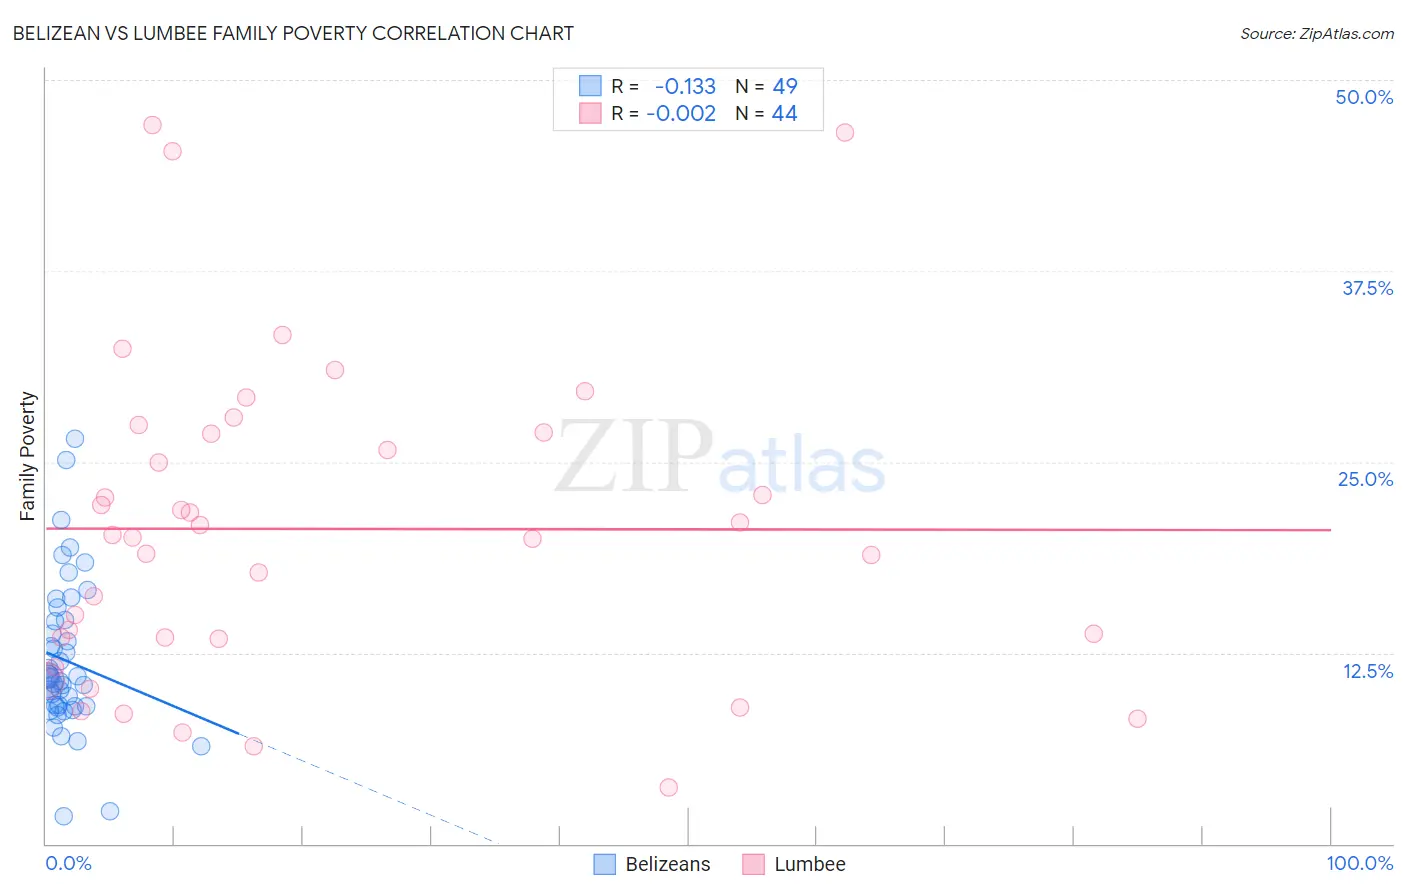
Belizean vs Lumbee Family Poverty Correlation Chart
The statistical analysis conducted on geographies consisting of 144,106,447 people shows a poor negative correlation between the proportion of Belizeans and poverty level among families in the United States with a correlation coefficient (R) of -0.133 and weighted average of 11.3%. Similarly, the statistical analysis conducted on geographies consisting of 92,238,507 people shows no correlation between the proportion of Lumbee and poverty level among families in the United States with a correlation coefficient (R) of -0.002 and weighted average of 17.0%, a difference of 50.9%.
Family Poverty Correlation Summary
| Measurement | Belizean | Lumbee |
| Minimum | 1.8% | 3.7% |
| Maximum | 26.5% | 47.0% |
| Range | 24.7% | 43.3% |
| Mean | 12.0% | 20.6% |
| Median | 10.8% | 20.2% |
| Interquartile 25% (IQ1) | 9.0% | 13.5% |
| Interquartile 75% (IQ3) | 14.6% | 26.9% |
| Interquartile Range (IQR) | 5.6% | 13.4% |
| Standard Deviation (Sample) | 4.9% | 10.4% |
| Standard Deviation (Population) | 4.9% | 10.3% |
Similar Demographics by Family Poverty
Demographics Similar to Belizeans by Family Poverty
In terms of family poverty, the demographic groups most similar to Belizeans are Blackfeet (11.3%, a difference of 0.040%), Guyanese (11.2%, a difference of 0.18%), Chippewa (11.2%, a difference of 0.21%), Immigrants from West Indies (11.3%, a difference of 0.27%), and Immigrants from Guyana (11.2%, a difference of 0.30%).
| Demographics | Rating | Rank | Family Poverty |
| Somalis | 0.1 /100 | #273 | Tragic 11.2% |
| Spanish Americans | 0.1 /100 | #274 | Tragic 11.2% |
| Central Americans | 0.1 /100 | #275 | Tragic 11.2% |
| Immigrants | Guyana | 0.1 /100 | #276 | Tragic 11.2% |
| Chippewa | 0.1 /100 | #277 | Tragic 11.2% |
| Guyanese | 0.1 /100 | #278 | Tragic 11.2% |
| Blackfeet | 0.0 /100 | #279 | Tragic 11.3% |
| Belizeans | 0.0 /100 | #280 | Tragic 11.3% |
| Immigrants | West Indies | 0.0 /100 | #281 | Tragic 11.3% |
| Immigrants | Cuba | 0.0 /100 | #282 | Tragic 11.3% |
| Indonesians | 0.0 /100 | #283 | Tragic 11.3% |
| Yaqui | 0.0 /100 | #284 | Tragic 11.3% |
| Barbadians | 0.0 /100 | #285 | Tragic 11.3% |
| Senegalese | 0.0 /100 | #286 | Tragic 11.5% |
| Vietnamese | 0.0 /100 | #287 | Tragic 11.5% |
Demographics Similar to Lumbee by Family Poverty
In terms of family poverty, the demographic groups most similar to Lumbee are Pueblo (17.0%, a difference of 0.070%), Yuman (16.6%, a difference of 2.1%), Immigrants from Yemen (17.5%, a difference of 2.8%), Crow (16.1%, a difference of 5.5%), and Hopi (15.9%, a difference of 6.7%).
| Demographics | Rating | Rank | Family Poverty |
| Immigrants | Dominican Republic | 0.0 /100 | #333 | Tragic 14.4% |
| Houma | 0.0 /100 | #334 | Tragic 14.6% |
| Apache | 0.0 /100 | #335 | Tragic 14.7% |
| Sioux | 0.0 /100 | #336 | Tragic 15.9% |
| Hopi | 0.0 /100 | #337 | Tragic 15.9% |
| Crow | 0.0 /100 | #338 | Tragic 16.1% |
| Yuman | 0.0 /100 | #339 | Tragic 16.6% |
| Pueblo | 0.0 /100 | #340 | Tragic 17.0% |
| Lumbee | 0.0 /100 | #341 | Tragic 17.0% |
| Immigrants | Yemen | 0.0 /100 | #342 | Tragic 17.5% |
| Pima | 0.0 /100 | #343 | Tragic 18.4% |
| Yup'ik | 0.0 /100 | #344 | Tragic 18.7% |
| Navajo | 0.0 /100 | #345 | Tragic 18.8% |
| Puerto Ricans | 0.0 /100 | #346 | Tragic 20.3% |
| Tohono O'odham | 0.0 /100 | #347 | Tragic 20.4% |