Barbadian vs Central American Indian Single Mother Poverty
COMPARE
Barbadian
Central American Indian
Single Mother Poverty
Single Mother Poverty Comparison
Barbadians
Central American Indians
30.7%
SINGLE MOTHER POVERTY
1.3/ 100
METRIC RATING
245th/ 347
METRIC RANK
34.3%
SINGLE MOTHER POVERTY
0.0/ 100
METRIC RATING
312th/ 347
METRIC RANK
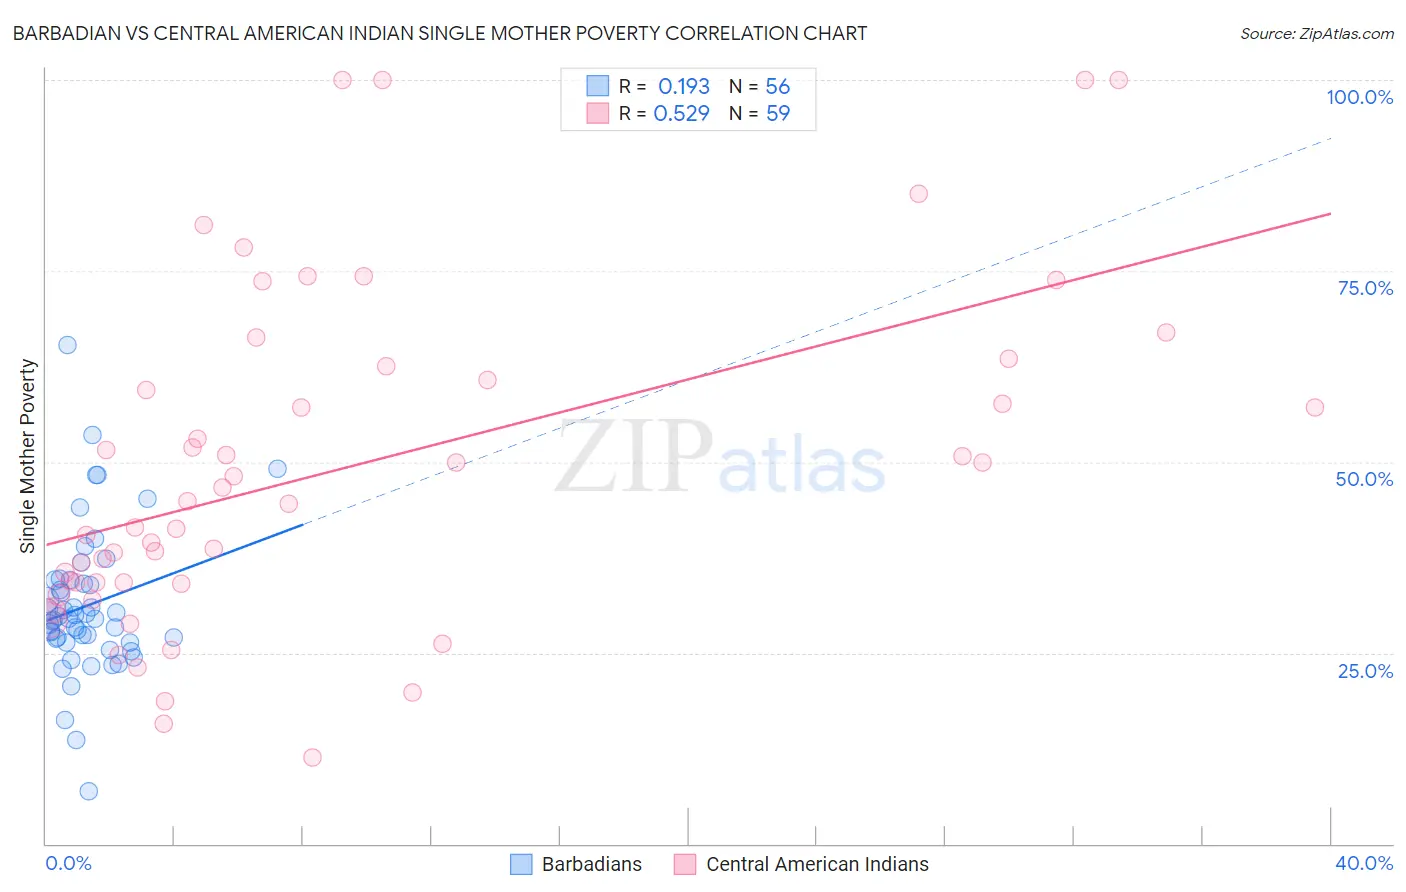
Barbadian vs Central American Indian Single Mother Poverty Correlation Chart
The statistical analysis conducted on geographies consisting of 140,210,705 people shows a poor positive correlation between the proportion of Barbadians and poverty level among single mothers in the United States with a correlation coefficient (R) of 0.193 and weighted average of 30.7%. Similarly, the statistical analysis conducted on geographies consisting of 321,816,529 people shows a substantial positive correlation between the proportion of Central American Indians and poverty level among single mothers in the United States with a correlation coefficient (R) of 0.529 and weighted average of 34.3%, a difference of 11.9%.
Single Mother Poverty Correlation Summary
| Measurement | Barbadian | Central American Indian |
| Minimum | 6.9% | 11.3% |
| Maximum | 65.3% | 100.0% |
| Range | 58.4% | 88.7% |
| Mean | 31.1% | 49.3% |
| Median | 29.4% | 44.9% |
| Interquartile 25% (IQ1) | 26.6% | 34.2% |
| Interquartile 75% (IQ3) | 34.3% | 62.6% |
| Interquartile Range (IQR) | 7.6% | 28.3% |
| Standard Deviation (Sample) | 9.6% | 22.0% |
| Standard Deviation (Population) | 9.5% | 21.8% |
Similar Demographics by Single Mother Poverty
Demographics Similar to Barbadians by Single Mother Poverty
In terms of single mother poverty, the demographic groups most similar to Barbadians are French (30.7%, a difference of 0.010%), Bermudan (30.6%, a difference of 0.23%), Immigrants from Burma/Myanmar (30.6%, a difference of 0.31%), Immigrants from Laos (30.6%, a difference of 0.33%), and Salvadoran (30.6%, a difference of 0.38%).
| Demographics | Rating | Rank | Single Mother Poverty |
| Slovaks | 2.8 /100 | #238 | Tragic 30.4% |
| Immigrants | Portugal | 2.1 /100 | #239 | Tragic 30.5% |
| Salvadorans | 1.8 /100 | #240 | Tragic 30.6% |
| Immigrants | Laos | 1.8 /100 | #241 | Tragic 30.6% |
| Immigrants | Burma/Myanmar | 1.7 /100 | #242 | Tragic 30.6% |
| Bermudans | 1.6 /100 | #243 | Tragic 30.6% |
| French | 1.3 /100 | #244 | Tragic 30.7% |
| Barbadians | 1.3 /100 | #245 | Tragic 30.7% |
| Ecuadorians | 0.9 /100 | #246 | Tragic 30.8% |
| West Indians | 0.9 /100 | #247 | Tragic 30.8% |
| French Canadians | 0.9 /100 | #248 | Tragic 30.8% |
| Cape Verdeans | 0.8 /100 | #249 | Tragic 30.8% |
| Vietnamese | 0.7 /100 | #250 | Tragic 30.9% |
| Tlingit-Haida | 0.6 /100 | #251 | Tragic 30.9% |
| Alaska Natives | 0.6 /100 | #252 | Tragic 30.9% |
Demographics Similar to Central American Indians by Single Mother Poverty
In terms of single mother poverty, the demographic groups most similar to Central American Indians are Alsatian (34.3%, a difference of 0.080%), Immigrants from Dominican Republic (34.4%, a difference of 0.080%), Chickasaw (34.4%, a difference of 0.26%), Hopi (34.5%, a difference of 0.34%), and Honduran (34.2%, a difference of 0.39%).
| Demographics | Rating | Rank | Single Mother Poverty |
| Immigrants | Central America | 0.0 /100 | #305 | Tragic 33.6% |
| Immigrants | Congo | 0.0 /100 | #306 | Tragic 33.8% |
| Comanche | 0.0 /100 | #307 | Tragic 33.9% |
| Immigrants | Mexico | 0.0 /100 | #308 | Tragic 34.0% |
| Potawatomi | 0.0 /100 | #309 | Tragic 34.1% |
| Hondurans | 0.0 /100 | #310 | Tragic 34.2% |
| Alsatians | 0.0 /100 | #311 | Tragic 34.3% |
| Central American Indians | 0.0 /100 | #312 | Tragic 34.3% |
| Immigrants | Dominican Republic | 0.0 /100 | #313 | Tragic 34.4% |
| Chickasaw | 0.0 /100 | #314 | Tragic 34.4% |
| Hopi | 0.0 /100 | #315 | Tragic 34.5% |
| Dominicans | 0.0 /100 | #316 | Tragic 34.5% |
| Cherokee | 0.0 /100 | #317 | Tragic 34.5% |
| Immigrants | Honduras | 0.0 /100 | #318 | Tragic 34.7% |
| Chippewa | 0.0 /100 | #319 | Tragic 34.8% |