Barbadian vs Central American Indian 3rd Grade
COMPARE
Barbadian
Central American Indian
3rd Grade
3rd Grade Comparison
Barbadians
Central American Indians
97.2%
3RD GRADE
0.1/ 100
METRIC RATING
281st/ 347
METRIC RANK
96.7%
3RD GRADE
0.0/ 100
METRIC RATING
305th/ 347
METRIC RANK
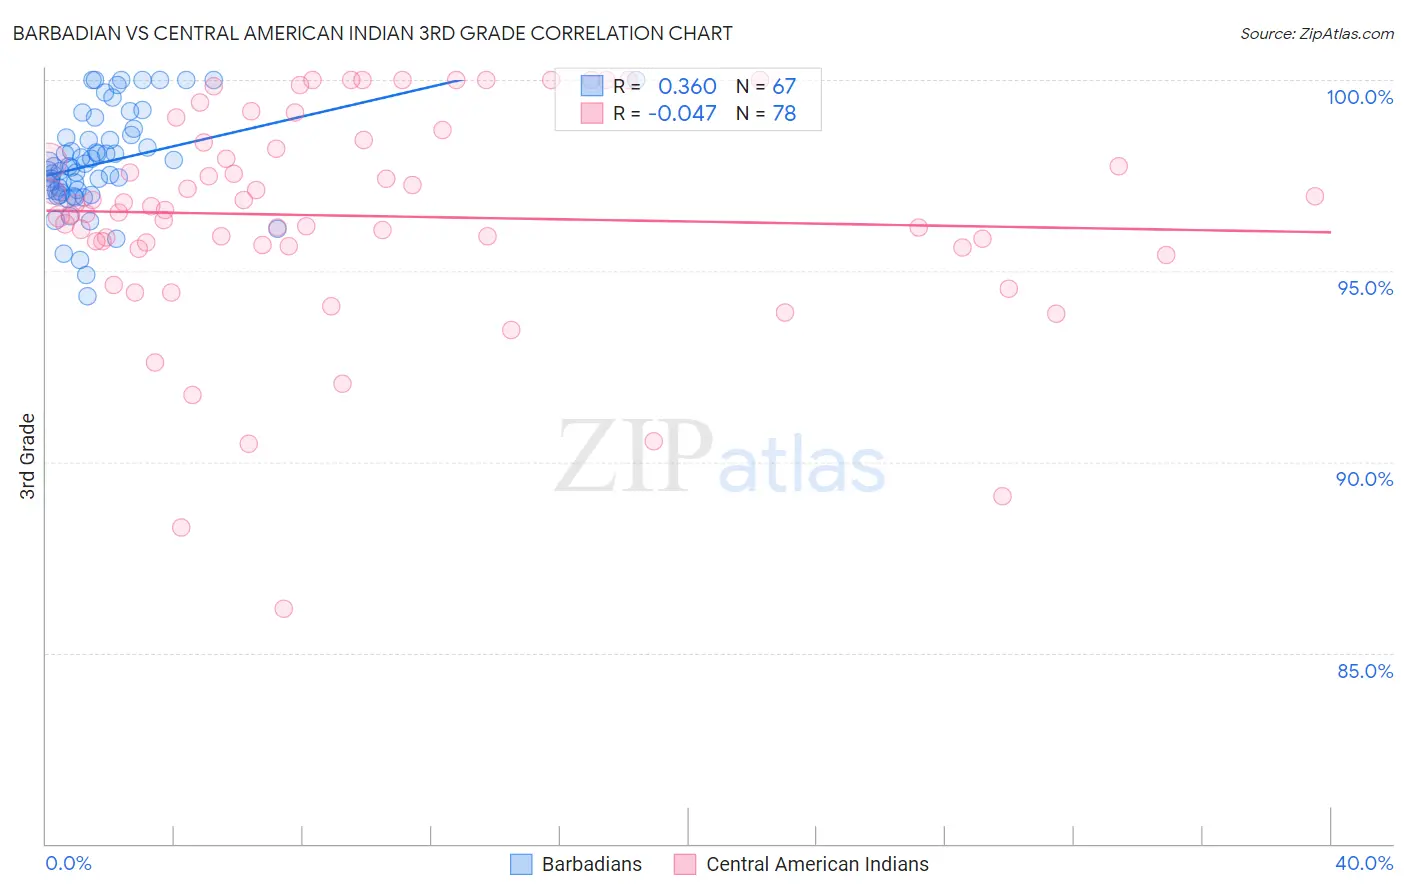
Barbadian vs Central American Indian 3rd Grade Correlation Chart
The statistical analysis conducted on geographies consisting of 141,304,590 people shows a mild positive correlation between the proportion of Barbadians and percentage of population with at least 3rd grade education in the United States with a correlation coefficient (R) of 0.360 and weighted average of 97.2%. Similarly, the statistical analysis conducted on geographies consisting of 326,141,205 people shows no correlation between the proportion of Central American Indians and percentage of population with at least 3rd grade education in the United States with a correlation coefficient (R) of -0.047 and weighted average of 96.7%, a difference of 0.45%.
3rd Grade Correlation Summary
| Measurement | Barbadian | Central American Indian |
| Minimum | 94.3% | 86.2% |
| Maximum | 100.0% | 100.0% |
| Range | 5.7% | 13.8% |
| Mean | 97.8% | 96.4% |
| Median | 97.7% | 96.6% |
| Interquartile 25% (IQ1) | 97.0% | 95.6% |
| Interquartile 75% (IQ3) | 98.6% | 98.4% |
| Interquartile Range (IQR) | 1.5% | 2.7% |
| Standard Deviation (Sample) | 1.3% | 2.8% |
| Standard Deviation (Population) | 1.3% | 2.8% |
Similar Demographics by 3rd Grade
Demographics Similar to Barbadians by 3rd Grade
In terms of 3rd grade, the demographic groups most similar to Barbadians are Immigrants from Philippines (97.2%, a difference of 0.010%), Immigrants from Ghana (97.2%, a difference of 0.010%), Afghan (97.1%, a difference of 0.010%), Immigrants from Bolivia (97.2%, a difference of 0.020%), and Trinidadian and Tobagonian (97.2%, a difference of 0.020%).
| Demographics | Rating | Rank | 3rd Grade |
| Immigrants | Cameroon | 0.1 /100 | #274 | Tragic 97.2% |
| Immigrants | Uzbekistan | 0.1 /100 | #275 | Tragic 97.2% |
| Immigrants | Bolivia | 0.1 /100 | #276 | Tragic 97.2% |
| Trinidadians and Tobagonians | 0.1 /100 | #277 | Tragic 97.2% |
| Immigrants | Western Africa | 0.1 /100 | #278 | Tragic 97.2% |
| Immigrants | Philippines | 0.1 /100 | #279 | Tragic 97.2% |
| Immigrants | Ghana | 0.1 /100 | #280 | Tragic 97.2% |
| Barbadians | 0.1 /100 | #281 | Tragic 97.2% |
| Afghans | 0.1 /100 | #282 | Tragic 97.1% |
| Houma | 0.1 /100 | #283 | Tragic 97.1% |
| Immigrants | Trinidad and Tobago | 0.0 /100 | #284 | Tragic 97.1% |
| Immigrants | Hong Kong | 0.0 /100 | #285 | Tragic 97.1% |
| Immigrants | Barbados | 0.0 /100 | #286 | Tragic 97.1% |
| Immigrants | St. Vincent and the Grenadines | 0.0 /100 | #287 | Tragic 97.1% |
| Immigrants | West Indies | 0.0 /100 | #288 | Tragic 97.1% |
Demographics Similar to Central American Indians by 3rd Grade
In terms of 3rd grade, the demographic groups most similar to Central American Indians are Immigrants from Caribbean (96.7%, a difference of 0.010%), Immigrants from Somalia (96.8%, a difference of 0.030%), Ecuadorian (96.7%, a difference of 0.030%), Guyanese (96.7%, a difference of 0.030%), and Nicaraguan (96.7%, a difference of 0.050%).
| Demographics | Rating | Rank | 3rd Grade |
| Immigrants | Dominica | 0.0 /100 | #298 | Tragic 96.9% |
| Somalis | 0.0 /100 | #299 | Tragic 96.8% |
| Immigrants | South Eastern Asia | 0.0 /100 | #300 | Tragic 96.8% |
| Immigrants | Cuba | 0.0 /100 | #301 | Tragic 96.8% |
| Immigrants | Somalia | 0.0 /100 | #302 | Tragic 96.8% |
| Ecuadorians | 0.0 /100 | #303 | Tragic 96.7% |
| Immigrants | Caribbean | 0.0 /100 | #304 | Tragic 96.7% |
| Central American Indians | 0.0 /100 | #305 | Tragic 96.7% |
| Guyanese | 0.0 /100 | #306 | Tragic 96.7% |
| Nicaraguans | 0.0 /100 | #307 | Tragic 96.7% |
| Immigrants | Haiti | 0.0 /100 | #308 | Tragic 96.7% |
| Sri Lankans | 0.0 /100 | #309 | Tragic 96.7% |
| Cape Verdeans | 0.0 /100 | #310 | Tragic 96.6% |
| Immigrants | Guyana | 0.0 /100 | #311 | Tragic 96.6% |
| Immigrants | Laos | 0.0 /100 | #312 | Tragic 96.6% |