Barbadian vs Kenyan Single Mother Poverty
COMPARE
Barbadian
Kenyan
Single Mother Poverty
Single Mother Poverty Comparison
Barbadians
Kenyans
30.7%
SINGLE MOTHER POVERTY
1.3/ 100
METRIC RATING
245th/ 347
METRIC RANK
28.4%
SINGLE MOTHER POVERTY
90.9/ 100
METRIC RATING
125th/ 347
METRIC RANK
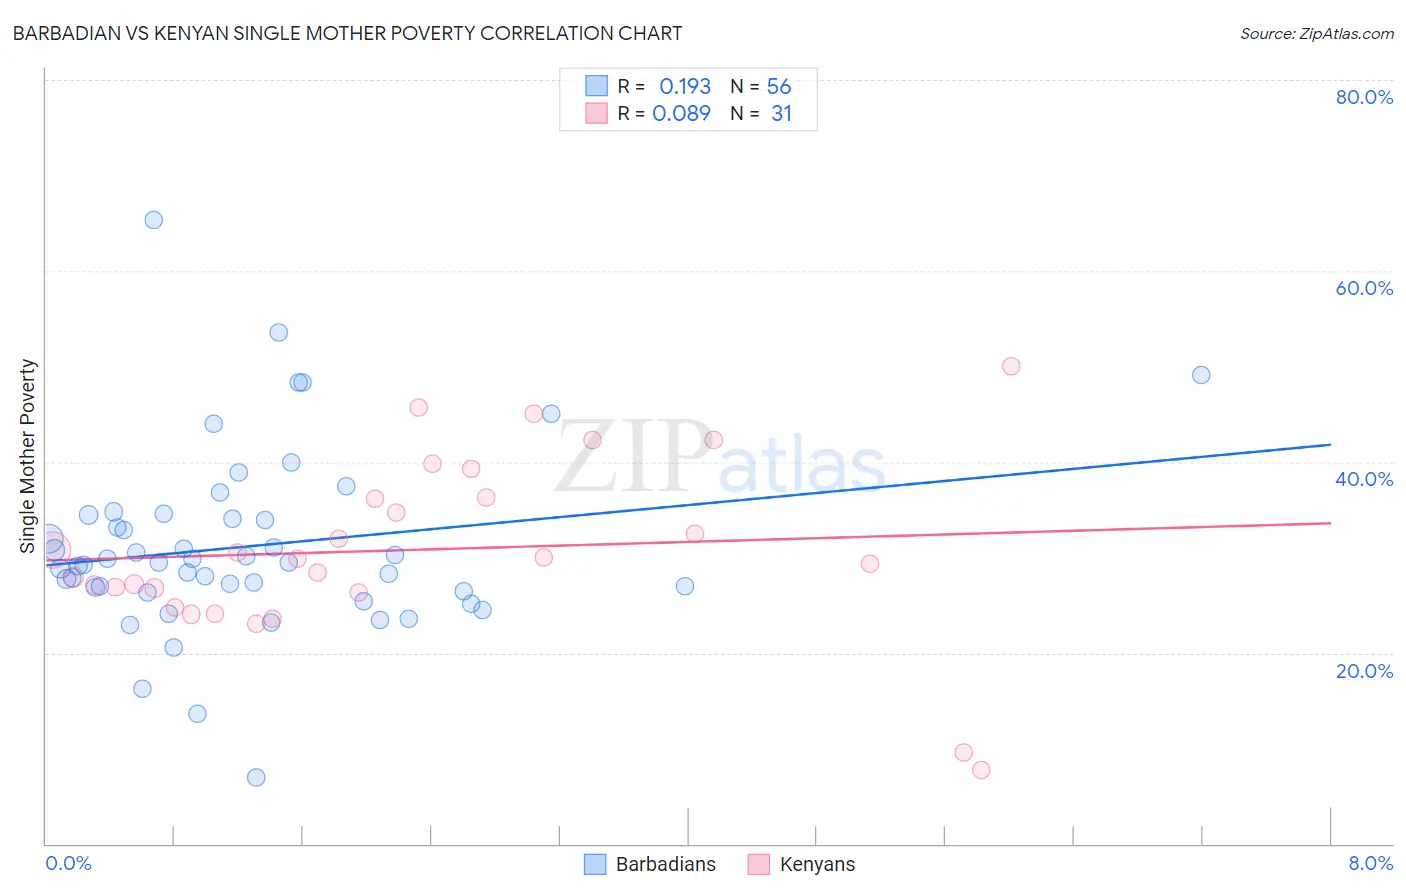
Barbadian vs Kenyan Single Mother Poverty Correlation Chart
The statistical analysis conducted on geographies consisting of 140,210,705 people shows a poor positive correlation between the proportion of Barbadians and poverty level among single mothers in the United States with a correlation coefficient (R) of 0.193 and weighted average of 30.7%. Similarly, the statistical analysis conducted on geographies consisting of 166,617,669 people shows a slight positive correlation between the proportion of Kenyans and poverty level among single mothers in the United States with a correlation coefficient (R) of 0.089 and weighted average of 28.4%, a difference of 8.1%.
Single Mother Poverty Correlation Summary
| Measurement | Barbadian | Kenyan |
| Minimum | 6.9% | 7.7% |
| Maximum | 65.3% | 50.0% |
| Range | 58.4% | 42.3% |
| Mean | 31.1% | 30.8% |
| Median | 29.4% | 29.9% |
| Interquartile 25% (IQ1) | 26.6% | 26.3% |
| Interquartile 75% (IQ3) | 34.3% | 36.3% |
| Interquartile Range (IQR) | 7.6% | 10.0% |
| Standard Deviation (Sample) | 9.6% | 9.3% |
| Standard Deviation (Population) | 9.5% | 9.2% |
Similar Demographics by Single Mother Poverty
Demographics Similar to Barbadians by Single Mother Poverty
In terms of single mother poverty, the demographic groups most similar to Barbadians are French (30.7%, a difference of 0.010%), Bermudan (30.6%, a difference of 0.23%), Immigrants from Burma/Myanmar (30.6%, a difference of 0.31%), Immigrants from Laos (30.6%, a difference of 0.33%), and Salvadoran (30.6%, a difference of 0.38%).
| Demographics | Rating | Rank | Single Mother Poverty |
| Slovaks | 2.8 /100 | #238 | Tragic 30.4% |
| Immigrants | Portugal | 2.1 /100 | #239 | Tragic 30.5% |
| Salvadorans | 1.8 /100 | #240 | Tragic 30.6% |
| Immigrants | Laos | 1.8 /100 | #241 | Tragic 30.6% |
| Immigrants | Burma/Myanmar | 1.7 /100 | #242 | Tragic 30.6% |
| Bermudans | 1.6 /100 | #243 | Tragic 30.6% |
| French | 1.3 /100 | #244 | Tragic 30.7% |
| Barbadians | 1.3 /100 | #245 | Tragic 30.7% |
| Ecuadorians | 0.9 /100 | #246 | Tragic 30.8% |
| West Indians | 0.9 /100 | #247 | Tragic 30.8% |
| French Canadians | 0.9 /100 | #248 | Tragic 30.8% |
| Cape Verdeans | 0.8 /100 | #249 | Tragic 30.8% |
| Vietnamese | 0.7 /100 | #250 | Tragic 30.9% |
| Tlingit-Haida | 0.6 /100 | #251 | Tragic 30.9% |
| Alaska Natives | 0.6 /100 | #252 | Tragic 30.9% |
Demographics Similar to Kenyans by Single Mother Poverty
In terms of single mother poverty, the demographic groups most similar to Kenyans are Immigrants from Chile (28.4%, a difference of 0.010%), Polish (28.4%, a difference of 0.020%), Immigrants from England (28.4%, a difference of 0.050%), South American (28.4%, a difference of 0.070%), and Norwegian (28.4%, a difference of 0.080%).
| Demographics | Rating | Rank | Single Mother Poverty |
| Brazilians | 92.4 /100 | #118 | Exceptional 28.3% |
| Immigrants | Syria | 92.4 /100 | #119 | Exceptional 28.3% |
| Cypriots | 92.3 /100 | #120 | Exceptional 28.3% |
| Immigrants | Afghanistan | 92.1 /100 | #121 | Exceptional 28.3% |
| Colombians | 91.8 /100 | #122 | Exceptional 28.3% |
| Uruguayans | 91.7 /100 | #123 | Exceptional 28.3% |
| Immigrants | Switzerland | 91.7 /100 | #124 | Exceptional 28.3% |
| Kenyans | 90.9 /100 | #125 | Exceptional 28.4% |
| Immigrants | Chile | 90.8 /100 | #126 | Exceptional 28.4% |
| Poles | 90.8 /100 | #127 | Exceptional 28.4% |
| Immigrants | England | 90.5 /100 | #128 | Exceptional 28.4% |
| South Americans | 90.4 /100 | #129 | Exceptional 28.4% |
| Norwegians | 90.4 /100 | #130 | Exceptional 28.4% |
| Immigrants | Austria | 90.3 /100 | #131 | Exceptional 28.4% |
| Immigrants | Morocco | 89.5 /100 | #132 | Excellent 28.4% |