Austrian vs Spanish American Single Male Poverty
COMPARE
Austrian
Spanish American
Single Male Poverty
Single Male Poverty Comparison
Austrians
Spanish Americans
13.1%
SINGLE MALE POVERTY
13.9/ 100
METRIC RATING
216th/ 347
METRIC RANK
14.2%
SINGLE MALE POVERTY
0.0/ 100
METRIC RATING
282nd/ 347
METRIC RANK
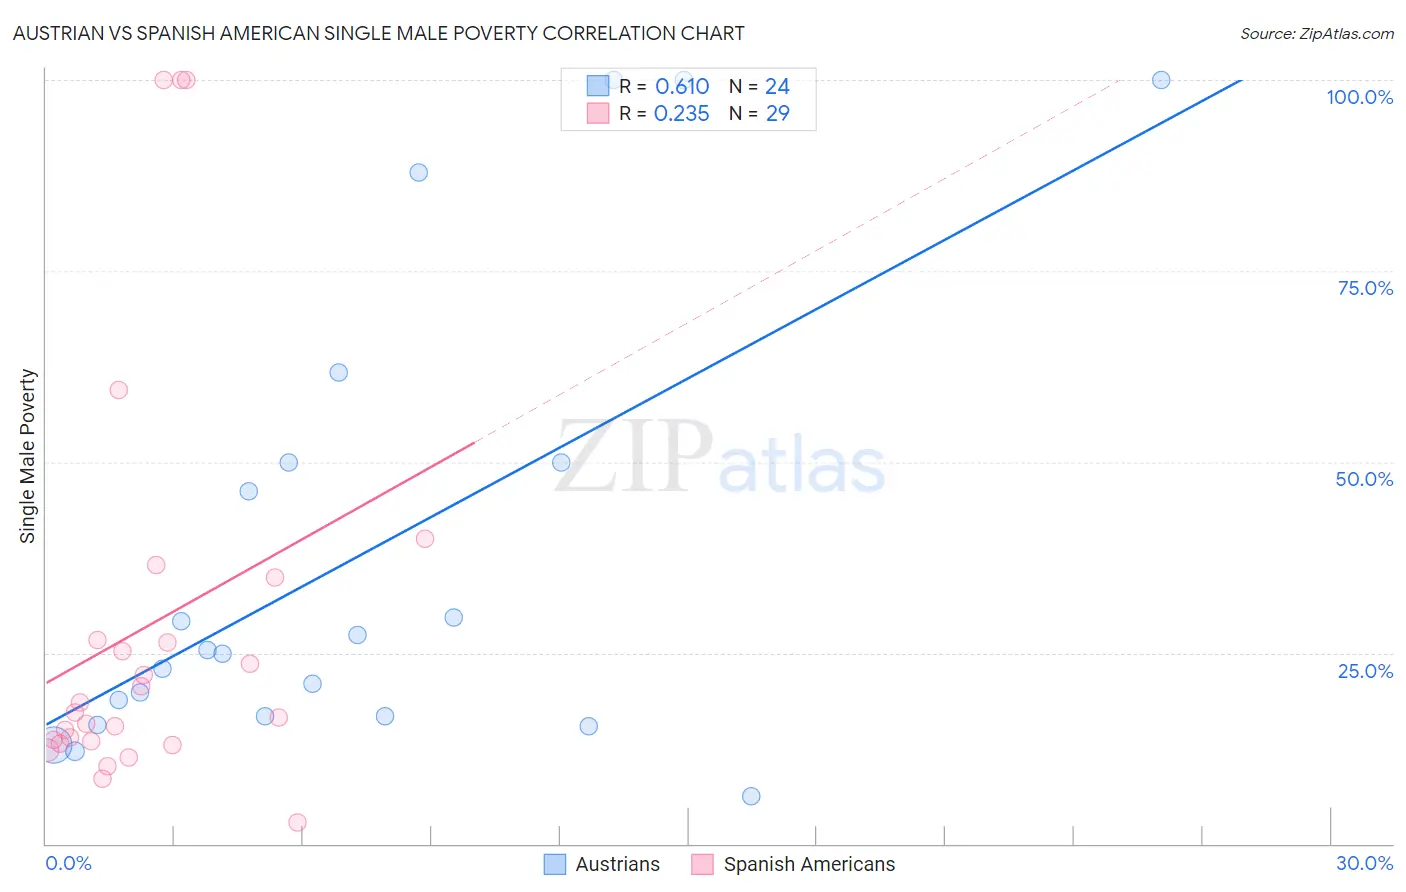
Austrian vs Spanish American Single Male Poverty Correlation Chart
The statistical analysis conducted on geographies consisting of 387,730,655 people shows a significant positive correlation between the proportion of Austrians and poverty level among single males in the United States with a correlation coefficient (R) of 0.610 and weighted average of 13.1%. Similarly, the statistical analysis conducted on geographies consisting of 100,269,530 people shows a weak positive correlation between the proportion of Spanish Americans and poverty level among single males in the United States with a correlation coefficient (R) of 0.235 and weighted average of 14.2%, a difference of 8.5%.
Single Male Poverty Correlation Summary
| Measurement | Austrian | Spanish American |
| Minimum | 6.2% | 2.8% |
| Maximum | 100.0% | 100.0% |
| Range | 93.8% | 97.2% |
| Mean | 37.9% | 28.5% |
| Median | 25.1% | 17.2% |
| Interquartile 25% (IQ1) | 16.7% | 13.2% |
| Interquartile 75% (IQ3) | 50.0% | 30.7% |
| Interquartile Range (IQR) | 33.3% | 17.5% |
| Standard Deviation (Sample) | 30.2% | 27.2% |
| Standard Deviation (Population) | 29.6% | 26.7% |
Similar Demographics by Single Male Poverty
Demographics Similar to Austrians by Single Male Poverty
In terms of single male poverty, the demographic groups most similar to Austrians are Japanese (13.1%, a difference of 0.090%), Zimbabwean (13.1%, a difference of 0.10%), Bermudan (13.1%, a difference of 0.10%), Scandinavian (13.1%, a difference of 0.11%), and Immigrants from Burma/Myanmar (13.1%, a difference of 0.15%).
| Demographics | Rating | Rank | Single Male Poverty |
| Mexican American Indians | 17.5 /100 | #209 | Poor 13.1% |
| Immigrants | Haiti | 16.8 /100 | #210 | Poor 13.1% |
| Swedes | 16.8 /100 | #211 | Poor 13.1% |
| Senegalese | 16.4 /100 | #212 | Poor 13.1% |
| Italians | 15.9 /100 | #213 | Poor 13.1% |
| Zimbabweans | 14.9 /100 | #214 | Poor 13.1% |
| Japanese | 14.8 /100 | #215 | Poor 13.1% |
| Austrians | 13.9 /100 | #216 | Poor 13.1% |
| Bermudans | 13.0 /100 | #217 | Poor 13.1% |
| Scandinavians | 12.9 /100 | #218 | Poor 13.1% |
| Immigrants | Burma/Myanmar | 12.6 /100 | #219 | Poor 13.1% |
| Central Americans | 10.9 /100 | #220 | Poor 13.2% |
| New Zealanders | 10.7 /100 | #221 | Poor 13.2% |
| Immigrants | Western Europe | 10.0 /100 | #222 | Poor 13.2% |
| Immigrants | Azores | 9.3 /100 | #223 | Tragic 13.2% |
Demographics Similar to Spanish Americans by Single Male Poverty
In terms of single male poverty, the demographic groups most similar to Spanish Americans are Hispanic or Latino (14.2%, a difference of 0.16%), Yaqui (14.2%, a difference of 0.16%), Hmong (14.2%, a difference of 0.18%), Indonesian (14.1%, a difference of 0.89%), and Slovak (14.1%, a difference of 0.93%).
| Demographics | Rating | Rank | Single Male Poverty |
| English | 0.1 /100 | #275 | Tragic 14.1% |
| Dutch | 0.1 /100 | #276 | Tragic 14.1% |
| Immigrants | Honduras | 0.0 /100 | #277 | Tragic 14.1% |
| Slovaks | 0.0 /100 | #278 | Tragic 14.1% |
| Indonesians | 0.0 /100 | #279 | Tragic 14.1% |
| Hmong | 0.0 /100 | #280 | Tragic 14.2% |
| Hispanics or Latinos | 0.0 /100 | #281 | Tragic 14.2% |
| Spanish Americans | 0.0 /100 | #282 | Tragic 14.2% |
| Yaqui | 0.0 /100 | #283 | Tragic 14.2% |
| Immigrants | Bahamas | 0.0 /100 | #284 | Tragic 14.4% |
| French | 0.0 /100 | #285 | Tragic 14.4% |
| Celtics | 0.0 /100 | #286 | Tragic 14.5% |
| Iroquois | 0.0 /100 | #287 | Tragic 14.5% |
| Whites/Caucasians | 0.0 /100 | #288 | Tragic 14.5% |
| Immigrants | Dominica | 0.0 /100 | #289 | Tragic 14.5% |