Armenian vs Immigrants from Russia Receiving Food Stamps
COMPARE
Armenian
Immigrants from Russia
Receiving Food Stamps
Receiving Food Stamps Comparison
Armenians
Immigrants from Russia
11.1%
RECEIVING FOOD STAMPS
81.4/ 100
METRIC RATING
154th/ 347
METRIC RANK
10.8%
RECEIVING FOOD STAMPS
90.9/ 100
METRIC RATING
133rd/ 347
METRIC RANK
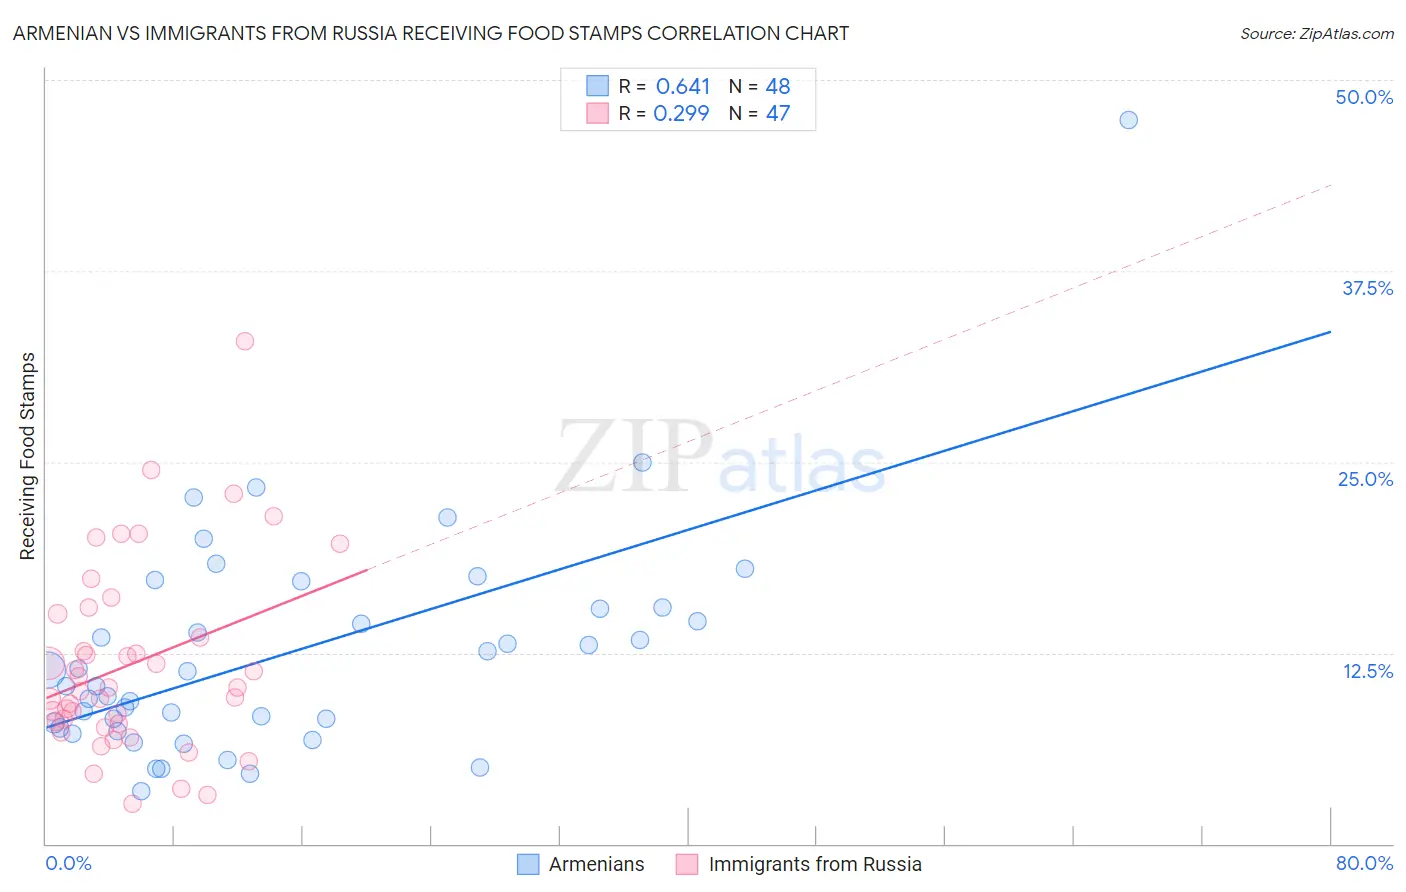
Armenian vs Immigrants from Russia Receiving Food Stamps Correlation Chart
The statistical analysis conducted on geographies consisting of 309,974,656 people shows a significant positive correlation between the proportion of Armenians and percentage of population receiving government assistance and/or food stamps in the United States with a correlation coefficient (R) of 0.641 and weighted average of 11.1%. Similarly, the statistical analysis conducted on geographies consisting of 346,828,802 people shows a weak positive correlation between the proportion of Immigrants from Russia and percentage of population receiving government assistance and/or food stamps in the United States with a correlation coefficient (R) of 0.299 and weighted average of 10.8%, a difference of 3.2%.
Receiving Food Stamps Correlation Summary
| Measurement | Armenian | Immigrants from Russia |
| Minimum | 3.5% | 2.6% |
| Maximum | 47.4% | 32.9% |
| Range | 43.9% | 30.3% |
| Mean | 12.5% | 11.8% |
| Median | 10.8% | 10.2% |
| Interquartile 25% (IQ1) | 7.7% | 7.8% |
| Interquartile 75% (IQ3) | 15.4% | 15.1% |
| Interquartile Range (IQR) | 7.7% | 7.2% |
| Standard Deviation (Sample) | 7.4% | 6.2% |
| Standard Deviation (Population) | 7.4% | 6.1% |
Similar Demographics by Receiving Food Stamps
Demographics Similar to Armenians by Receiving Food Stamps
In terms of receiving food stamps, the demographic groups most similar to Armenians are Lebanese (11.1%, a difference of 0.060%), Immigrants from Kazakhstan (11.1%, a difference of 0.080%), Immigrants from Spain (11.1%, a difference of 0.090%), Immigrants from Argentina (11.2%, a difference of 0.25%), and Soviet Union (11.1%, a difference of 0.45%).
| Demographics | Rating | Rank | Receiving Food Stamps |
| Whites/Caucasians | 83.9 /100 | #147 | Excellent 11.1% |
| Immigrants | South Eastern Asia | 83.3 /100 | #148 | Excellent 11.1% |
| Brazilians | 83.2 /100 | #149 | Excellent 11.1% |
| Soviet Union | 83.1 /100 | #150 | Excellent 11.1% |
| Immigrants | Spain | 81.7 /100 | #151 | Excellent 11.1% |
| Immigrants | Kazakhstan | 81.7 /100 | #152 | Excellent 11.1% |
| Lebanese | 81.6 /100 | #153 | Excellent 11.1% |
| Armenians | 81.4 /100 | #154 | Excellent 11.1% |
| Immigrants | Argentina | 80.4 /100 | #155 | Excellent 11.2% |
| Immigrants | Afghanistan | 75.6 /100 | #156 | Good 11.3% |
| Immigrants | Lebanon | 75.2 /100 | #157 | Good 11.3% |
| Immigrants | Bosnia and Herzegovina | 72.6 /100 | #158 | Good 11.3% |
| Immigrants | Oceania | 70.4 /100 | #159 | Good 11.4% |
| French Canadians | 69.5 /100 | #160 | Good 11.4% |
| Pennsylvania Germans | 68.4 /100 | #161 | Good 11.4% |
Demographics Similar to Immigrants from Russia by Receiving Food Stamps
In terms of receiving food stamps, the demographic groups most similar to Immigrants from Russia are Immigrants from Brazil (10.8%, a difference of 0.30%), Argentinean (10.8%, a difference of 0.32%), Slovak (10.8%, a difference of 0.49%), Immigrants from Germany (10.7%, a difference of 0.50%), and Immigrants from Eastern Europe (10.8%, a difference of 0.51%).
| Demographics | Rating | Rank | Receiving Food Stamps |
| Afghans | 92.6 /100 | #126 | Exceptional 10.7% |
| Immigrants | Ethiopia | 92.6 /100 | #127 | Exceptional 10.7% |
| Immigrants | Jordan | 92.5 /100 | #128 | Exceptional 10.7% |
| Yugoslavians | 92.5 /100 | #129 | Exceptional 10.7% |
| Israelis | 92.4 /100 | #130 | Exceptional 10.7% |
| French | 92.3 /100 | #131 | Exceptional 10.7% |
| Immigrants | Germany | 92.0 /100 | #132 | Exceptional 10.7% |
| Immigrants | Russia | 90.9 /100 | #133 | Exceptional 10.8% |
| Immigrants | Brazil | 90.3 /100 | #134 | Exceptional 10.8% |
| Argentineans | 90.2 /100 | #135 | Exceptional 10.8% |
| Slovaks | 89.8 /100 | #136 | Excellent 10.8% |
| Immigrants | Eastern Europe | 89.8 /100 | #137 | Excellent 10.8% |
| Immigrants | Moldova | 88.5 /100 | #138 | Excellent 10.9% |
| Hmong | 88.4 /100 | #139 | Excellent 10.9% |
| Celtics | 87.8 /100 | #140 | Excellent 10.9% |