Armenian vs Immigrants from Liberia Receiving Food Stamps
COMPARE
Armenian
Immigrants from Liberia
Receiving Food Stamps
Receiving Food Stamps Comparison
Armenians
Immigrants from Liberia
11.1%
RECEIVING FOOD STAMPS
81.4/ 100
METRIC RATING
154th/ 347
METRIC RANK
15.1%
RECEIVING FOOD STAMPS
0.0/ 100
METRIC RATING
285th/ 347
METRIC RANK
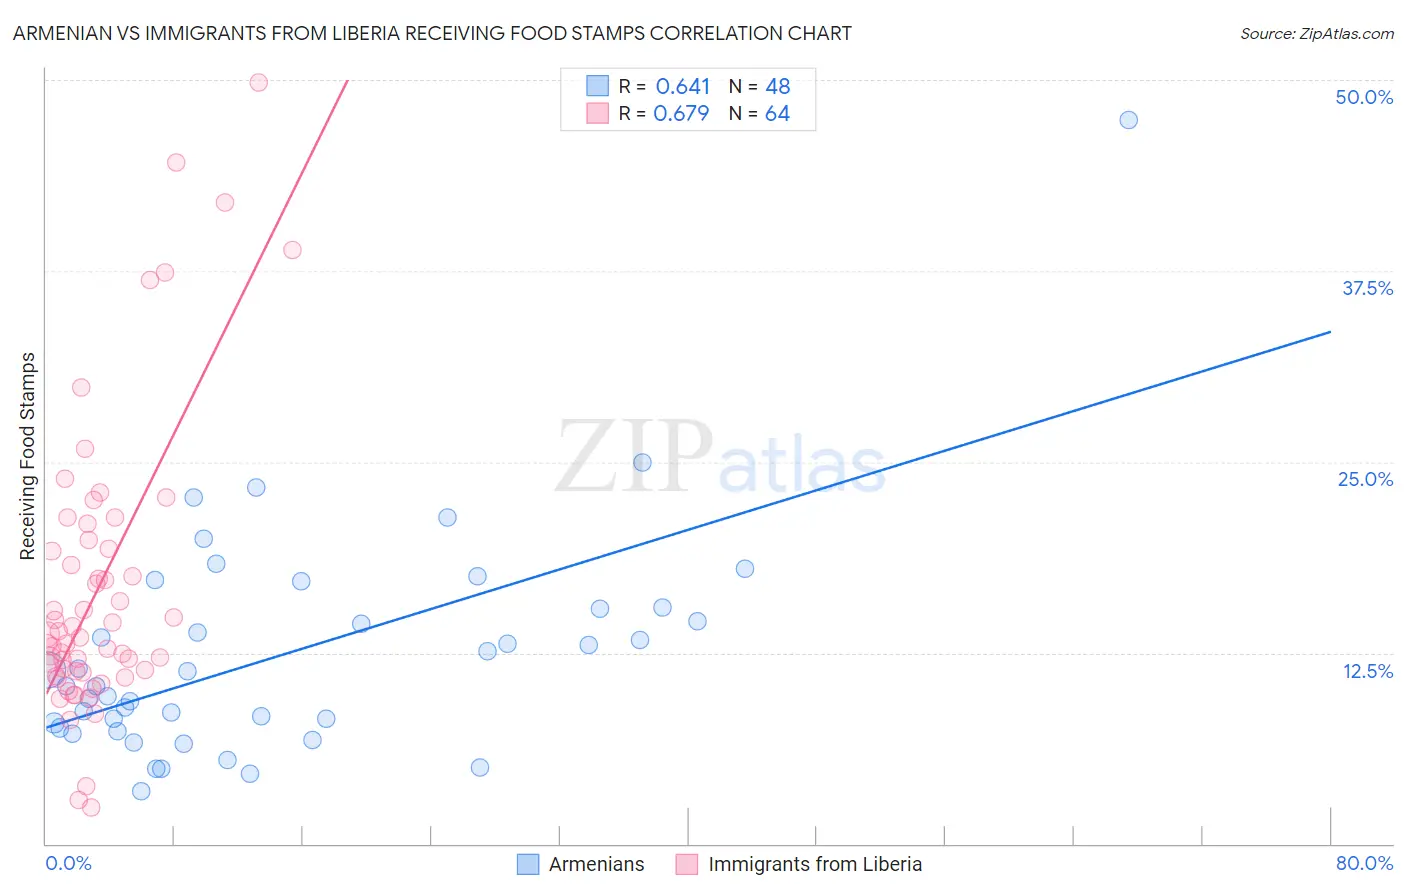
Armenian vs Immigrants from Liberia Receiving Food Stamps Correlation Chart
The statistical analysis conducted on geographies consisting of 309,974,656 people shows a significant positive correlation between the proportion of Armenians and percentage of population receiving government assistance and/or food stamps in the United States with a correlation coefficient (R) of 0.641 and weighted average of 11.1%. Similarly, the statistical analysis conducted on geographies consisting of 135,219,591 people shows a significant positive correlation between the proportion of Immigrants from Liberia and percentage of population receiving government assistance and/or food stamps in the United States with a correlation coefficient (R) of 0.679 and weighted average of 15.1%, a difference of 35.7%.
Receiving Food Stamps Correlation Summary
| Measurement | Armenian | Immigrants from Liberia |
| Minimum | 3.5% | 2.4% |
| Maximum | 47.4% | 49.8% |
| Range | 43.9% | 47.4% |
| Mean | 12.5% | 16.8% |
| Median | 10.8% | 13.6% |
| Interquartile 25% (IQ1) | 7.7% | 11.3% |
| Interquartile 75% (IQ3) | 15.4% | 19.6% |
| Interquartile Range (IQR) | 7.7% | 8.3% |
| Standard Deviation (Sample) | 7.4% | 9.6% |
| Standard Deviation (Population) | 7.4% | 9.6% |
Similar Demographics by Receiving Food Stamps
Demographics Similar to Armenians by Receiving Food Stamps
In terms of receiving food stamps, the demographic groups most similar to Armenians are Lebanese (11.1%, a difference of 0.060%), Immigrants from Kazakhstan (11.1%, a difference of 0.080%), Immigrants from Spain (11.1%, a difference of 0.090%), Immigrants from Argentina (11.2%, a difference of 0.25%), and Soviet Union (11.1%, a difference of 0.45%).
| Demographics | Rating | Rank | Receiving Food Stamps |
| Whites/Caucasians | 83.9 /100 | #147 | Excellent 11.1% |
| Immigrants | South Eastern Asia | 83.3 /100 | #148 | Excellent 11.1% |
| Brazilians | 83.2 /100 | #149 | Excellent 11.1% |
| Soviet Union | 83.1 /100 | #150 | Excellent 11.1% |
| Immigrants | Spain | 81.7 /100 | #151 | Excellent 11.1% |
| Immigrants | Kazakhstan | 81.7 /100 | #152 | Excellent 11.1% |
| Lebanese | 81.6 /100 | #153 | Excellent 11.1% |
| Armenians | 81.4 /100 | #154 | Excellent 11.1% |
| Immigrants | Argentina | 80.4 /100 | #155 | Excellent 11.2% |
| Immigrants | Afghanistan | 75.6 /100 | #156 | Good 11.3% |
| Immigrants | Lebanon | 75.2 /100 | #157 | Good 11.3% |
| Immigrants | Bosnia and Herzegovina | 72.6 /100 | #158 | Good 11.3% |
| Immigrants | Oceania | 70.4 /100 | #159 | Good 11.4% |
| French Canadians | 69.5 /100 | #160 | Good 11.4% |
| Pennsylvania Germans | 68.4 /100 | #161 | Good 11.4% |
Demographics Similar to Immigrants from Liberia by Receiving Food Stamps
In terms of receiving food stamps, the demographic groups most similar to Immigrants from Liberia are African (15.1%, a difference of 0.14%), Immigrants from Mexico (15.2%, a difference of 0.37%), Immigrants from Ecuador (15.0%, a difference of 0.38%), Bangladeshi (15.0%, a difference of 0.39%), and Immigrants from Central America (15.0%, a difference of 0.67%).
| Demographics | Rating | Rank | Receiving Food Stamps |
| Belizeans | 0.1 /100 | #278 | Tragic 14.8% |
| Kiowa | 0.0 /100 | #279 | Tragic 14.9% |
| Ecuadorians | 0.0 /100 | #280 | Tragic 14.9% |
| Spanish American Indians | 0.0 /100 | #281 | Tragic 14.9% |
| Immigrants | Central America | 0.0 /100 | #282 | Tragic 15.0% |
| Bangladeshis | 0.0 /100 | #283 | Tragic 15.0% |
| Immigrants | Ecuador | 0.0 /100 | #284 | Tragic 15.0% |
| Immigrants | Liberia | 0.0 /100 | #285 | Tragic 15.1% |
| Africans | 0.0 /100 | #286 | Tragic 15.1% |
| Immigrants | Mexico | 0.0 /100 | #287 | Tragic 15.2% |
| Immigrants | Belize | 0.0 /100 | #288 | Tragic 15.2% |
| Immigrants | Senegal | 0.0 /100 | #289 | Tragic 15.3% |
| Senegalese | 0.0 /100 | #290 | Tragic 15.4% |
| Hondurans | 0.0 /100 | #291 | Tragic 15.5% |
| Alaska Natives | 0.0 /100 | #292 | Tragic 15.6% |