Armenian vs Chippewa Receiving Food Stamps
COMPARE
Armenian
Chippewa
Receiving Food Stamps
Receiving Food Stamps Comparison
Armenians
Chippewa
11.1%
RECEIVING FOOD STAMPS
81.4/ 100
METRIC RATING
154th/ 347
METRIC RANK
14.7%
RECEIVING FOOD STAMPS
0.1/ 100
METRIC RATING
272nd/ 347
METRIC RANK
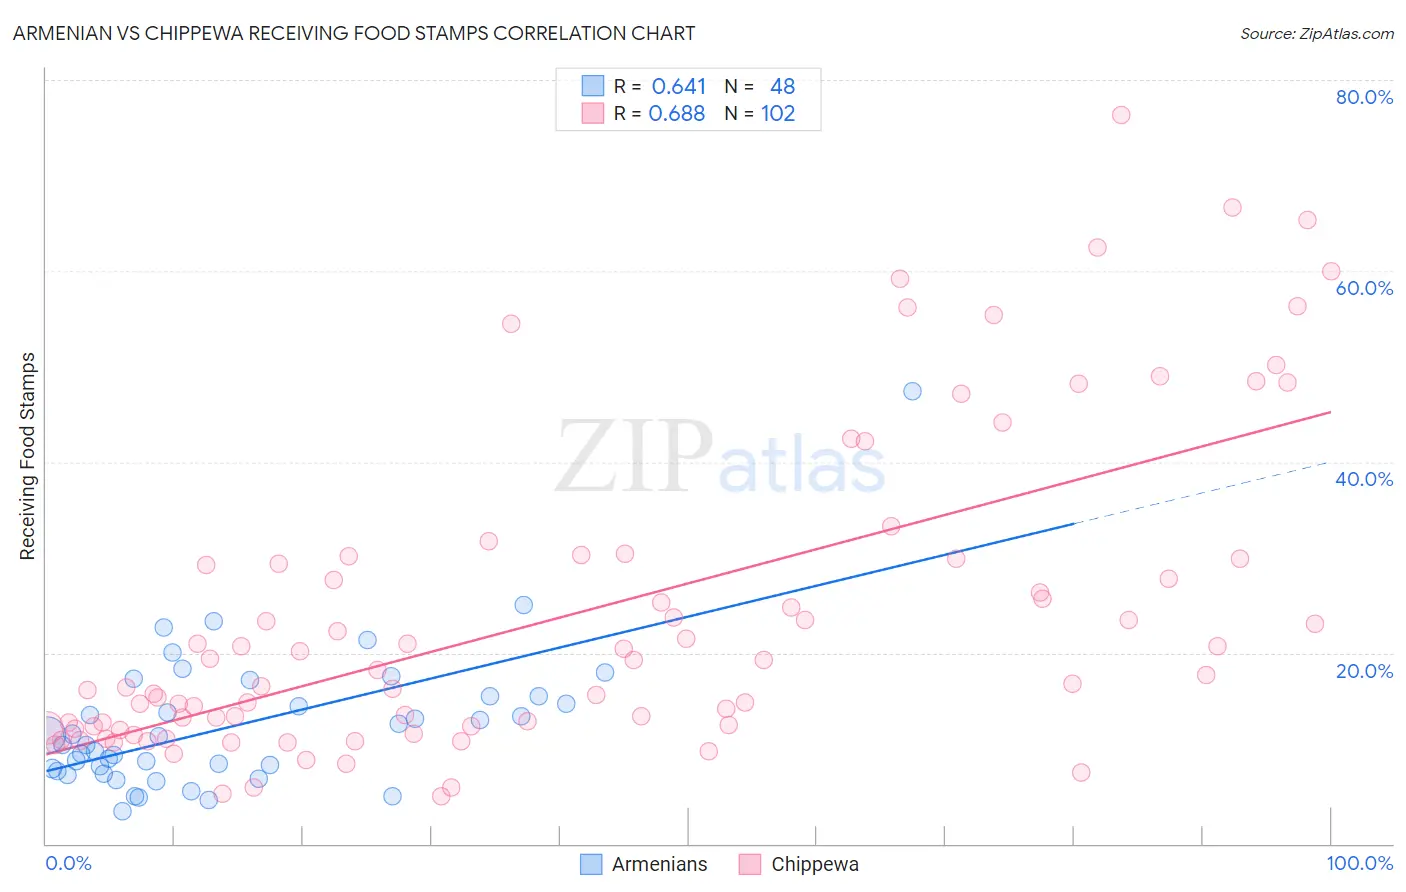
Armenian vs Chippewa Receiving Food Stamps Correlation Chart
The statistical analysis conducted on geographies consisting of 309,974,656 people shows a significant positive correlation between the proportion of Armenians and percentage of population receiving government assistance and/or food stamps in the United States with a correlation coefficient (R) of 0.641 and weighted average of 11.1%. Similarly, the statistical analysis conducted on geographies consisting of 214,846,043 people shows a significant positive correlation between the proportion of Chippewa and percentage of population receiving government assistance and/or food stamps in the United States with a correlation coefficient (R) of 0.688 and weighted average of 14.7%, a difference of 31.9%.
Receiving Food Stamps Correlation Summary
| Measurement | Armenian | Chippewa |
| Minimum | 3.5% | 5.0% |
| Maximum | 47.4% | 76.3% |
| Range | 43.9% | 71.3% |
| Mean | 12.5% | 24.0% |
| Median | 10.8% | 17.9% |
| Interquartile 25% (IQ1) | 7.7% | 12.3% |
| Interquartile 75% (IQ3) | 15.4% | 29.8% |
| Interquartile Range (IQR) | 7.7% | 17.5% |
| Standard Deviation (Sample) | 7.4% | 16.4% |
| Standard Deviation (Population) | 7.4% | 16.3% |
Similar Demographics by Receiving Food Stamps
Demographics Similar to Armenians by Receiving Food Stamps
In terms of receiving food stamps, the demographic groups most similar to Armenians are Lebanese (11.1%, a difference of 0.060%), Immigrants from Kazakhstan (11.1%, a difference of 0.080%), Immigrants from Spain (11.1%, a difference of 0.090%), Immigrants from Argentina (11.2%, a difference of 0.25%), and Soviet Union (11.1%, a difference of 0.45%).
| Demographics | Rating | Rank | Receiving Food Stamps |
| Whites/Caucasians | 83.9 /100 | #147 | Excellent 11.1% |
| Immigrants | South Eastern Asia | 83.3 /100 | #148 | Excellent 11.1% |
| Brazilians | 83.2 /100 | #149 | Excellent 11.1% |
| Soviet Union | 83.1 /100 | #150 | Excellent 11.1% |
| Immigrants | Spain | 81.7 /100 | #151 | Excellent 11.1% |
| Immigrants | Kazakhstan | 81.7 /100 | #152 | Excellent 11.1% |
| Lebanese | 81.6 /100 | #153 | Excellent 11.1% |
| Armenians | 81.4 /100 | #154 | Excellent 11.1% |
| Immigrants | Argentina | 80.4 /100 | #155 | Excellent 11.2% |
| Immigrants | Afghanistan | 75.6 /100 | #156 | Good 11.3% |
| Immigrants | Lebanon | 75.2 /100 | #157 | Good 11.3% |
| Immigrants | Bosnia and Herzegovina | 72.6 /100 | #158 | Good 11.3% |
| Immigrants | Oceania | 70.4 /100 | #159 | Good 11.4% |
| French Canadians | 69.5 /100 | #160 | Good 11.4% |
| Pennsylvania Germans | 68.4 /100 | #161 | Good 11.4% |
Demographics Similar to Chippewa by Receiving Food Stamps
In terms of receiving food stamps, the demographic groups most similar to Chippewa are Alaskan Athabascan (14.7%, a difference of 0.030%), Immigrants from Western Africa (14.7%, a difference of 0.050%), Ute (14.7%, a difference of 0.13%), Immigrants from Guatemala (14.6%, a difference of 0.22%), and Mexican (14.6%, a difference of 0.32%).
| Demographics | Rating | Rank | Receiving Food Stamps |
| Blackfeet | 0.2 /100 | #265 | Tragic 14.3% |
| Cheyenne | 0.2 /100 | #266 | Tragic 14.3% |
| Dutch West Indians | 0.2 /100 | #267 | Tragic 14.3% |
| Guatemalans | 0.1 /100 | #268 | Tragic 14.4% |
| Nepalese | 0.1 /100 | #269 | Tragic 14.6% |
| Mexicans | 0.1 /100 | #270 | Tragic 14.6% |
| Immigrants | Guatemala | 0.1 /100 | #271 | Tragic 14.6% |
| Chippewa | 0.1 /100 | #272 | Tragic 14.7% |
| Alaskan Athabascans | 0.1 /100 | #273 | Tragic 14.7% |
| Immigrants | Western Africa | 0.1 /100 | #274 | Tragic 14.7% |
| Ute | 0.1 /100 | #275 | Tragic 14.7% |
| Liberians | 0.1 /100 | #276 | Tragic 14.8% |
| Seminole | 0.1 /100 | #277 | Tragic 14.8% |
| Belizeans | 0.1 /100 | #278 | Tragic 14.8% |
| Kiowa | 0.0 /100 | #279 | Tragic 14.9% |