Argentinean vs Immigrants from Hong Kong Female Poverty
COMPARE
Argentinean
Immigrants from Hong Kong
Female Poverty
Female Poverty Comparison
Argentineans
Immigrants from Hong Kong
12.8%
FEMALE POVERTY
89.1/ 100
METRIC RATING
125th/ 347
METRIC RANK
11.2%
FEMALE POVERTY
99.9/ 100
METRIC RATING
10th/ 347
METRIC RANK
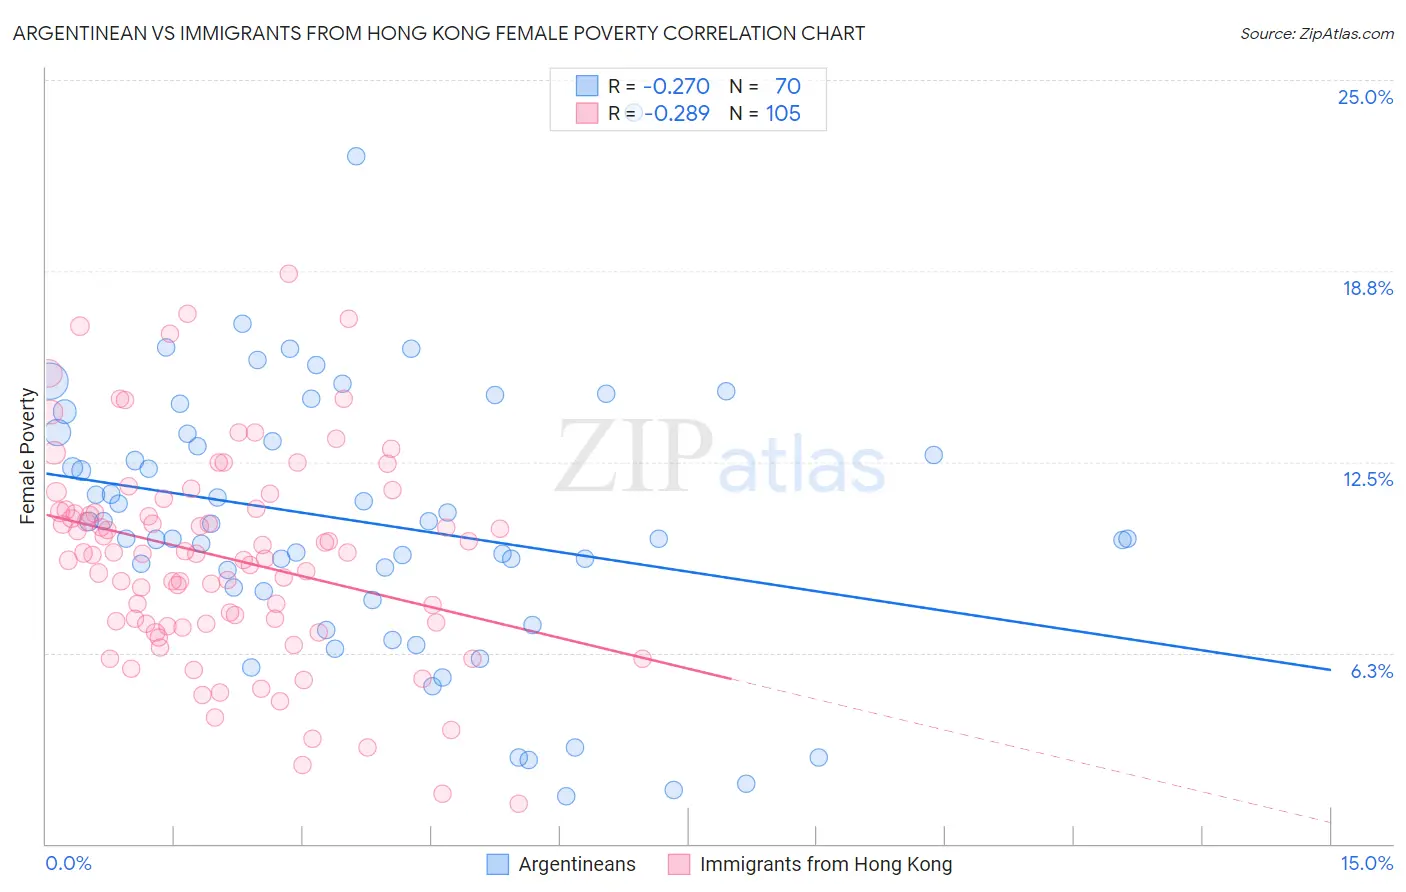
Argentinean vs Immigrants from Hong Kong Female Poverty Correlation Chart
The statistical analysis conducted on geographies consisting of 296,942,880 people shows a weak negative correlation between the proportion of Argentineans and poverty level among females in the United States with a correlation coefficient (R) of -0.270 and weighted average of 12.8%. Similarly, the statistical analysis conducted on geographies consisting of 253,845,930 people shows a weak negative correlation between the proportion of Immigrants from Hong Kong and poverty level among females in the United States with a correlation coefficient (R) of -0.289 and weighted average of 11.2%, a difference of 13.8%.
Female Poverty Correlation Summary
| Measurement | Argentinean | Immigrants from Hong Kong |
| Minimum | 1.6% | 1.3% |
| Maximum | 23.9% | 18.6% |
| Range | 22.4% | 17.3% |
| Mean | 10.5% | 9.4% |
| Median | 10.2% | 9.5% |
| Interquartile 25% (IQ1) | 8.3% | 7.2% |
| Interquartile 75% (IQ3) | 13.4% | 10.9% |
| Interquartile Range (IQR) | 5.2% | 3.7% |
| Standard Deviation (Sample) | 4.5% | 3.4% |
| Standard Deviation (Population) | 4.4% | 3.4% |
Similar Demographics by Female Poverty
Demographics Similar to Argentineans by Female Poverty
In terms of female poverty, the demographic groups most similar to Argentineans are Immigrants from Norway (12.8%, a difference of 0.050%), Immigrants from Ukraine (12.8%, a difference of 0.070%), South African (12.8%, a difference of 0.18%), Immigrants from Belarus (12.8%, a difference of 0.22%), and Immigrants from South Eastern Asia (12.7%, a difference of 0.23%).
| Demographics | Rating | Rank | Female Poverty |
| Sri Lankans | 90.9 /100 | #118 | Exceptional 12.7% |
| Albanians | 90.8 /100 | #119 | Exceptional 12.7% |
| New Zealanders | 90.6 /100 | #120 | Exceptional 12.7% |
| Immigrants | Hungary | 90.3 /100 | #121 | Exceptional 12.7% |
| French Canadians | 90.2 /100 | #122 | Exceptional 12.7% |
| Immigrants | South Eastern Asia | 89.9 /100 | #123 | Excellent 12.7% |
| Immigrants | Norway | 89.3 /100 | #124 | Excellent 12.8% |
| Argentineans | 89.1 /100 | #125 | Excellent 12.8% |
| Immigrants | Ukraine | 88.8 /100 | #126 | Excellent 12.8% |
| South Africans | 88.4 /100 | #127 | Excellent 12.8% |
| Immigrants | Belarus | 88.2 /100 | #128 | Excellent 12.8% |
| Immigrants | Brazil | 87.9 /100 | #129 | Excellent 12.8% |
| Immigrants | Vietnam | 87.1 /100 | #130 | Excellent 12.8% |
| Immigrants | Argentina | 87.0 /100 | #131 | Excellent 12.8% |
| Immigrants | Jordan | 86.9 /100 | #132 | Excellent 12.8% |
Demographics Similar to Immigrants from Hong Kong by Female Poverty
In terms of female poverty, the demographic groups most similar to Immigrants from Hong Kong are Maltese (11.2%, a difference of 0.11%), Bhutanese (11.3%, a difference of 0.57%), Immigrants from Lithuania (11.3%, a difference of 0.58%), Bulgarian (11.1%, a difference of 0.80%), and Immigrants from South Central Asia (11.1%, a difference of 0.99%).
| Demographics | Rating | Rank | Female Poverty |
| Thais | 100.0 /100 | #3 | Exceptional 10.5% |
| Immigrants | Taiwan | 100.0 /100 | #4 | Exceptional 10.5% |
| Filipinos | 100.0 /100 | #5 | Exceptional 10.9% |
| Immigrants | Ireland | 99.9 /100 | #6 | Exceptional 11.0% |
| Assyrians/Chaldeans/Syriacs | 99.9 /100 | #7 | Exceptional 11.0% |
| Immigrants | South Central Asia | 99.9 /100 | #8 | Exceptional 11.1% |
| Bulgarians | 99.9 /100 | #9 | Exceptional 11.1% |
| Immigrants | Hong Kong | 99.9 /100 | #10 | Exceptional 11.2% |
| Maltese | 99.9 /100 | #11 | Exceptional 11.2% |
| Bhutanese | 99.9 /100 | #12 | Exceptional 11.3% |
| Immigrants | Lithuania | 99.9 /100 | #13 | Exceptional 11.3% |
| Lithuanians | 99.8 /100 | #14 | Exceptional 11.4% |
| Latvians | 99.8 /100 | #15 | Exceptional 11.4% |
| Immigrants | Bolivia | 99.8 /100 | #16 | Exceptional 11.5% |
| Bolivians | 99.8 /100 | #17 | Exceptional 11.5% |