Argentinean vs Immigrants from Sudan Female Poverty
COMPARE
Argentinean
Immigrants from Sudan
Female Poverty
Female Poverty Comparison
Argentineans
Immigrants from Sudan
12.8%
FEMALE POVERTY
89.1/ 100
METRIC RATING
125th/ 347
METRIC RANK
15.2%
FEMALE POVERTY
0.4/ 100
METRIC RATING
241st/ 347
METRIC RANK
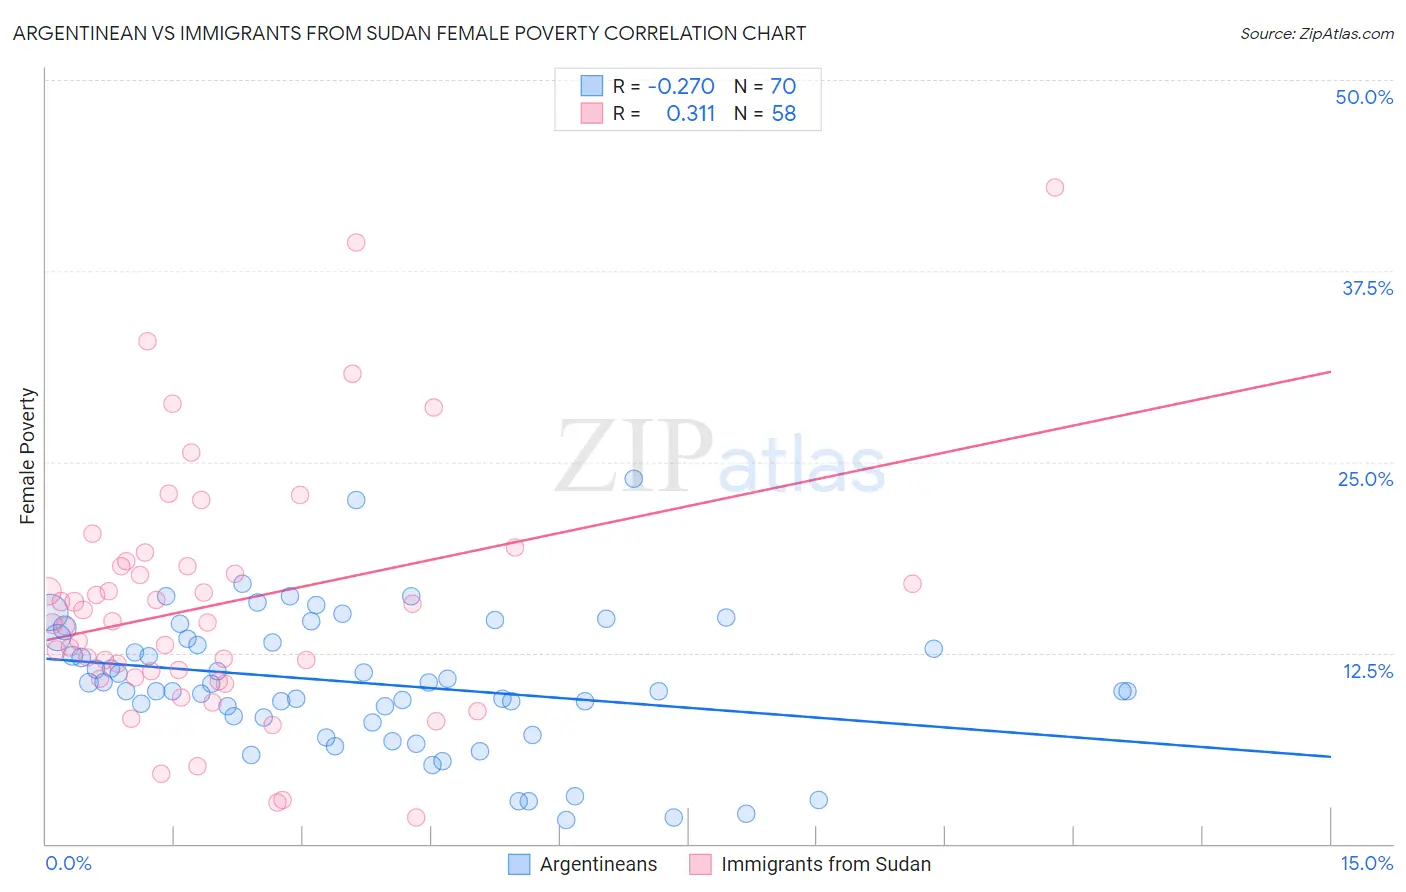
Argentinean vs Immigrants from Sudan Female Poverty Correlation Chart
The statistical analysis conducted on geographies consisting of 296,942,880 people shows a weak negative correlation between the proportion of Argentineans and poverty level among females in the United States with a correlation coefficient (R) of -0.270 and weighted average of 12.8%. Similarly, the statistical analysis conducted on geographies consisting of 118,954,745 people shows a mild positive correlation between the proportion of Immigrants from Sudan and poverty level among females in the United States with a correlation coefficient (R) of 0.311 and weighted average of 15.2%, a difference of 19.3%.
Female Poverty Correlation Summary
| Measurement | Argentinean | Immigrants from Sudan |
| Minimum | 1.6% | 1.7% |
| Maximum | 23.9% | 43.0% |
| Range | 22.4% | 41.3% |
| Mean | 10.5% | 15.7% |
| Median | 10.2% | 14.5% |
| Interquartile 25% (IQ1) | 8.3% | 10.9% |
| Interquartile 75% (IQ3) | 13.4% | 18.2% |
| Interquartile Range (IQR) | 5.2% | 7.3% |
| Standard Deviation (Sample) | 4.5% | 8.2% |
| Standard Deviation (Population) | 4.4% | 8.1% |
Similar Demographics by Female Poverty
Demographics Similar to Argentineans by Female Poverty
In terms of female poverty, the demographic groups most similar to Argentineans are Immigrants from Norway (12.8%, a difference of 0.050%), Immigrants from Ukraine (12.8%, a difference of 0.070%), South African (12.8%, a difference of 0.18%), Immigrants from Belarus (12.8%, a difference of 0.22%), and Immigrants from South Eastern Asia (12.7%, a difference of 0.23%).
| Demographics | Rating | Rank | Female Poverty |
| Sri Lankans | 90.9 /100 | #118 | Exceptional 12.7% |
| Albanians | 90.8 /100 | #119 | Exceptional 12.7% |
| New Zealanders | 90.6 /100 | #120 | Exceptional 12.7% |
| Immigrants | Hungary | 90.3 /100 | #121 | Exceptional 12.7% |
| French Canadians | 90.2 /100 | #122 | Exceptional 12.7% |
| Immigrants | South Eastern Asia | 89.9 /100 | #123 | Excellent 12.7% |
| Immigrants | Norway | 89.3 /100 | #124 | Excellent 12.8% |
| Argentineans | 89.1 /100 | #125 | Excellent 12.8% |
| Immigrants | Ukraine | 88.8 /100 | #126 | Excellent 12.8% |
| South Africans | 88.4 /100 | #127 | Excellent 12.8% |
| Immigrants | Belarus | 88.2 /100 | #128 | Excellent 12.8% |
| Immigrants | Brazil | 87.9 /100 | #129 | Excellent 12.8% |
| Immigrants | Vietnam | 87.1 /100 | #130 | Excellent 12.8% |
| Immigrants | Argentina | 87.0 /100 | #131 | Excellent 12.8% |
| Immigrants | Jordan | 86.9 /100 | #132 | Excellent 12.8% |
Demographics Similar to Immigrants from Sudan by Female Poverty
In terms of female poverty, the demographic groups most similar to Immigrants from Sudan are Nepalese (15.2%, a difference of 0.12%), Sudanese (15.2%, a difference of 0.25%), Immigrants from Middle Africa (15.2%, a difference of 0.30%), Nicaraguan (15.3%, a difference of 0.36%), and Ecuadorian (15.3%, a difference of 0.41%).
| Demographics | Rating | Rank | Female Poverty |
| Fijians | 1.1 /100 | #234 | Tragic 14.9% |
| Immigrants | Laos | 0.9 /100 | #235 | Tragic 15.0% |
| Cree | 0.7 /100 | #236 | Tragic 15.1% |
| French American Indians | 0.6 /100 | #237 | Tragic 15.1% |
| Immigrants | Armenia | 0.6 /100 | #238 | Tragic 15.1% |
| Immigrants | Middle Africa | 0.5 /100 | #239 | Tragic 15.2% |
| Sudanese | 0.5 /100 | #240 | Tragic 15.2% |
| Immigrants | Sudan | 0.4 /100 | #241 | Tragic 15.2% |
| Nepalese | 0.4 /100 | #242 | Tragic 15.2% |
| Nicaraguans | 0.3 /100 | #243 | Tragic 15.3% |
| Ecuadorians | 0.3 /100 | #244 | Tragic 15.3% |
| Spanish American Indians | 0.3 /100 | #245 | Tragic 15.3% |
| Cubans | 0.3 /100 | #246 | Tragic 15.3% |
| Potawatomi | 0.3 /100 | #247 | Tragic 15.3% |
| Immigrants | Ghana | 0.3 /100 | #248 | Tragic 15.3% |