Alsatian vs Cheyenne Receiving Food Stamps
COMPARE
Alsatian
Cheyenne
Receiving Food Stamps
Receiving Food Stamps Comparison
Alsatians
Cheyenne
11.4%
RECEIVING FOOD STAMPS
68.0/ 100
METRIC RATING
162nd/ 347
METRIC RANK
14.3%
RECEIVING FOOD STAMPS
0.2/ 100
METRIC RATING
266th/ 347
METRIC RANK
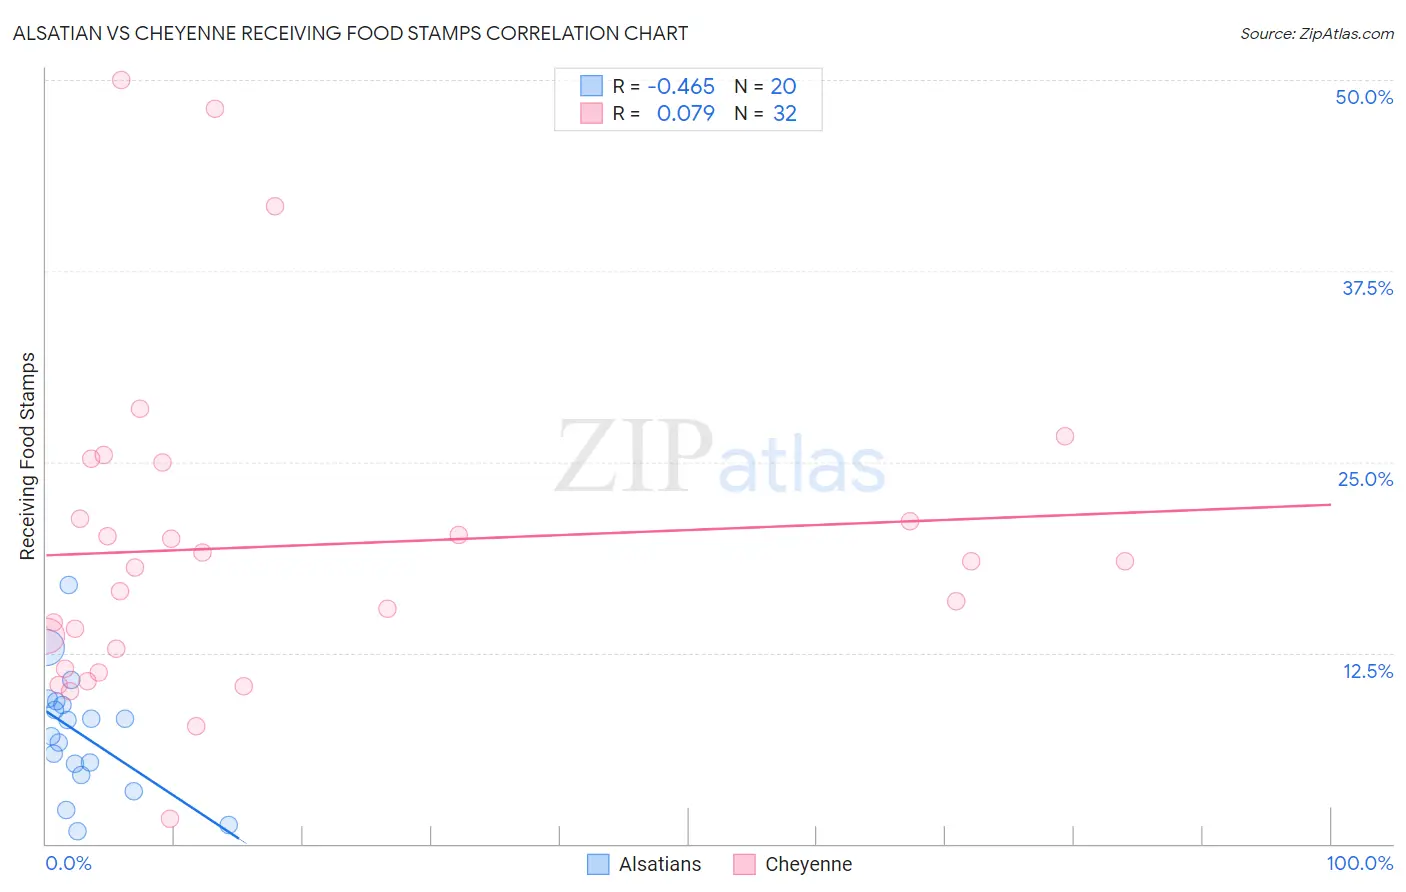
Alsatian vs Cheyenne Receiving Food Stamps Correlation Chart
The statistical analysis conducted on geographies consisting of 82,623,919 people shows a moderate negative correlation between the proportion of Alsatians and percentage of population receiving government assistance and/or food stamps in the United States with a correlation coefficient (R) of -0.465 and weighted average of 11.4%. Similarly, the statistical analysis conducted on geographies consisting of 80,695,470 people shows a slight positive correlation between the proportion of Cheyenne and percentage of population receiving government assistance and/or food stamps in the United States with a correlation coefficient (R) of 0.079 and weighted average of 14.3%, a difference of 25.1%.
Receiving Food Stamps Correlation Summary
| Measurement | Alsatian | Cheyenne |
| Minimum | 0.80% | 1.6% |
| Maximum | 16.9% | 50.0% |
| Range | 16.1% | 48.4% |
| Mean | 7.2% | 19.5% |
| Median | 7.6% | 18.3% |
| Interquartile 25% (IQ1) | 4.8% | 12.1% |
| Interquartile 75% (IQ3) | 9.2% | 23.2% |
| Interquartile Range (IQR) | 4.4% | 11.0% |
| Standard Deviation (Sample) | 3.9% | 10.8% |
| Standard Deviation (Population) | 3.8% | 10.6% |
Similar Demographics by Receiving Food Stamps
Demographics Similar to Alsatians by Receiving Food Stamps
In terms of receiving food stamps, the demographic groups most similar to Alsatians are Pennsylvania German (11.4%, a difference of 0.060%), French Canadian (11.4%, a difference of 0.25%), Immigrants from Southern Europe (11.5%, a difference of 0.37%), Immigrants from Oceania (11.4%, a difference of 0.41%), and Immigrants from Chile (11.5%, a difference of 0.48%).
| Demographics | Rating | Rank | Receiving Food Stamps |
| Immigrants | Argentina | 80.4 /100 | #155 | Excellent 11.2% |
| Immigrants | Afghanistan | 75.6 /100 | #156 | Good 11.3% |
| Immigrants | Lebanon | 75.2 /100 | #157 | Good 11.3% |
| Immigrants | Bosnia and Herzegovina | 72.6 /100 | #158 | Good 11.3% |
| Immigrants | Oceania | 70.4 /100 | #159 | Good 11.4% |
| French Canadians | 69.5 /100 | #160 | Good 11.4% |
| Pennsylvania Germans | 68.4 /100 | #161 | Good 11.4% |
| Alsatians | 68.0 /100 | #162 | Good 11.4% |
| Immigrants | Southern Europe | 65.8 /100 | #163 | Good 11.5% |
| Immigrants | Chile | 65.0 /100 | #164 | Good 11.5% |
| Arabs | 64.7 /100 | #165 | Good 11.5% |
| Immigrants | Belarus | 62.8 /100 | #166 | Good 11.5% |
| Kenyans | 60.2 /100 | #167 | Good 11.6% |
| Tlingit-Haida | 59.1 /100 | #168 | Average 11.6% |
| Immigrants | Eastern Africa | 58.3 /100 | #169 | Average 11.6% |
Demographics Similar to Cheyenne by Receiving Food Stamps
In terms of receiving food stamps, the demographic groups most similar to Cheyenne are Blackfeet (14.3%, a difference of 0.080%), Immigrants from Uzbekistan (14.3%, a difference of 0.14%), Dutch West Indian (14.3%, a difference of 0.22%), Paiute (14.3%, a difference of 0.23%), and Immigrants from Portugal (14.3%, a difference of 0.23%).
| Demographics | Rating | Rank | Receiving Food Stamps |
| Creek | 0.3 /100 | #259 | Tragic 14.1% |
| Central Americans | 0.3 /100 | #260 | Tragic 14.1% |
| Immigrants | Congo | 0.3 /100 | #261 | Tragic 14.1% |
| Paiute | 0.2 /100 | #262 | Tragic 14.3% |
| Immigrants | Portugal | 0.2 /100 | #263 | Tragic 14.3% |
| Immigrants | Uzbekistan | 0.2 /100 | #264 | Tragic 14.3% |
| Blackfeet | 0.2 /100 | #265 | Tragic 14.3% |
| Cheyenne | 0.2 /100 | #266 | Tragic 14.3% |
| Dutch West Indians | 0.2 /100 | #267 | Tragic 14.3% |
| Guatemalans | 0.1 /100 | #268 | Tragic 14.4% |
| Nepalese | 0.1 /100 | #269 | Tragic 14.6% |
| Mexicans | 0.1 /100 | #270 | Tragic 14.6% |
| Immigrants | Guatemala | 0.1 /100 | #271 | Tragic 14.6% |
| Chippewa | 0.1 /100 | #272 | Tragic 14.7% |
| Alaskan Athabascans | 0.1 /100 | #273 | Tragic 14.7% |