Immigrants from South Africa vs Cheyenne Receiving Food Stamps
COMPARE
Immigrants from South Africa
Cheyenne
Receiving Food Stamps
Receiving Food Stamps Comparison
Immigrants from South Africa
Cheyenne
9.7%
RECEIVING FOOD STAMPS
99.3/ 100
METRIC RATING
52nd/ 347
METRIC RANK
14.3%
RECEIVING FOOD STAMPS
0.2/ 100
METRIC RATING
266th/ 347
METRIC RANK
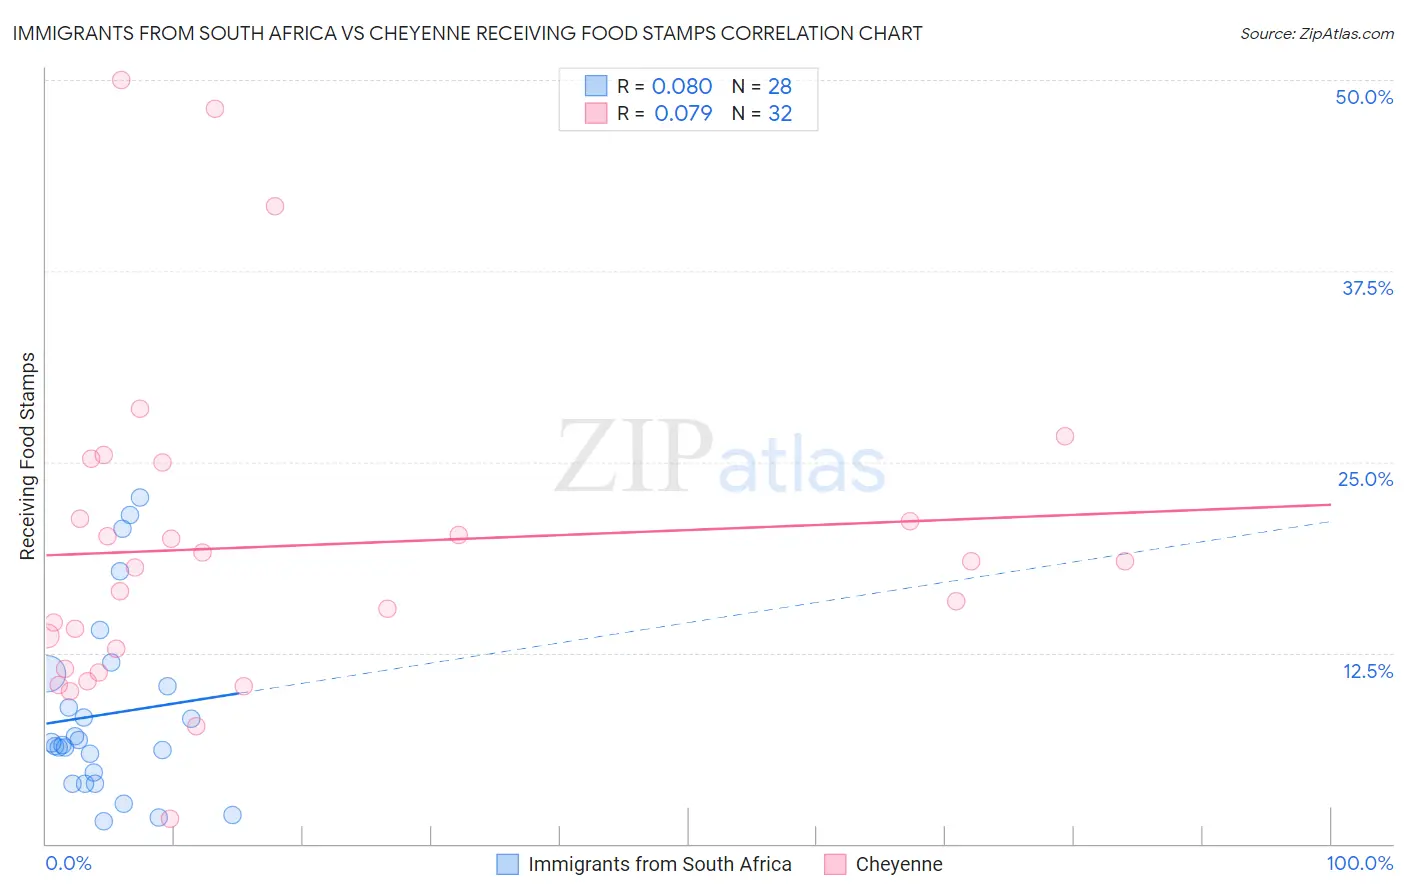
Immigrants from South Africa vs Cheyenne Receiving Food Stamps Correlation Chart
The statistical analysis conducted on geographies consisting of 232,853,453 people shows a slight positive correlation between the proportion of Immigrants from South Africa and percentage of population receiving government assistance and/or food stamps in the United States with a correlation coefficient (R) of 0.080 and weighted average of 9.7%. Similarly, the statistical analysis conducted on geographies consisting of 80,695,470 people shows a slight positive correlation between the proportion of Cheyenne and percentage of population receiving government assistance and/or food stamps in the United States with a correlation coefficient (R) of 0.079 and weighted average of 14.3%, a difference of 47.6%.
Receiving Food Stamps Correlation Summary
| Measurement | Immigrants from South Africa | Cheyenne |
| Minimum | 1.5% | 1.6% |
| Maximum | 22.6% | 50.0% |
| Range | 21.1% | 48.4% |
| Mean | 8.5% | 19.5% |
| Median | 6.5% | 18.3% |
| Interquartile 25% (IQ1) | 4.3% | 12.1% |
| Interquartile 75% (IQ3) | 10.7% | 23.2% |
| Interquartile Range (IQR) | 6.4% | 11.0% |
| Standard Deviation (Sample) | 5.9% | 10.8% |
| Standard Deviation (Population) | 5.8% | 10.6% |
Similar Demographics by Receiving Food Stamps
Demographics Similar to Immigrants from South Africa by Receiving Food Stamps
In terms of receiving food stamps, the demographic groups most similar to Immigrants from South Africa are Asian (9.7%, a difference of 0.010%), Tongan (9.7%, a difference of 0.010%), Swiss (9.7%, a difference of 0.13%), Immigrants from Switzerland (9.7%, a difference of 0.14%), and Lithuanian (9.7%, a difference of 0.19%).
| Demographics | Rating | Rank | Receiving Food Stamps |
| Immigrants | Belgium | 99.4 /100 | #45 | Exceptional 9.6% |
| Australians | 99.4 /100 | #46 | Exceptional 9.6% |
| Indians (Asian) | 99.4 /100 | #47 | Exceptional 9.6% |
| Russians | 99.4 /100 | #48 | Exceptional 9.6% |
| Immigrants | Czechoslovakia | 99.4 /100 | #49 | Exceptional 9.6% |
| Lithuanians | 99.4 /100 | #50 | Exceptional 9.7% |
| Asians | 99.3 /100 | #51 | Exceptional 9.7% |
| Immigrants | South Africa | 99.3 /100 | #52 | Exceptional 9.7% |
| Tongans | 99.3 /100 | #53 | Exceptional 9.7% |
| Swiss | 99.3 /100 | #54 | Exceptional 9.7% |
| Immigrants | Switzerland | 99.3 /100 | #55 | Exceptional 9.7% |
| Immigrants | Canada | 99.3 /100 | #56 | Exceptional 9.7% |
| Greeks | 99.3 /100 | #57 | Exceptional 9.7% |
| Scandinavians | 99.2 /100 | #58 | Exceptional 9.7% |
| British | 99.2 /100 | #59 | Exceptional 9.7% |
Demographics Similar to Cheyenne by Receiving Food Stamps
In terms of receiving food stamps, the demographic groups most similar to Cheyenne are Blackfeet (14.3%, a difference of 0.080%), Immigrants from Uzbekistan (14.3%, a difference of 0.14%), Dutch West Indian (14.3%, a difference of 0.22%), Paiute (14.3%, a difference of 0.23%), and Immigrants from Portugal (14.3%, a difference of 0.23%).
| Demographics | Rating | Rank | Receiving Food Stamps |
| Creek | 0.3 /100 | #259 | Tragic 14.1% |
| Central Americans | 0.3 /100 | #260 | Tragic 14.1% |
| Immigrants | Congo | 0.3 /100 | #261 | Tragic 14.1% |
| Paiute | 0.2 /100 | #262 | Tragic 14.3% |
| Immigrants | Portugal | 0.2 /100 | #263 | Tragic 14.3% |
| Immigrants | Uzbekistan | 0.2 /100 | #264 | Tragic 14.3% |
| Blackfeet | 0.2 /100 | #265 | Tragic 14.3% |
| Cheyenne | 0.2 /100 | #266 | Tragic 14.3% |
| Dutch West Indians | 0.2 /100 | #267 | Tragic 14.3% |
| Guatemalans | 0.1 /100 | #268 | Tragic 14.4% |
| Nepalese | 0.1 /100 | #269 | Tragic 14.6% |
| Mexicans | 0.1 /100 | #270 | Tragic 14.6% |
| Immigrants | Guatemala | 0.1 /100 | #271 | Tragic 14.6% |
| Chippewa | 0.1 /100 | #272 | Tragic 14.7% |
| Alaskan Athabascans | 0.1 /100 | #273 | Tragic 14.7% |