Aleut vs Ecuadorian Female Poverty
COMPARE
Aleut
Ecuadorian
Female Poverty
Female Poverty Comparison
Aleuts
Ecuadorians
13.4%
FEMALE POVERTY
56.7/ 100
METRIC RATING
168th/ 347
METRIC RANK
15.3%
FEMALE POVERTY
0.3/ 100
METRIC RATING
244th/ 347
METRIC RANK
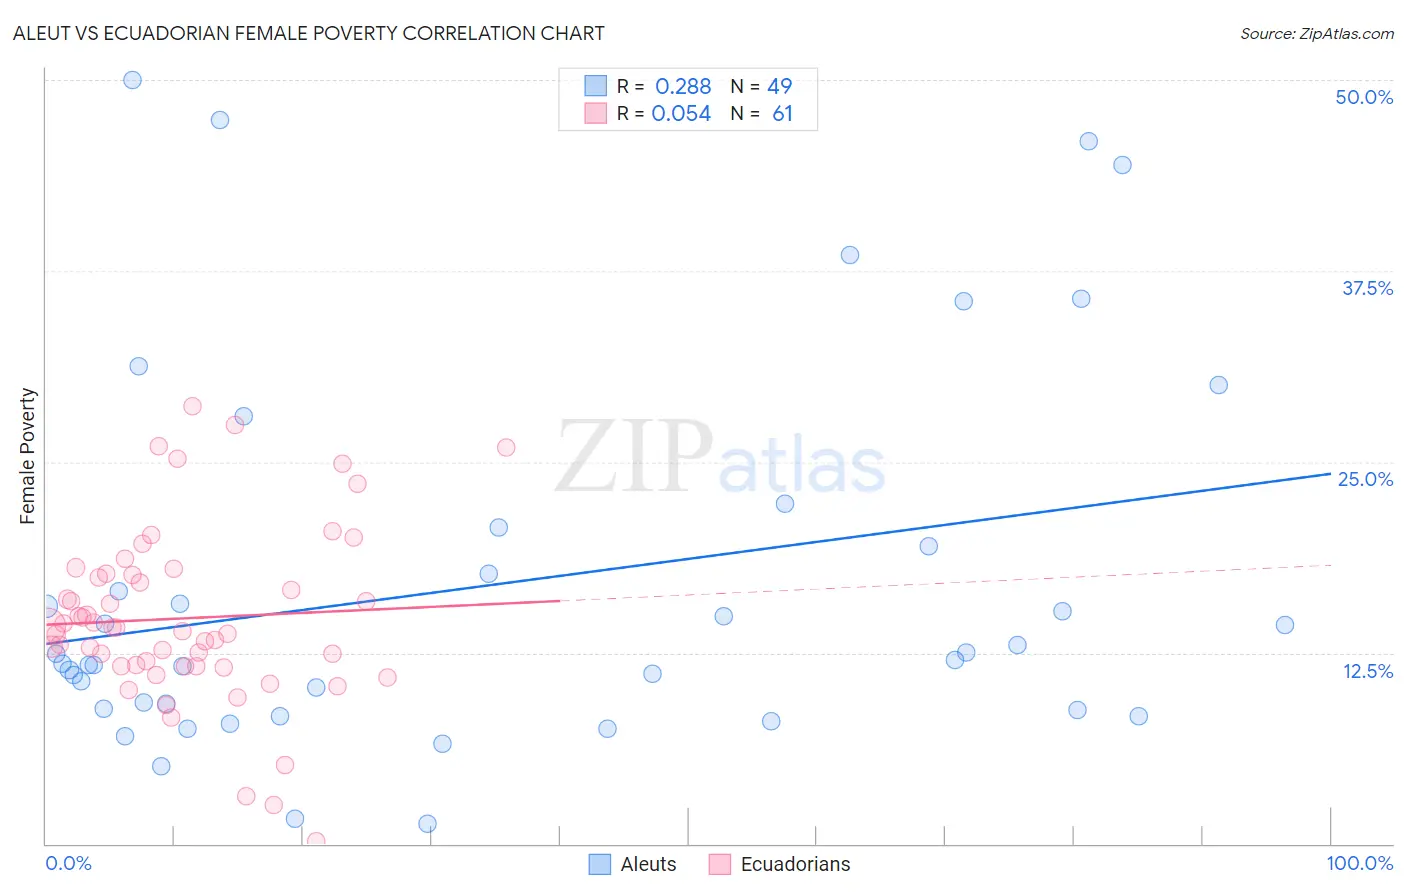
Aleut vs Ecuadorian Female Poverty Correlation Chart
The statistical analysis conducted on geographies consisting of 61,771,544 people shows a weak positive correlation between the proportion of Aleuts and poverty level among females in the United States with a correlation coefficient (R) of 0.288 and weighted average of 13.4%. Similarly, the statistical analysis conducted on geographies consisting of 317,585,196 people shows a slight positive correlation between the proportion of Ecuadorians and poverty level among females in the United States with a correlation coefficient (R) of 0.054 and weighted average of 15.3%, a difference of 14.4%.
Female Poverty Correlation Summary
| Measurement | Aleut | Ecuadorian |
| Minimum | 1.3% | 0.14% |
| Maximum | 50.0% | 28.7% |
| Range | 48.7% | 28.5% |
| Mean | 16.9% | 14.8% |
| Median | 12.0% | 14.1% |
| Interquartile 25% (IQ1) | 8.8% | 11.7% |
| Interquartile 75% (IQ3) | 20.1% | 17.6% |
| Interquartile Range (IQR) | 11.3% | 5.9% |
| Standard Deviation (Sample) | 12.3% | 5.7% |
| Standard Deviation (Population) | 12.2% | 5.7% |
Similar Demographics by Female Poverty
Demographics Similar to Aleuts by Female Poverty
In terms of female poverty, the demographic groups most similar to Aleuts are Immigrants from Chile (13.3%, a difference of 0.060%), Lebanese (13.4%, a difference of 0.080%), Colombian (13.4%, a difference of 0.10%), White/Caucasian (13.4%, a difference of 0.21%), and Immigrants from Oceania (13.3%, a difference of 0.30%).
| Demographics | Rating | Rank | Female Poverty |
| Immigrants | Ethiopia | 62.5 /100 | #161 | Good 13.3% |
| Guamanians/Chamorros | 62.4 /100 | #162 | Good 13.3% |
| Immigrants | Albania | 62.4 /100 | #163 | Good 13.3% |
| Ethiopians | 62.3 /100 | #164 | Good 13.3% |
| Scotch-Irish | 62.1 /100 | #165 | Good 13.3% |
| Immigrants | Oceania | 59.7 /100 | #166 | Average 13.3% |
| Immigrants | Chile | 57.4 /100 | #167 | Average 13.3% |
| Aleuts | 56.7 /100 | #168 | Average 13.4% |
| Lebanese | 55.9 /100 | #169 | Average 13.4% |
| Colombians | 55.7 /100 | #170 | Average 13.4% |
| Whites/Caucasians | 54.6 /100 | #171 | Average 13.4% |
| Mongolians | 53.6 /100 | #172 | Average 13.4% |
| Immigrants | Afghanistan | 50.8 /100 | #173 | Average 13.4% |
| Immigrants | Iraq | 50.0 /100 | #174 | Average 13.4% |
| Celtics | 49.9 /100 | #175 | Average 13.4% |
Demographics Similar to Ecuadorians by Female Poverty
In terms of female poverty, the demographic groups most similar to Ecuadorians are Nicaraguan (15.3%, a difference of 0.050%), Spanish American Indian (15.3%, a difference of 0.090%), Cuban (15.3%, a difference of 0.15%), Potawatomi (15.3%, a difference of 0.16%), and Immigrants from Ghana (15.3%, a difference of 0.16%).
| Demographics | Rating | Rank | Female Poverty |
| French American Indians | 0.6 /100 | #237 | Tragic 15.1% |
| Immigrants | Armenia | 0.6 /100 | #238 | Tragic 15.1% |
| Immigrants | Middle Africa | 0.5 /100 | #239 | Tragic 15.2% |
| Sudanese | 0.5 /100 | #240 | Tragic 15.2% |
| Immigrants | Sudan | 0.4 /100 | #241 | Tragic 15.2% |
| Nepalese | 0.4 /100 | #242 | Tragic 15.2% |
| Nicaraguans | 0.3 /100 | #243 | Tragic 15.3% |
| Ecuadorians | 0.3 /100 | #244 | Tragic 15.3% |
| Spanish American Indians | 0.3 /100 | #245 | Tragic 15.3% |
| Cubans | 0.3 /100 | #246 | Tragic 15.3% |
| Potawatomi | 0.3 /100 | #247 | Tragic 15.3% |
| Immigrants | Ghana | 0.3 /100 | #248 | Tragic 15.3% |
| Salvadorans | 0.3 /100 | #249 | Tragic 15.3% |
| Immigrants | Western Africa | 0.3 /100 | #250 | Tragic 15.3% |
| Immigrants | Trinidad and Tobago | 0.3 /100 | #251 | Tragic 15.4% |