Alaska Native vs Crow In Labor Force | Age 45-54
COMPARE
Alaska Native
Crow
In Labor Force | Age 45-54
In Labor Force | Age 45-54 Comparison
Alaska Natives
Crow
81.8%
IN LABOR FORCE | AGE 45-54
0.4/ 100
METRIC RATING
245th/ 347
METRIC RANK
78.3%
IN LABOR FORCE | AGE 45-54
0.0/ 100
METRIC RATING
322nd/ 347
METRIC RANK
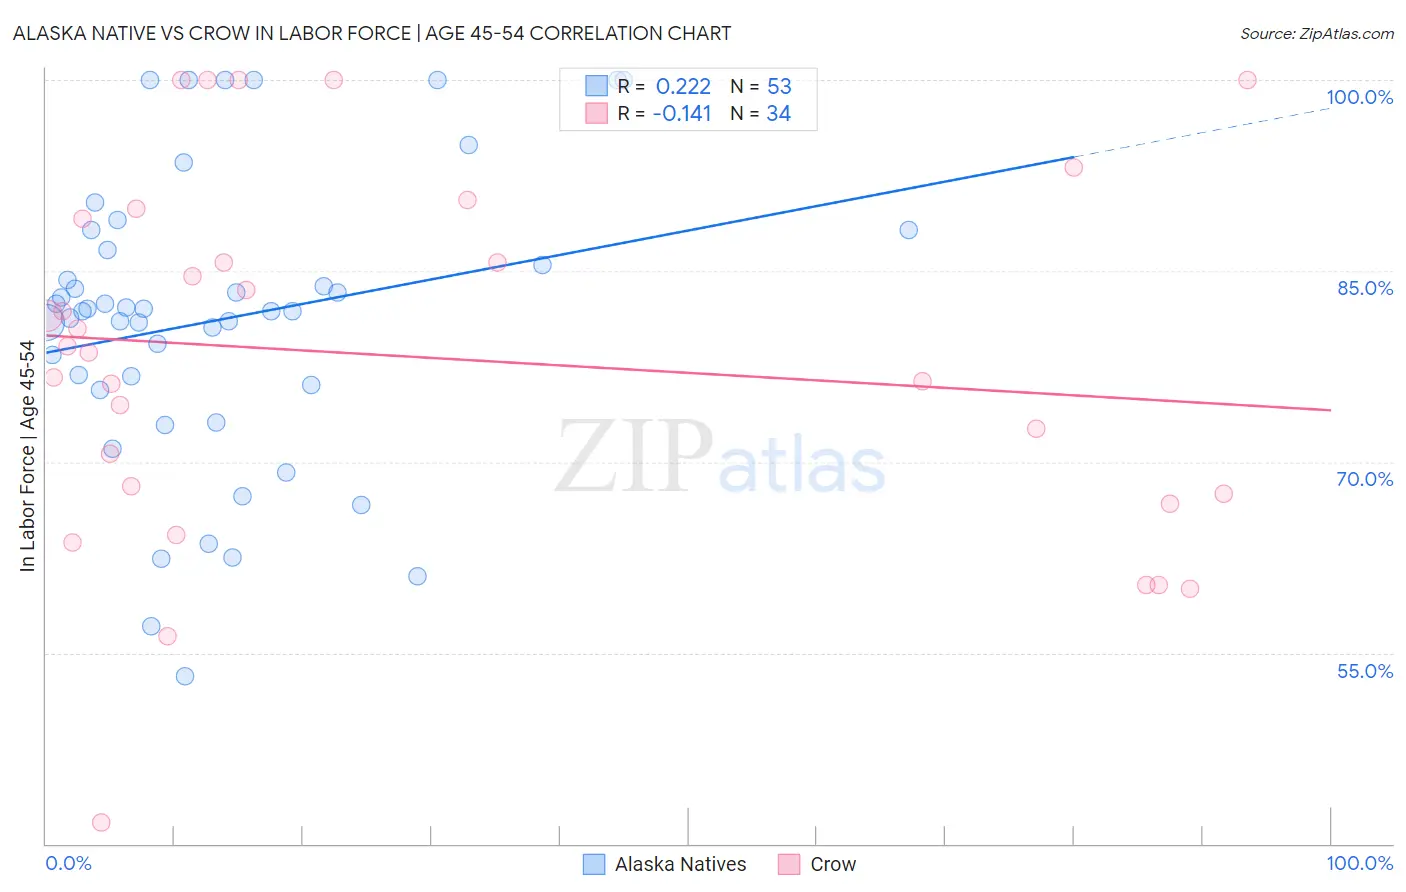
Alaska Native vs Crow In Labor Force | Age 45-54 Correlation Chart
The statistical analysis conducted on geographies consisting of 76,757,853 people shows a weak positive correlation between the proportion of Alaska Natives and labor force participation rate among population between the ages 45 and 54 in the United States with a correlation coefficient (R) of 0.222 and weighted average of 81.8%. Similarly, the statistical analysis conducted on geographies consisting of 59,202,110 people shows a poor negative correlation between the proportion of Crow and labor force participation rate among population between the ages 45 and 54 in the United States with a correlation coefficient (R) of -0.141 and weighted average of 78.3%, a difference of 4.4%.
In Labor Force | Age 45-54 Correlation Summary
| Measurement | Alaska Native | Crow |
| Minimum | 53.1% | 41.7% |
| Maximum | 100.0% | 100.0% |
| Range | 46.9% | 58.3% |
| Mean | 81.2% | 78.2% |
| Median | 81.8% | 78.8% |
| Interquartile 25% (IQ1) | 75.8% | 67.5% |
| Interquartile 75% (IQ3) | 87.4% | 89.1% |
| Interquartile Range (IQR) | 11.6% | 21.6% |
| Standard Deviation (Sample) | 11.5% | 14.4% |
| Standard Deviation (Population) | 11.4% | 14.2% |
Similar Demographics by In Labor Force | Age 45-54
Demographics Similar to Alaska Natives by In Labor Force | Age 45-54
In terms of in labor force | age 45-54, the demographic groups most similar to Alaska Natives are Celtic (81.8%, a difference of 0.010%), Alaskan Athabascan (81.8%, a difference of 0.010%), Central American (81.7%, a difference of 0.020%), Puget Sound Salish (81.7%, a difference of 0.050%), and Hmong (81.7%, a difference of 0.070%).
| Demographics | Rating | Rank | In Labor Force | Age 45-54 |
| Trinidadians and Tobagonians | 1.1 /100 | #238 | Tragic 81.9% |
| Immigrants | Thailand | 1.0 /100 | #239 | Tragic 81.9% |
| Immigrants | El Salvador | 1.0 /100 | #240 | Tragic 81.9% |
| Immigrants | Cambodia | 0.8 /100 | #241 | Tragic 81.9% |
| Whites/Caucasians | 0.7 /100 | #242 | Tragic 81.9% |
| Samoans | 0.6 /100 | #243 | Tragic 81.8% |
| Celtics | 0.4 /100 | #244 | Tragic 81.8% |
| Alaska Natives | 0.4 /100 | #245 | Tragic 81.8% |
| Alaskan Athabascans | 0.4 /100 | #246 | Tragic 81.8% |
| Central Americans | 0.4 /100 | #247 | Tragic 81.7% |
| Puget Sound Salish | 0.3 /100 | #248 | Tragic 81.7% |
| Hmong | 0.3 /100 | #249 | Tragic 81.7% |
| Immigrants | Armenia | 0.2 /100 | #250 | Tragic 81.7% |
| Guamanians/Chamorros | 0.2 /100 | #251 | Tragic 81.6% |
| Pennsylvania Germans | 0.2 /100 | #252 | Tragic 81.6% |
Demographics Similar to Crow by In Labor Force | Age 45-54
In terms of in labor force | age 45-54, the demographic groups most similar to Crow are Kiowa (78.3%, a difference of 0.080%), Dutch West Indian (78.2%, a difference of 0.10%), Choctaw (78.2%, a difference of 0.20%), Seminole (78.1%, a difference of 0.24%), and Cajun (78.1%, a difference of 0.25%).
| Demographics | Rating | Rank | In Labor Force | Age 45-54 |
| Blacks/African Americans | 0.0 /100 | #315 | Tragic 79.3% |
| Shoshone | 0.0 /100 | #316 | Tragic 79.3% |
| Comanche | 0.0 /100 | #317 | Tragic 79.2% |
| Chickasaw | 0.0 /100 | #318 | Tragic 79.0% |
| Cherokee | 0.0 /100 | #319 | Tragic 79.0% |
| Yaqui | 0.0 /100 | #320 | Tragic 78.9% |
| Yup'ik | 0.0 /100 | #321 | Tragic 78.6% |
| Crow | 0.0 /100 | #322 | Tragic 78.3% |
| Kiowa | 0.0 /100 | #323 | Tragic 78.3% |
| Dutch West Indians | 0.0 /100 | #324 | Tragic 78.2% |
| Choctaw | 0.0 /100 | #325 | Tragic 78.2% |
| Seminole | 0.0 /100 | #326 | Tragic 78.1% |
| Cajuns | 0.0 /100 | #327 | Tragic 78.1% |
| Sioux | 0.0 /100 | #328 | Tragic 78.0% |
| Creek | 0.0 /100 | #329 | Tragic 77.7% |