Afghan vs Spaniard Child Poverty Under the Age of 16
COMPARE
Afghan
Spaniard
Child Poverty Under the Age of 16
Child Poverty Under the Age of 16 Comparison
Afghans
Spaniards
16.2%
CHILD POVERTY UNDER THE AGE OF 16
52.3/ 100
METRIC RATING
172nd/ 347
METRIC RANK
16.8%
CHILD POVERTY UNDER THE AGE OF 16
23.2/ 100
METRIC RATING
193rd/ 347
METRIC RANK
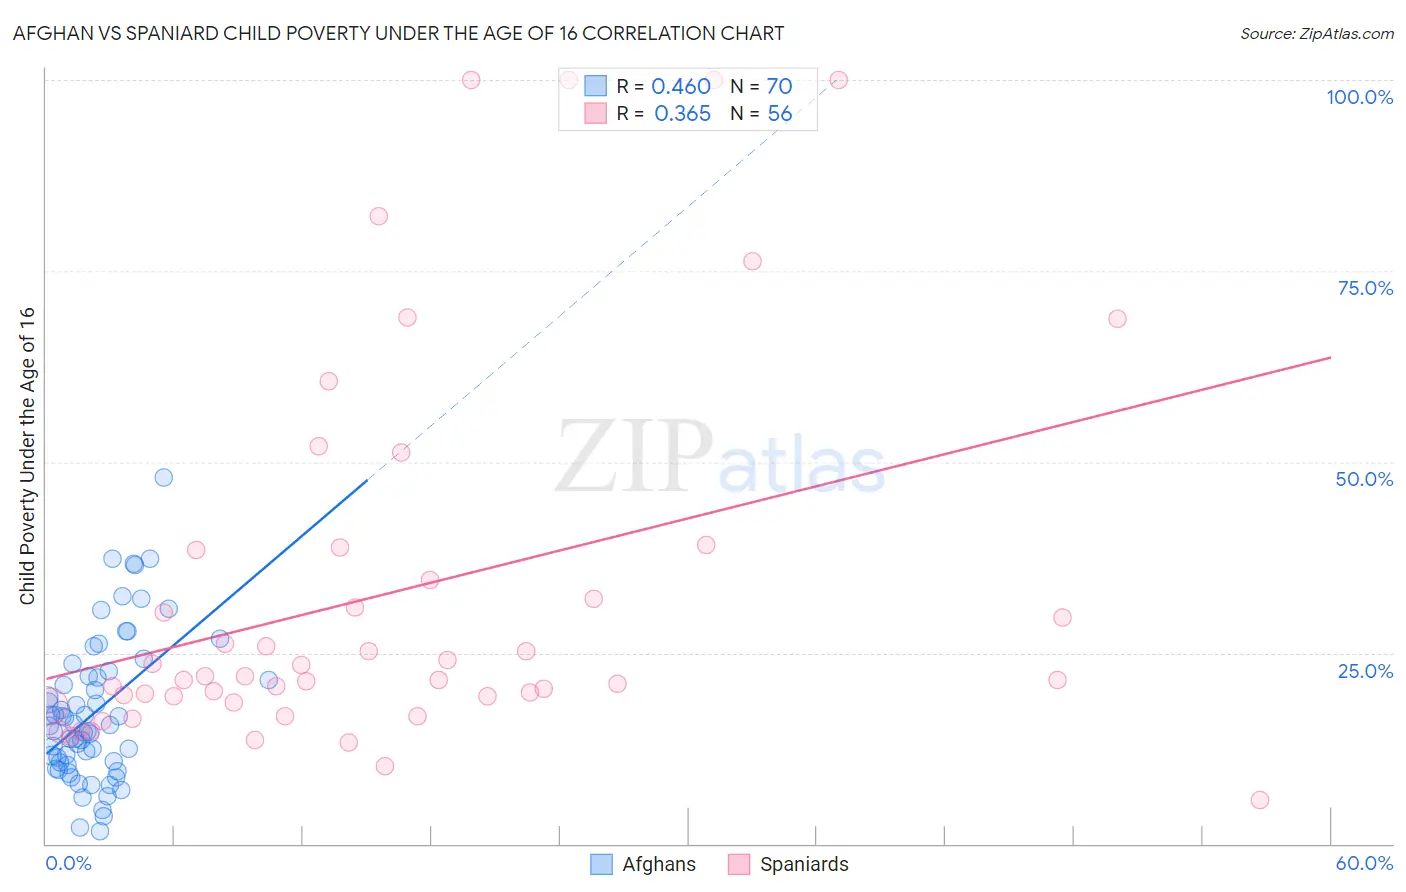
Afghan vs Spaniard Child Poverty Under the Age of 16 Correlation Chart
The statistical analysis conducted on geographies consisting of 148,458,786 people shows a moderate positive correlation between the proportion of Afghans and poverty level among children under the age of 16 in the United States with a correlation coefficient (R) of 0.460 and weighted average of 16.2%. Similarly, the statistical analysis conducted on geographies consisting of 438,691,641 people shows a mild positive correlation between the proportion of Spaniards and poverty level among children under the age of 16 in the United States with a correlation coefficient (R) of 0.365 and weighted average of 16.8%, a difference of 3.9%.
Child Poverty Under the Age of 16 Correlation Summary
| Measurement | Afghan | Spaniard |
| Minimum | 1.6% | 5.7% |
| Maximum | 48.0% | 100.0% |
| Range | 46.4% | 94.3% |
| Mean | 17.3% | 32.9% |
| Median | 15.5% | 21.7% |
| Interquartile 25% (IQ1) | 10.6% | 18.9% |
| Interquartile 75% (IQ3) | 21.9% | 36.5% |
| Interquartile Range (IQR) | 11.3% | 17.7% |
| Standard Deviation (Sample) | 9.5% | 25.0% |
| Standard Deviation (Population) | 9.4% | 24.7% |
Similar Demographics by Child Poverty Under the Age of 16
Demographics Similar to Afghans by Child Poverty Under the Age of 16
In terms of child poverty under the age of 16, the demographic groups most similar to Afghans are Hungarian (16.2%, a difference of 0.020%), Immigrants from Saudi Arabia (16.2%, a difference of 0.020%), Immigrants from Colombia (16.1%, a difference of 0.26%), White/Caucasian (16.2%, a difference of 0.27%), and Uruguayan (16.1%, a difference of 0.29%).
| Demographics | Rating | Rank | Child Poverty Under the Age of 16 |
| Guamanians/Chamorros | 66.4 /100 | #165 | Good 15.9% |
| Immigrants | Oceania | 65.4 /100 | #166 | Good 15.9% |
| Costa Ricans | 61.1 /100 | #167 | Good 16.0% |
| South Americans | 57.9 /100 | #168 | Average 16.0% |
| Uruguayans | 54.7 /100 | #169 | Average 16.1% |
| Immigrants | Colombia | 54.4 /100 | #170 | Average 16.1% |
| Hungarians | 52.5 /100 | #171 | Average 16.2% |
| Afghans | 52.3 /100 | #172 | Average 16.2% |
| Immigrants | Saudi Arabia | 52.1 /100 | #173 | Average 16.2% |
| Whites/Caucasians | 50.0 /100 | #174 | Average 16.2% |
| Scotch-Irish | 47.1 /100 | #175 | Average 16.3% |
| Lebanese | 45.9 /100 | #176 | Average 16.3% |
| Ethiopians | 43.4 /100 | #177 | Average 16.3% |
| Immigrants | Ethiopia | 42.3 /100 | #178 | Average 16.4% |
| Immigrants | Syria | 42.3 /100 | #179 | Average 16.4% |
Demographics Similar to Spaniards by Child Poverty Under the Age of 16
In terms of child poverty under the age of 16, the demographic groups most similar to Spaniards are Immigrants from Uruguay (16.8%, a difference of 0.020%), Immigrants from Uganda (16.8%, a difference of 0.11%), Immigrants from Lebanon (16.8%, a difference of 0.19%), Spanish (16.7%, a difference of 0.20%), and Immigrants from Kenya (16.9%, a difference of 0.71%).
| Demographics | Rating | Rank | Child Poverty Under the Age of 16 |
| Kenyans | 34.1 /100 | #186 | Fair 16.5% |
| Arabs | 31.4 /100 | #187 | Fair 16.6% |
| Immigrants | Morocco | 31.2 /100 | #188 | Fair 16.6% |
| Immigrants | Portugal | 30.0 /100 | #189 | Fair 16.6% |
| Immigrants | Costa Rica | 29.6 /100 | #190 | Fair 16.6% |
| Immigrants | Iraq | 28.3 /100 | #191 | Fair 16.7% |
| Spanish | 24.5 /100 | #192 | Fair 16.7% |
| Spaniards | 23.2 /100 | #193 | Fair 16.8% |
| Immigrants | Uruguay | 23.1 /100 | #194 | Fair 16.8% |
| Immigrants | Uganda | 22.5 /100 | #195 | Fair 16.8% |
| Immigrants | Lebanon | 22.0 /100 | #196 | Fair 16.8% |
| Immigrants | Kenya | 19.1 /100 | #197 | Poor 16.9% |
| Delaware | 17.1 /100 | #198 | Poor 17.0% |
| Immigrants | Afghanistan | 15.1 /100 | #199 | Poor 17.0% |
| Immigrants | Cameroon | 14.7 /100 | #200 | Poor 17.1% |