Immigrants from Guatemala vs Spaniard Child Poverty Under the Age of 16
COMPARE
Immigrants from Guatemala
Spaniard
Child Poverty Under the Age of 16
Child Poverty Under the Age of 16 Comparison
Immigrants from Guatemala
Spaniards
21.6%
CHILD POVERTY UNDER THE AGE OF 16
0.0/ 100
METRIC RATING
315th/ 347
METRIC RANK
16.8%
CHILD POVERTY UNDER THE AGE OF 16
23.2/ 100
METRIC RATING
193rd/ 347
METRIC RANK
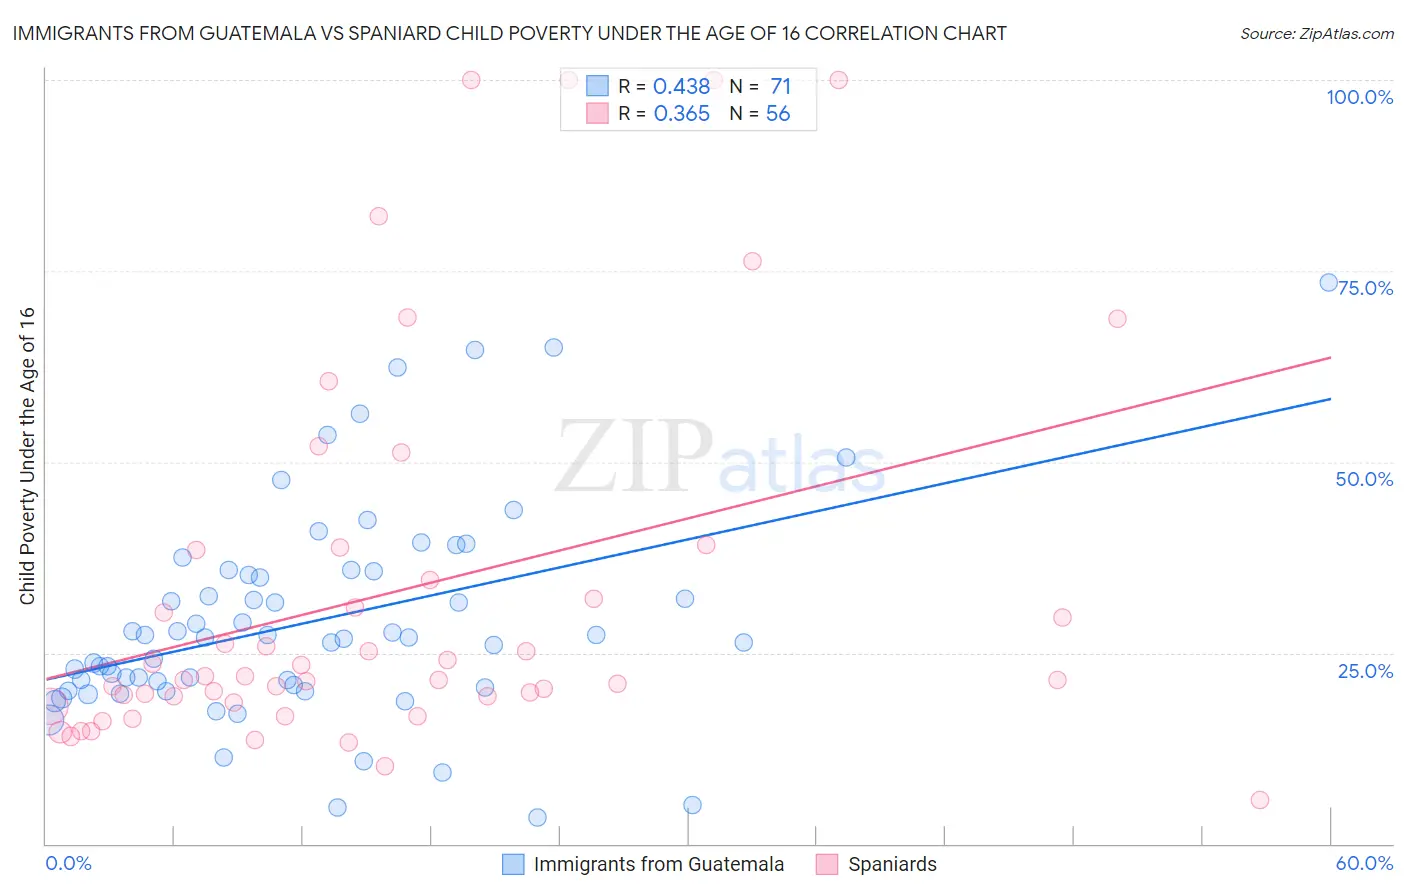
Immigrants from Guatemala vs Spaniard Child Poverty Under the Age of 16 Correlation Chart
The statistical analysis conducted on geographies consisting of 375,394,952 people shows a moderate positive correlation between the proportion of Immigrants from Guatemala and poverty level among children under the age of 16 in the United States with a correlation coefficient (R) of 0.438 and weighted average of 21.6%. Similarly, the statistical analysis conducted on geographies consisting of 438,691,641 people shows a mild positive correlation between the proportion of Spaniards and poverty level among children under the age of 16 in the United States with a correlation coefficient (R) of 0.365 and weighted average of 16.8%, a difference of 28.7%.
Child Poverty Under the Age of 16 Correlation Summary
| Measurement | Immigrants from Guatemala | Spaniard |
| Minimum | 3.4% | 5.7% |
| Maximum | 73.5% | 100.0% |
| Range | 70.1% | 94.3% |
| Mean | 29.1% | 32.9% |
| Median | 27.1% | 21.7% |
| Interquartile 25% (IQ1) | 20.5% | 18.9% |
| Interquartile 75% (IQ3) | 35.7% | 36.5% |
| Interquartile Range (IQR) | 15.3% | 17.7% |
| Standard Deviation (Sample) | 14.0% | 25.0% |
| Standard Deviation (Population) | 13.9% | 24.7% |
Similar Demographics by Child Poverty Under the Age of 16
Demographics Similar to Immigrants from Guatemala by Child Poverty Under the Age of 16
In terms of child poverty under the age of 16, the demographic groups most similar to Immigrants from Guatemala are Immigrants from Somalia (21.6%, a difference of 0.14%), Creek (21.5%, a difference of 0.34%), Ute (21.5%, a difference of 0.37%), African (21.7%, a difference of 0.42%), and Dutch West Indian (21.5%, a difference of 0.62%).
| Demographics | Rating | Rank | Child Poverty Under the Age of 16 |
| British West Indians | 0.0 /100 | #308 | Tragic 21.3% |
| Immigrants | Mexico | 0.0 /100 | #309 | Tragic 21.5% |
| Bahamians | 0.0 /100 | #310 | Tragic 21.5% |
| Dutch West Indians | 0.0 /100 | #311 | Tragic 21.5% |
| Ute | 0.0 /100 | #312 | Tragic 21.5% |
| Creek | 0.0 /100 | #313 | Tragic 21.5% |
| Immigrants | Somalia | 0.0 /100 | #314 | Tragic 21.6% |
| Immigrants | Guatemala | 0.0 /100 | #315 | Tragic 21.6% |
| Africans | 0.0 /100 | #316 | Tragic 21.7% |
| Immigrants | Dominica | 0.0 /100 | #317 | Tragic 21.9% |
| U.S. Virgin Islanders | 0.0 /100 | #318 | Tragic 22.0% |
| Yakama | 0.0 /100 | #319 | Tragic 22.1% |
| Cajuns | 0.0 /100 | #320 | Tragic 22.1% |
| Kiowa | 0.0 /100 | #321 | Tragic 22.2% |
| Hondurans | 0.0 /100 | #322 | Tragic 22.2% |
Demographics Similar to Spaniards by Child Poverty Under the Age of 16
In terms of child poverty under the age of 16, the demographic groups most similar to Spaniards are Immigrants from Uruguay (16.8%, a difference of 0.020%), Immigrants from Uganda (16.8%, a difference of 0.11%), Immigrants from Lebanon (16.8%, a difference of 0.19%), Spanish (16.7%, a difference of 0.20%), and Immigrants from Kenya (16.9%, a difference of 0.71%).
| Demographics | Rating | Rank | Child Poverty Under the Age of 16 |
| Kenyans | 34.1 /100 | #186 | Fair 16.5% |
| Arabs | 31.4 /100 | #187 | Fair 16.6% |
| Immigrants | Morocco | 31.2 /100 | #188 | Fair 16.6% |
| Immigrants | Portugal | 30.0 /100 | #189 | Fair 16.6% |
| Immigrants | Costa Rica | 29.6 /100 | #190 | Fair 16.6% |
| Immigrants | Iraq | 28.3 /100 | #191 | Fair 16.7% |
| Spanish | 24.5 /100 | #192 | Fair 16.7% |
| Spaniards | 23.2 /100 | #193 | Fair 16.8% |
| Immigrants | Uruguay | 23.1 /100 | #194 | Fair 16.8% |
| Immigrants | Uganda | 22.5 /100 | #195 | Fair 16.8% |
| Immigrants | Lebanon | 22.0 /100 | #196 | Fair 16.8% |
| Immigrants | Kenya | 19.1 /100 | #197 | Poor 16.9% |
| Delaware | 17.1 /100 | #198 | Poor 17.0% |
| Immigrants | Afghanistan | 15.1 /100 | #199 | Poor 17.0% |
| Immigrants | Cameroon | 14.7 /100 | #200 | Poor 17.1% |