Afghan vs Scottish Single Male Poverty
COMPARE
Afghan
Scottish
Single Male Poverty
Single Male Poverty Comparison
Afghans
Scottish
10.7%
SINGLE MALE POVERTY
100.0/ 100
METRIC RATING
7th/ 347
METRIC RANK
14.0%
SINGLE MALE POVERTY
0.1/ 100
METRIC RATING
269th/ 347
METRIC RANK
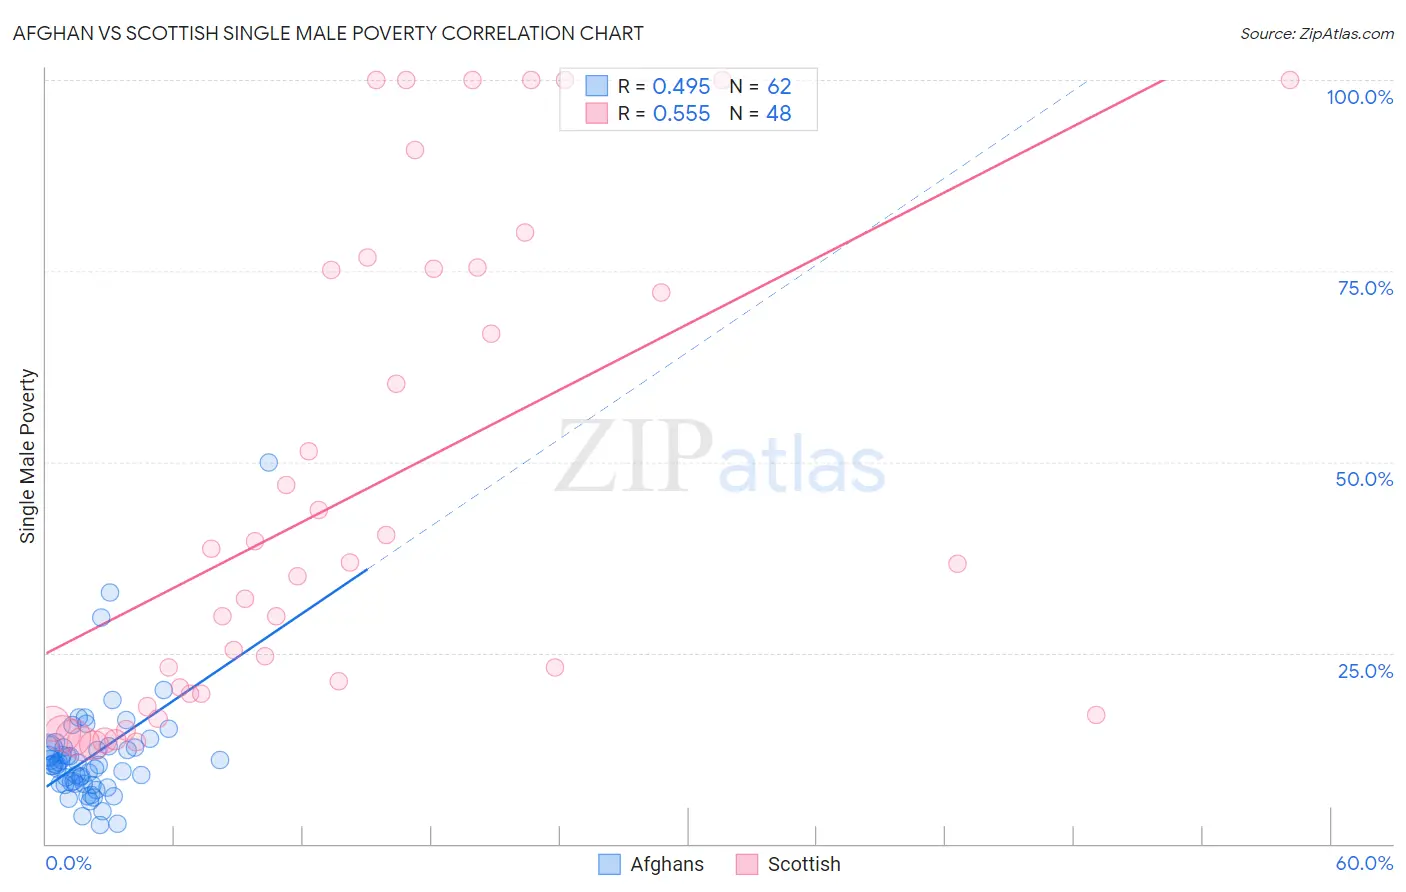
Afghan vs Scottish Single Male Poverty Correlation Chart
The statistical analysis conducted on geographies consisting of 140,679,200 people shows a moderate positive correlation between the proportion of Afghans and poverty level among single males in the United States with a correlation coefficient (R) of 0.495 and weighted average of 10.7%. Similarly, the statistical analysis conducted on geographies consisting of 467,829,193 people shows a substantial positive correlation between the proportion of Scottish and poverty level among single males in the United States with a correlation coefficient (R) of 0.555 and weighted average of 14.0%, a difference of 30.5%.
Single Male Poverty Correlation Summary
| Measurement | Afghan | Scottish |
| Minimum | 2.4% | 12.9% |
| Maximum | 50.0% | 100.0% |
| Range | 47.6% | 87.1% |
| Mean | 11.5% | 45.6% |
| Median | 10.3% | 35.9% |
| Interquartile 25% (IQ1) | 7.8% | 18.8% |
| Interquartile 75% (IQ3) | 12.6% | 75.2% |
| Interquartile Range (IQR) | 4.8% | 56.4% |
| Standard Deviation (Sample) | 7.2% | 31.3% |
| Standard Deviation (Population) | 7.2% | 30.9% |
Similar Demographics by Single Male Poverty
Demographics Similar to Afghans by Single Male Poverty
In terms of single male poverty, the demographic groups most similar to Afghans are Thai (10.8%, a difference of 0.47%), Filipino (10.6%, a difference of 0.75%), Taiwanese (10.9%, a difference of 1.7%), Immigrants from Fiji (10.9%, a difference of 1.8%), and Immigrants from Philippines (10.9%, a difference of 1.8%).
| Demographics | Rating | Rank | Single Male Poverty |
| Assyrians/Chaldeans/Syriacs | 100.0 /100 | #1 | Exceptional 9.8% |
| Immigrants | Taiwan | 100.0 /100 | #2 | Exceptional 10.3% |
| Immigrants | India | 100.0 /100 | #3 | Exceptional 10.3% |
| Immigrants | Hong Kong | 100.0 /100 | #4 | Exceptional 10.4% |
| Tongans | 100.0 /100 | #5 | Exceptional 10.5% |
| Filipinos | 100.0 /100 | #6 | Exceptional 10.6% |
| Afghans | 100.0 /100 | #7 | Exceptional 10.7% |
| Thais | 100.0 /100 | #8 | Exceptional 10.8% |
| Taiwanese | 100.0 /100 | #9 | Exceptional 10.9% |
| Immigrants | Fiji | 100.0 /100 | #10 | Exceptional 10.9% |
| Immigrants | Philippines | 100.0 /100 | #11 | Exceptional 10.9% |
| Immigrants | Afghanistan | 100.0 /100 | #12 | Exceptional 10.9% |
| Immigrants | South Central Asia | 100.0 /100 | #13 | Exceptional 10.9% |
| Chinese | 100.0 /100 | #14 | Exceptional 11.0% |
| Koreans | 100.0 /100 | #15 | Exceptional 11.0% |
Demographics Similar to Scottish by Single Male Poverty
In terms of single male poverty, the demographic groups most similar to Scottish are Immigrants from Saudi Arabia (14.0%, a difference of 0.010%), Irish (14.0%, a difference of 0.040%), Mexican (14.0%, a difference of 0.10%), Immigrants from Mexico (13.9%, a difference of 0.16%), and German (13.9%, a difference of 0.22%).
| Demographics | Rating | Rank | Single Male Poverty |
| Fijians | 0.3 /100 | #262 | Tragic 13.8% |
| Cape Verdeans | 0.2 /100 | #263 | Tragic 13.8% |
| West Indians | 0.2 /100 | #264 | Tragic 13.8% |
| Immigrants | Congo | 0.2 /100 | #265 | Tragic 13.9% |
| Immigrants | Cabo Verde | 0.1 /100 | #266 | Tragic 13.9% |
| Germans | 0.1 /100 | #267 | Tragic 13.9% |
| Immigrants | Mexico | 0.1 /100 | #268 | Tragic 13.9% |
| Scottish | 0.1 /100 | #269 | Tragic 14.0% |
| Immigrants | Saudi Arabia | 0.1 /100 | #270 | Tragic 14.0% |
| Irish | 0.1 /100 | #271 | Tragic 14.0% |
| Mexicans | 0.1 /100 | #272 | Tragic 14.0% |
| Welsh | 0.1 /100 | #273 | Tragic 14.0% |
| Hondurans | 0.1 /100 | #274 | Tragic 14.0% |
| English | 0.1 /100 | #275 | Tragic 14.1% |
| Dutch | 0.1 /100 | #276 | Tragic 14.1% |