Nigerian vs Scottish Single Male Poverty
COMPARE
Nigerian
Scottish
Single Male Poverty
Single Male Poverty Comparison
Nigerians
Scottish
12.9%
SINGLE MALE POVERTY
31.9/ 100
METRIC RATING
186th/ 347
METRIC RANK
14.0%
SINGLE MALE POVERTY
0.1/ 100
METRIC RATING
269th/ 347
METRIC RANK
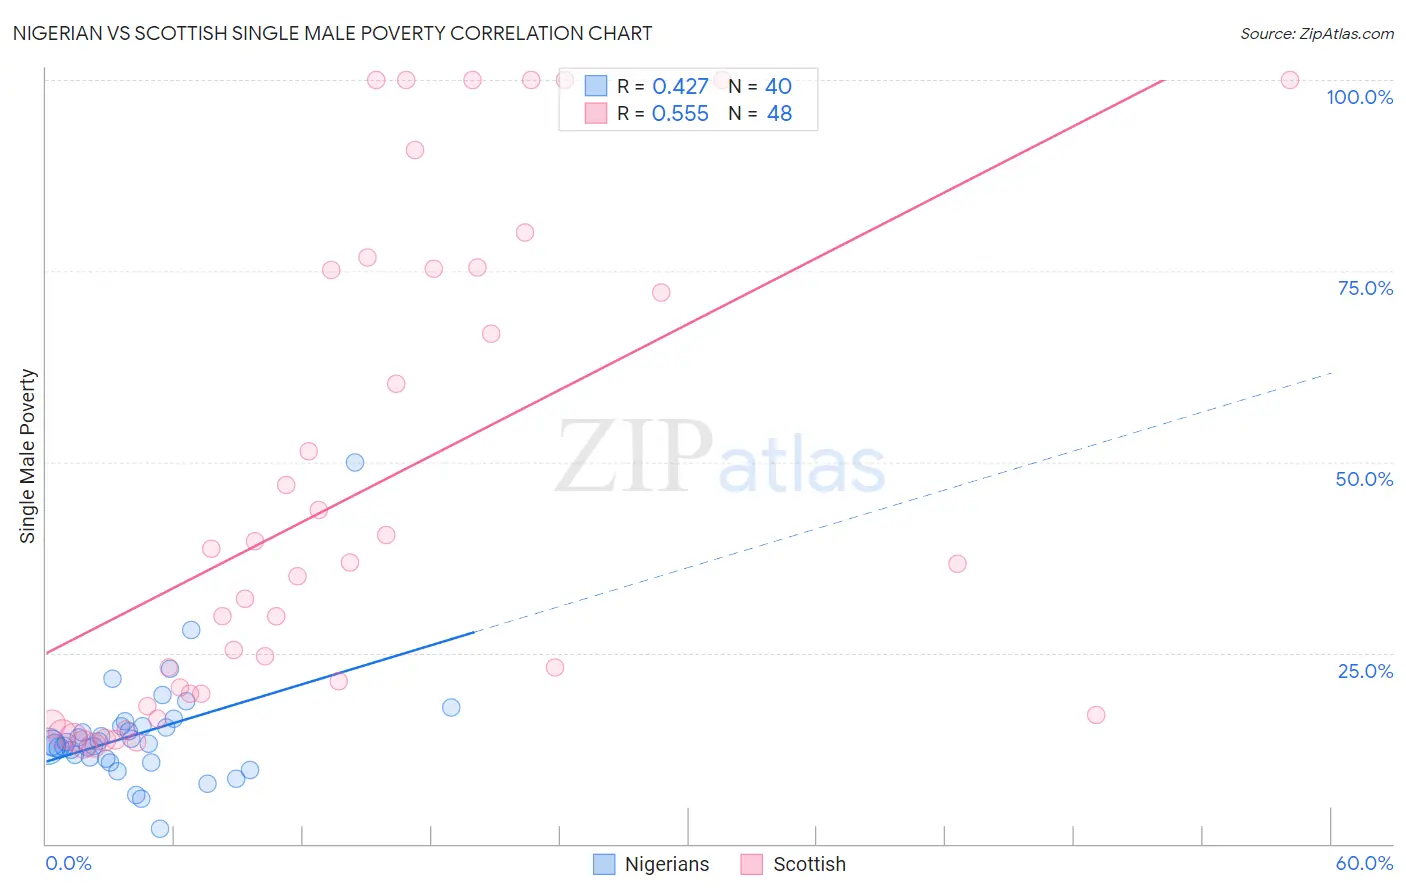
Nigerian vs Scottish Single Male Poverty Correlation Chart
The statistical analysis conducted on geographies consisting of 304,027,429 people shows a moderate positive correlation between the proportion of Nigerians and poverty level among single males in the United States with a correlation coefficient (R) of 0.427 and weighted average of 12.9%. Similarly, the statistical analysis conducted on geographies consisting of 467,829,193 people shows a substantial positive correlation between the proportion of Scottish and poverty level among single males in the United States with a correlation coefficient (R) of 0.555 and weighted average of 14.0%, a difference of 8.1%.
Single Male Poverty Correlation Summary
| Measurement | Nigerian | Scottish |
| Minimum | 1.9% | 12.9% |
| Maximum | 50.0% | 100.0% |
| Range | 48.1% | 87.1% |
| Mean | 14.4% | 45.6% |
| Median | 13.2% | 35.9% |
| Interquartile 25% (IQ1) | 11.2% | 18.8% |
| Interquartile 75% (IQ3) | 15.4% | 75.2% |
| Interquartile Range (IQR) | 4.2% | 56.4% |
| Standard Deviation (Sample) | 7.4% | 31.3% |
| Standard Deviation (Population) | 7.3% | 30.9% |
Similar Demographics by Single Male Poverty
Demographics Similar to Nigerians by Single Male Poverty
In terms of single male poverty, the demographic groups most similar to Nigerians are Norwegian (12.9%, a difference of 0.0%), Immigrants from Kuwait (12.9%, a difference of 0.0%), Immigrants from Trinidad and Tobago (12.9%, a difference of 0.030%), Macedonian (12.9%, a difference of 0.030%), and Immigrants from West Indies (12.9%, a difference of 0.060%).
| Demographics | Rating | Rank | Single Male Poverty |
| Israelis | 41.0 /100 | #179 | Average 12.9% |
| Immigrants | North America | 37.7 /100 | #180 | Fair 12.9% |
| Panamanians | 37.6 /100 | #181 | Fair 12.9% |
| Moroccans | 36.8 /100 | #182 | Fair 12.9% |
| Immigrants | West Indies | 33.0 /100 | #183 | Fair 12.9% |
| Immigrants | Trinidad and Tobago | 32.5 /100 | #184 | Fair 12.9% |
| Norwegians | 32.0 /100 | #185 | Fair 12.9% |
| Nigerians | 31.9 /100 | #186 | Fair 12.9% |
| Immigrants | Kuwait | 31.9 /100 | #187 | Fair 12.9% |
| Macedonians | 31.5 /100 | #188 | Fair 12.9% |
| Portuguese | 30.2 /100 | #189 | Fair 12.9% |
| Arabs | 27.0 /100 | #190 | Fair 13.0% |
| Immigrants | Thailand | 26.6 /100 | #191 | Fair 13.0% |
| Immigrants | Jamaica | 26.5 /100 | #192 | Fair 13.0% |
| Immigrants | South Africa | 26.1 /100 | #193 | Fair 13.0% |
Demographics Similar to Scottish by Single Male Poverty
In terms of single male poverty, the demographic groups most similar to Scottish are Immigrants from Saudi Arabia (14.0%, a difference of 0.010%), Irish (14.0%, a difference of 0.040%), Mexican (14.0%, a difference of 0.10%), Immigrants from Mexico (13.9%, a difference of 0.16%), and German (13.9%, a difference of 0.22%).
| Demographics | Rating | Rank | Single Male Poverty |
| Fijians | 0.3 /100 | #262 | Tragic 13.8% |
| Cape Verdeans | 0.2 /100 | #263 | Tragic 13.8% |
| West Indians | 0.2 /100 | #264 | Tragic 13.8% |
| Immigrants | Congo | 0.2 /100 | #265 | Tragic 13.9% |
| Immigrants | Cabo Verde | 0.1 /100 | #266 | Tragic 13.9% |
| Germans | 0.1 /100 | #267 | Tragic 13.9% |
| Immigrants | Mexico | 0.1 /100 | #268 | Tragic 13.9% |
| Scottish | 0.1 /100 | #269 | Tragic 14.0% |
| Immigrants | Saudi Arabia | 0.1 /100 | #270 | Tragic 14.0% |
| Irish | 0.1 /100 | #271 | Tragic 14.0% |
| Mexicans | 0.1 /100 | #272 | Tragic 14.0% |
| Welsh | 0.1 /100 | #273 | Tragic 14.0% |
| Hondurans | 0.1 /100 | #274 | Tragic 14.0% |
| English | 0.1 /100 | #275 | Tragic 14.1% |
| Dutch | 0.1 /100 | #276 | Tragic 14.1% |