Afghan vs Immigrants from South Africa Single Male Poverty
COMPARE
Afghan
Immigrants from South Africa
Single Male Poverty
Single Male Poverty Comparison
Afghans
Immigrants from South Africa
10.7%
SINGLE MALE POVERTY
100.0/ 100
METRIC RATING
7th/ 347
METRIC RANK
13.0%
SINGLE MALE POVERTY
26.1/ 100
METRIC RATING
193rd/ 347
METRIC RANK
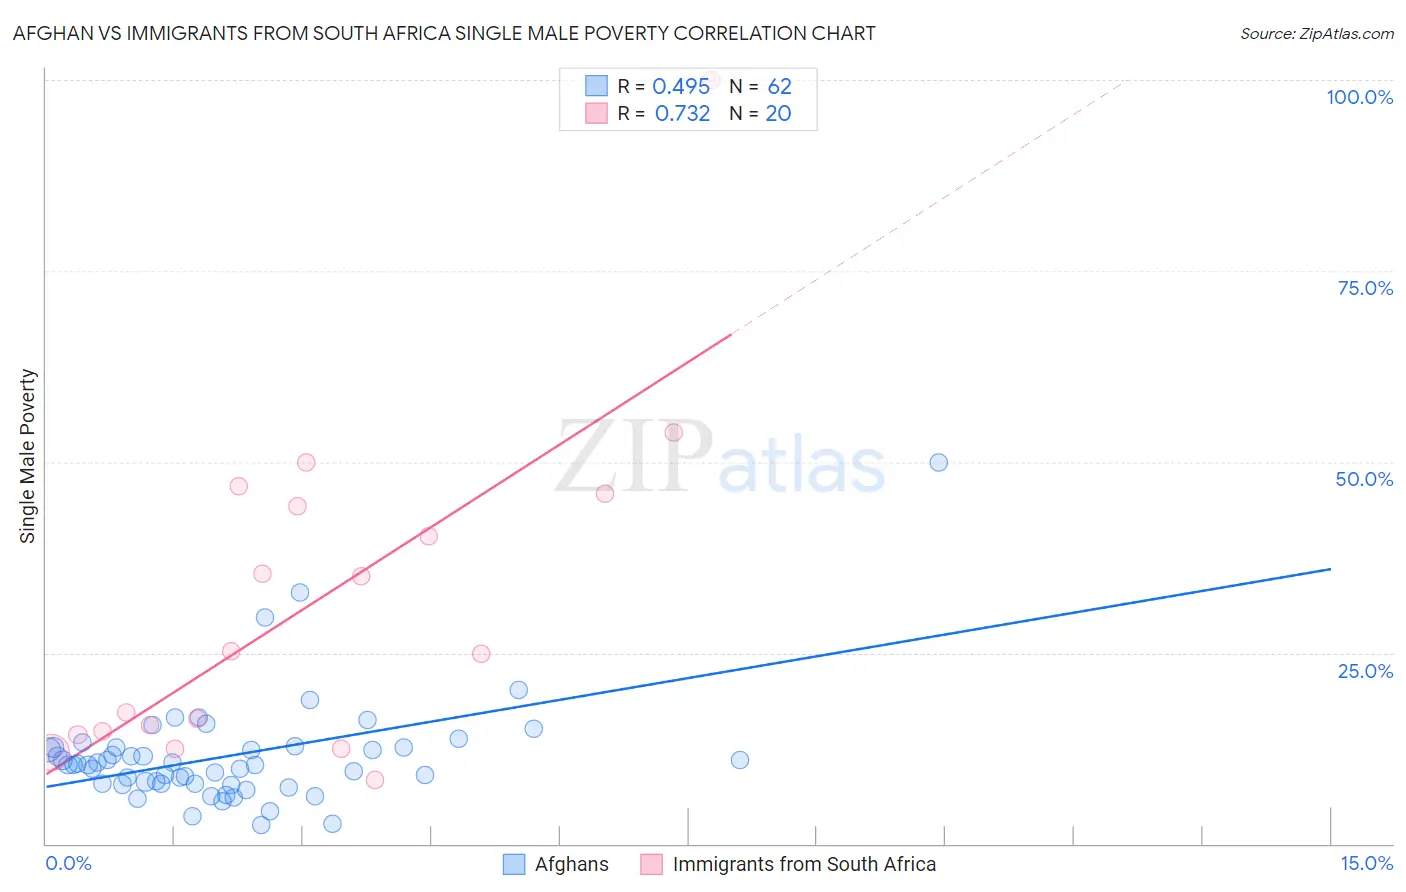
Afghan vs Immigrants from South Africa Single Male Poverty Correlation Chart
The statistical analysis conducted on geographies consisting of 140,679,200 people shows a moderate positive correlation between the proportion of Afghans and poverty level among single males in the United States with a correlation coefficient (R) of 0.495 and weighted average of 10.7%. Similarly, the statistical analysis conducted on geographies consisting of 209,720,909 people shows a strong positive correlation between the proportion of Immigrants from South Africa and poverty level among single males in the United States with a correlation coefficient (R) of 0.732 and weighted average of 13.0%, a difference of 21.2%.
Single Male Poverty Correlation Summary
| Measurement | Afghan | Immigrants from South Africa |
| Minimum | 2.4% | 8.3% |
| Maximum | 50.0% | 100.0% |
| Range | 47.6% | 91.7% |
| Mean | 11.5% | 31.3% |
| Median | 10.3% | 25.0% |
| Interquartile 25% (IQ1) | 7.8% | 14.5% |
| Interquartile 75% (IQ3) | 12.6% | 45.0% |
| Interquartile Range (IQR) | 4.8% | 30.5% |
| Standard Deviation (Sample) | 7.2% | 22.0% |
| Standard Deviation (Population) | 7.2% | 21.5% |
Similar Demographics by Single Male Poverty
Demographics Similar to Afghans by Single Male Poverty
In terms of single male poverty, the demographic groups most similar to Afghans are Thai (10.8%, a difference of 0.47%), Filipino (10.6%, a difference of 0.75%), Taiwanese (10.9%, a difference of 1.7%), Immigrants from Fiji (10.9%, a difference of 1.8%), and Immigrants from Philippines (10.9%, a difference of 1.8%).
| Demographics | Rating | Rank | Single Male Poverty |
| Assyrians/Chaldeans/Syriacs | 100.0 /100 | #1 | Exceptional 9.8% |
| Immigrants | Taiwan | 100.0 /100 | #2 | Exceptional 10.3% |
| Immigrants | India | 100.0 /100 | #3 | Exceptional 10.3% |
| Immigrants | Hong Kong | 100.0 /100 | #4 | Exceptional 10.4% |
| Tongans | 100.0 /100 | #5 | Exceptional 10.5% |
| Filipinos | 100.0 /100 | #6 | Exceptional 10.6% |
| Afghans | 100.0 /100 | #7 | Exceptional 10.7% |
| Thais | 100.0 /100 | #8 | Exceptional 10.8% |
| Taiwanese | 100.0 /100 | #9 | Exceptional 10.9% |
| Immigrants | Fiji | 100.0 /100 | #10 | Exceptional 10.9% |
| Immigrants | Philippines | 100.0 /100 | #11 | Exceptional 10.9% |
| Immigrants | Afghanistan | 100.0 /100 | #12 | Exceptional 10.9% |
| Immigrants | South Central Asia | 100.0 /100 | #13 | Exceptional 10.9% |
| Chinese | 100.0 /100 | #14 | Exceptional 11.0% |
| Koreans | 100.0 /100 | #15 | Exceptional 11.0% |
Demographics Similar to Immigrants from South Africa by Single Male Poverty
In terms of single male poverty, the demographic groups most similar to Immigrants from South Africa are Immigrants from Jamaica (13.0%, a difference of 0.020%), Immigrants from Thailand (13.0%, a difference of 0.030%), Arab (13.0%, a difference of 0.060%), Liberian (13.0%, a difference of 0.070%), and Immigrants from England (13.0%, a difference of 0.19%).
| Demographics | Rating | Rank | Single Male Poverty |
| Nigerians | 31.9 /100 | #186 | Fair 12.9% |
| Immigrants | Kuwait | 31.9 /100 | #187 | Fair 12.9% |
| Macedonians | 31.5 /100 | #188 | Fair 12.9% |
| Portuguese | 30.2 /100 | #189 | Fair 12.9% |
| Arabs | 27.0 /100 | #190 | Fair 13.0% |
| Immigrants | Thailand | 26.6 /100 | #191 | Fair 13.0% |
| Immigrants | Jamaica | 26.5 /100 | #192 | Fair 13.0% |
| Immigrants | South Africa | 26.1 /100 | #193 | Fair 13.0% |
| Liberians | 25.2 /100 | #194 | Fair 13.0% |
| Immigrants | England | 23.4 /100 | #195 | Fair 13.0% |
| Immigrants | Grenada | 23.1 /100 | #196 | Fair 13.0% |
| Immigrants | Laos | 23.1 /100 | #197 | Fair 13.0% |
| Lithuanians | 22.1 /100 | #198 | Fair 13.0% |
| Immigrants | Norway | 21.8 /100 | #199 | Fair 13.0% |
| Slovenes | 21.6 /100 | #200 | Fair 13.0% |