Wyalusing borough, PA Map & Demographics
Wyalusing borough Overview
$28,707
PER CAPITA INCOME
$39,688
AVG FAMILY INCOME
$39,063
AVG HOUSEHOLD INCOME
52.8%
WAGE / INCOME GAP [ % ]
47.2¢/ $1
WAGE / INCOME GAP [ $ ]
0.45
INEQUALITY / GINI INDEX
666
TOTAL POPULATION
310
MALE POPULATION
356
FEMALE POPULATION
87.08
MALES / 100 FEMALES
114.84
FEMALES / 100 MALES
40.1
MEDIAN AGE
2.7
AVG FAMILY SIZE
2.1
AVG HOUSEHOLD SIZE
262
LABOR FORCE [ PEOPLE ]
51.0%
PERCENT IN LABOR FORCE
0.8%
UNEMPLOYMENT RATE
Income in Wyalusing borough
Income Overview in Wyalusing borough
Per Capita Income in Wyalusing borough is $28,707, while median incomes of families and households are $39,688 and $39,063 respectively.
| Characteristic | Number | Measure |
| Per Capita Income | 666 | $28,707 |
| Median Family Income | 178 | $39,688 |
| Mean Family Income | 178 | $70,947 |
| Median Household Income | 322 | $39,063 |
| Mean Household Income | 322 | $59,402 |
| Income Deficit | 178 | $0 |
| Wage / Income Gap (%) | 666 | 52.84% |
| Wage / Income Gap ($) | 666 | 47.16¢ per $1 |
| Gini / Inequality Index | 666 | 0.45 |
Earnings by Sex in Wyalusing borough
Average Earnings in Wyalusing borough are $38,125, $60,221 for men and $28,400 for women, a difference of 52.8%.
| Sex | Number | Average Earnings |
| Male | 137 (51.3%) | $60,221 |
| Female | 130 (48.7%) | $28,400 |
| Total | 267 (100.0%) | $38,125 |
Earnings by Sex by Income Bracket in Wyalusing borough
The most common earnings brackets in Wyalusing borough are $55,000 to $64,999 for men (25 | 18.2%) and $25,000 to $29,999 for women (25 | 19.2%).
| Income | Male | Female |
| $2,499 or less | 1 (0.7%) | 9 (6.9%) |
| $2,500 to $4,999 | 0 (0.0%) | 4 (3.1%) |
| $5,000 to $7,499 | 0 (0.0%) | 8 (6.1%) |
| $7,500 to $9,999 | 11 (8.0%) | 7 (5.4%) |
| $10,000 to $12,499 | 2 (1.5%) | 2 (1.5%) |
| $12,500 to $14,999 | 2 (1.5%) | 6 (4.6%) |
| $15,000 to $17,499 | 0 (0.0%) | 2 (1.5%) |
| $17,500 to $19,999 | 0 (0.0%) | 11 (8.5%) |
| $20,000 to $22,499 | 0 (0.0%) | 0 (0.0%) |
| $22,500 to $24,999 | 0 (0.0%) | 7 (5.4%) |
| $25,000 to $29,999 | 8 (5.8%) | 25 (19.2%) |
| $30,000 to $34,999 | 9 (6.6%) | 13 (10.0%) |
| $35,000 to $39,999 | 14 (10.2%) | 3 (2.3%) |
| $40,000 to $44,999 | 0 (0.0%) | 0 (0.0%) |
| $45,000 to $49,999 | 9 (6.6%) | 6 (4.6%) |
| $50,000 to $54,999 | 7 (5.1%) | 4 (3.1%) |
| $55,000 to $64,999 | 25 (18.2%) | 7 (5.4%) |
| $65,000 to $74,999 | 16 (11.7%) | 2 (1.5%) |
| $75,000 to $99,999 | 16 (11.7%) | 14 (10.8%) |
| $100,000+ | 17 (12.4%) | 0 (0.0%) |
| Total | 137 (100.0%) | 130 (100.0%) |
Earnings by Sex by Educational Attainment in Wyalusing borough
Average earnings in Wyalusing borough are $61,250 for men and $29,450 for women, a difference of 51.9%. Men with an educational attainment of college or associate's degree enjoy the highest average annual earnings of $72,250, while those with high school diploma education earn the least with $54,250. Women with an educational attainment of bachelor's degree earn the most with the average annual earnings of $95,804, while those with high school diploma education have the smallest earnings of $27,917.
| Educational Attainment | Male Income | Female Income |
| Less than High School | - | - |
| High School Diploma | $54,250 | $27,917 |
| College or Associate's Degree | $72,250 | $29,107 |
| Bachelor's Degree | - | - |
| Graduate Degree | - | - |
| Total | $61,250 | $29,450 |
Family Income in Wyalusing borough
Family Income Brackets in Wyalusing borough
According to the Wyalusing borough family income data, there are 39 families falling into the $25,000 to $34,999 income range, which is the most common income bracket and makes up 21.9% of all families. Conversely, the $15,000 to $24,999 income bracket is the least frequent group with only 2 families (1.1%) belonging to this category.
| Income Bracket | # Families | % Families |
| Less than $10,000 | 3 | 1.7% |
| $10,000 to $14,999 | 12 | 6.7% |
| $15,000 to $24,999 | 2 | 1.1% |
| $25,000 to $34,999 | 39 | 21.9% |
| $35,000 to $49,999 | 34 | 19.1% |
| $50,000 to $74,999 | 30 | 16.9% |
| $75,000 to $99,999 | 27 | 15.2% |
| $100,000 to $149,999 | 15 | 8.4% |
| $150,000 to $199,999 | 12 | 6.7% |
| $200,000+ | 4 | 2.2% |
Family Income by Famaliy Size in Wyalusing borough
4-person families (19 | 10.7%) account for the highest median family income in Wyalusing borough with $94,107 per family, while 3-person families (26 | 14.6%) have the highest median income of $26,944 per family member.
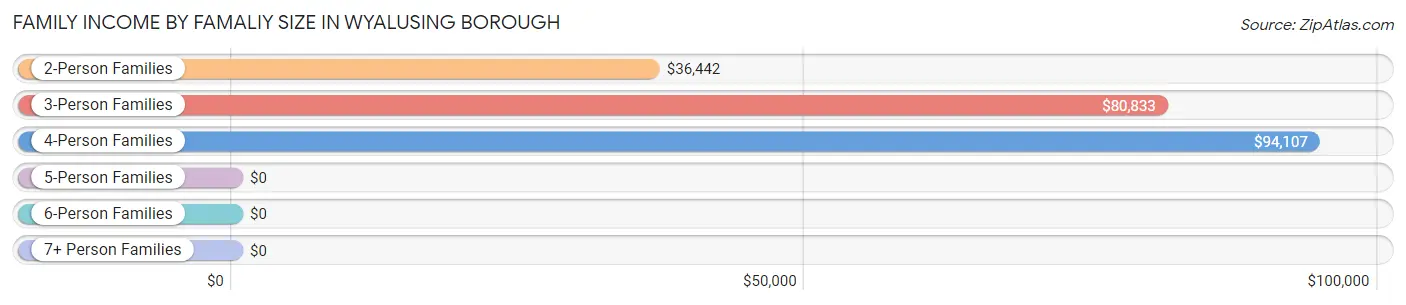
| Income Bracket | # Families | Median Income |
| 2-Person Families | 122 (68.5%) | $36,442 |
| 3-Person Families | 26 (14.6%) | $80,833 |
| 4-Person Families | 19 (10.7%) | $94,107 |
| 5-Person Families | 3 (1.7%) | $0 |
| 6-Person Families | 0 (0.0%) | $0 |
| 7+ Person Families | 8 (4.5%) | $0 |
| Total | 178 (100.0%) | $39,688 |
Family Income by Number of Earners in Wyalusing borough
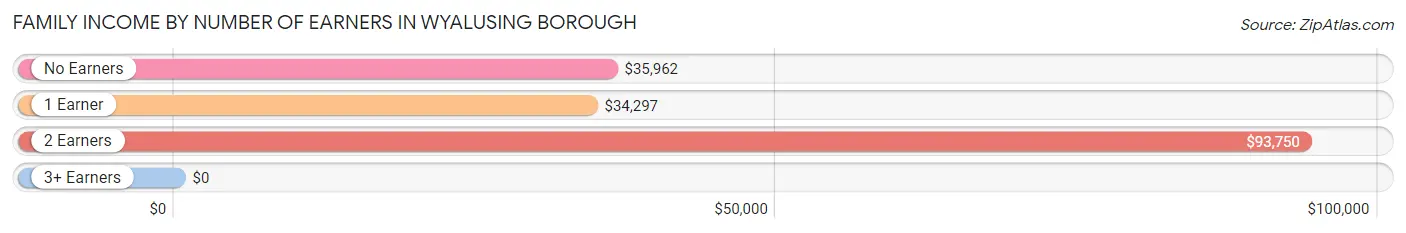
| Number of Earners | # Families | Median Income |
| No Earners | 52 (29.2%) | $35,962 |
| 1 Earner | 67 (37.6%) | $34,297 |
| 2 Earners | 51 (28.6%) | $93,750 |
| 3+ Earners | 8 (4.5%) | $0 |
| Total | 178 (100.0%) | $39,688 |
Household Income in Wyalusing borough
Household Income Brackets in Wyalusing borough
With 54 households falling in the category, the $35,000 to $49,999 income range is the most frequent in Wyalusing borough, accounting for 16.8% of all households. In contrast, only 4 households (1.2%) fall into the $200,000+ income bracket, making it the least populous group.
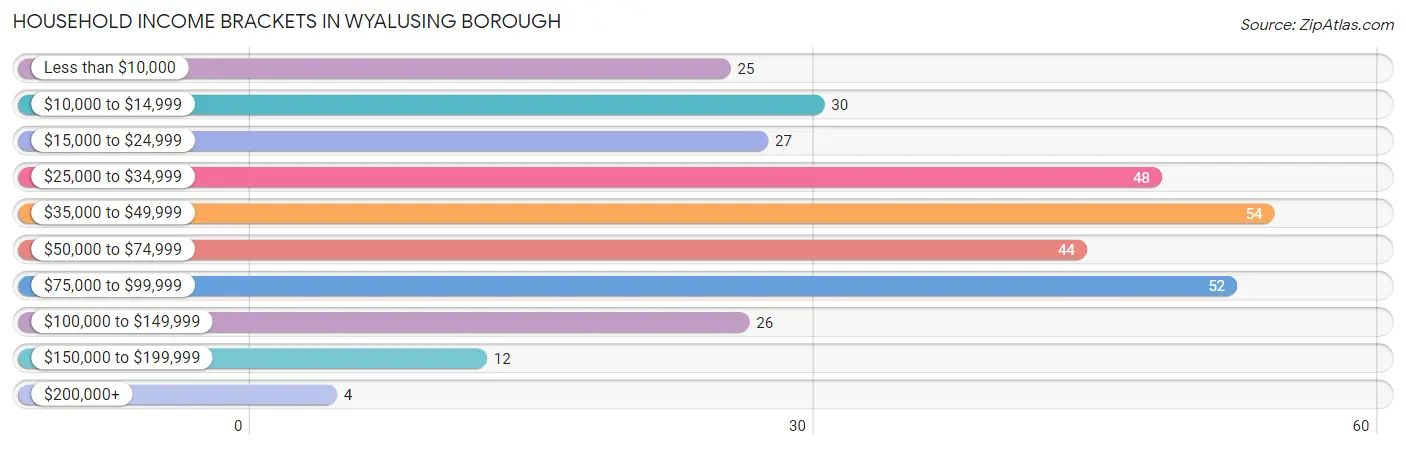
| Income Bracket | # Households | % Households |
| Less than $10,000 | 25 | 7.8% |
| $10,000 to $14,999 | 30 | 9.3% |
| $15,000 to $24,999 | 27 | 8.4% |
| $25,000 to $34,999 | 48 | 14.9% |
| $35,000 to $49,999 | 54 | 16.8% |
| $50,000 to $74,999 | 44 | 13.7% |
| $75,000 to $99,999 | 52 | 16.1% |
| $100,000 to $149,999 | 26 | 8.1% |
| $150,000 to $199,999 | 12 | 3.7% |
| $200,000+ | 4 | 1.2% |
Household Income by Householder Age in Wyalusing borough
The median household income in Wyalusing borough is $39,063, with the highest median household income of $77,250 found in the 45 to 64 years age bracket for the primary householder. A total of 63 households (19.6%) fall into this category. Meanwhile, the 15 to 24 years age bracket for the primary householder has the lowest median household income of $0, with 6 households (1.9%) in this group.
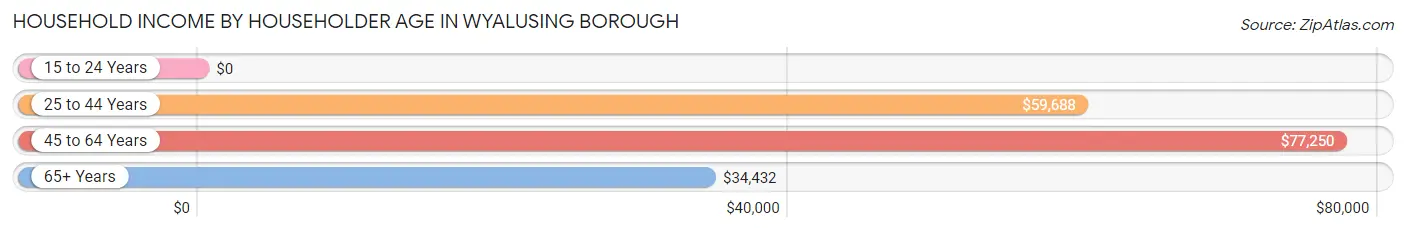
| Income Bracket | # Households | Median Income |
| 15 to 24 Years | 6 (1.9%) | $0 |
| 25 to 44 Years | 118 (36.6%) | $59,688 |
| 45 to 64 Years | 63 (19.6%) | $77,250 |
| 65+ Years | 135 (41.9%) | $34,432 |
| Total | 322 (100.0%) | $39,063 |
Poverty in Wyalusing borough
Income Below Poverty by Sex and Age in Wyalusing borough
With 8.8% poverty level for males and 17.1% for females among the residents of Wyalusing borough, 25 to 34 year old males and 75 year old and over females are the most vulnerable to poverty, with 9 males (19.6%) and 17 females (36.2%) in their respective age groups living below the poverty level.
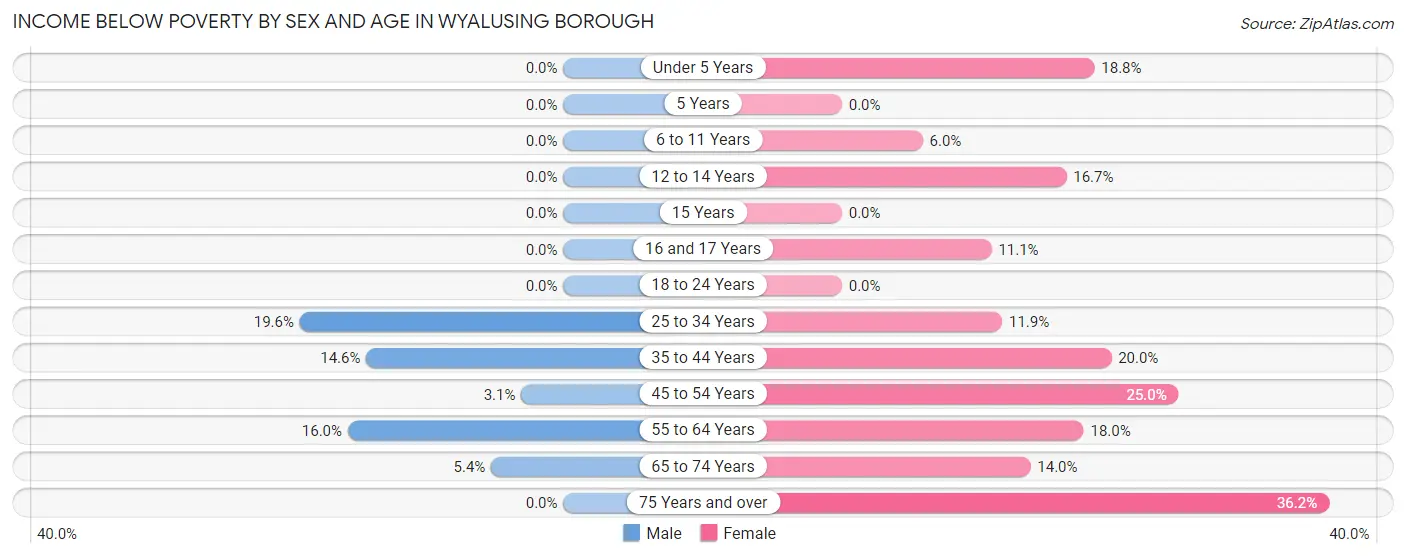
| Age Bracket | Male | Female |
| Under 5 Years | 0 (0.0%) | 3 (18.8%) |
| 5 Years | 0 (0.0%) | 0 (0.0%) |
| 6 to 11 Years | 0 (0.0%) | 3 (6.0%) |
| 12 to 14 Years | 0 (0.0%) | 3 (16.7%) |
| 15 Years | 0 (0.0%) | 0 (0.0%) |
| 16 and 17 Years | 0 (0.0%) | 2 (11.1%) |
| 18 to 24 Years | 0 (0.0%) | 0 (0.0%) |
| 25 to 34 Years | 9 (19.6%) | 5 (11.9%) |
| 35 to 44 Years | 6 (14.6%) | 9 (20.0%) |
| 45 to 54 Years | 1 (3.1%) | 2 (25.0%) |
| 55 to 64 Years | 8 (16.0%) | 7 (17.9%) |
| 65 to 74 Years | 3 (5.4%) | 7 (14.0%) |
| 75 Years and over | 0 (0.0%) | 17 (36.2%) |
| Total | 27 (8.8%) | 58 (17.1%) |
Income Above Poverty by Sex and Age in Wyalusing borough
According to the poverty statistics in Wyalusing borough, males aged under 5 years and females aged 5 years are the age groups that are most secure financially, with 100.0% of males and 100.0% of females in these age groups living above the poverty line.
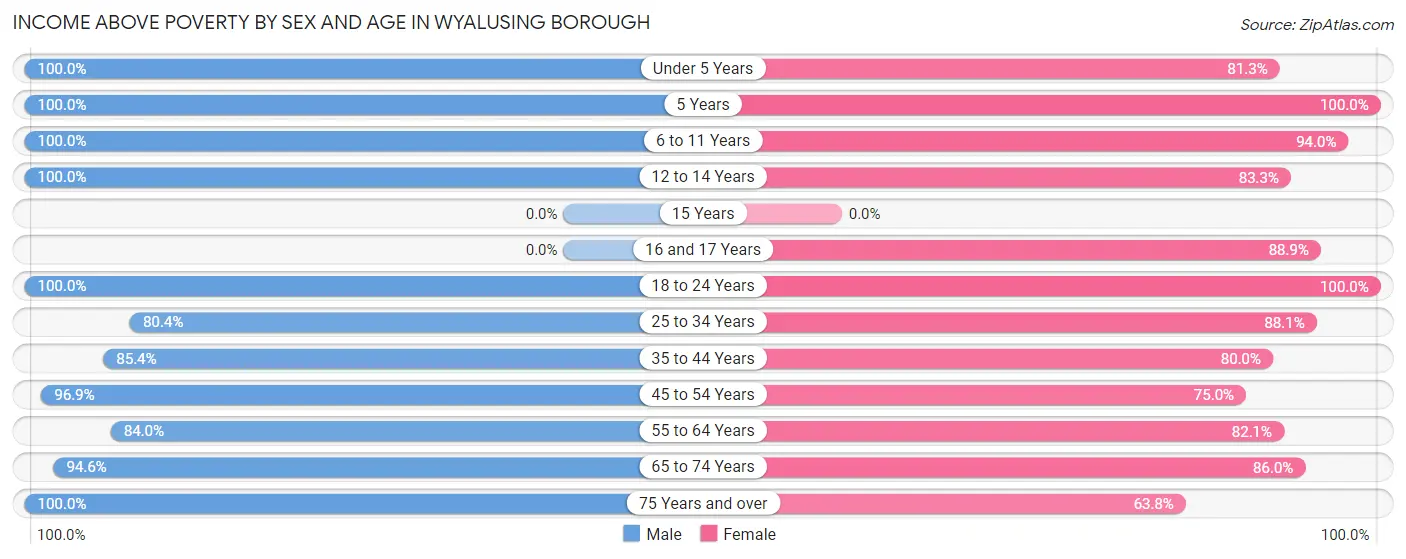
| Age Bracket | Male | Female |
| Under 5 Years | 11 (100.0%) | 13 (81.2%) |
| 5 Years | 3 (100.0%) | 2 (100.0%) |
| 6 to 11 Years | 21 (100.0%) | 47 (94.0%) |
| 12 to 14 Years | 11 (100.0%) | 15 (83.3%) |
| 15 Years | 0 (0.0%) | 0 (0.0%) |
| 16 and 17 Years | 0 (0.0%) | 16 (88.9%) |
| 18 to 24 Years | 14 (100.0%) | 5 (100.0%) |
| 25 to 34 Years | 37 (80.4%) | 37 (88.1%) |
| 35 to 44 Years | 35 (85.4%) | 36 (80.0%) |
| 45 to 54 Years | 31 (96.9%) | 6 (75.0%) |
| 55 to 64 Years | 42 (84.0%) | 32 (82.1%) |
| 65 to 74 Years | 53 (94.6%) | 43 (86.0%) |
| 75 Years and over | 21 (100.0%) | 30 (63.8%) |
| Total | 279 (91.2%) | 282 (82.9%) |
Income Below Poverty Among Married-Couple Families in Wyalusing borough
The poverty statistics for married-couple families in Wyalusing borough show that 5.6% or 6 of the total 108 families live below the poverty line. Families with no children have the highest poverty rate of 7.5%, comprising of 6 families. On the other hand, families with 1 or 2 children have the lowest poverty rate of 0.0%, which includes 0 families.
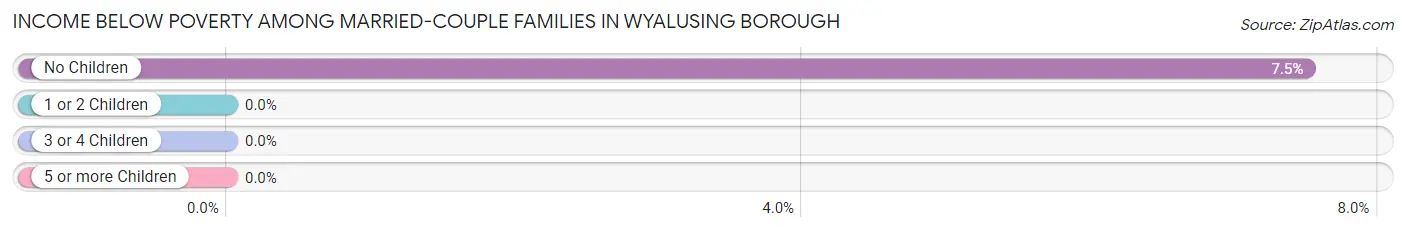
| Children | Above Poverty | Below Poverty |
| No Children | 74 (92.5%) | 6 (7.5%) |
| 1 or 2 Children | 25 (100.0%) | 0 (0.0%) |
| 3 or 4 Children | 3 (100.0%) | 0 (0.0%) |
| 5 or more Children | 0 (0.0%) | 0 (0.0%) |
| Total | 102 (94.4%) | 6 (5.6%) |
Income Below Poverty Among Single-Parent Households in Wyalusing borough
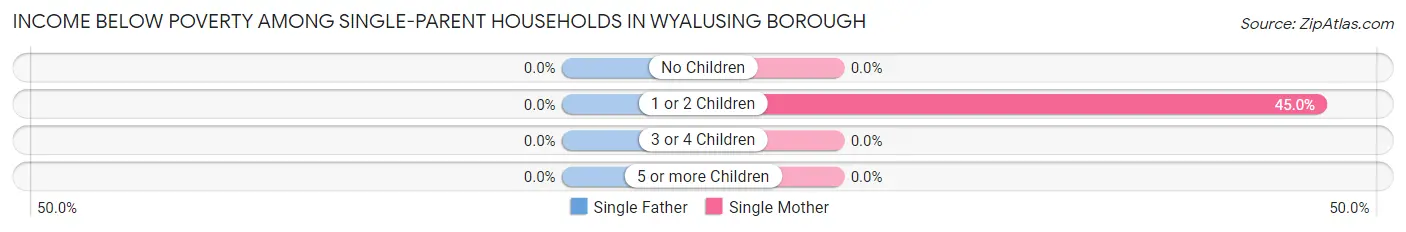
| Children | Single Father | Single Mother |
| No Children | 0 (0.0%) | 0 (0.0%) |
| 1 or 2 Children | 0 (0.0%) | 9 (45.0%) |
| 3 or 4 Children | 0 (0.0%) | 0 (0.0%) |
| 5 or more Children | 0 (0.0%) | 0 (0.0%) |
| Total | 0 (0.0%) | 9 (20.9%) |
Income Below Poverty Among Married-Couple vs Single-Parent Households in Wyalusing borough
The poverty data for Wyalusing borough shows that 6 of the married-couple family households (5.6%) and 9 of the single-parent households (12.9%) are living below the poverty level. Within the married-couple family households, those with no children have the highest poverty rate, with 6 households (7.5%) falling below the poverty line. Among the single-parent households, those with 1 or 2 children have the highest poverty rate, with 9 household (25.0%) living below poverty.
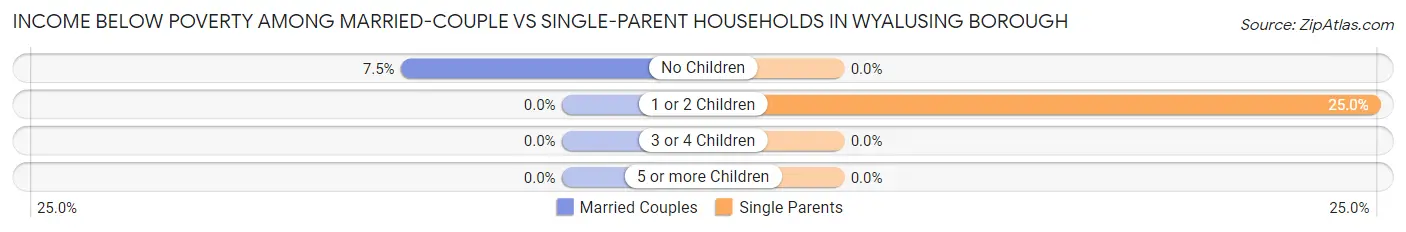
| Children | Married-Couple Families | Single-Parent Households |
| No Children | 6 (7.5%) | 0 (0.0%) |
| 1 or 2 Children | 0 (0.0%) | 9 (25.0%) |
| 3 or 4 Children | 0 (0.0%) | 0 (0.0%) |
| 5 or more Children | 0 (0.0%) | 0 (0.0%) |
| Total | 6 (5.6%) | 9 (12.9%) |
Race in Wyalusing borough
The most populous races in Wyalusing borough are White / Caucasian (643 | 96.6%), Two or more Races (20 | 3.0%), and Hispanic or Latino (6 | 0.9%).
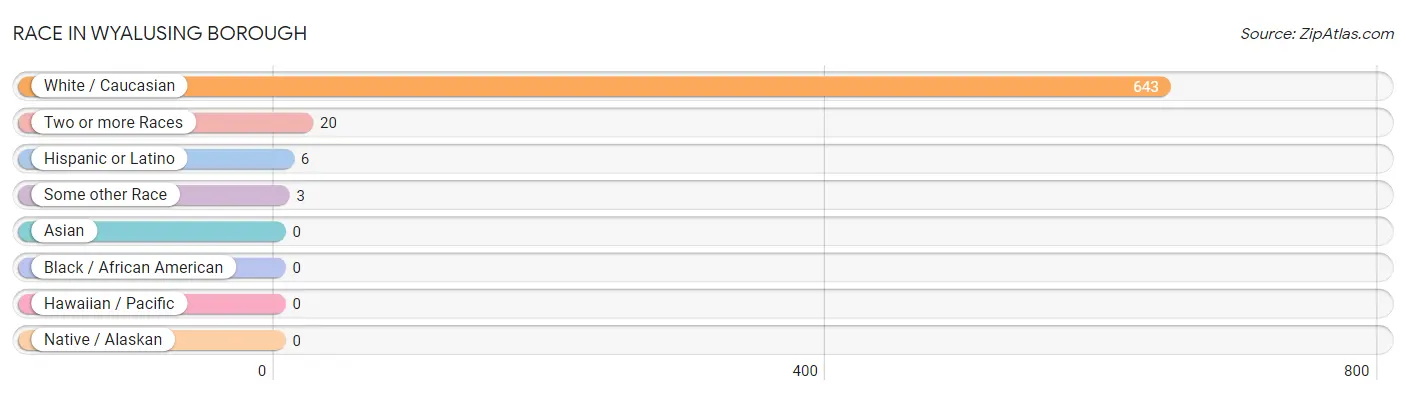
| Race | # Population | % Population |
| Asian | 0 | 0.0% |
| Black / African American | 0 | 0.0% |
| Hawaiian / Pacific | 0 | 0.0% |
| Hispanic or Latino | 6 | 0.9% |
| Native / Alaskan | 0 | 0.0% |
| White / Caucasian | 643 | 96.6% |
| Two or more Races | 20 | 3.0% |
| Some other Race | 3 | 0.4% |
| Total | 666 | 100.0% |
Ancestry in Wyalusing borough
The most populous ancestries reported in Wyalusing borough are German (201 | 30.2%), Irish (144 | 21.6%), Polish (76 | 11.4%), English (75 | 11.3%), and Pennsylvania German (31 | 4.6%), together accounting for 79.1% of all Wyalusing borough residents.
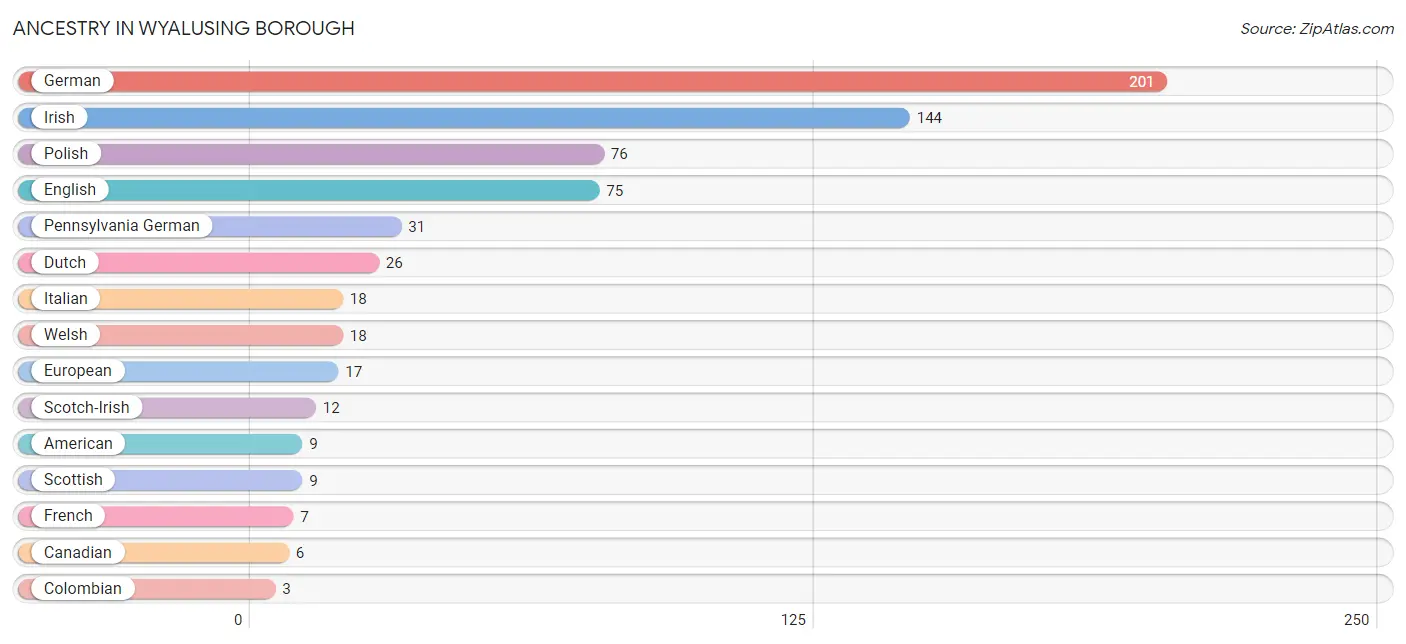
| Ancestry | # Population | % Population |
| American | 9 | 1.3% |
| Canadian | 6 | 0.9% |
| Colombian | 3 | 0.4% |
| Dutch | 26 | 3.9% |
| English | 75 | 11.3% |
| European | 17 | 2.5% |
| French | 7 | 1.1% |
| German | 201 | 30.2% |
| Greek | 3 | 0.4% |
| Irish | 144 | 21.6% |
| Iroquois | 2 | 0.3% |
| Italian | 18 | 2.7% |
| Lithuanian | 3 | 0.4% |
| Mexican | 3 | 0.4% |
| Pennsylvania German | 31 | 4.6% |
| Polish | 76 | 11.4% |
| Scandinavian | 3 | 0.4% |
| Scotch-Irish | 12 | 1.8% |
| Scottish | 9 | 1.3% |
| Slovak | 3 | 0.4% |
| South American | 3 | 0.4% |
| Ukrainian | 3 | 0.4% |
| Welsh | 18 | 2.7% | View All 23 Rows |
Immigrants in Wyalusing borough
The most numerous immigrant groups reported in Wyalusing borough came from Africa (8 | 1.2%), South Africa (8 | 1.2%), Colombia (3 | 0.4%), Latin America (3 | 0.4%), and South America (3 | 0.4%), together accounting for 3.7% of all Wyalusing borough residents.
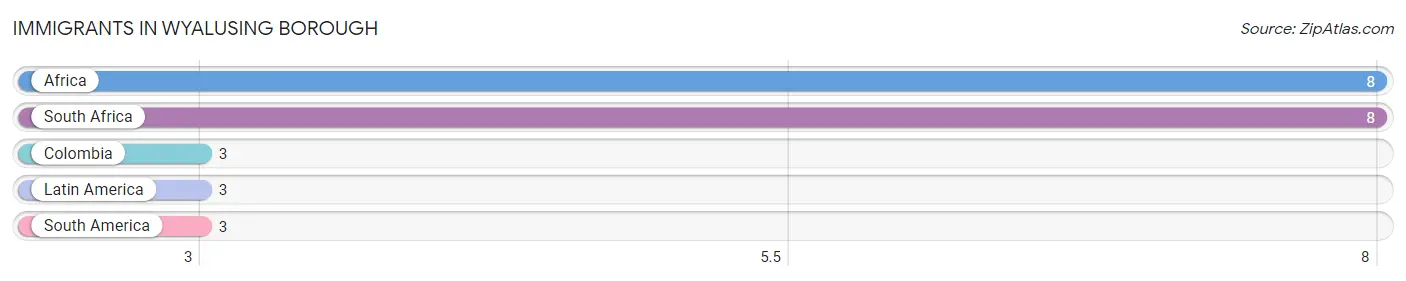
| Immigration Origin | # Population | % Population |
| Africa | 8 | 1.2% |
| Colombia | 3 | 0.4% |
| Latin America | 3 | 0.4% |
| South Africa | 8 | 1.2% |
| South America | 3 | 0.4% | View All 5 Rows |
Sex and Age in Wyalusing borough
Sex and Age in Wyalusing borough
The most populous age groups in Wyalusing borough are 30 to 34 Years (39 | 12.6%) for men and 10 to 14 Years (44 | 12.4%) for women.
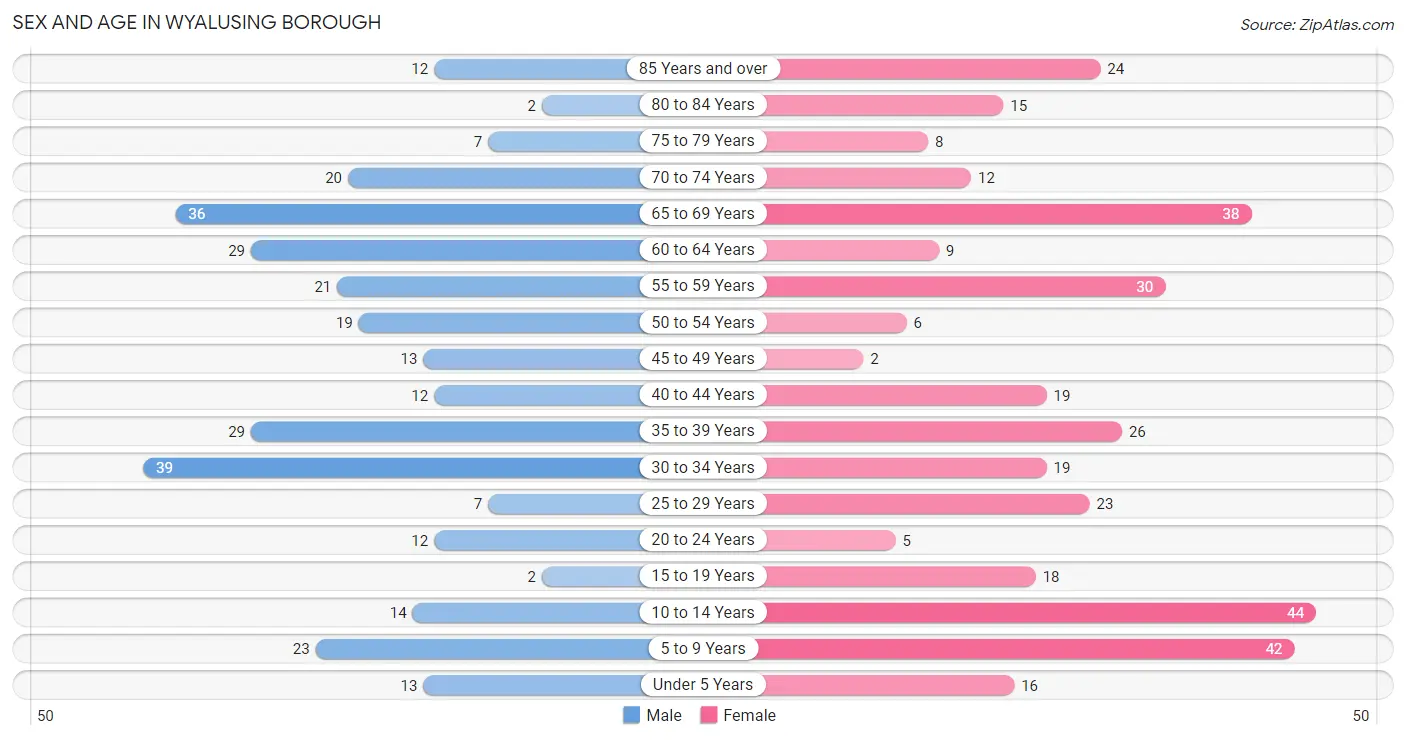
| Age Bracket | Male | Female |
| Under 5 Years | 13 (4.2%) | 16 (4.5%) |
| 5 to 9 Years | 23 (7.4%) | 42 (11.8%) |
| 10 to 14 Years | 14 (4.5%) | 44 (12.4%) |
| 15 to 19 Years | 2 (0.6%) | 18 (5.1%) |
| 20 to 24 Years | 12 (3.9%) | 5 (1.4%) |
| 25 to 29 Years | 7 (2.3%) | 23 (6.5%) |
| 30 to 34 Years | 39 (12.6%) | 19 (5.3%) |
| 35 to 39 Years | 29 (9.3%) | 26 (7.3%) |
| 40 to 44 Years | 12 (3.9%) | 19 (5.3%) |
| 45 to 49 Years | 13 (4.2%) | 2 (0.6%) |
| 50 to 54 Years | 19 (6.1%) | 6 (1.7%) |
| 55 to 59 Years | 21 (6.8%) | 30 (8.4%) |
| 60 to 64 Years | 29 (9.3%) | 9 (2.5%) |
| 65 to 69 Years | 36 (11.6%) | 38 (10.7%) |
| 70 to 74 Years | 20 (6.5%) | 12 (3.4%) |
| 75 to 79 Years | 7 (2.3%) | 8 (2.2%) |
| 80 to 84 Years | 2 (0.6%) | 15 (4.2%) |
| 85 Years and over | 12 (3.9%) | 24 (6.7%) |
| Total | 310 (100.0%) | 356 (100.0%) |
Families and Households in Wyalusing borough
Median Family Size in Wyalusing borough
The median family size in Wyalusing borough is 2.71 persons per family, with single female/mother families (43 | 24.2%) accounting for the largest median family size of 3.37 persons per family. On the other hand, single male/father families (27 | 15.2%) represent the smallest median family size with 2.22 persons per family.
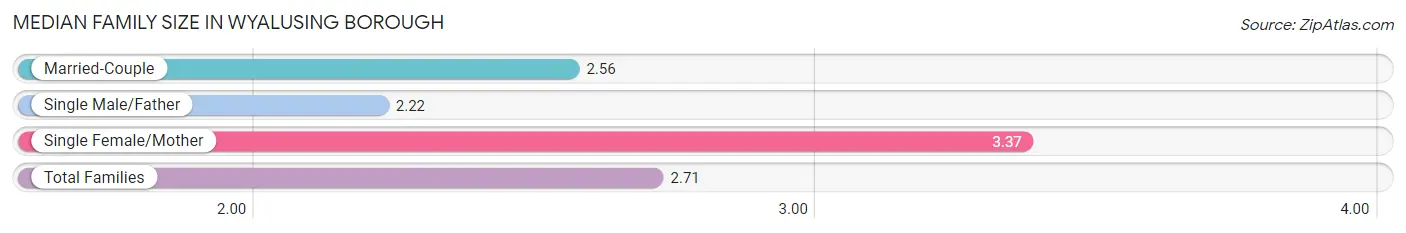
| Family Type | # Families | Family Size |
| Married-Couple | 108 (60.7%) | 2.56 |
| Single Male/Father | 27 (15.2%) | 2.22 |
| Single Female/Mother | 43 (24.2%) | 3.37 |
| Total Families | 178 (100.0%) | 2.71 |
Median Household Size in Wyalusing borough
The median household size in Wyalusing borough is 2.07 persons per household, with single female/mother households (43 | 13.4%) accounting for the largest median household size of 3.47 persons per household. non-family households (144 | 44.7%) represent the smallest median household size with 1.02 persons per household.
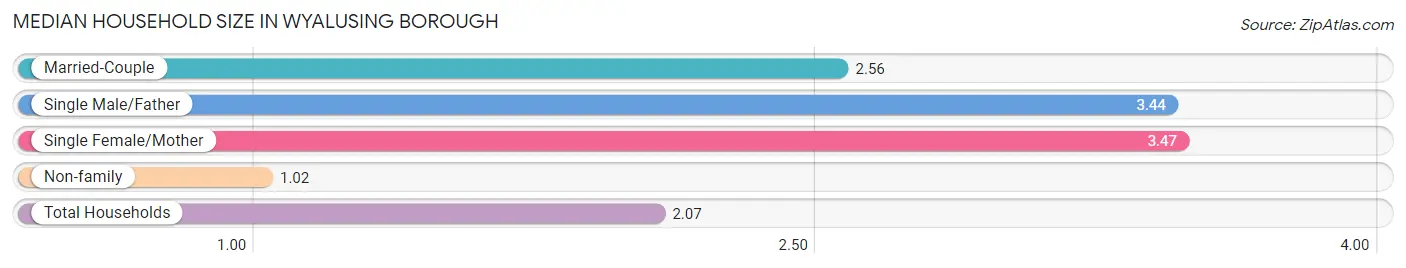
| Household Type | # Households | Household Size |
| Married-Couple | 108 (33.5%) | 2.56 |
| Single Male/Father | 27 (8.4%) | 3.44 |
| Single Female/Mother | 43 (13.4%) | 3.47 |
| Non-family | 144 (44.7%) | 1.02 |
| Total Households | 322 (100.0%) | 2.07 |
Household Size by Marriage Status in Wyalusing borough
Out of a total of 322 households in Wyalusing borough, 178 (55.3%) are family households, while 144 (44.7%) are nonfamily households. The most numerous type of family households are 2-person households, comprising 110, and the most common type of nonfamily households are 1-person households, comprising 141.
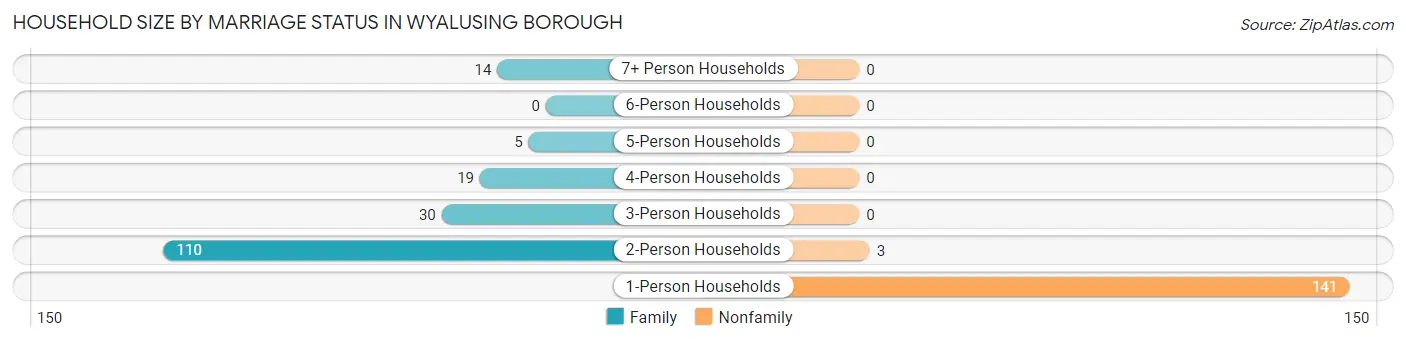
| Household Size | Family Households | Nonfamily Households |
| 1-Person Households | - | 141 (43.8%) |
| 2-Person Households | 110 (34.2%) | 3 (0.9%) |
| 3-Person Households | 30 (9.3%) | 0 (0.0%) |
| 4-Person Households | 19 (5.9%) | 0 (0.0%) |
| 5-Person Households | 5 (1.5%) | 0 (0.0%) |
| 6-Person Households | 0 (0.0%) | 0 (0.0%) |
| 7+ Person Households | 14 (4.3%) | 0 (0.0%) |
| Total | 178 (55.3%) | 144 (44.7%) |
Female Fertility in Wyalusing borough
Fertility by Age in Wyalusing borough
Average fertility rate in Wyalusing borough is 143.0 births per 1,000 women. Women in the age bracket of 15 to 19 years have the highest fertility rate with 389.0 births per 1,000 women. Women in the age bracket of 15 to 19 years acount for 43.8% of all women with births.
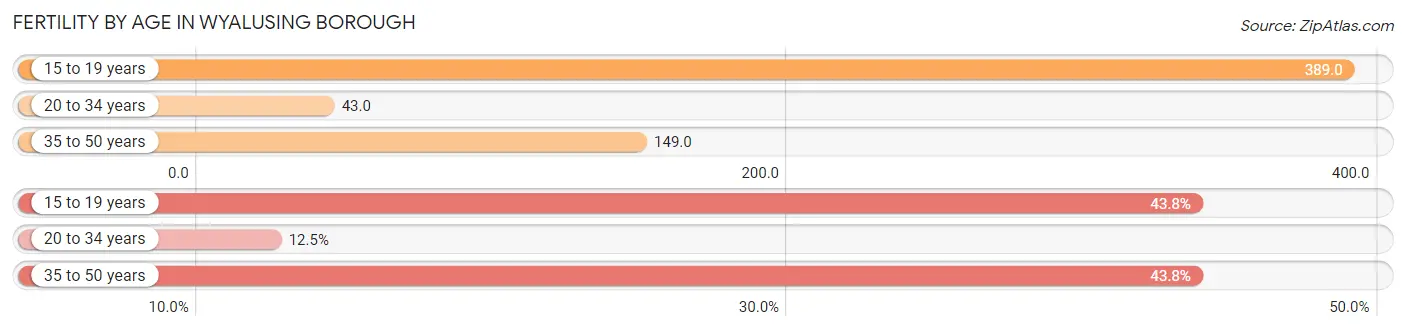
| Age Bracket | Women with Births | Births / 1,000 Women |
| 15 to 19 years | 7 (43.8%) | 389.0 |
| 20 to 34 years | 2 (12.5%) | 43.0 |
| 35 to 50 years | 7 (43.8%) | 149.0 |
| Total | 16 (100.0%) | 143.0 |
Fertility by Age by Marriage Status in Wyalusing borough
31.2% of women with births (16) in Wyalusing borough are married. The highest percentage of unmarried women with births falls into 15 to 19 years age bracket with 100.0% of them unmarried at the time of birth, while the lowest percentage of unmarried women with births belong to 35 to 50 years age bracket with 28.6% of them unmarried.
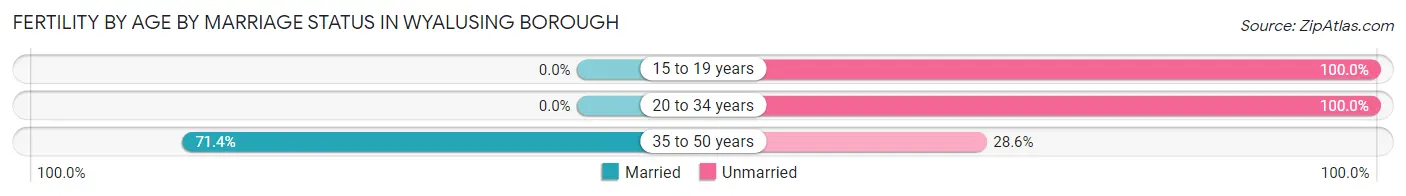
| Age Bracket | Married | Unmarried |
| 15 to 19 years | 0 (0.0%) | 7 (100.0%) |
| 20 to 34 years | 0 (0.0%) | 2 (100.0%) |
| 35 to 50 years | 5 (71.4%) | 2 (28.6%) |
| Total | 5 (31.2%) | 11 (68.8%) |
Fertility by Education in Wyalusing borough
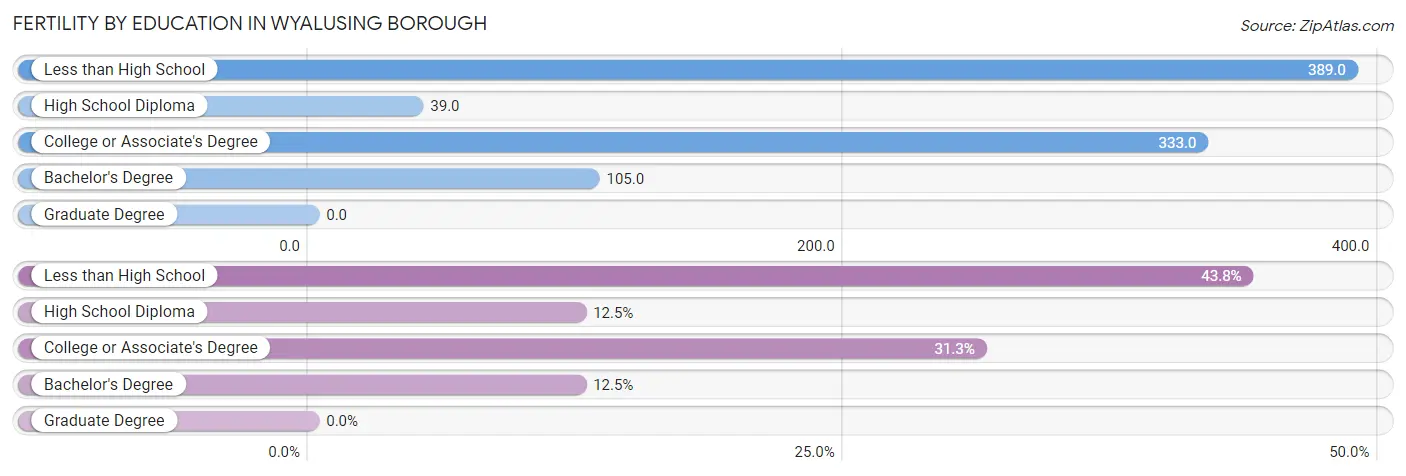
| Educational Attainment | Women with Births | Births / 1,000 Women |
| Less than High School | 7 (43.8%) | 389.0 |
| High School Diploma | 2 (12.5%) | 39.0 |
| College or Associate's Degree | 5 (31.2%) | 333.0 |
| Bachelor's Degree | 2 (12.5%) | 105.0 |
| Graduate Degree | 0 (0.0%) | 0.0 |
| Total | 16 (100.0%) | 143.0 |
Fertility by Education by Marriage Status in Wyalusing borough
68.8% of women with births in Wyalusing borough are unmarried. Women with the educational attainment of bachelor's degree are most likely to be married with 100.0% of them married at childbirth, while women with the educational attainment of less than high school are least likely to be married with 100.0% of them unmarried at childbirth.
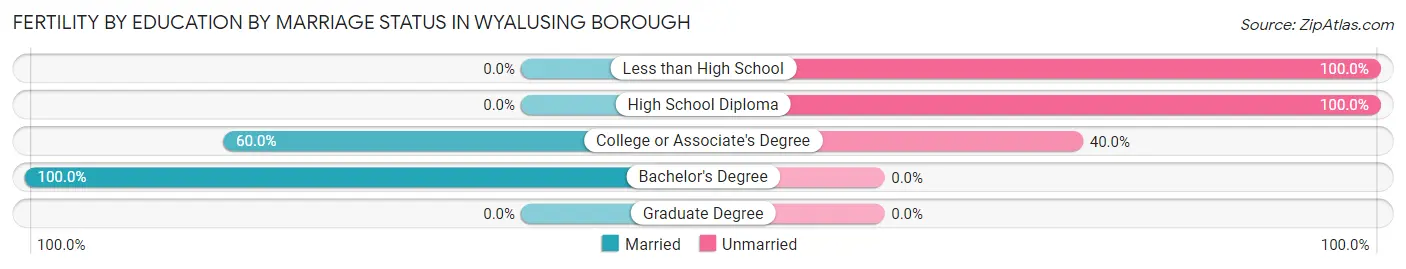
| Educational Attainment | Married | Unmarried |
| Less than High School | 0 (0.0%) | 7 (100.0%) |
| High School Diploma | 0 (0.0%) | 2 (100.0%) |
| College or Associate's Degree | 3 (60.0%) | 2 (40.0%) |
| Bachelor's Degree | 2 (100.0%) | 0 (0.0%) |
| Graduate Degree | 0 (0.0%) | 0 (0.0%) |
| Total | 5 (31.2%) | 11 (68.8%) |
Employment Characteristics in Wyalusing borough
Employment by Class of Employer in Wyalusing borough
Among the 260 employed individuals in Wyalusing borough, private company employees (208 | 80.0%), self-employed (not incorporated) (15 | 5.8%), and local government employees (15 | 5.8%) make up the most common classes of employment.
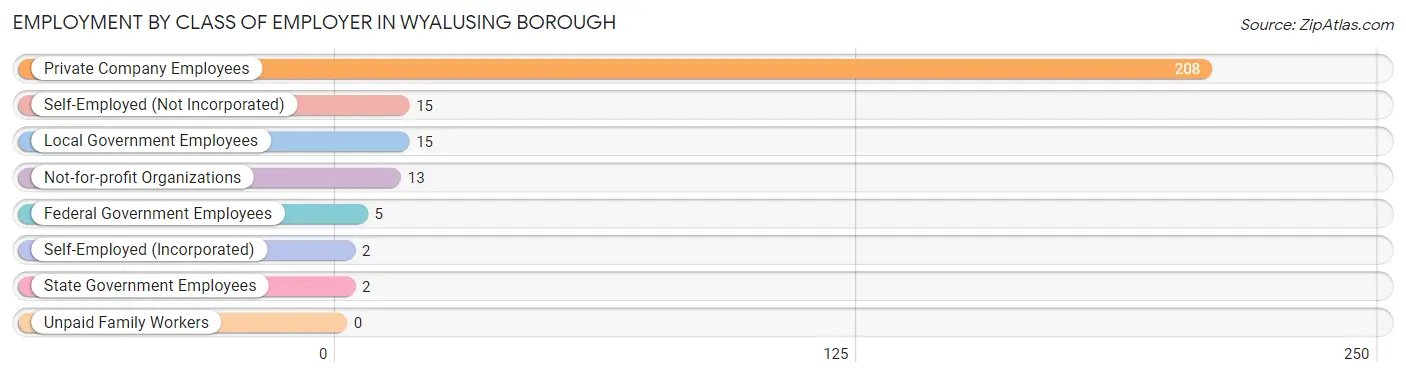
| Employer Class | # Employees | % Employees |
| Private Company Employees | 208 | 80.0% |
| Self-Employed (Incorporated) | 2 | 0.8% |
| Self-Employed (Not Incorporated) | 15 | 5.8% |
| Not-for-profit Organizations | 13 | 5.0% |
| Local Government Employees | 15 | 5.8% |
| State Government Employees | 2 | 0.8% |
| Federal Government Employees | 5 | 1.9% |
| Unpaid Family Workers | 0 | 0.0% |
| Total | 260 | 100.0% |
Employment Status by Age in Wyalusing borough
According to the labor force statistics for Wyalusing borough, out of the total population over 16 years of age (514), 51.0% or 262 individuals are in the labor force, with 0.8% or 2 of them unemployed. The age group with the highest labor force participation rate is 20 to 24 years, with 100.0% or 17 individuals in the labor force. Within the labor force, the 16 to 19 years age range has the highest percentage of unemployed individuals, with 11.1% or 2 of them being unemployed.
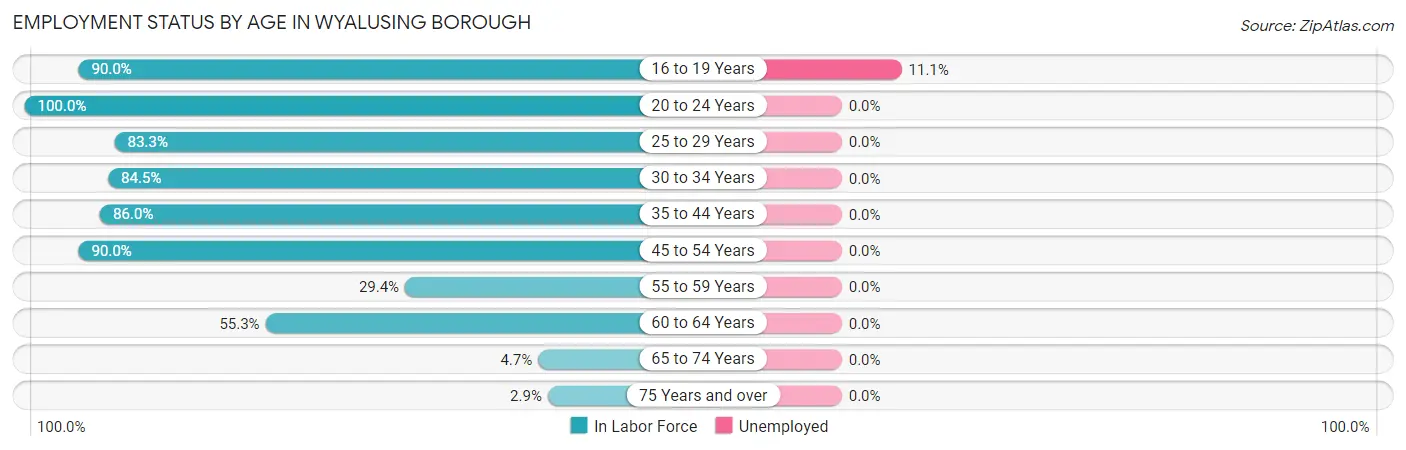
| Age Bracket | In Labor Force | Unemployed |
| 16 to 19 Years | 18 (90.0%) | 2 (11.1%) |
| 20 to 24 Years | 17 (100.0%) | 0 (0.0%) |
| 25 to 29 Years | 25 (83.3%) | 0 (0.0%) |
| 30 to 34 Years | 49 (84.5%) | 0 (0.0%) |
| 35 to 44 Years | 74 (86.0%) | 0 (0.0%) |
| 45 to 54 Years | 36 (90.0%) | 0 (0.0%) |
| 55 to 59 Years | 15 (29.4%) | 0 (0.0%) |
| 60 to 64 Years | 21 (55.3%) | 0 (0.0%) |
| 65 to 74 Years | 5 (4.7%) | 0 (0.0%) |
| 75 Years and over | 2 (2.9%) | 0 (0.0%) |
| Total | 262 (51.0%) | 2 (0.8%) |
Employment Status by Educational Attainment in Wyalusing borough
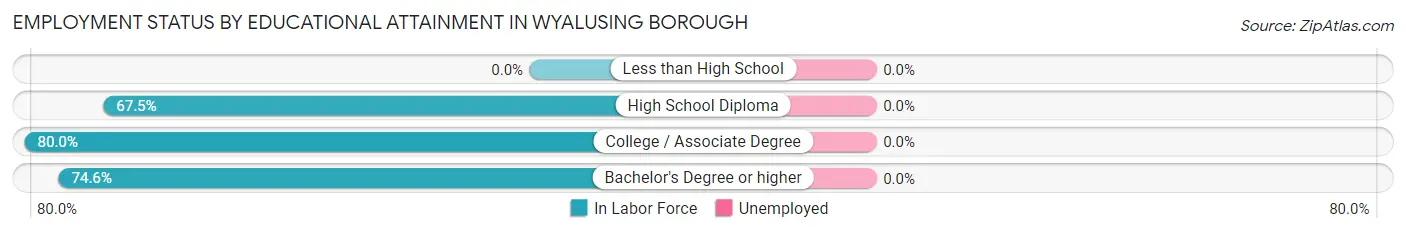
| Educational Attainment | In Labor Force | Unemployed |
| Less than High School | 0 (0.0%) | 0 (0.0%) |
| High School Diploma | 102 (67.5%) | 0 (0.0%) |
| College / Associate Degree | 68 (80.0%) | 0 (0.0%) |
| Bachelor's Degree or higher | 50 (74.6%) | 0 (0.0%) |
| Total | 220 (72.6%) | 0 (0.0%) |
Employment Occupations by Sex in Wyalusing borough
Management, Business, Science and Arts Occupations
The most common Management, Business, Science and Arts occupations in Wyalusing borough are Business & Financial (14 | 5.4%), Computers, Engineering & Science (14 | 5.4%), Architecture & Engineering (14 | 5.4%), Community & Social Service (13 | 5.0%), and Education Instruction & Library (13 | 5.0%).
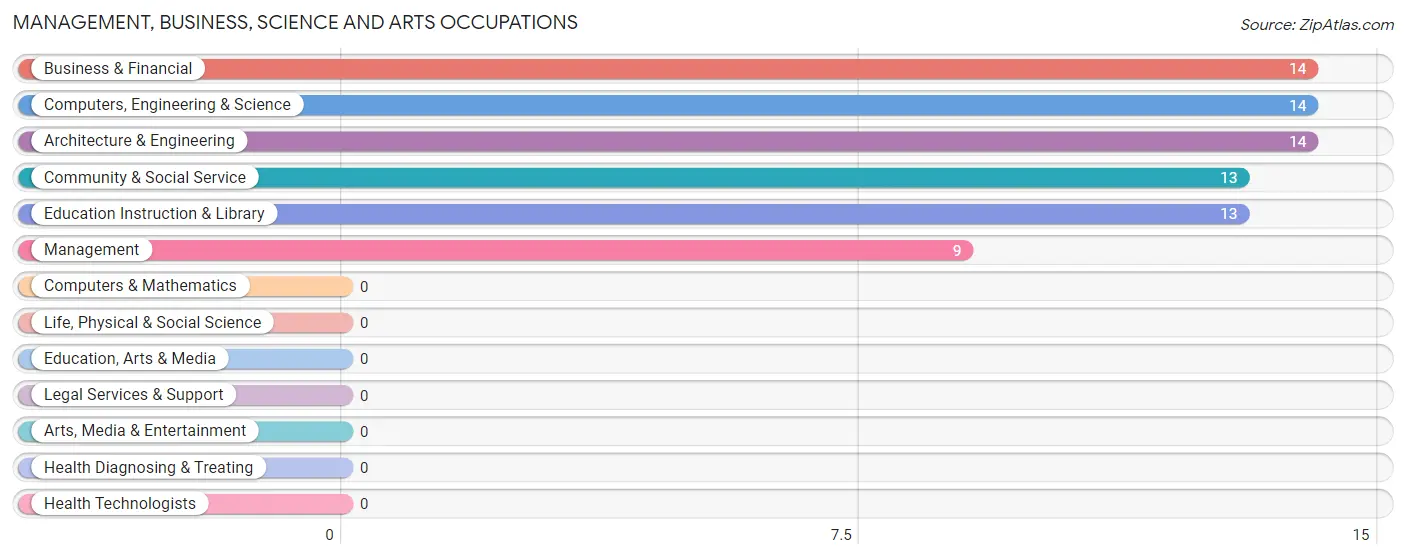
Management, Business, Science and Arts Occupations by Sex
Within the Management, Business, Science and Arts occupations in Wyalusing borough, the most male-oriented occupations are Management (100.0%), Business & Financial (100.0%), and Community & Social Service (30.8%), while the most female-oriented occupations are Computers, Engineering & Science (100.0%), Architecture & Engineering (100.0%), and Community & Social Service (69.2%).
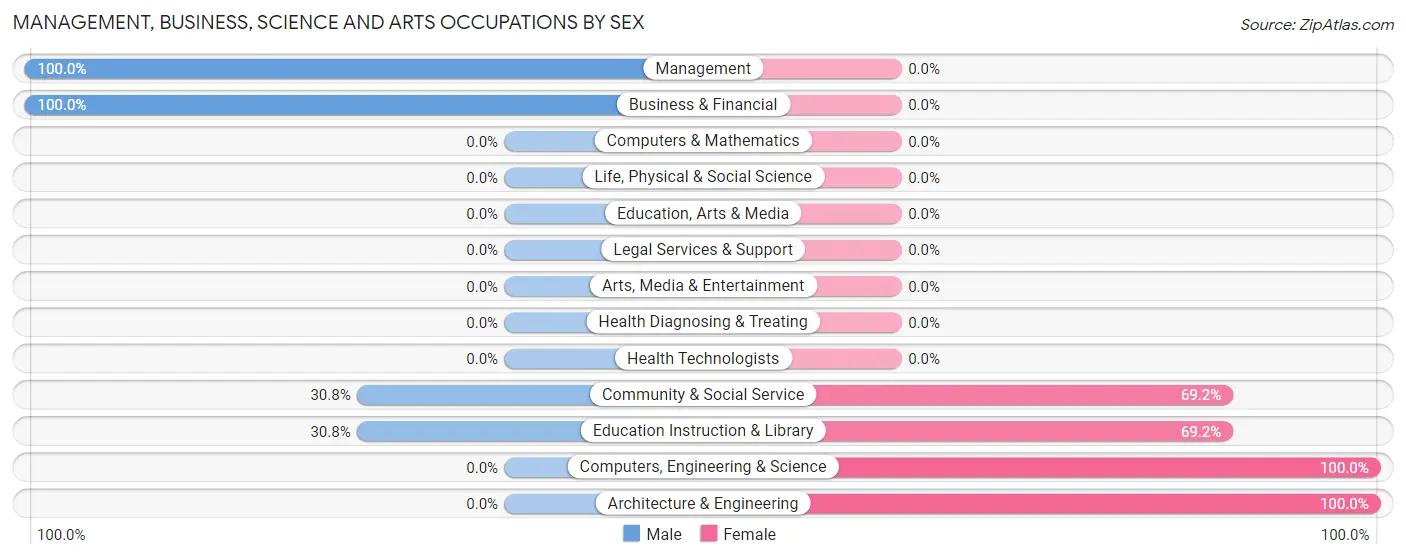
| Occupation | Male | Female |
| Management | 9 (100.0%) | 0 (0.0%) |
| Business & Financial | 14 (100.0%) | 0 (0.0%) |
| Computers, Engineering & Science | 0 (0.0%) | 14 (100.0%) |
| Computers & Mathematics | 0 (0.0%) | 0 (0.0%) |
| Architecture & Engineering | 0 (0.0%) | 14 (100.0%) |
| Life, Physical & Social Science | 0 (0.0%) | 0 (0.0%) |
| Community & Social Service | 4 (30.8%) | 9 (69.2%) |
| Education, Arts & Media | 0 (0.0%) | 0 (0.0%) |
| Legal Services & Support | 0 (0.0%) | 0 (0.0%) |
| Education Instruction & Library | 4 (30.8%) | 9 (69.2%) |
| Arts, Media & Entertainment | 0 (0.0%) | 0 (0.0%) |
| Health Diagnosing & Treating | 0 (0.0%) | 0 (0.0%) |
| Health Technologists | 0 (0.0%) | 0 (0.0%) |
| Total (Category) | 27 (54.0%) | 23 (46.0%) |
| Total (Overall) | 135 (51.9%) | 125 (48.1%) |
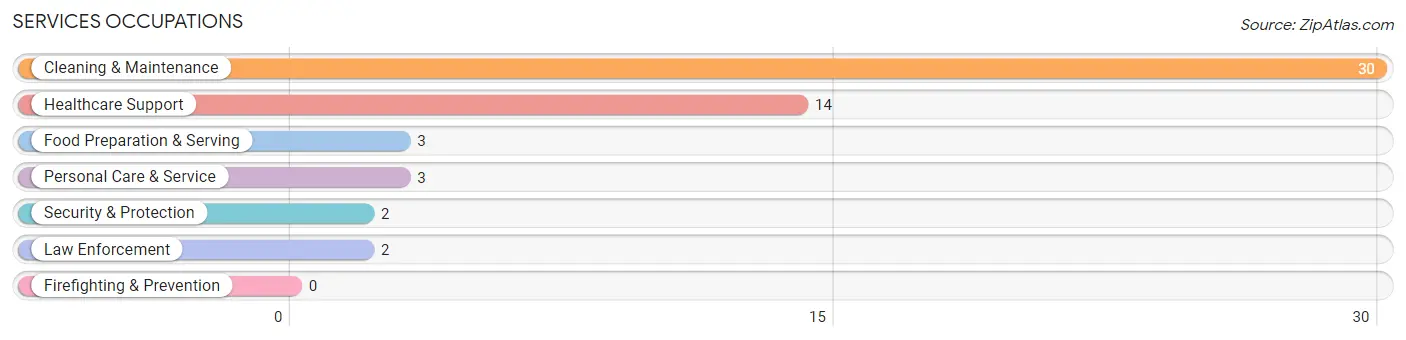
Services Occupations
The most common Services occupations in Wyalusing borough are Cleaning & Maintenance (30 | 11.5%), Healthcare Support (14 | 5.4%), Food Preparation & Serving (3 | 1.1%), Personal Care & Service (3 | 1.1%), and Security & Protection (2 | 0.8%).
Services Occupations by Sex
Within the Services occupations in Wyalusing borough, the most male-oriented occupations are Security & Protection (100.0%), Law Enforcement (100.0%), and Cleaning & Maintenance (36.7%), while the most female-oriented occupations are Healthcare Support (100.0%), Food Preparation & Serving (100.0%), and Personal Care & Service (100.0%).
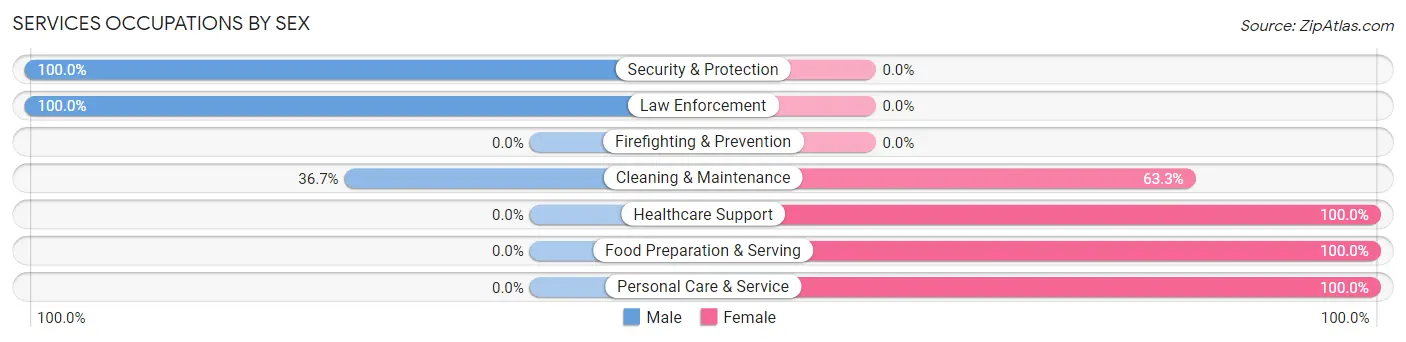
| Occupation | Male | Female |
| Healthcare Support | 0 (0.0%) | 14 (100.0%) |
| Security & Protection | 2 (100.0%) | 0 (0.0%) |
| Firefighting & Prevention | 0 (0.0%) | 0 (0.0%) |
| Law Enforcement | 2 (100.0%) | 0 (0.0%) |
| Food Preparation & Serving | 0 (0.0%) | 3 (100.0%) |
| Cleaning & Maintenance | 11 (36.7%) | 19 (63.3%) |
| Personal Care & Service | 0 (0.0%) | 3 (100.0%) |
| Total (Category) | 13 (25.0%) | 39 (75.0%) |
| Total (Overall) | 135 (51.9%) | 125 (48.1%) |
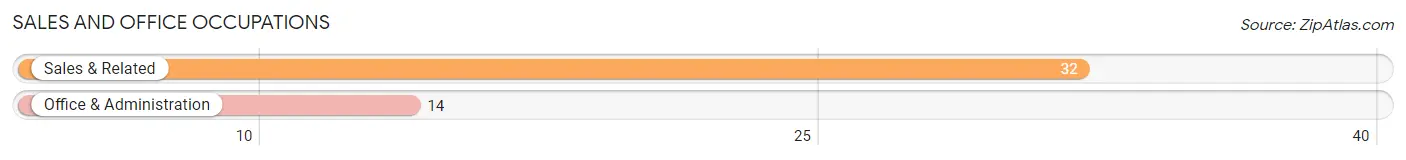
Sales and Office Occupations
The most common Sales and Office occupations in Wyalusing borough are Sales & Related (32 | 12.3%), and Office & Administration (14 | 5.4%).
Sales and Office Occupations by Sex

| Occupation | Male | Female |
| Sales & Related | 15 (46.9%) | 17 (53.1%) |
| Office & Administration | 0 (0.0%) | 14 (100.0%) |
| Total (Category) | 15 (32.6%) | 31 (67.4%) |
| Total (Overall) | 135 (51.9%) | 125 (48.1%) |
Natural Resources, Construction and Maintenance Occupations
The most common Natural Resources, Construction and Maintenance occupations in Wyalusing borough are Installation, Maintenance & Repair (6 | 2.3%), and Construction & Extraction (2 | 0.8%).
Natural Resources, Construction and Maintenance Occupations by Sex
| Occupation | Male | Female |
| Farming, Fishing & Forestry | 0 (0.0%) | 0 (0.0%) |
| Construction & Extraction | 2 (100.0%) | 0 (0.0%) |
| Installation, Maintenance & Repair | 6 (100.0%) | 0 (0.0%) |
| Total (Category) | 8 (100.0%) | 0 (0.0%) |
| Total (Overall) | 135 (51.9%) | 125 (48.1%) |
Production, Transportation and Moving Occupations
The most common Production, Transportation and Moving occupations in Wyalusing borough are Production (47 | 18.1%), Transportation (30 | 11.5%), and Material Moving (27 | 10.4%).
Production, Transportation and Moving Occupations by Sex
| Occupation | Male | Female |
| Production | 28 (59.6%) | 19 (40.4%) |
| Transportation | 26 (86.7%) | 4 (13.3%) |
| Material Moving | 18 (66.7%) | 9 (33.3%) |
| Total (Category) | 72 (69.2%) | 32 (30.8%) |
| Total (Overall) | 135 (51.9%) | 125 (48.1%) |
Employment Industries by Sex in Wyalusing borough
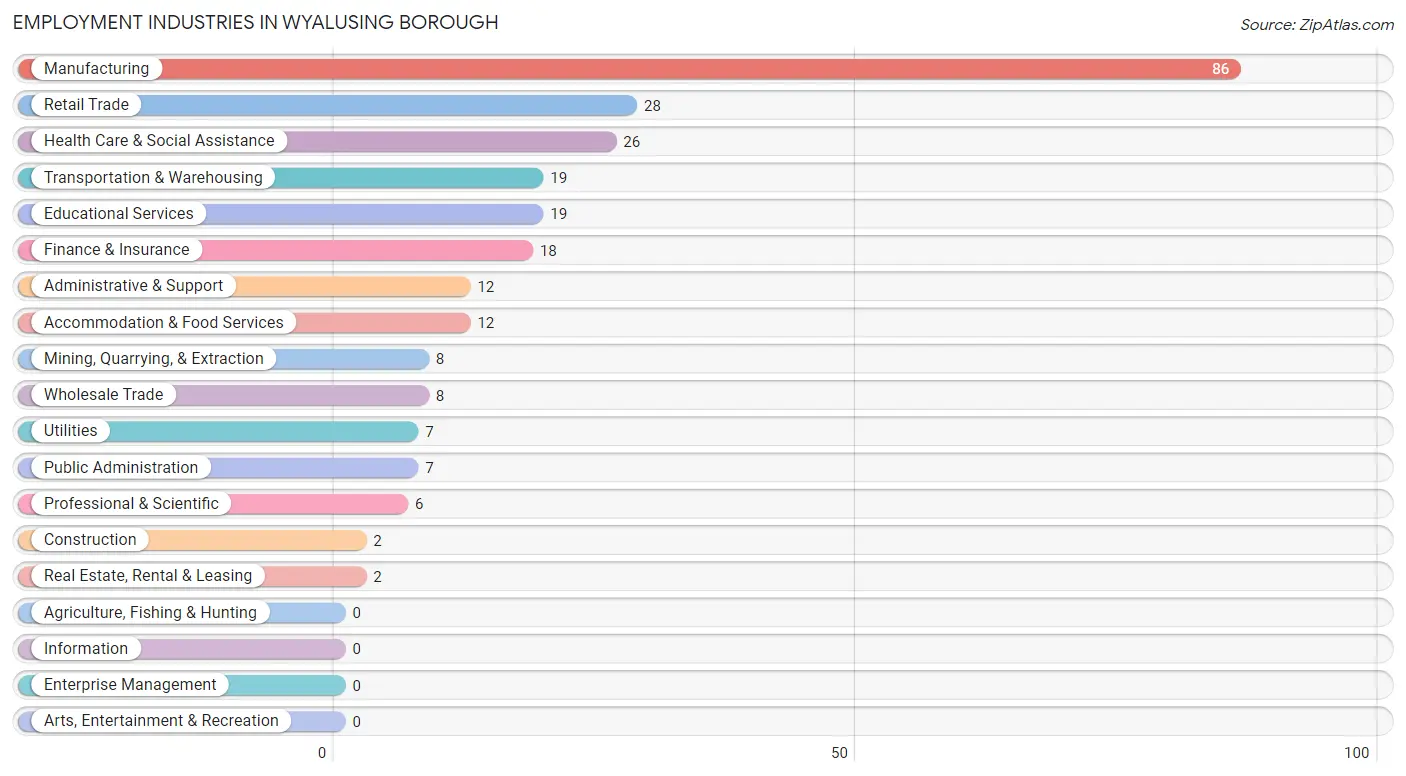
Employment Industries in Wyalusing borough
The major employment industries in Wyalusing borough include Manufacturing (86 | 33.1%), Retail Trade (28 | 10.8%), Health Care & Social Assistance (26 | 10.0%), Transportation & Warehousing (19 | 7.3%), and Educational Services (19 | 7.3%).
Employment Industries by Sex in Wyalusing borough
The Wyalusing borough industries that see more men than women are Mining, Quarrying, & Extraction (100.0%), Construction (100.0%), and Wholesale Trade (100.0%), whereas the industries that tend to have a higher number of women are Administrative & Support (100.0%), Accommodation & Food Services (100.0%), and Educational Services (78.9%).
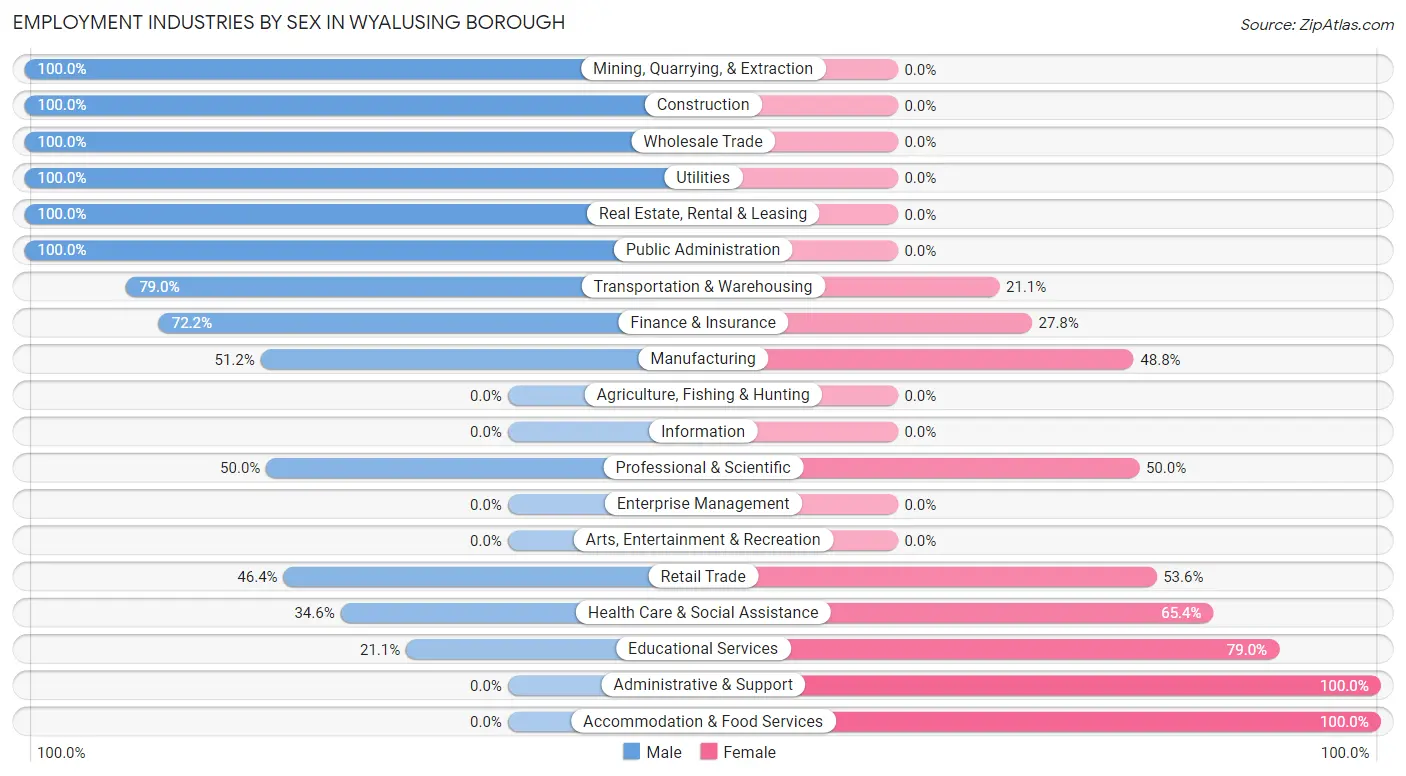
| Industry | Male | Female |
| Agriculture, Fishing & Hunting | 0 (0.0%) | 0 (0.0%) |
| Mining, Quarrying, & Extraction | 8 (100.0%) | 0 (0.0%) |
| Construction | 2 (100.0%) | 0 (0.0%) |
| Manufacturing | 44 (51.2%) | 42 (48.8%) |
| Wholesale Trade | 8 (100.0%) | 0 (0.0%) |
| Retail Trade | 13 (46.4%) | 15 (53.6%) |
| Transportation & Warehousing | 15 (78.9%) | 4 (21.0%) |
| Utilities | 7 (100.0%) | 0 (0.0%) |
| Information | 0 (0.0%) | 0 (0.0%) |
| Finance & Insurance | 13 (72.2%) | 5 (27.8%) |
| Real Estate, Rental & Leasing | 2 (100.0%) | 0 (0.0%) |
| Professional & Scientific | 3 (50.0%) | 3 (50.0%) |
| Enterprise Management | 0 (0.0%) | 0 (0.0%) |
| Administrative & Support | 0 (0.0%) | 12 (100.0%) |
| Educational Services | 4 (21.0%) | 15 (78.9%) |
| Health Care & Social Assistance | 9 (34.6%) | 17 (65.4%) |
| Arts, Entertainment & Recreation | 0 (0.0%) | 0 (0.0%) |
| Accommodation & Food Services | 0 (0.0%) | 12 (100.0%) |
| Public Administration | 7 (100.0%) | 0 (0.0%) |
| Total | 135 (51.9%) | 125 (48.1%) |
Education in Wyalusing borough
School Enrollment in Wyalusing borough
The most common levels of schooling among the 157 students in Wyalusing borough are elementary school (61 | 38.9%), middle school (55 | 35.0%), and high school (21 | 13.4%).
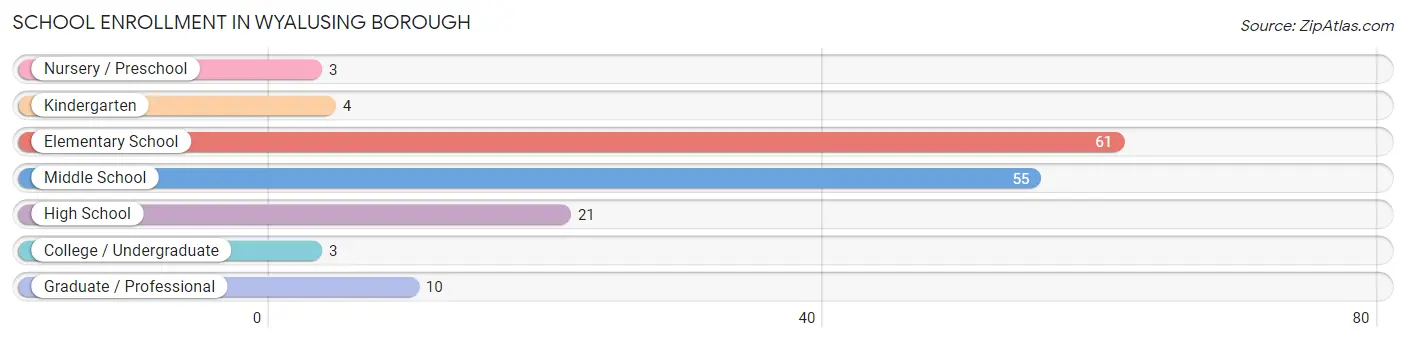
| School Level | # Students | % Students |
| Nursery / Preschool | 3 | 1.9% |
| Kindergarten | 4 | 2.5% |
| Elementary School | 61 | 38.9% |
| Middle School | 55 | 35.0% |
| High School | 21 | 13.4% |
| College / Undergraduate | 3 | 1.9% |
| Graduate / Professional | 10 | 6.4% |
| Total | 157 | 100.0% |
School Enrollment by Age by Funding Source in Wyalusing borough
Out of a total of 157 students who are enrolled in schools in Wyalusing borough, 10 (6.4%) attend a private institution, while the remaining 147 (93.6%) are enrolled in public schools. The age group of 35 years and over has the highest likelihood of being enrolled in private schools, with 3 (25.0% in the age bracket) enrolled. Conversely, the age group of 15 to 17 year olds has the lowest likelihood of being enrolled in a private school, with 18 (100.0% in the age bracket) attending a public institution.
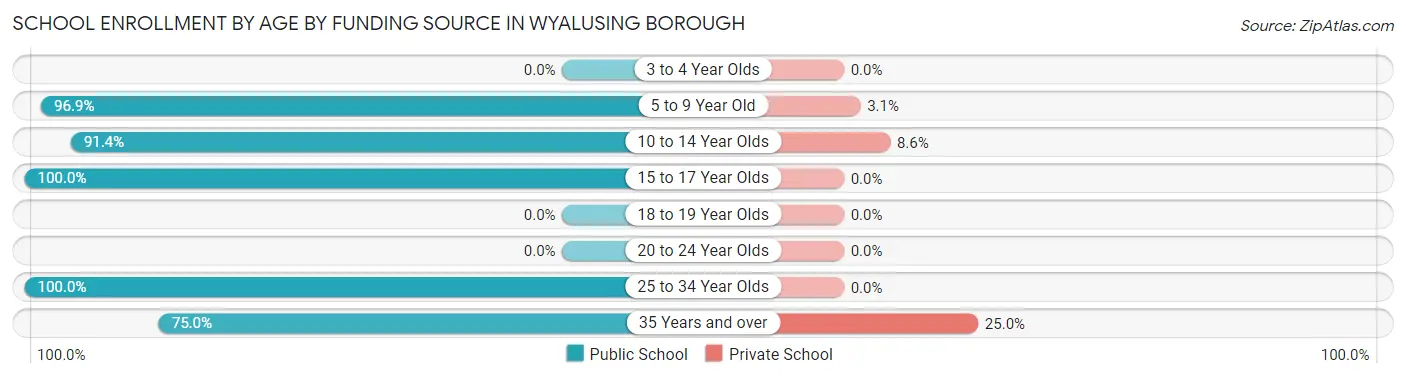
| Age Bracket | Public School | Private School |
| 3 to 4 Year Olds | 0 (0.0%) | 0 (0.0%) |
| 5 to 9 Year Old | 63 (96.9%) | 2 (3.1%) |
| 10 to 14 Year Olds | 53 (91.4%) | 5 (8.6%) |
| 15 to 17 Year Olds | 18 (100.0%) | 0 (0.0%) |
| 18 to 19 Year Olds | 0 (0.0%) | 0 (0.0%) |
| 20 to 24 Year Olds | 0 (0.0%) | 0 (0.0%) |
| 25 to 34 Year Olds | 4 (100.0%) | 0 (0.0%) |
| 35 Years and over | 9 (75.0%) | 3 (25.0%) |
| Total | 147 (93.6%) | 10 (6.4%) |
Educational Attainment by Field of Study in Wyalusing borough
Business (16 | 22.2%), engineering (14 | 19.4%), bio, nature & agricultural (11 | 15.3%), science & technology (9 | 12.5%), and education (7 | 9.7%) are the most common fields of study among 72 individuals in Wyalusing borough who have obtained a bachelor's degree or higher.
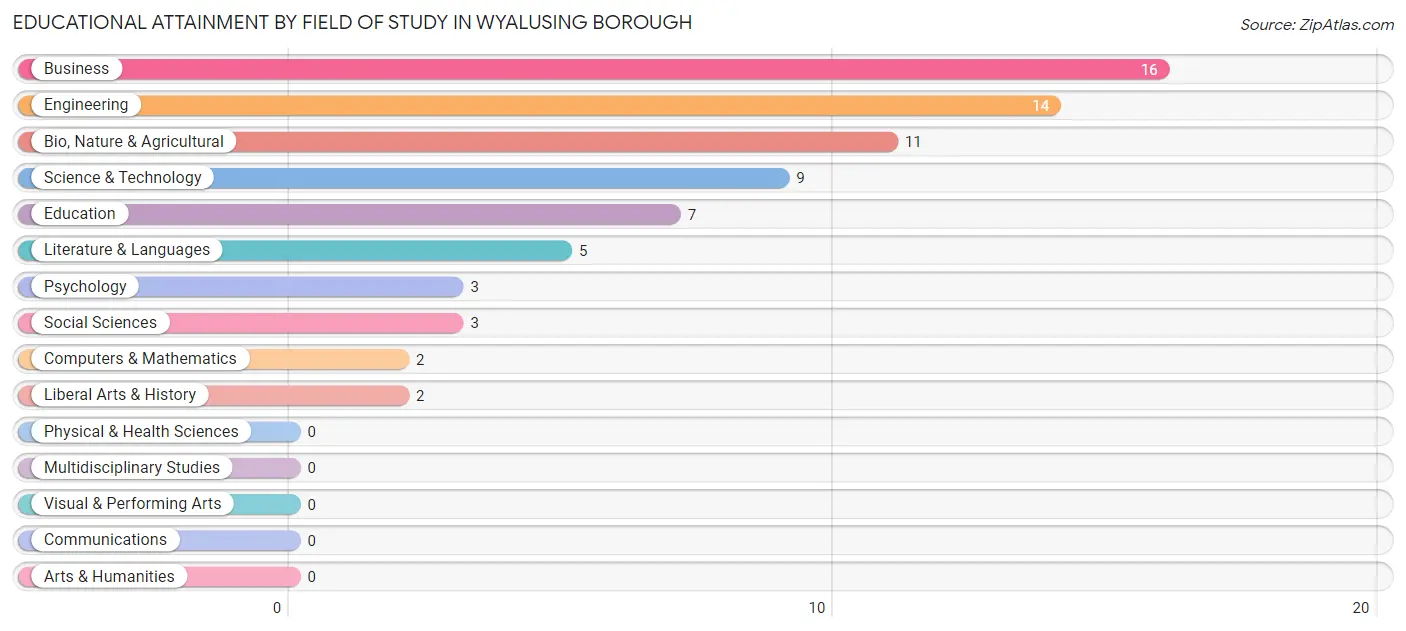
| Field of Study | # Graduates | % Graduates |
| Computers & Mathematics | 2 | 2.8% |
| Bio, Nature & Agricultural | 11 | 15.3% |
| Physical & Health Sciences | 0 | 0.0% |
| Psychology | 3 | 4.2% |
| Social Sciences | 3 | 4.2% |
| Engineering | 14 | 19.4% |
| Multidisciplinary Studies | 0 | 0.0% |
| Science & Technology | 9 | 12.5% |
| Business | 16 | 22.2% |
| Education | 7 | 9.7% |
| Literature & Languages | 5 | 6.9% |
| Liberal Arts & History | 2 | 2.8% |
| Visual & Performing Arts | 0 | 0.0% |
| Communications | 0 | 0.0% |
| Arts & Humanities | 0 | 0.0% |
| Total | 72 | 100.0% |
Transportation & Commute in Wyalusing borough
Vehicle Availability by Sex in Wyalusing borough
The most prevalent vehicle ownership categories in Wyalusing borough are males with 2 vehicles (52, accounting for 38.5%) and females with 2 vehicles (60, making up 41.6%).
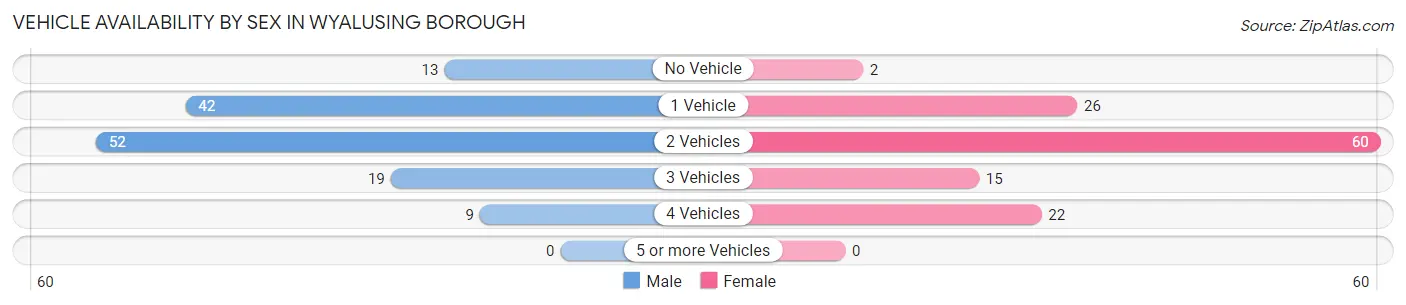
| Vehicles Available | Male | Female |
| No Vehicle | 13 (9.6%) | 2 (1.6%) |
| 1 Vehicle | 42 (31.1%) | 26 (20.8%) |
| 2 Vehicles | 52 (38.5%) | 60 (48.0%) |
| 3 Vehicles | 19 (14.1%) | 15 (12.0%) |
| 4 Vehicles | 9 (6.7%) | 22 (17.6%) |
| 5 or more Vehicles | 0 (0.0%) | 0 (0.0%) |
| Total | 135 (100.0%) | 125 (100.0%) |
Commute Time in Wyalusing borough
The most frequently occuring commute durations in Wyalusing borough are 5 to 9 minutes (91 commuters, 35.8%), 10 to 14 minutes (40 commuters, 15.8%), and 20 to 24 minutes (32 commuters, 12.6%).
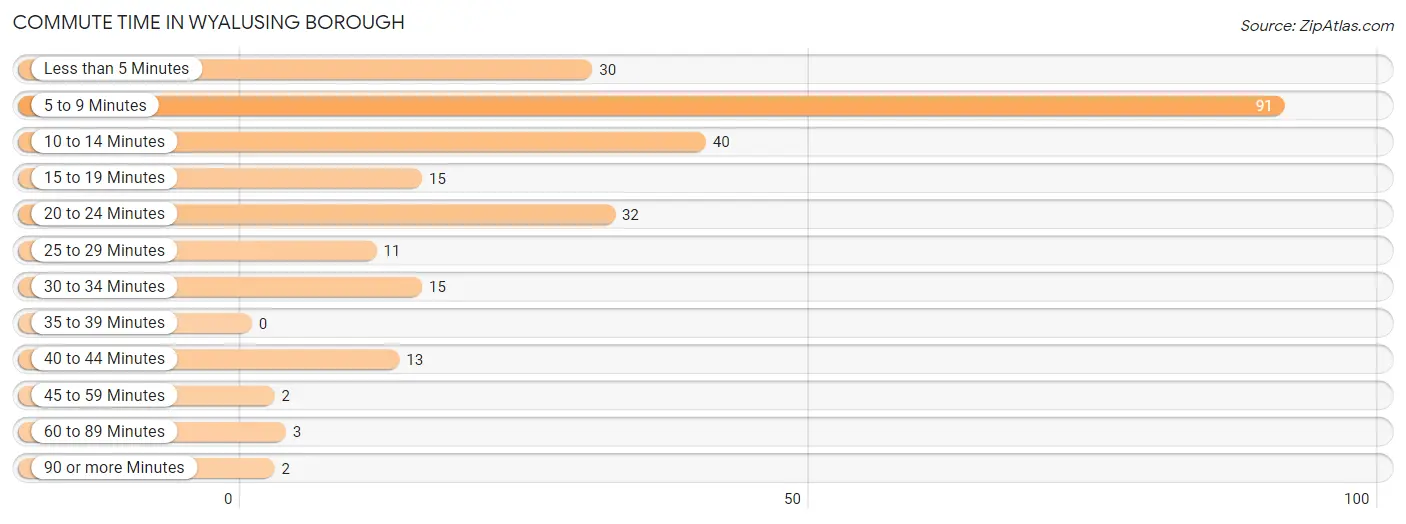
| Commute Time | # Commuters | % Commuters |
| Less than 5 Minutes | 30 | 11.8% |
| 5 to 9 Minutes | 91 | 35.8% |
| 10 to 14 Minutes | 40 | 15.8% |
| 15 to 19 Minutes | 15 | 5.9% |
| 20 to 24 Minutes | 32 | 12.6% |
| 25 to 29 Minutes | 11 | 4.3% |
| 30 to 34 Minutes | 15 | 5.9% |
| 35 to 39 Minutes | 0 | 0.0% |
| 40 to 44 Minutes | 13 | 5.1% |
| 45 to 59 Minutes | 2 | 0.8% |
| 60 to 89 Minutes | 3 | 1.2% |
| 90 or more Minutes | 2 | 0.8% |
Commute Time by Sex in Wyalusing borough
The most common commute times in Wyalusing borough are 10 to 14 minutes (34 commuters, 25.2%) for males and 5 to 9 minutes (61 commuters, 51.3%) for females.
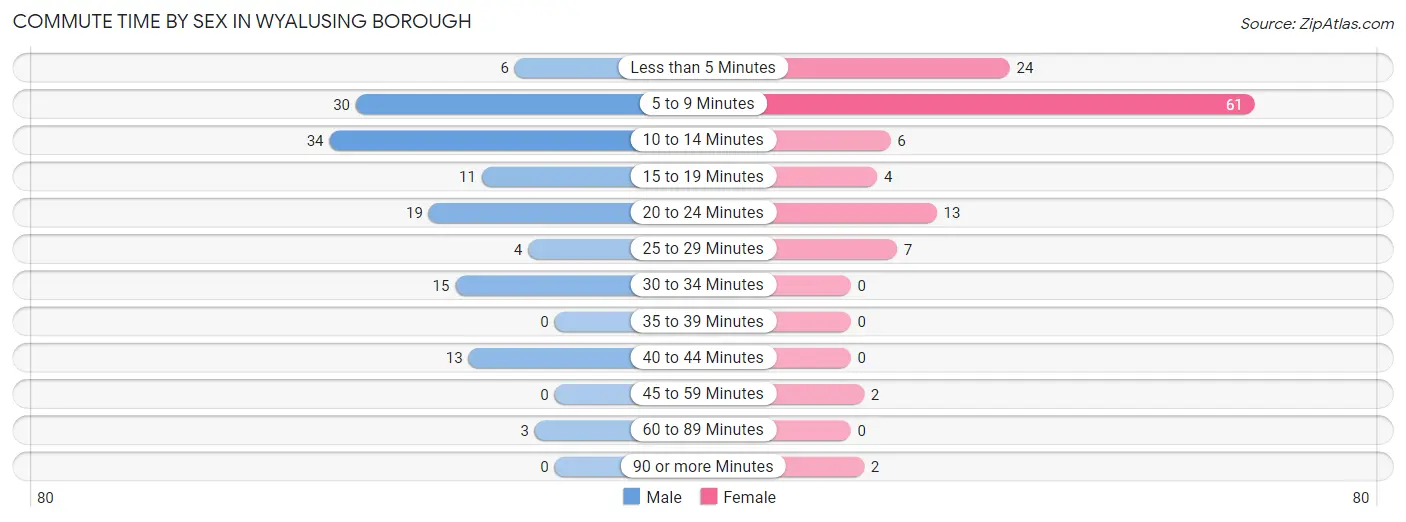
| Commute Time | Male | Female |
| Less than 5 Minutes | 6 (4.4%) | 24 (20.2%) |
| 5 to 9 Minutes | 30 (22.2%) | 61 (51.3%) |
| 10 to 14 Minutes | 34 (25.2%) | 6 (5.0%) |
| 15 to 19 Minutes | 11 (8.2%) | 4 (3.4%) |
| 20 to 24 Minutes | 19 (14.1%) | 13 (10.9%) |
| 25 to 29 Minutes | 4 (3.0%) | 7 (5.9%) |
| 30 to 34 Minutes | 15 (11.1%) | 0 (0.0%) |
| 35 to 39 Minutes | 0 (0.0%) | 0 (0.0%) |
| 40 to 44 Minutes | 13 (9.6%) | 0 (0.0%) |
| 45 to 59 Minutes | 0 (0.0%) | 2 (1.7%) |
| 60 to 89 Minutes | 3 (2.2%) | 0 (0.0%) |
| 90 or more Minutes | 0 (0.0%) | 2 (1.7%) |
Time of Departure to Work by Sex in Wyalusing borough
The most frequent times of departure to work in Wyalusing borough are 5:30 AM to 5:59 AM (35, 25.9%) for males and 12:00 AM to 4:59 AM (28, 23.5%) for females.
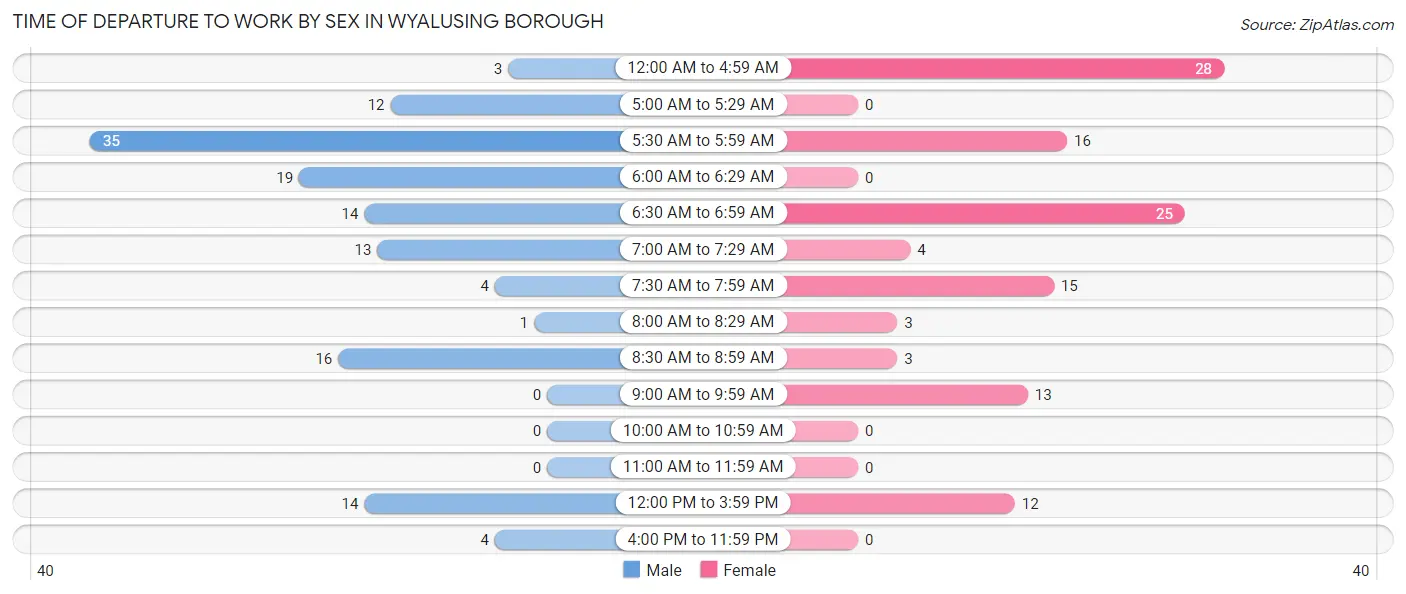
| Time of Departure | Male | Female |
| 12:00 AM to 4:59 AM | 3 (2.2%) | 28 (23.5%) |
| 5:00 AM to 5:29 AM | 12 (8.9%) | 0 (0.0%) |
| 5:30 AM to 5:59 AM | 35 (25.9%) | 16 (13.5%) |
| 6:00 AM to 6:29 AM | 19 (14.1%) | 0 (0.0%) |
| 6:30 AM to 6:59 AM | 14 (10.4%) | 25 (21.0%) |
| 7:00 AM to 7:29 AM | 13 (9.6%) | 4 (3.4%) |
| 7:30 AM to 7:59 AM | 4 (3.0%) | 15 (12.6%) |
| 8:00 AM to 8:29 AM | 1 (0.7%) | 3 (2.5%) |
| 8:30 AM to 8:59 AM | 16 (11.8%) | 3 (2.5%) |
| 9:00 AM to 9:59 AM | 0 (0.0%) | 13 (10.9%) |
| 10:00 AM to 10:59 AM | 0 (0.0%) | 0 (0.0%) |
| 11:00 AM to 11:59 AM | 0 (0.0%) | 0 (0.0%) |
| 12:00 PM to 3:59 PM | 14 (10.4%) | 12 (10.1%) |
| 4:00 PM to 11:59 PM | 4 (3.0%) | 0 (0.0%) |
| Total | 135 (100.0%) | 119 (100.0%) |
Housing Occupancy in Wyalusing borough
Occupancy by Ownership in Wyalusing borough
Of the total 322 dwellings in Wyalusing borough, owner-occupied units account for 169 (52.5%), while renter-occupied units make up 153 (47.5%).
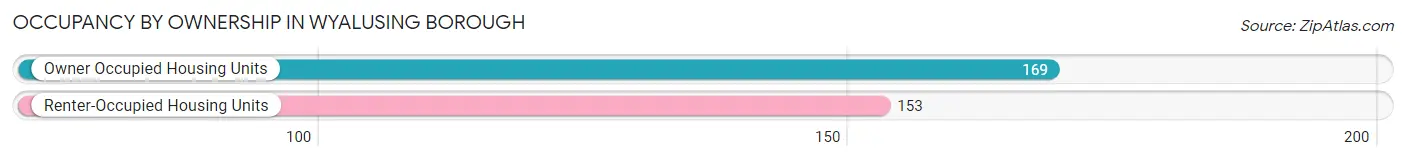
| Occupancy | # Housing Units | % Housing Units |
| Owner Occupied Housing Units | 169 | 52.5% |
| Renter-Occupied Housing Units | 153 | 47.5% |
| Total Occupied Housing Units | 322 | 100.0% |
Occupancy by Household Size in Wyalusing borough
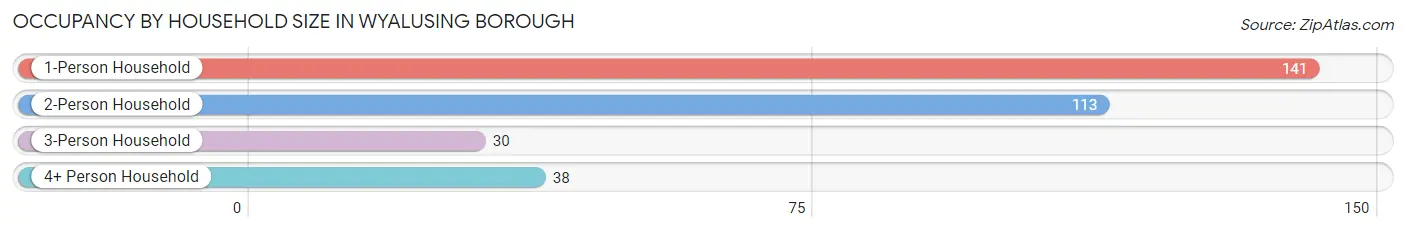
| Household Size | # Housing Units | % Housing Units |
| 1-Person Household | 141 | 43.8% |
| 2-Person Household | 113 | 35.1% |
| 3-Person Household | 30 | 9.3% |
| 4+ Person Household | 38 | 11.8% |
| Total Housing Units | 322 | 100.0% |
Occupancy by Ownership by Household Size in Wyalusing borough
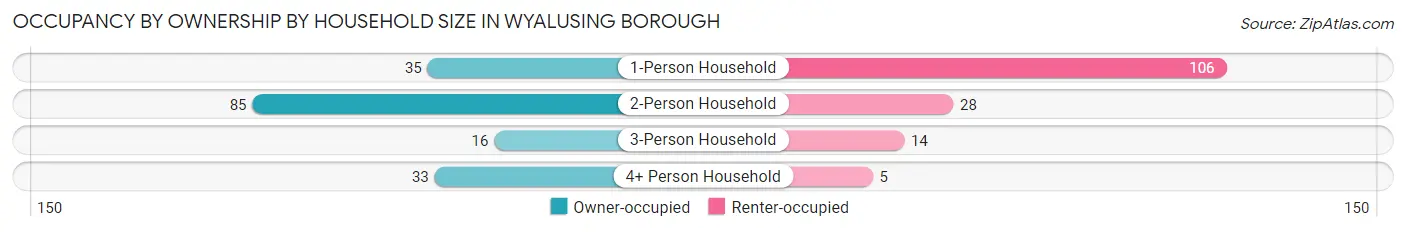
| Household Size | Owner-occupied | Renter-occupied |
| 1-Person Household | 35 (24.8%) | 106 (75.2%) |
| 2-Person Household | 85 (75.2%) | 28 (24.8%) |
| 3-Person Household | 16 (53.3%) | 14 (46.7%) |
| 4+ Person Household | 33 (86.8%) | 5 (13.2%) |
| Total Housing Units | 169 (52.5%) | 153 (47.5%) |
Occupancy by Educational Attainment in Wyalusing borough
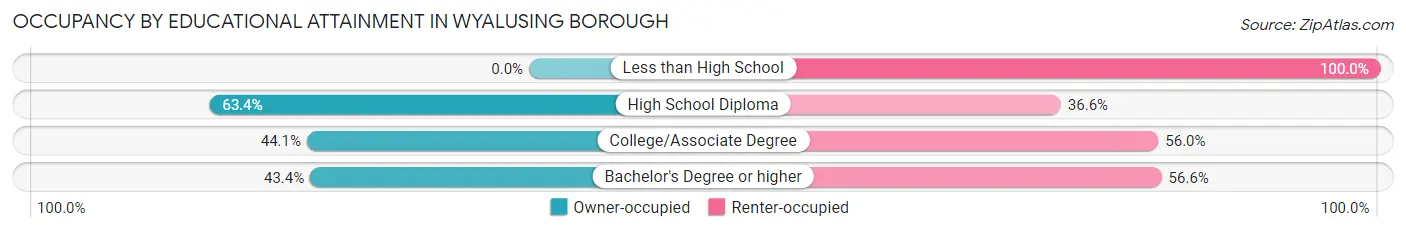
| Household Size | Owner-occupied | Renter-occupied |
| Less than High School | 0 (0.0%) | 13 (100.0%) |
| High School Diploma | 109 (63.4%) | 63 (36.6%) |
| College/Associate Degree | 37 (44.1%) | 47 (55.9%) |
| Bachelor's Degree or higher | 23 (43.4%) | 30 (56.6%) |
Occupancy by Age of Householder in Wyalusing borough
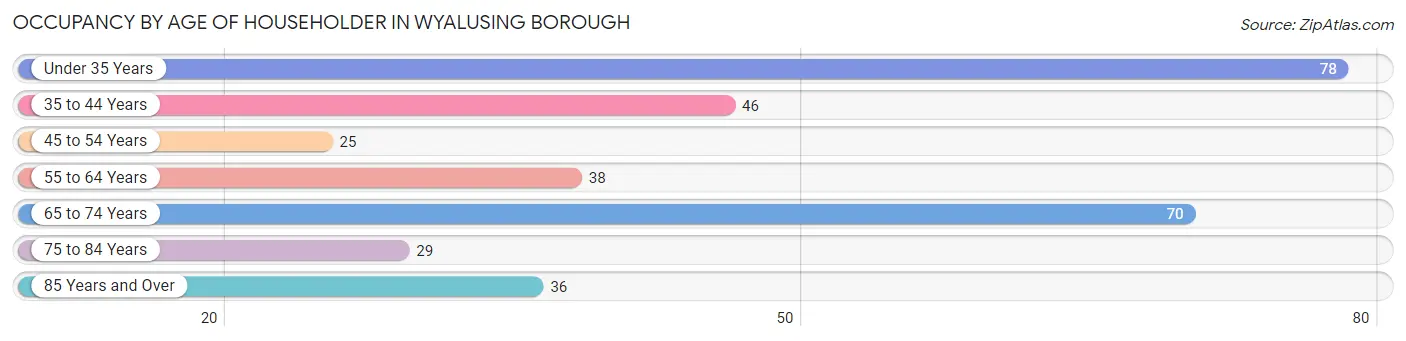
| Age Bracket | # Households | % Households |
| Under 35 Years | 78 | 24.2% |
| 35 to 44 Years | 46 | 14.3% |
| 45 to 54 Years | 25 | 7.8% |
| 55 to 64 Years | 38 | 11.8% |
| 65 to 74 Years | 70 | 21.7% |
| 75 to 84 Years | 29 | 9.0% |
| 85 Years and Over | 36 | 11.2% |
| Total | 322 | 100.0% |
Housing Finances in Wyalusing borough
Median Income by Occupancy in Wyalusing borough
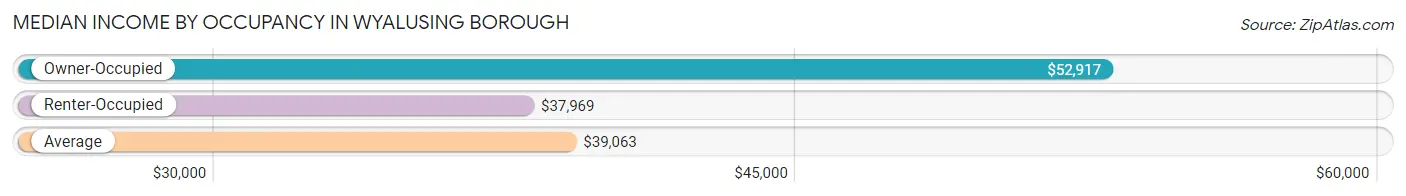
| Occupancy Type | # Households | Median Income |
| Owner-Occupied | 169 (52.5%) | $52,917 |
| Renter-Occupied | 153 (47.5%) | $37,969 |
| Average | 322 (100.0%) | $39,063 |
Occupancy by Householder Income Bracket in Wyalusing borough
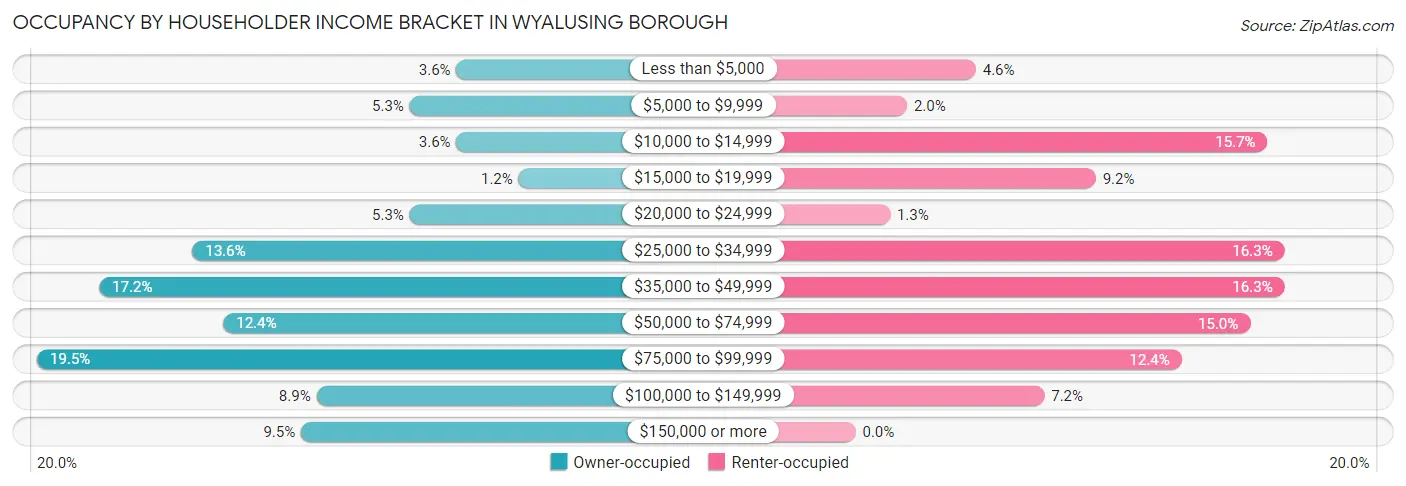
| Income Bracket | Owner-occupied | Renter-occupied |
| Less than $5,000 | 6 (3.5%) | 7 (4.6%) |
| $5,000 to $9,999 | 9 (5.3%) | 3 (2.0%) |
| $10,000 to $14,999 | 6 (3.5%) | 24 (15.7%) |
| $15,000 to $19,999 | 2 (1.2%) | 14 (9.1%) |
| $20,000 to $24,999 | 9 (5.3%) | 2 (1.3%) |
| $25,000 to $34,999 | 23 (13.6%) | 25 (16.3%) |
| $35,000 to $49,999 | 29 (17.2%) | 25 (16.3%) |
| $50,000 to $74,999 | 21 (12.4%) | 23 (15.0%) |
| $75,000 to $99,999 | 33 (19.5%) | 19 (12.4%) |
| $100,000 to $149,999 | 15 (8.9%) | 11 (7.2%) |
| $150,000 or more | 16 (9.5%) | 0 (0.0%) |
| Total | 169 (100.0%) | 153 (100.0%) |
Monthly Housing Cost Tiers in Wyalusing borough
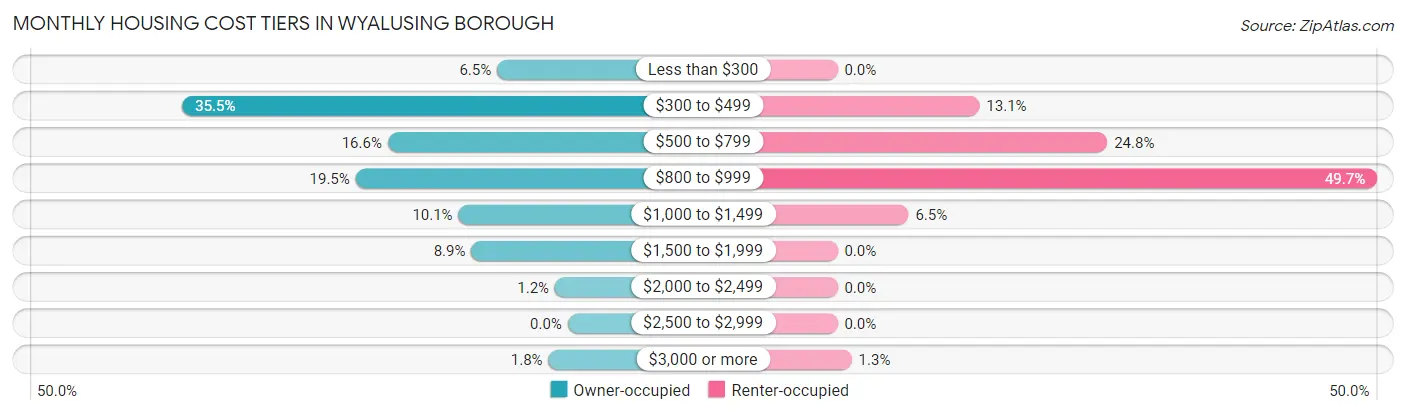
| Monthly Cost | Owner-occupied | Renter-occupied |
| Less than $300 | 11 (6.5%) | 0 (0.0%) |
| $300 to $499 | 60 (35.5%) | 20 (13.1%) |
| $500 to $799 | 28 (16.6%) | 38 (24.8%) |
| $800 to $999 | 33 (19.5%) | 76 (49.7%) |
| $1,000 to $1,499 | 17 (10.1%) | 10 (6.5%) |
| $1,500 to $1,999 | 15 (8.9%) | 0 (0.0%) |
| $2,000 to $2,499 | 2 (1.2%) | 0 (0.0%) |
| $2,500 to $2,999 | 0 (0.0%) | 0 (0.0%) |
| $3,000 or more | 3 (1.8%) | 2 (1.3%) |
| Total | 169 (100.0%) | 153 (100.0%) |
Physical Housing Characteristics in Wyalusing borough
Housing Structures in Wyalusing borough
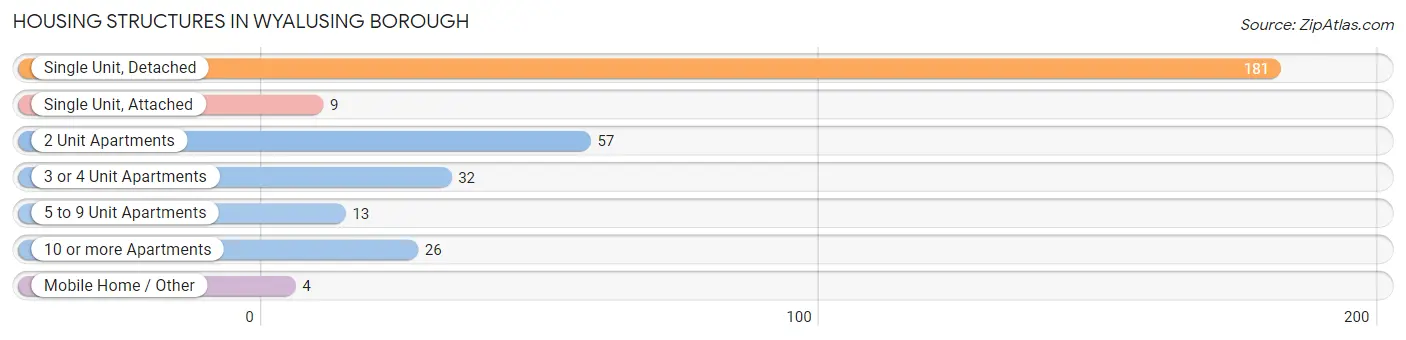
| Structure Type | # Housing Units | % Housing Units |
| Single Unit, Detached | 181 | 56.2% |
| Single Unit, Attached | 9 | 2.8% |
| 2 Unit Apartments | 57 | 17.7% |
| 3 or 4 Unit Apartments | 32 | 9.9% |
| 5 to 9 Unit Apartments | 13 | 4.0% |
| 10 or more Apartments | 26 | 8.1% |
| Mobile Home / Other | 4 | 1.2% |
| Total | 322 | 100.0% |
Housing Structures by Occupancy in Wyalusing borough
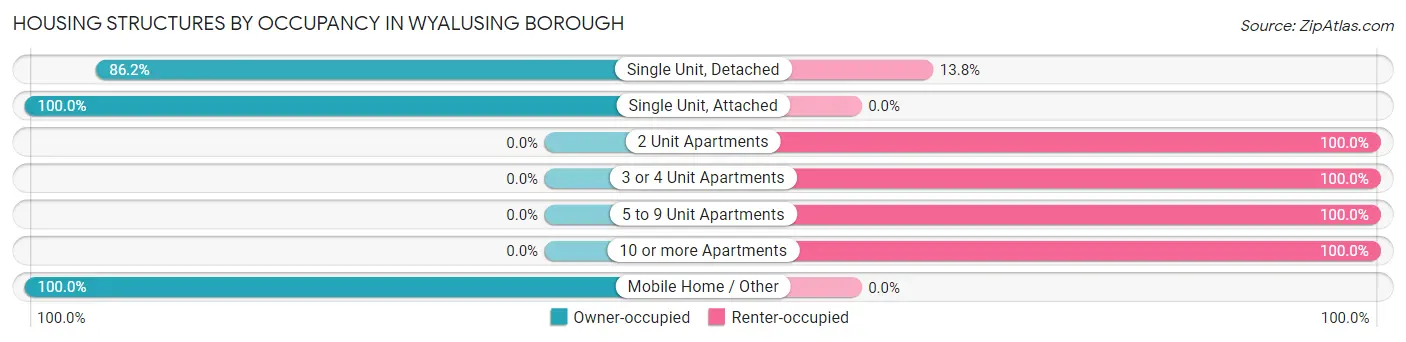
| Structure Type | Owner-occupied | Renter-occupied |
| Single Unit, Detached | 156 (86.2%) | 25 (13.8%) |
| Single Unit, Attached | 9 (100.0%) | 0 (0.0%) |
| 2 Unit Apartments | 0 (0.0%) | 57 (100.0%) |
| 3 or 4 Unit Apartments | 0 (0.0%) | 32 (100.0%) |
| 5 to 9 Unit Apartments | 0 (0.0%) | 13 (100.0%) |
| 10 or more Apartments | 0 (0.0%) | 26 (100.0%) |
| Mobile Home / Other | 4 (100.0%) | 0 (0.0%) |
| Total | 169 (52.5%) | 153 (47.5%) |
Housing Structures by Number of Rooms in Wyalusing borough
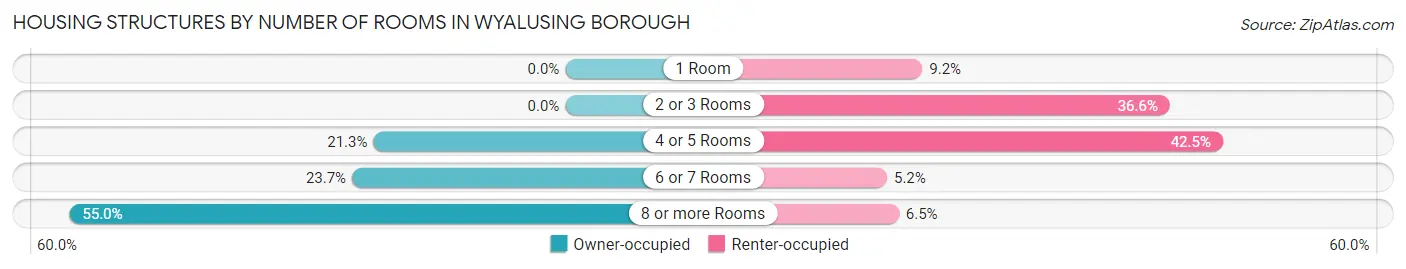
| Number of Rooms | Owner-occupied | Renter-occupied |
| 1 Room | 0 (0.0%) | 14 (9.1%) |
| 2 or 3 Rooms | 0 (0.0%) | 56 (36.6%) |
| 4 or 5 Rooms | 36 (21.3%) | 65 (42.5%) |
| 6 or 7 Rooms | 40 (23.7%) | 8 (5.2%) |
| 8 or more Rooms | 93 (55.0%) | 10 (6.5%) |
| Total | 169 (100.0%) | 153 (100.0%) |
Housing Structure by Heating Type in Wyalusing borough
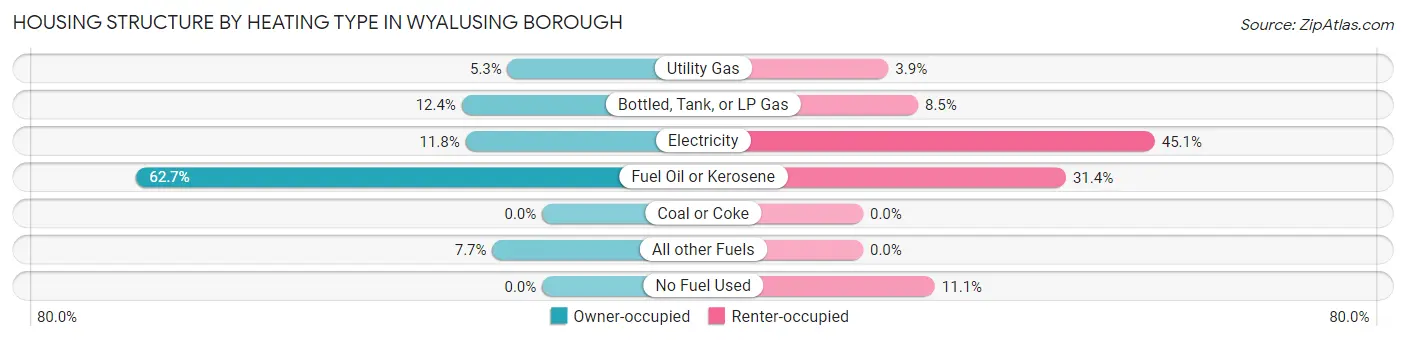
| Heating Type | Owner-occupied | Renter-occupied |
| Utility Gas | 9 (5.3%) | 6 (3.9%) |
| Bottled, Tank, or LP Gas | 21 (12.4%) | 13 (8.5%) |
| Electricity | 20 (11.8%) | 69 (45.1%) |
| Fuel Oil or Kerosene | 106 (62.7%) | 48 (31.4%) |
| Coal or Coke | 0 (0.0%) | 0 (0.0%) |
| All other Fuels | 13 (7.7%) | 0 (0.0%) |
| No Fuel Used | 0 (0.0%) | 17 (11.1%) |
| Total | 169 (100.0%) | 153 (100.0%) |
Household Vehicle Usage in Wyalusing borough
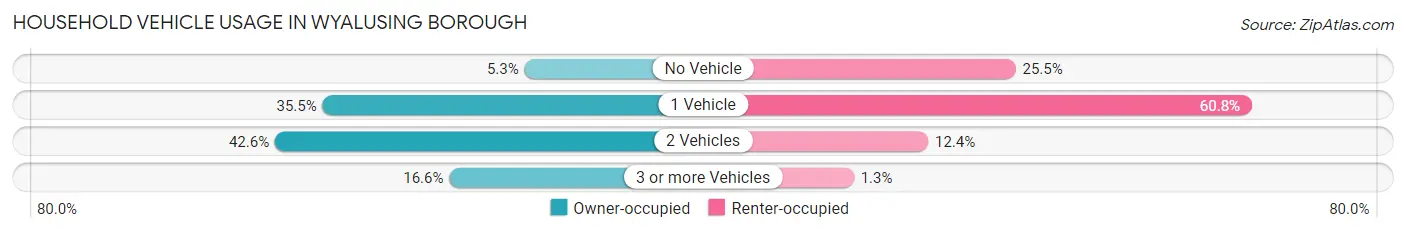
| Vehicles per Household | Owner-occupied | Renter-occupied |
| No Vehicle | 9 (5.3%) | 39 (25.5%) |
| 1 Vehicle | 60 (35.5%) | 93 (60.8%) |
| 2 Vehicles | 72 (42.6%) | 19 (12.4%) |
| 3 or more Vehicles | 28 (16.6%) | 2 (1.3%) |
| Total | 169 (100.0%) | 153 (100.0%) |
Real Estate & Mortgages in Wyalusing borough
Real Estate and Mortgage Overview in Wyalusing borough
| Characteristic | Without Mortgage | With Mortgage |
| Housing Units | 111 | 58 |
| Median Property Value | $114,400 | $145,000 |
| Median Household Income | $35,048 | $10 |
| Monthly Housing Costs | $430 | $3 |
| Real Estate Taxes | $1,438 | $2 |
Property Value by Mortgage Status in Wyalusing borough
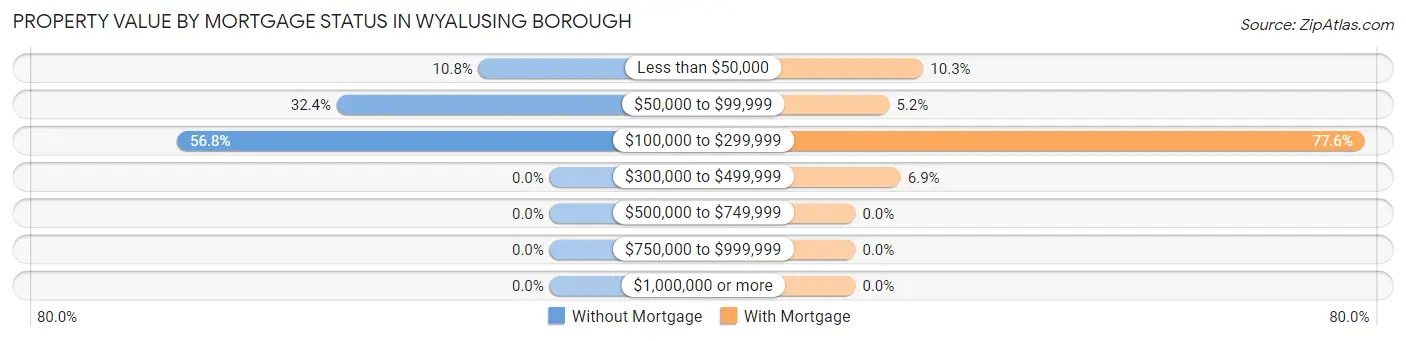
| Property Value | Without Mortgage | With Mortgage |
| Less than $50,000 | 12 (10.8%) | 6 (10.3%) |
| $50,000 to $99,999 | 36 (32.4%) | 3 (5.2%) |
| $100,000 to $299,999 | 63 (56.8%) | 45 (77.6%) |
| $300,000 to $499,999 | 0 (0.0%) | 4 (6.9%) |
| $500,000 to $749,999 | 0 (0.0%) | 0 (0.0%) |
| $750,000 to $999,999 | 0 (0.0%) | 0 (0.0%) |
| $1,000,000 or more | 0 (0.0%) | 0 (0.0%) |
| Total | 111 (100.0%) | 58 (100.0%) |
Household Income by Mortgage Status in Wyalusing borough
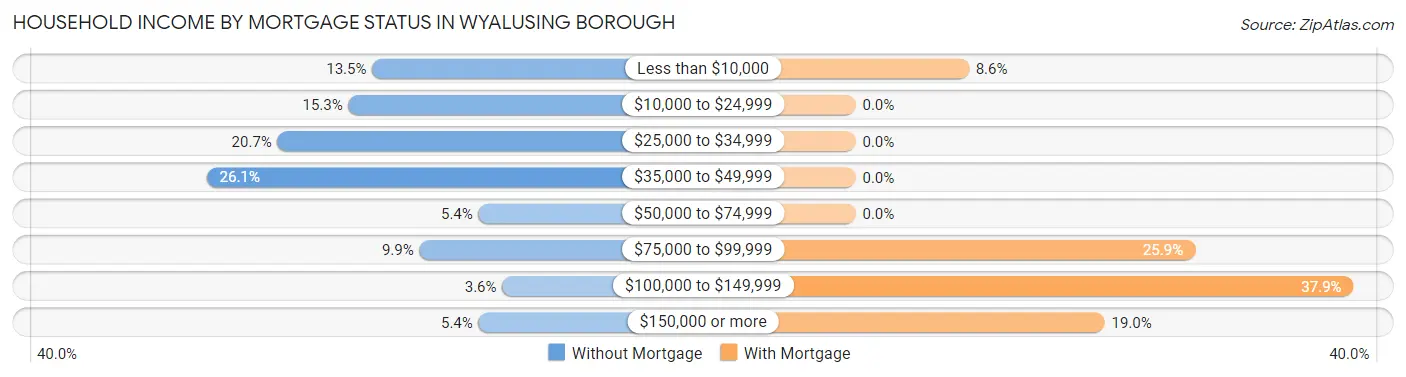
| Household Income | Without Mortgage | With Mortgage |
| Less than $10,000 | 15 (13.5%) | 5 (8.6%) |
| $10,000 to $24,999 | 17 (15.3%) | 0 (0.0%) |
| $25,000 to $34,999 | 23 (20.7%) | 0 (0.0%) |
| $35,000 to $49,999 | 29 (26.1%) | 0 (0.0%) |
| $50,000 to $74,999 | 6 (5.4%) | 0 (0.0%) |
| $75,000 to $99,999 | 11 (9.9%) | 15 (25.9%) |
| $100,000 to $149,999 | 4 (3.6%) | 22 (37.9%) |
| $150,000 or more | 6 (5.4%) | 11 (19.0%) |
| Total | 111 (100.0%) | 58 (100.0%) |
Property Value to Household Income Ratio in Wyalusing borough
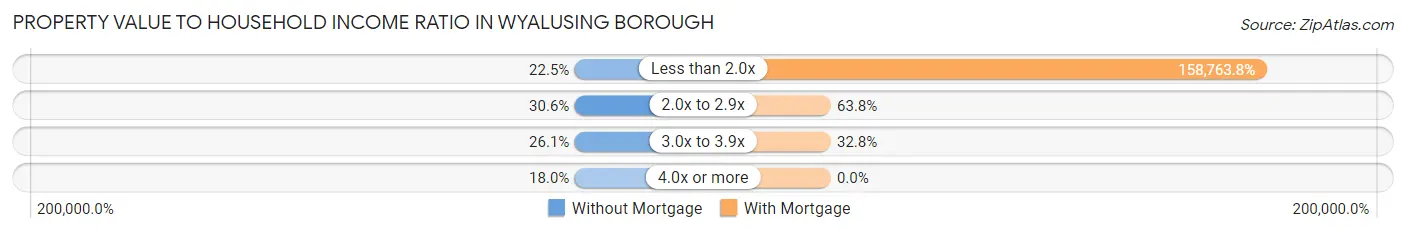
| Value-to-Income Ratio | Without Mortgage | With Mortgage |
| Less than 2.0x | 25 (22.5%) | 92,083 (158,763.8%) |
| 2.0x to 2.9x | 34 (30.6%) | 37 (63.8%) |
| 3.0x to 3.9x | 29 (26.1%) | 19 (32.8%) |
| 4.0x or more | 20 (18.0%) | 0 (0.0%) |
| Total | 111 (100.0%) | 58 (100.0%) |
Real Estate Taxes by Mortgage Status in Wyalusing borough
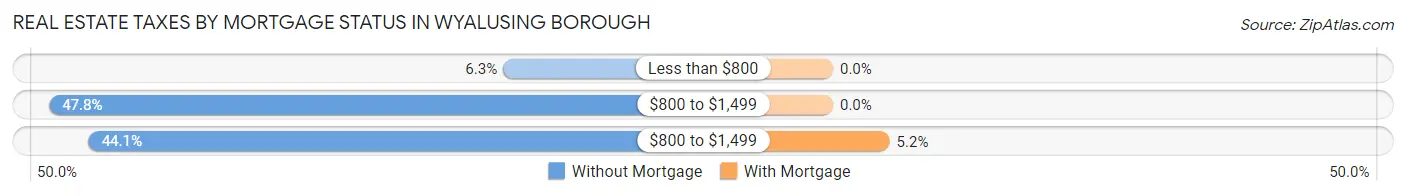
| Property Taxes | Without Mortgage | With Mortgage |
| Less than $800 | 7 (6.3%) | 0 (0.0%) |
| $800 to $1,499 | 53 (47.7%) | 0 (0.0%) |
| $800 to $1,499 | 49 (44.1%) | 3 (5.2%) |
| Total | 111 (100.0%) | 58 (100.0%) |
Health & Disability in Wyalusing borough
Health Insurance Coverage by Age in Wyalusing borough
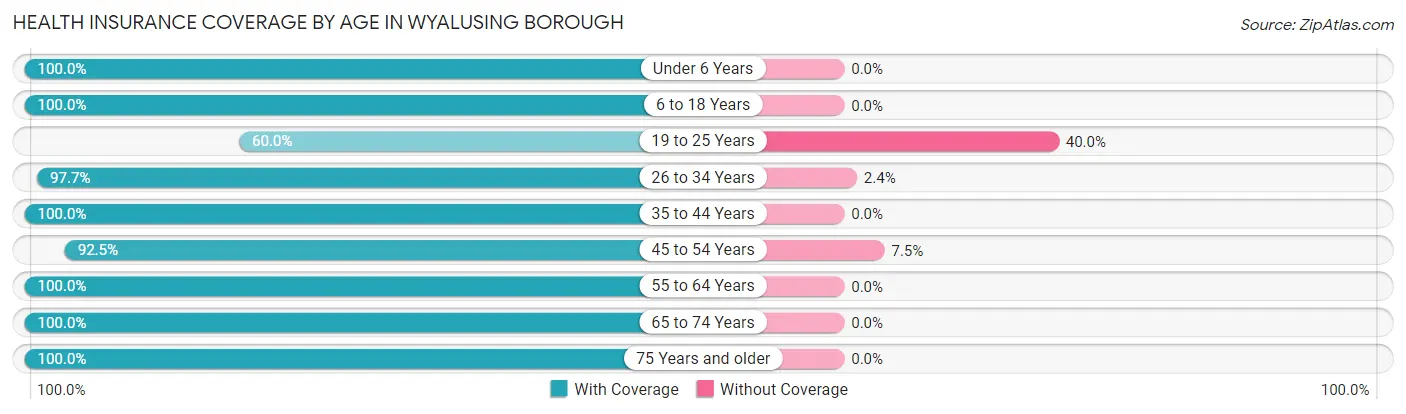
| Age Bracket | With Coverage | Without Coverage |
| Under 6 Years | 36 (100.0%) | 0 (0.0%) |
| 6 to 18 Years | 136 (100.0%) | 0 (0.0%) |
| 19 to 25 Years | 12 (60.0%) | 8 (40.0%) |
| 26 to 34 Years | 83 (97.7%) | 2 (2.4%) |
| 35 to 44 Years | 86 (100.0%) | 0 (0.0%) |
| 45 to 54 Years | 37 (92.5%) | 3 (7.5%) |
| 55 to 64 Years | 89 (100.0%) | 0 (0.0%) |
| 65 to 74 Years | 106 (100.0%) | 0 (0.0%) |
| 75 Years and older | 68 (100.0%) | 0 (0.0%) |
| Total | 653 (98.1%) | 13 (1.9%) |
Health Insurance Coverage by Citizenship Status in Wyalusing borough
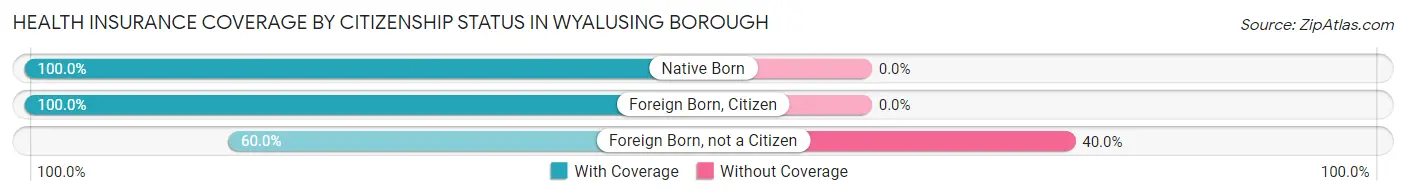
| Citizenship Status | With Coverage | Without Coverage |
| Native Born | 36 (100.0%) | 0 (0.0%) |
| Foreign Born, Citizen | 136 (100.0%) | 0 (0.0%) |
| Foreign Born, not a Citizen | 12 (60.0%) | 8 (40.0%) |
Health Insurance Coverage by Household Income in Wyalusing borough
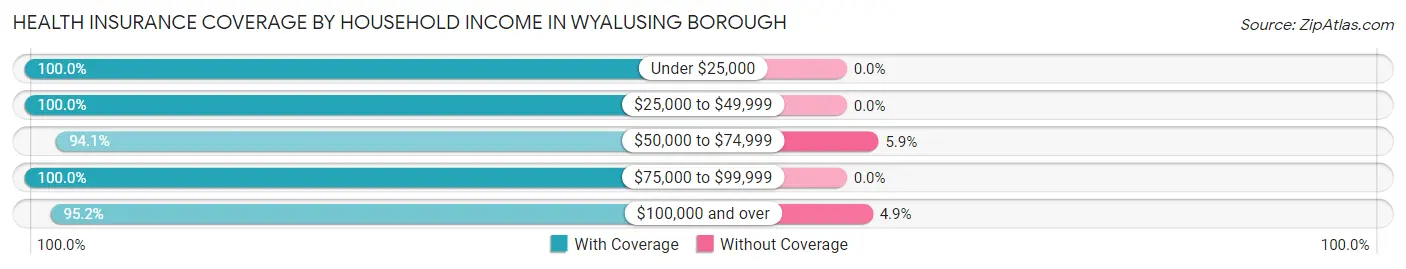
| Household Income | With Coverage | Without Coverage |
| Under $25,000 | 105 (100.0%) | 0 (0.0%) |
| $25,000 to $49,999 | 187 (100.0%) | 0 (0.0%) |
| $50,000 to $74,999 | 127 (94.1%) | 8 (5.9%) |
| $75,000 to $99,999 | 136 (100.0%) | 0 (0.0%) |
| $100,000 and over | 98 (95.2%) | 5 (4.9%) |
Public vs Private Health Insurance Coverage by Age in Wyalusing borough
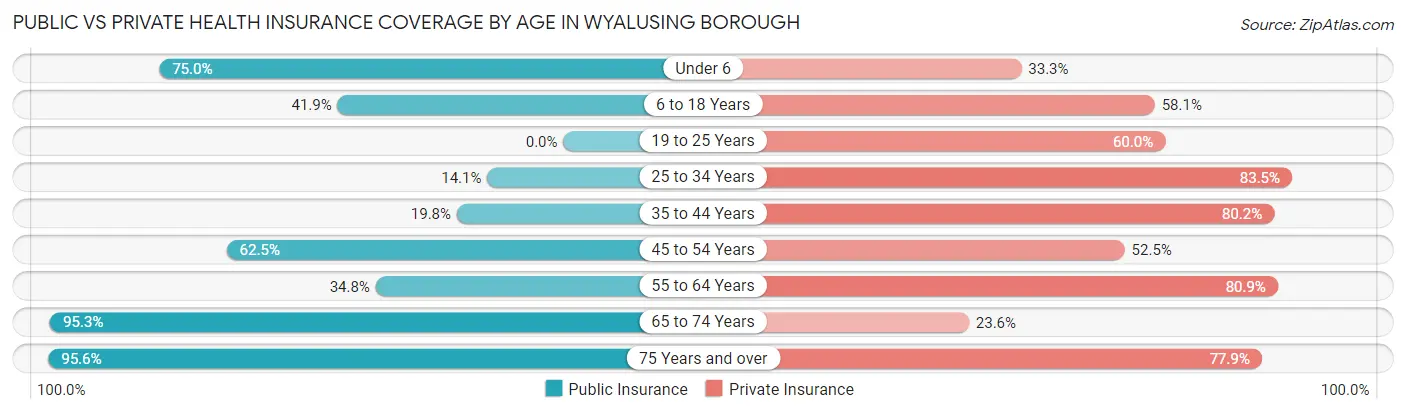
| Age Bracket | Public Insurance | Private Insurance |
| Under 6 | 27 (75.0%) | 12 (33.3%) |
| 6 to 18 Years | 57 (41.9%) | 79 (58.1%) |
| 19 to 25 Years | 0 (0.0%) | 12 (60.0%) |
| 25 to 34 Years | 12 (14.1%) | 71 (83.5%) |
| 35 to 44 Years | 17 (19.8%) | 69 (80.2%) |
| 45 to 54 Years | 25 (62.5%) | 21 (52.5%) |
| 55 to 64 Years | 31 (34.8%) | 72 (80.9%) |
| 65 to 74 Years | 101 (95.3%) | 25 (23.6%) |
| 75 Years and over | 65 (95.6%) | 53 (77.9%) |
| Total | 335 (50.3%) | 414 (62.2%) |
Disability Status by Sex by Age in Wyalusing borough
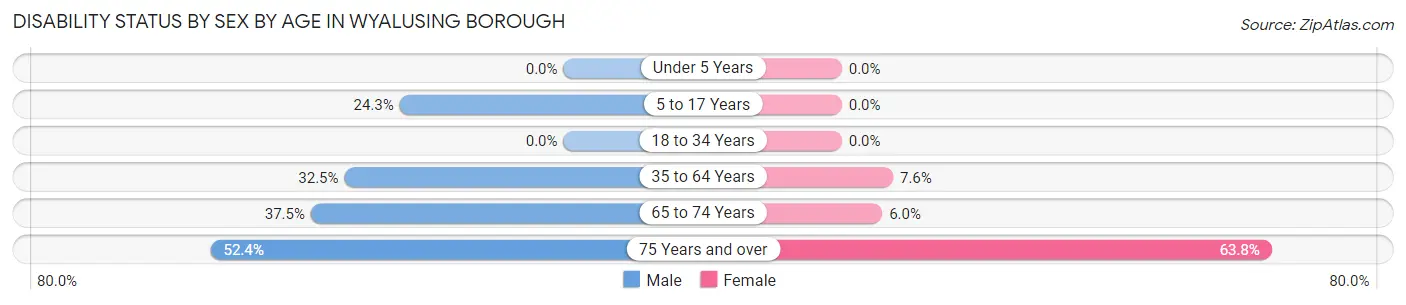
| Age Bracket | Male | Female |
| Under 5 Years | 0 (0.0%) | 0 (0.0%) |
| 5 to 17 Years | 9 (24.3%) | 0 (0.0%) |
| 18 to 34 Years | 0 (0.0%) | 0 (0.0%) |
| 35 to 64 Years | 40 (32.5%) | 7 (7.6%) |
| 65 to 74 Years | 21 (37.5%) | 3 (6.0%) |
| 75 Years and over | 11 (52.4%) | 30 (63.8%) |
Disability Class by Sex by Age in Wyalusing borough
Disability Class: Hearing Difficulty
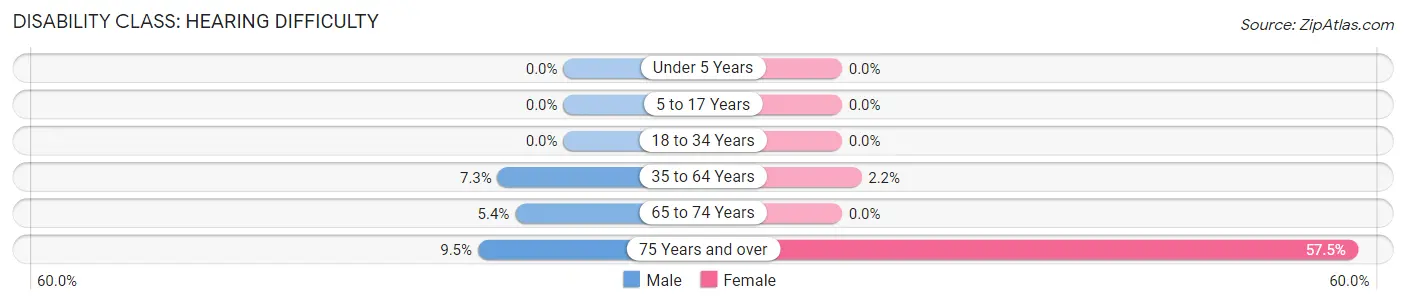
| Age Bracket | Male | Female |
| Under 5 Years | 0 (0.0%) | 0 (0.0%) |
| 5 to 17 Years | 0 (0.0%) | 0 (0.0%) |
| 18 to 34 Years | 0 (0.0%) | 0 (0.0%) |
| 35 to 64 Years | 9 (7.3%) | 2 (2.2%) |
| 65 to 74 Years | 3 (5.4%) | 0 (0.0%) |
| 75 Years and over | 2 (9.5%) | 27 (57.5%) |
Disability Class: Vision Difficulty
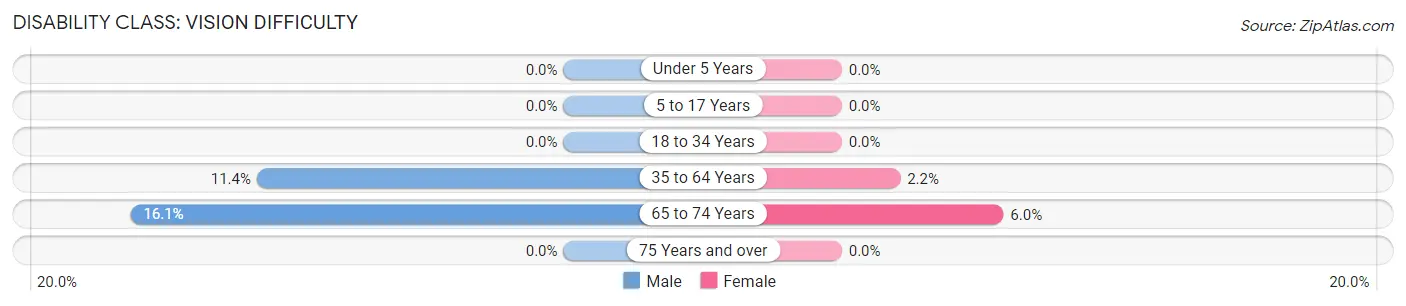
| Age Bracket | Male | Female |
| Under 5 Years | 0 (0.0%) | 0 (0.0%) |
| 5 to 17 Years | 0 (0.0%) | 0 (0.0%) |
| 18 to 34 Years | 0 (0.0%) | 0 (0.0%) |
| 35 to 64 Years | 14 (11.4%) | 2 (2.2%) |
| 65 to 74 Years | 9 (16.1%) | 3 (6.0%) |
| 75 Years and over | 0 (0.0%) | 0 (0.0%) |
Disability Class: Cognitive Difficulty
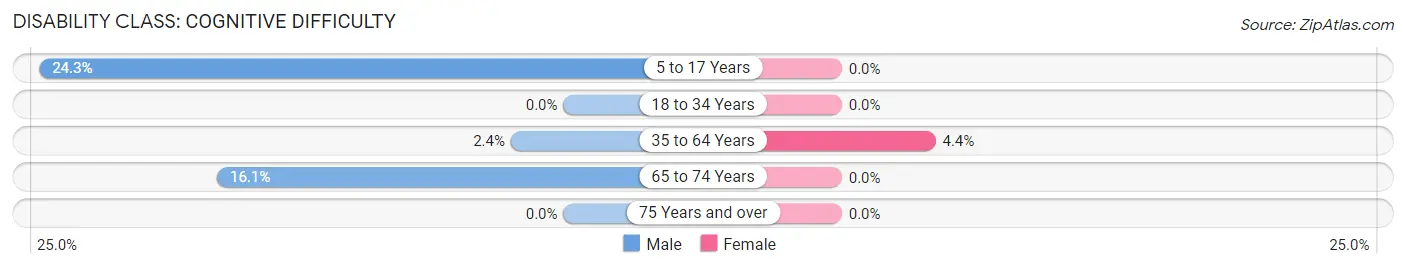
| Age Bracket | Male | Female |
| 5 to 17 Years | 9 (24.3%) | 0 (0.0%) |
| 18 to 34 Years | 0 (0.0%) | 0 (0.0%) |
| 35 to 64 Years | 3 (2.4%) | 4 (4.3%) |
| 65 to 74 Years | 9 (16.1%) | 0 (0.0%) |
| 75 Years and over | 0 (0.0%) | 0 (0.0%) |
Disability Class: Ambulatory Difficulty
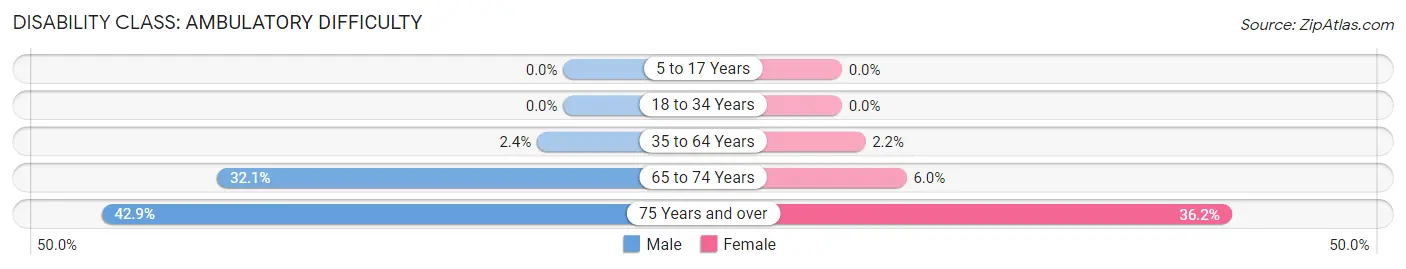
| Age Bracket | Male | Female |
| 5 to 17 Years | 0 (0.0%) | 0 (0.0%) |
| 18 to 34 Years | 0 (0.0%) | 0 (0.0%) |
| 35 to 64 Years | 3 (2.4%) | 2 (2.2%) |
| 65 to 74 Years | 18 (32.1%) | 3 (6.0%) |
| 75 Years and over | 9 (42.9%) | 17 (36.2%) |
Disability Class: Self-Care Difficulty
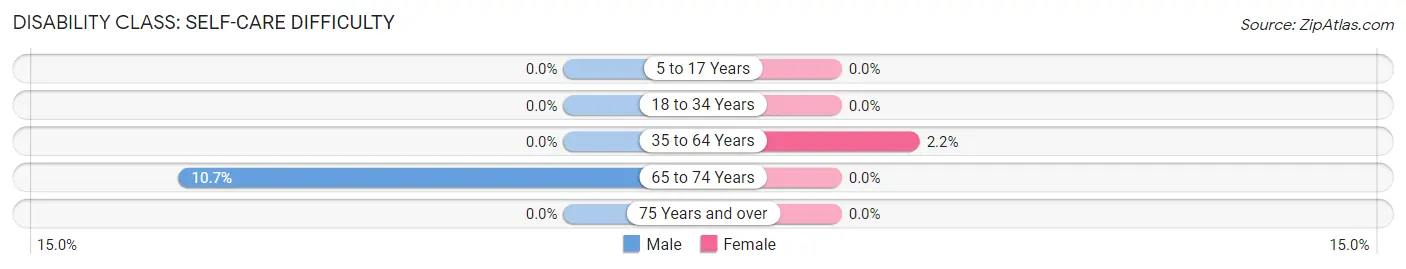
| Age Bracket | Male | Female |
| 5 to 17 Years | 0 (0.0%) | 0 (0.0%) |
| 18 to 34 Years | 0 (0.0%) | 0 (0.0%) |
| 35 to 64 Years | 0 (0.0%) | 2 (2.2%) |
| 65 to 74 Years | 6 (10.7%) | 0 (0.0%) |
| 75 Years and over | 0 (0.0%) | 0 (0.0%) |
Technology Access in Wyalusing borough
Computing Device Access in Wyalusing borough
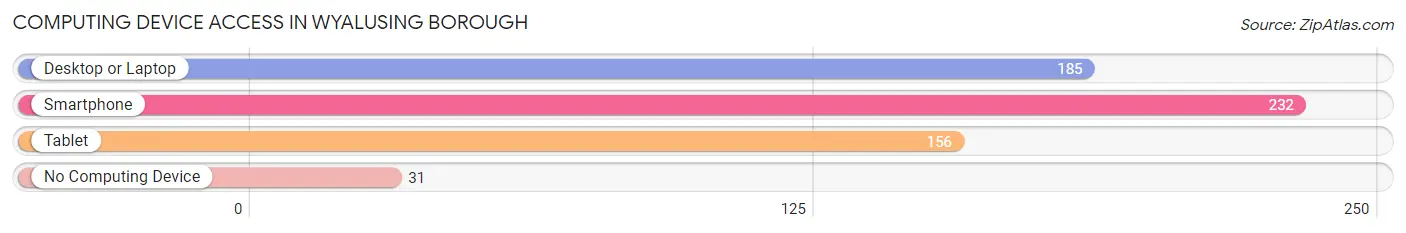
| Device Type | # Households | % Households |
| Desktop or Laptop | 185 | 57.5% |
| Smartphone | 232 | 72.1% |
| Tablet | 156 | 48.4% |
| No Computing Device | 31 | 9.6% |
| Total | 322 | 100.0% |
Internet Access in Wyalusing borough
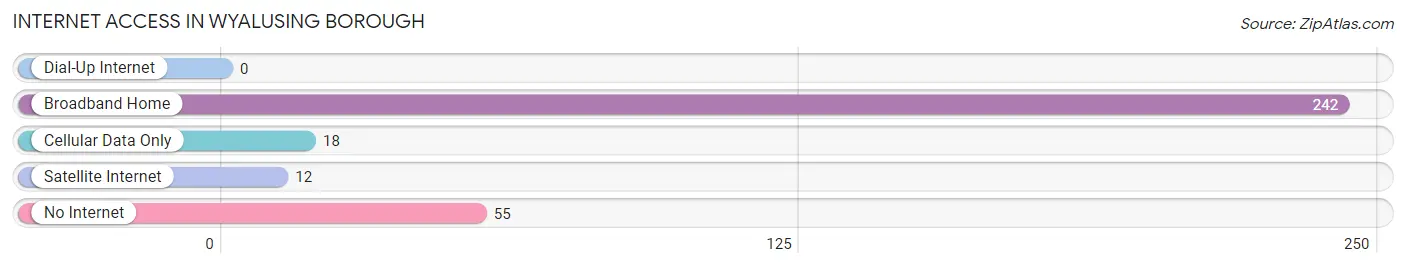
| Internet Type | # Households | % Households |
| Dial-Up Internet | 0 | 0.0% |
| Broadband Home | 242 | 75.2% |
| Cellular Data Only | 18 | 5.6% |
| Satellite Internet | 12 | 3.7% |
| No Internet | 55 | 17.1% |
| Total | 322 | 100.0% |
Wyalusing borough Summary
Wyalusing Borough is a small borough located in Bradford County, Pennsylvania. It is situated in the Endless Mountains region of the state, and is part of the larger Wyalusing Valley. The borough has a population of approximately 1,000 people, and is the county seat of Bradford County.
History
The area that is now Wyalusing Borough was first settled in 1769 by a group of settlers from Connecticut. The settlers named the area Wyalusing, which is derived from the Native American term for “endless mountains”. The area was officially incorporated as a borough in 1845.
In the late 19th century, Wyalusing was a thriving industrial center, with several factories and mills located in the area. The borough was also home to a number of tanneries, which produced leather goods for the local market. The tanneries were eventually replaced by the lumber industry, which was the main industry in the area until the mid-20th century.
Geography
Wyalusing Borough is located in the Endless Mountains region of Pennsylvania. The borough is situated in the Susquehanna River Valley, and is surrounded by rolling hills and forests. The borough is located approximately 30 miles northwest of Scranton, and is accessible via Interstate 81 and U.S. Route 6.
The borough has a total area of 1.2 square miles, all of which is land. The borough is located at an elevation of 1,000 feet above sea level.
Economy
The economy of Wyalusing Borough is largely based on tourism and agriculture. The borough is home to several tourist attractions, including the Wyalusing Rocks, a natural rock formation located on the Susquehanna River. The area is also home to several wineries, which produce a variety of wines for the local market.
Agriculture is also an important part of the local economy. The area is home to several dairy farms, as well as a number of fruit and vegetable farms. The borough is also home to several lumber mills, which produce lumber for the local market.
Demographics
As of the 2010 census, Wyalusing Borough had a population of 1,000 people. The racial makeup of the borough was 97.2% White, 0.7% African American, 0.2% Native American, 0.2% Asian, 0.2% from other races, and 1.7% from two or more races. Hispanic or Latino of any race were 1.2% of the population.
The median household income in Wyalusing Borough was $37,500, and the median family income was $45,000. The per capita income for the borough was $19,000. About 11.2% of families and 14.2% of the population were below the poverty line, including 18.2% of those under age 18 and 8.2% of those age 65 or over.
Common Questions
What is Per Capita Income in Wyalusing borough?
Per Capita income in Wyalusing borough is $28,707.
What is the Median Family Income in Wyalusing borough?
Median Family Income in Wyalusing borough is $39,688.
What is the Median Household income in Wyalusing borough?
Median Household Income in Wyalusing borough is $39,063.
What is Income or Wage Gap in Wyalusing borough?
Income or Wage Gap in Wyalusing borough is 52.8%.
Women in Wyalusing borough earn 47.2 cents for every dollar earned by a man.
What is Inequality or Gini Index in Wyalusing borough?
Inequality or Gini Index in Wyalusing borough is 0.45.
What is the Total Population of Wyalusing borough?
Total Population of Wyalusing borough is 666.
What is the Total Male Population of Wyalusing borough?
Total Male Population of Wyalusing borough is 310.
What is the Total Female Population of Wyalusing borough?
Total Female Population of Wyalusing borough is 356.
What is the Ratio of Males per 100 Females in Wyalusing borough?
There are 87.08 Males per 100 Females in Wyalusing borough.
What is the Ratio of Females per 100 Males in Wyalusing borough?
There are 114.84 Females per 100 Males in Wyalusing borough.
What is the Median Population Age in Wyalusing borough?
Median Population Age in Wyalusing borough is 40.1 Years.
What is the Average Family Size in Wyalusing borough
Average Family Size in Wyalusing borough is 2.7 People.
What is the Average Household Size in Wyalusing borough
Average Household Size in Wyalusing borough is 2.1 People.
How Large is the Labor Force in Wyalusing borough?
There are 262 People in the Labor Forcein in Wyalusing borough.
What is the Percentage of People in the Labor Force in Wyalusing borough?
51.0% of People are in the Labor Force in Wyalusing borough.
What is the Unemployment Rate in Wyalusing borough?
Unemployment Rate in Wyalusing borough is 0.8%.