Woodbury borough, PA Map & Demographics
Woodbury borough Overview
$17,803
PER CAPITA INCOME
$62,500
AVG FAMILY INCOME
$39,375
AVG HOUSEHOLD INCOME
32.8%
WAGE / INCOME GAP [ % ]
67.2¢/ $1
WAGE / INCOME GAP [ $ ]
0.38
INEQUALITY / GINI INDEX
391
TOTAL POPULATION
216
MALE POPULATION
175
FEMALE POPULATION
123.43
MALES / 100 FEMALES
81.02
FEMALES / 100 MALES
29.8
MEDIAN AGE
3.8
AVG FAMILY SIZE
3.2
AVG HOUSEHOLD SIZE
170
LABOR FORCE [ PEOPLE ]
66.9%
PERCENT IN LABOR FORCE
10.6%
UNEMPLOYMENT RATE
Income in Woodbury borough
Income Overview in Woodbury borough
Per Capita Income in Woodbury borough is $17,803, while median incomes of families and households are $62,500 and $39,375 respectively.
| Characteristic | Number | Measure |
| Per Capita Income | 391 | $17,803 |
| Median Family Income | 92 | $62,500 |
| Mean Family Income | 92 | $61,748 |
| Median Household Income | 122 | $39,375 |
| Mean Household Income | 122 | $54,525 |
| Income Deficit | 92 | $0 |
| Wage / Income Gap (%) | 391 | 32.80% |
| Wage / Income Gap ($) | 391 | 67.20¢ per $1 |
| Gini / Inequality Index | 391 | 0.38 |
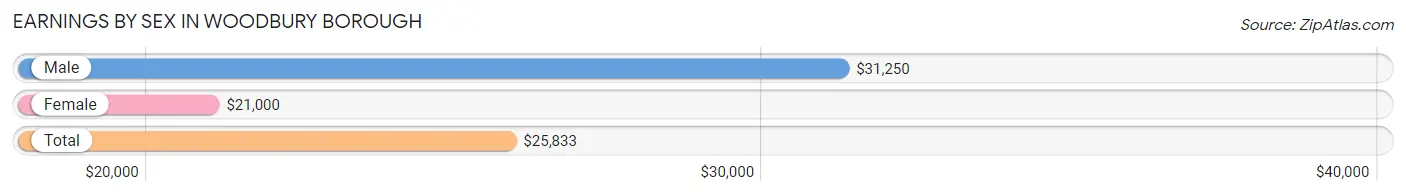
Earnings by Sex in Woodbury borough
Average Earnings in Woodbury borough are $25,833, $31,250 for men and $21,000 for women, a difference of 32.8%.
| Sex | Number | Average Earnings |
| Male | 98 (59.0%) | $31,250 |
| Female | 68 (41.0%) | $21,000 |
| Total | 166 (100.0%) | $25,833 |
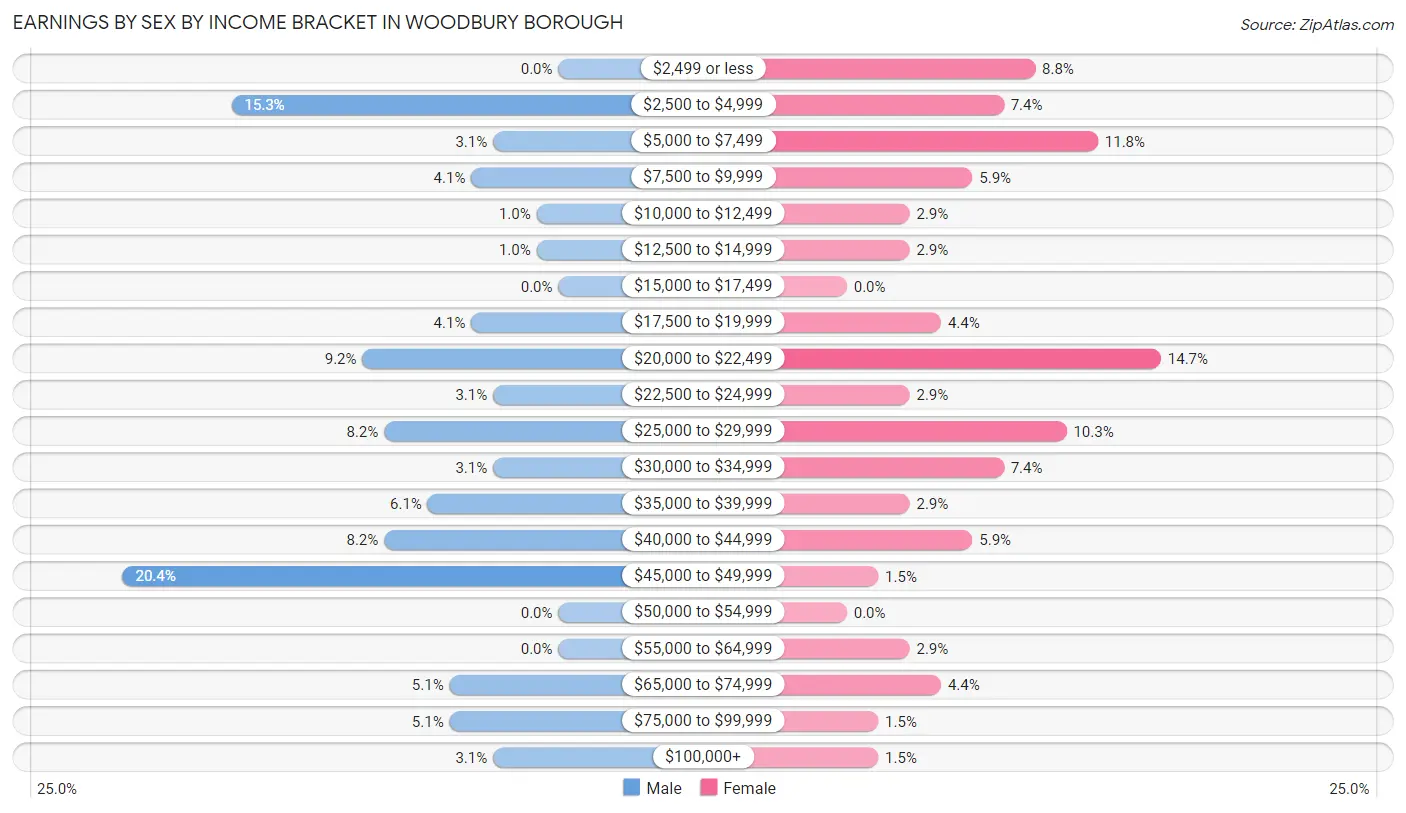
Earnings by Sex by Income Bracket in Woodbury borough
The most common earnings brackets in Woodbury borough are $45,000 to $49,999 for men (20 | 20.4%) and $20,000 to $22,499 for women (10 | 14.7%).
| Income | Male | Female |
| $2,499 or less | 0 (0.0%) | 6 (8.8%) |
| $2,500 to $4,999 | 15 (15.3%) | 5 (7.3%) |
| $5,000 to $7,499 | 3 (3.1%) | 8 (11.8%) |
| $7,500 to $9,999 | 4 (4.1%) | 4 (5.9%) |
| $10,000 to $12,499 | 1 (1.0%) | 2 (2.9%) |
| $12,500 to $14,999 | 1 (1.0%) | 2 (2.9%) |
| $15,000 to $17,499 | 0 (0.0%) | 0 (0.0%) |
| $17,500 to $19,999 | 4 (4.1%) | 3 (4.4%) |
| $20,000 to $22,499 | 9 (9.2%) | 10 (14.7%) |
| $22,500 to $24,999 | 3 (3.1%) | 2 (2.9%) |
| $25,000 to $29,999 | 8 (8.2%) | 7 (10.3%) |
| $30,000 to $34,999 | 3 (3.1%) | 5 (7.3%) |
| $35,000 to $39,999 | 6 (6.1%) | 2 (2.9%) |
| $40,000 to $44,999 | 8 (8.2%) | 4 (5.9%) |
| $45,000 to $49,999 | 20 (20.4%) | 1 (1.5%) |
| $50,000 to $54,999 | 0 (0.0%) | 0 (0.0%) |
| $55,000 to $64,999 | 0 (0.0%) | 2 (2.9%) |
| $65,000 to $74,999 | 5 (5.1%) | 3 (4.4%) |
| $75,000 to $99,999 | 5 (5.1%) | 1 (1.5%) |
| $100,000+ | 3 (3.1%) | 1 (1.5%) |
| Total | 98 (100.0%) | 68 (100.0%) |
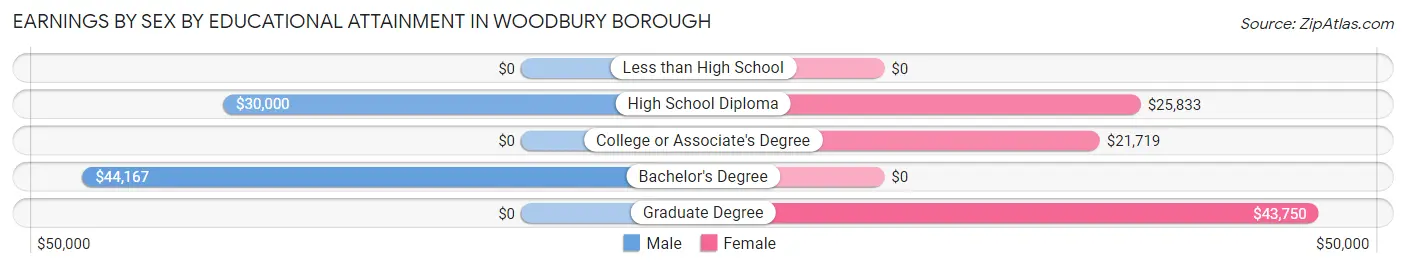
Earnings by Sex by Educational Attainment in Woodbury borough
Average earnings in Woodbury borough are $31,875 for men and $22,500 for women, a difference of 29.4%. Men with an educational attainment of bachelor's degree enjoy the highest average annual earnings of $44,167, while those with high school diploma education earn the least with $30,000. Women with an educational attainment of graduate degree earn the most with the average annual earnings of $43,750, while those with college or associate's degree education have the smallest earnings of $21,719.
| Educational Attainment | Male Income | Female Income |
| Less than High School | - | - |
| High School Diploma | $30,000 | $25,833 |
| College or Associate's Degree | - | - |
| Bachelor's Degree | $44,167 | $0 |
| Graduate Degree | - | - |
| Total | $31,875 | $22,500 |
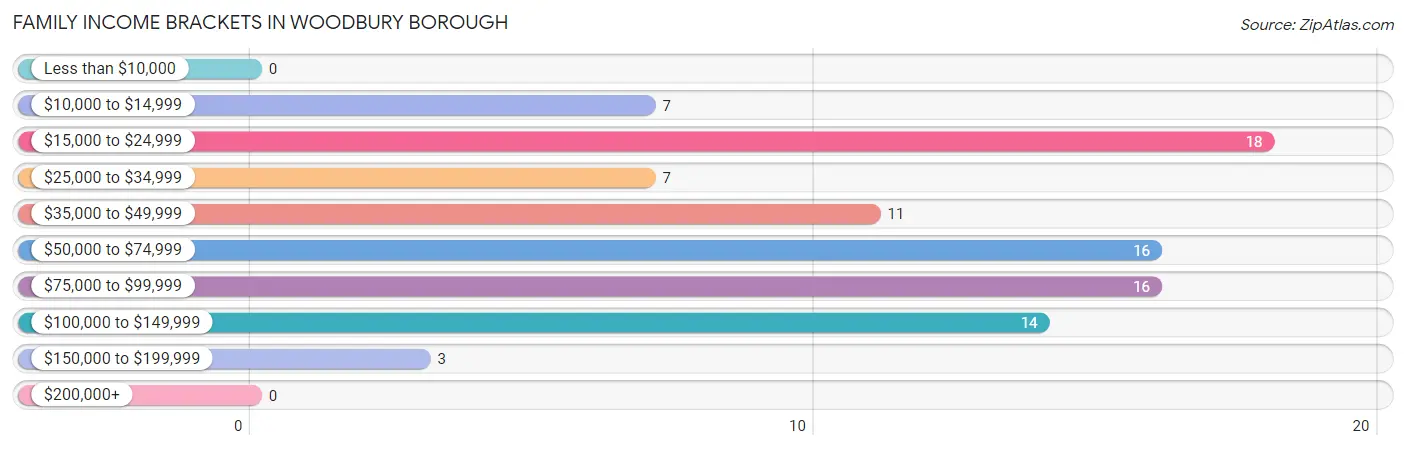
Family Income in Woodbury borough
Family Income Brackets in Woodbury borough
According to the Woodbury borough family income data, there are 18 families falling into the $15,000 to $24,999 income range, which is the most common income bracket and makes up 19.6% of all families.
| Income Bracket | # Families | % Families |
| Less than $10,000 | 0 | 0.0% |
| $10,000 to $14,999 | 7 | 7.6% |
| $15,000 to $24,999 | 18 | 19.6% |
| $25,000 to $34,999 | 7 | 7.6% |
| $35,000 to $49,999 | 11 | 12.0% |
| $50,000 to $74,999 | 16 | 17.4% |
| $75,000 to $99,999 | 16 | 17.4% |
| $100,000 to $149,999 | 14 | 15.2% |
| $150,000 to $199,999 | 3 | 3.3% |
| $200,000+ | 0 | 0.0% |
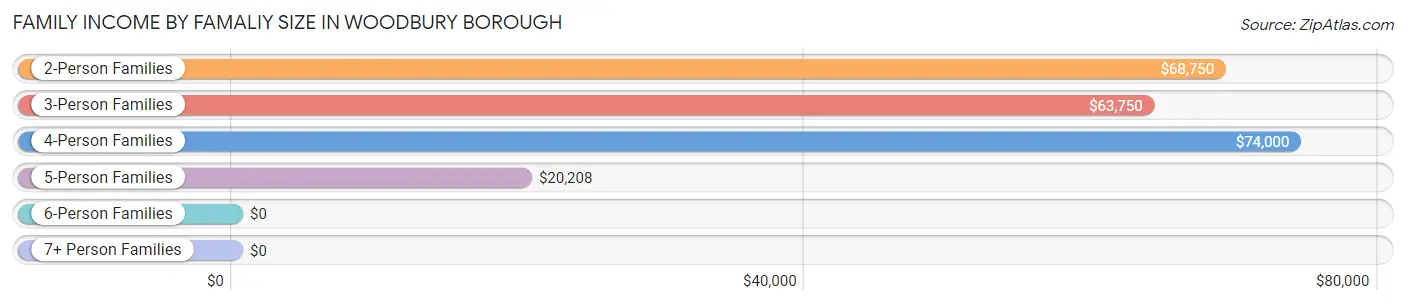
Family Income by Famaliy Size in Woodbury borough
4-person families (18 | 19.6%) account for the highest median family income in Woodbury borough with $74,000 per family, while 2-person families (29 | 31.5%) have the highest median income of $34,375 per family member.
| Income Bracket | # Families | Median Income |
| 2-Person Families | 29 (31.5%) | $68,750 |
| 3-Person Families | 24 (26.1%) | $63,750 |
| 4-Person Families | 18 (19.6%) | $74,000 |
| 5-Person Families | 15 (16.3%) | $20,208 |
| 6-Person Families | 4 (4.3%) | $0 |
| 7+ Person Families | 2 (2.2%) | $0 |
| Total | 92 (100.0%) | $62,500 |
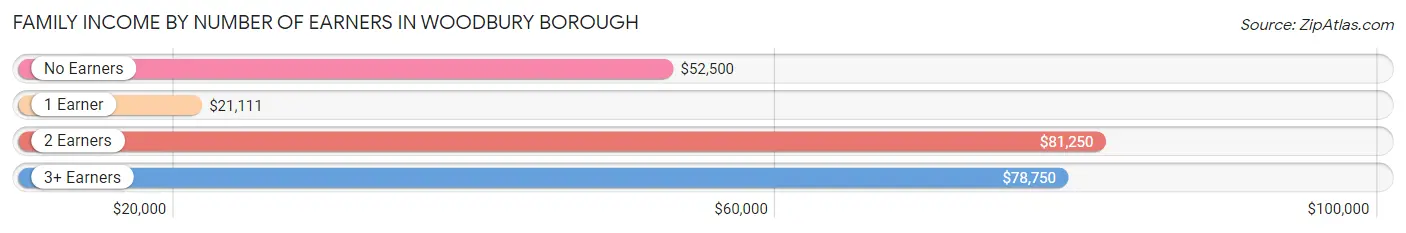
Family Income by Number of Earners in Woodbury borough
The median family income in Woodbury borough is $62,500, with families comprising 2 earners (28) having the highest median family income of $81,250, while families with 1 earner (36) have the lowest median family income of $21,111, accounting for 30.4% and 39.1% of families, respectively.
| Number of Earners | # Families | Median Income |
| No Earners | 12 (13.0%) | $52,500 |
| 1 Earner | 36 (39.1%) | $21,111 |
| 2 Earners | 28 (30.4%) | $81,250 |
| 3+ Earners | 16 (17.4%) | $78,750 |
| Total | 92 (100.0%) | $62,500 |
Household Income in Woodbury borough
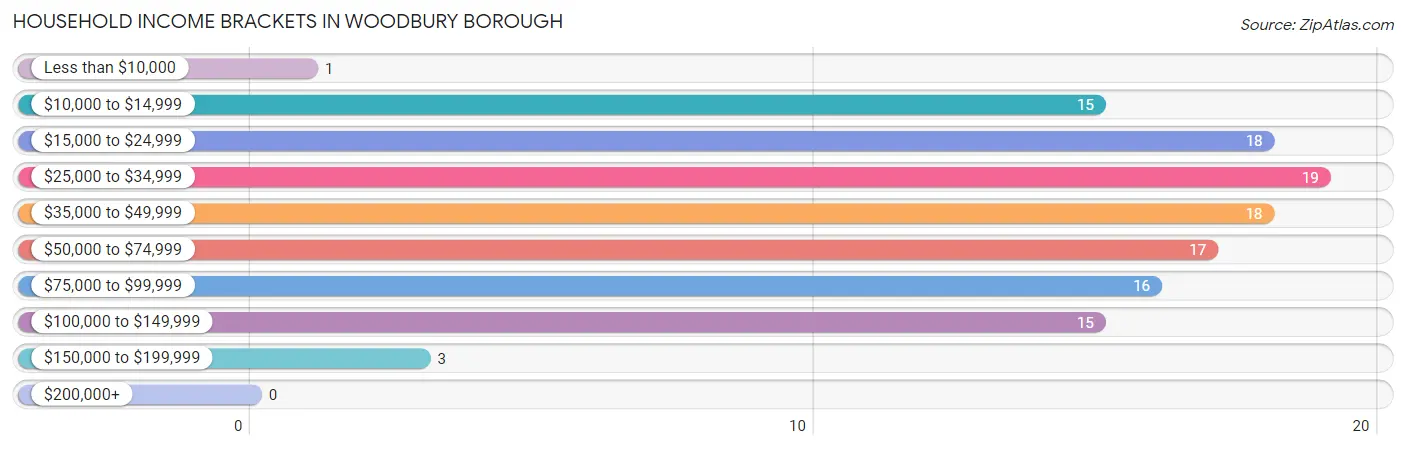
Household Income Brackets in Woodbury borough
With 19 households falling in the category, the $25,000 to $34,999 income range is the most frequent in Woodbury borough, accounting for 15.6% of all households.
| Income Bracket | # Households | % Households |
| Less than $10,000 | 1 | 0.8% |
| $10,000 to $14,999 | 15 | 12.3% |
| $15,000 to $24,999 | 18 | 14.8% |
| $25,000 to $34,999 | 19 | 15.6% |
| $35,000 to $49,999 | 18 | 14.8% |
| $50,000 to $74,999 | 17 | 13.9% |
| $75,000 to $99,999 | 16 | 13.1% |
| $100,000 to $149,999 | 15 | 12.3% |
| $150,000 to $199,999 | 3 | 2.5% |
| $200,000+ | 0 | 0.0% |
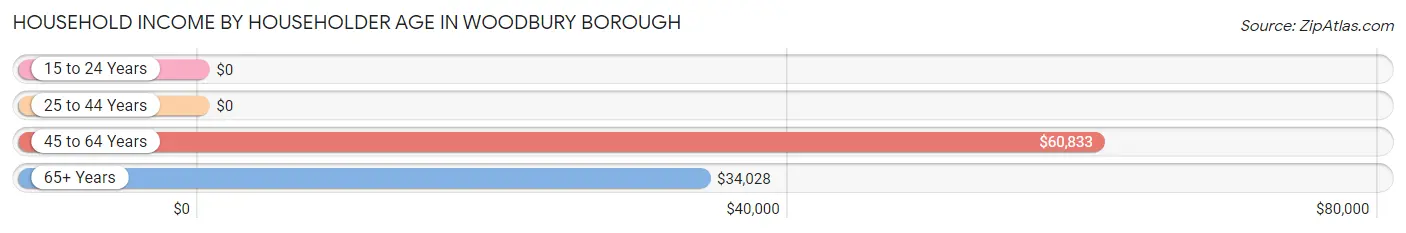
Household Income by Householder Age in Woodbury borough
The median household income in Woodbury borough is $39,375, with the highest median household income of $60,833 found in the 45 to 64 years age bracket for the primary householder. A total of 42 households (34.4%) fall into this category. Meanwhile, the 15 to 24 years age bracket for the primary householder has the lowest median household income of $0, with 4 households (3.3%) in this group.
| Income Bracket | # Households | Median Income |
| 15 to 24 Years | 4 (3.3%) | $0 |
| 25 to 44 Years | 41 (33.6%) | $0 |
| 45 to 64 Years | 42 (34.4%) | $60,833 |
| 65+ Years | 35 (28.7%) | $34,028 |
| Total | 122 (100.0%) | $39,375 |
Poverty in Woodbury borough
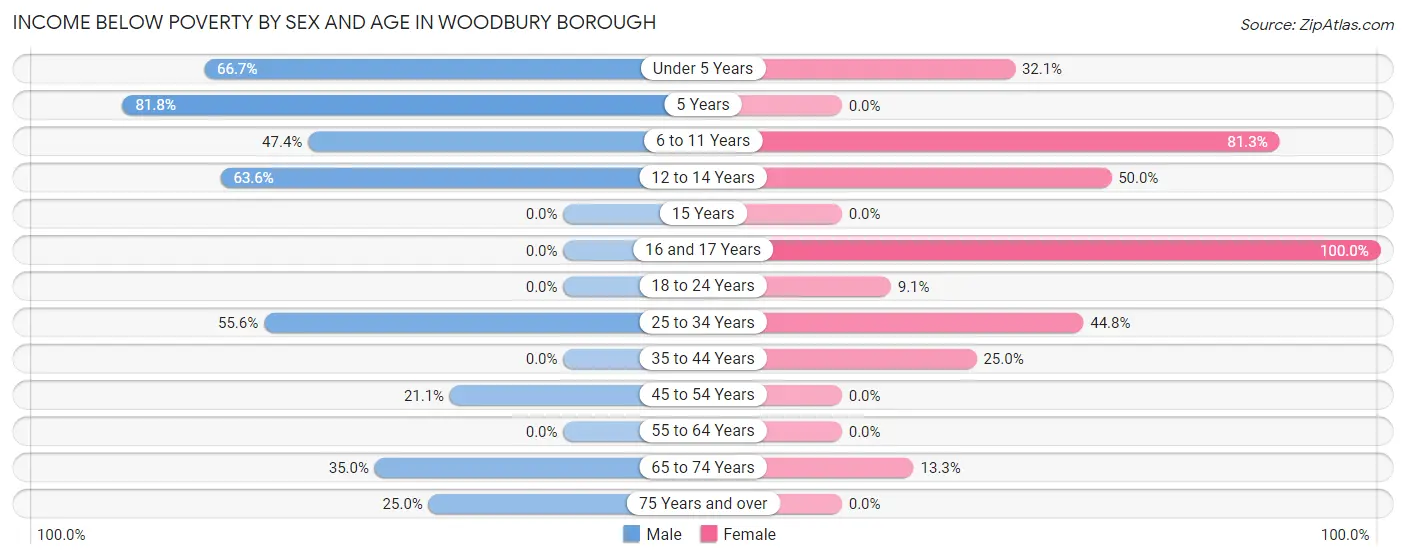
Income Below Poverty by Sex and Age in Woodbury borough
With 41.7% poverty level for males and 32.0% for females among the residents of Woodbury borough, 5 year old males and 16 and 17 year old females are the most vulnerable to poverty, with 18 males (81.8%) and 1 females (100.0%) in their respective age groups living below the poverty level.
| Age Bracket | Male | Female |
| Under 5 Years | 6 (66.7%) | 9 (32.1%) |
| 5 Years | 18 (81.8%) | 0 (0.0%) |
| 6 to 11 Years | 9 (47.4%) | 26 (81.2%) |
| 12 to 14 Years | 14 (63.6%) | 1 (50.0%) |
| 15 Years | 0 (0.0%) | 0 (0.0%) |
| 16 and 17 Years | 0 (0.0%) | 1 (100.0%) |
| 18 to 24 Years | 0 (0.0%) | 1 (9.1%) |
| 25 to 34 Years | 30 (55.6%) | 13 (44.8%) |
| 35 to 44 Years | 0 (0.0%) | 3 (25.0%) |
| 45 to 54 Years | 4 (21.0%) | 0 (0.0%) |
| 55 to 64 Years | 0 (0.0%) | 0 (0.0%) |
| 65 to 74 Years | 7 (35.0%) | 2 (13.3%) |
| 75 Years and over | 2 (25.0%) | 0 (0.0%) |
| Total | 90 (41.7%) | 56 (32.0%) |
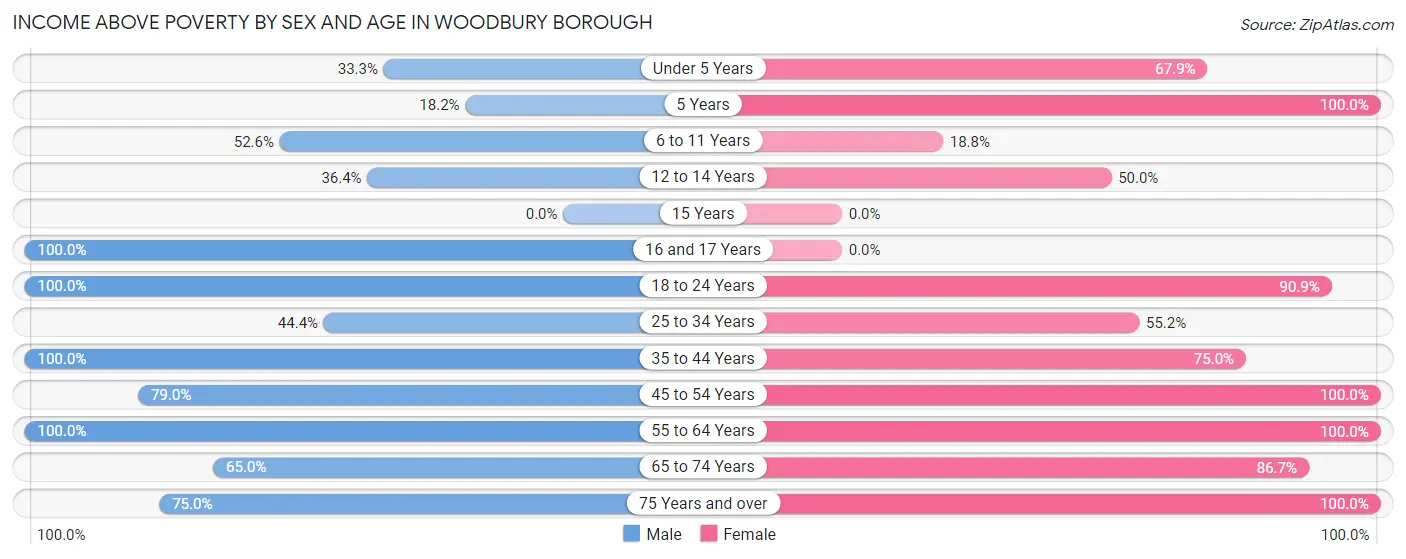
Income Above Poverty by Sex and Age in Woodbury borough
According to the poverty statistics in Woodbury borough, males aged 16 and 17 years and females aged 5 years are the age groups that are most secure financially, with 100.0% of males and 100.0% of females in these age groups living above the poverty line.
| Age Bracket | Male | Female |
| Under 5 Years | 3 (33.3%) | 19 (67.9%) |
| 5 Years | 4 (18.2%) | 3 (100.0%) |
| 6 to 11 Years | 10 (52.6%) | 6 (18.8%) |
| 12 to 14 Years | 8 (36.4%) | 1 (50.0%) |
| 15 Years | 0 (0.0%) | 0 (0.0%) |
| 16 and 17 Years | 4 (100.0%) | 0 (0.0%) |
| 18 to 24 Years | 9 (100.0%) | 10 (90.9%) |
| 25 to 34 Years | 24 (44.4%) | 16 (55.2%) |
| 35 to 44 Years | 11 (100.0%) | 9 (75.0%) |
| 45 to 54 Years | 15 (78.9%) | 12 (100.0%) |
| 55 to 64 Years | 19 (100.0%) | 19 (100.0%) |
| 65 to 74 Years | 13 (65.0%) | 13 (86.7%) |
| 75 Years and over | 6 (75.0%) | 11 (100.0%) |
| Total | 126 (58.3%) | 119 (68.0%) |
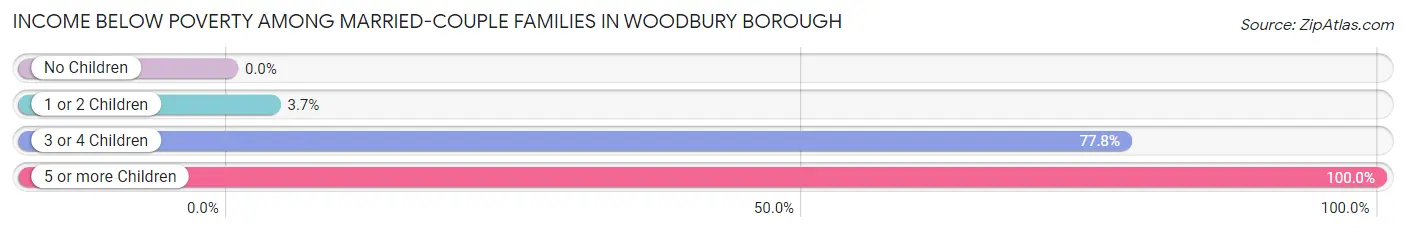
Income Below Poverty Among Married-Couple Families in Woodbury borough
The poverty statistics for married-couple families in Woodbury borough show that 14.5% or 10 of the total 69 families live below the poverty line. Families with 5 or more children have the highest poverty rate of 100.0%, comprising of 2 families. On the other hand, families with no children have the lowest poverty rate of 0.0%, which includes 0 families.
| Children | Above Poverty | Below Poverty |
| No Children | 31 (100.0%) | 0 (0.0%) |
| 1 or 2 Children | 26 (96.3%) | 1 (3.7%) |
| 3 or 4 Children | 2 (22.2%) | 7 (77.8%) |
| 5 or more Children | 0 (0.0%) | 2 (100.0%) |
| Total | 59 (85.5%) | 10 (14.5%) |
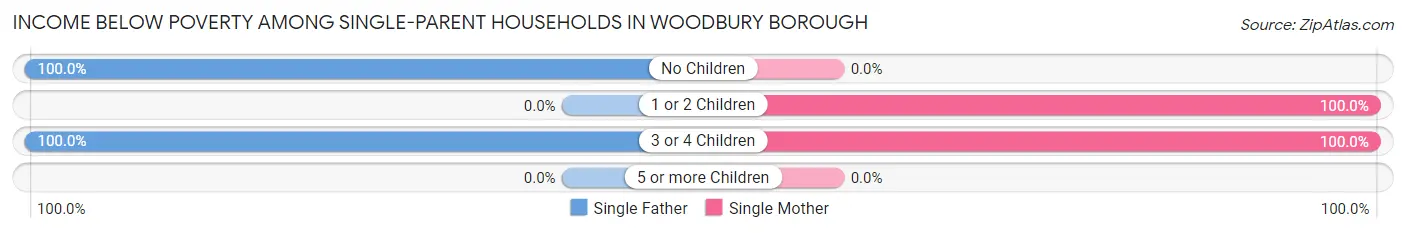
Income Below Poverty Among Single-Parent Households in Woodbury borough
According to the poverty data in Woodbury borough, 75.0% or 12 single-father households and 57.1% or 4 single-mother households are living below the poverty line. Among single-father households, those with no children have the highest poverty rate, with 6 households (100.0%) experiencing poverty. Likewise, among single-mother households, those with 1 or 2 children have the highest poverty rate, with 2 households (100.0%) falling below the poverty line.
| Children | Single Father | Single Mother |
| No Children | 6 (100.0%) | 0 (0.0%) |
| 1 or 2 Children | 0 (0.0%) | 2 (100.0%) |
| 3 or 4 Children | 6 (100.0%) | 2 (100.0%) |
| 5 or more Children | 0 (0.0%) | 0 (0.0%) |
| Total | 12 (75.0%) | 4 (57.1%) |
Income Below Poverty Among Married-Couple vs Single-Parent Households in Woodbury borough
The poverty data for Woodbury borough shows that 10 of the married-couple family households (14.5%) and 16 of the single-parent households (69.6%) are living below the poverty level. Within the married-couple family households, those with 5 or more children have the highest poverty rate, with 2 households (100.0%) falling below the poverty line. Among the single-parent households, those with 3 or 4 children have the highest poverty rate, with 8 household (100.0%) living below poverty.
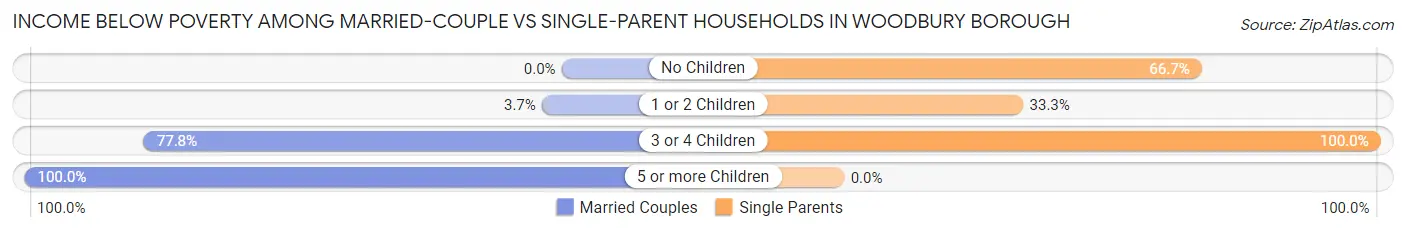
| Children | Married-Couple Families | Single-Parent Households |
| No Children | 0 (0.0%) | 6 (66.7%) |
| 1 or 2 Children | 1 (3.7%) | 2 (33.3%) |
| 3 or 4 Children | 7 (77.8%) | 8 (100.0%) |
| 5 or more Children | 2 (100.0%) | 0 (0.0%) |
| Total | 10 (14.5%) | 16 (69.6%) |
Race in Woodbury borough
The most populous races in Woodbury borough are White / Caucasian (344 | 88.0%), Two or more Races (46 | 11.8%), and Hispanic or Latino (37 | 9.5%).
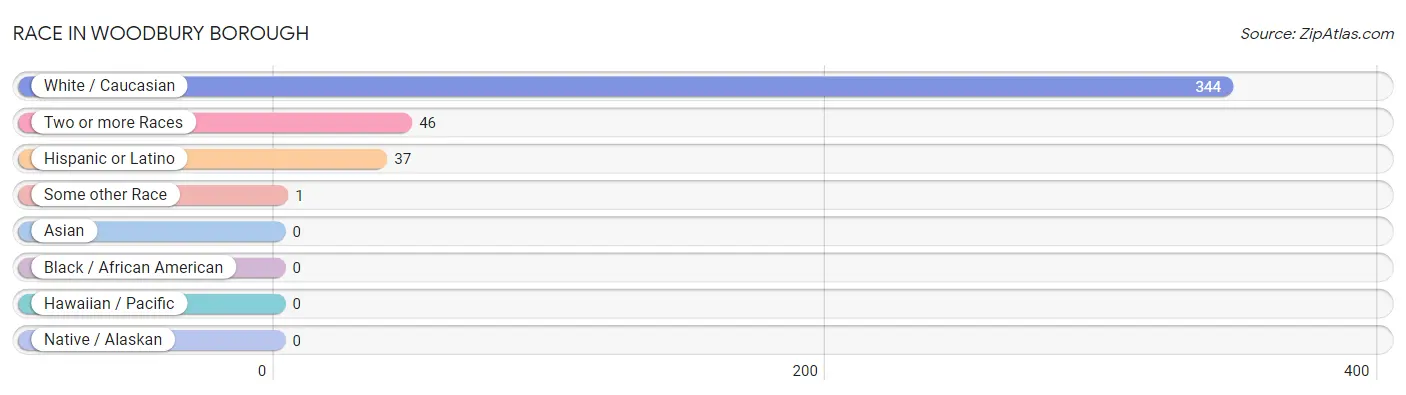
| Race | # Population | % Population |
| Asian | 0 | 0.0% |
| Black / African American | 0 | 0.0% |
| Hawaiian / Pacific | 0 | 0.0% |
| Hispanic or Latino | 37 | 9.5% |
| Native / Alaskan | 0 | 0.0% |
| White / Caucasian | 344 | 88.0% |
| Two or more Races | 46 | 11.8% |
| Some other Race | 1 | 0.3% |
| Total | 391 | 100.0% |
Ancestry in Woodbury borough
The most populous ancestries reported in Woodbury borough are German (113 | 28.9%), Irish (40 | 10.2%), Spanish (36 | 9.2%), American (16 | 4.1%), and English (16 | 4.1%), together accounting for 56.5% of all Woodbury borough residents.
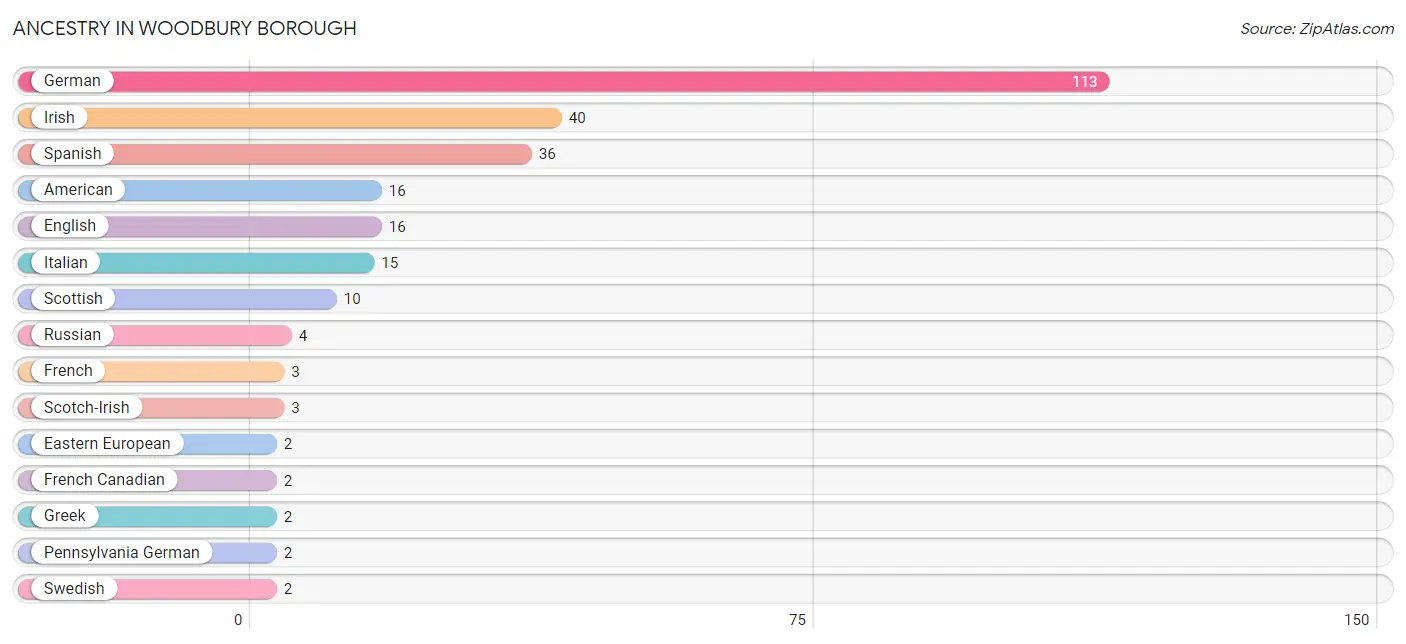
| Ancestry | # Population | % Population |
| American | 16 | 4.1% |
| Eastern European | 2 | 0.5% |
| English | 16 | 4.1% |
| French | 3 | 0.8% |
| French Canadian | 2 | 0.5% |
| German | 113 | 28.9% |
| Greek | 2 | 0.5% |
| Irish | 40 | 10.2% |
| Italian | 15 | 3.8% |
| Mexican | 1 | 0.3% |
| Pennsylvania German | 2 | 0.5% |
| Russian | 4 | 1.0% |
| Scotch-Irish | 3 | 0.8% |
| Scottish | 10 | 2.6% |
| Spanish | 36 | 9.2% |
| Swedish | 2 | 0.5% |
| Swiss | 1 | 0.3% | View All 17 Rows |
Immigrants in Woodbury borough

| Immigration Origin | # Population | % Population | View All 0 Rows |
Sex and Age in Woodbury borough
Sex and Age in Woodbury borough
The most populous age groups in Woodbury borough are 5 to 9 Years (38 | 17.6%) for men and Under 5 Years (28 | 16.0%) for women.
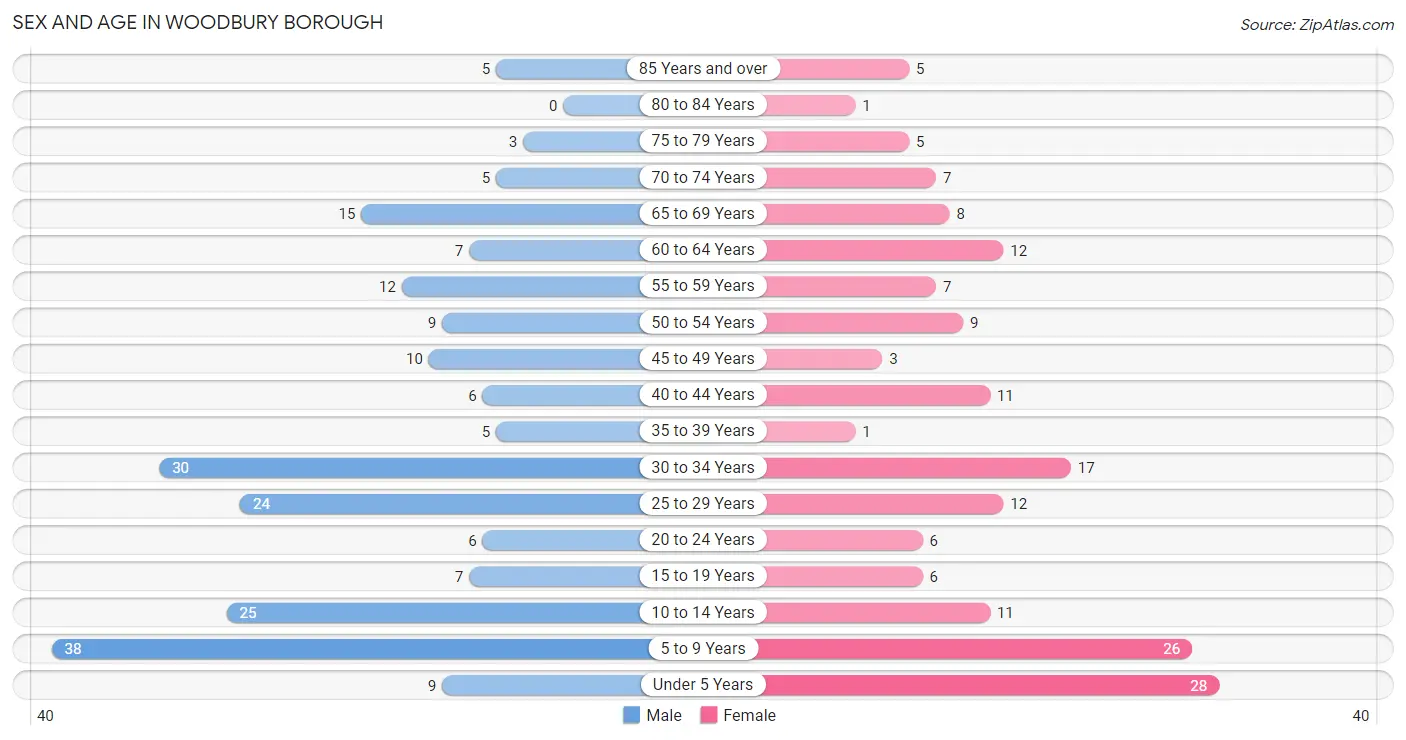
| Age Bracket | Male | Female |
| Under 5 Years | 9 (4.2%) | 28 (16.0%) |
| 5 to 9 Years | 38 (17.6%) | 26 (14.9%) |
| 10 to 14 Years | 25 (11.6%) | 11 (6.3%) |
| 15 to 19 Years | 7 (3.2%) | 6 (3.4%) |
| 20 to 24 Years | 6 (2.8%) | 6 (3.4%) |
| 25 to 29 Years | 24 (11.1%) | 12 (6.9%) |
| 30 to 34 Years | 30 (13.9%) | 17 (9.7%) |
| 35 to 39 Years | 5 (2.3%) | 1 (0.6%) |
| 40 to 44 Years | 6 (2.8%) | 11 (6.3%) |
| 45 to 49 Years | 10 (4.6%) | 3 (1.7%) |
| 50 to 54 Years | 9 (4.2%) | 9 (5.1%) |
| 55 to 59 Years | 12 (5.6%) | 7 (4.0%) |
| 60 to 64 Years | 7 (3.2%) | 12 (6.9%) |
| 65 to 69 Years | 15 (6.9%) | 8 (4.6%) |
| 70 to 74 Years | 5 (2.3%) | 7 (4.0%) |
| 75 to 79 Years | 3 (1.4%) | 5 (2.9%) |
| 80 to 84 Years | 0 (0.0%) | 1 (0.6%) |
| 85 Years and over | 5 (2.3%) | 5 (2.9%) |
| Total | 216 (100.0%) | 175 (100.0%) |
Families and Households in Woodbury borough
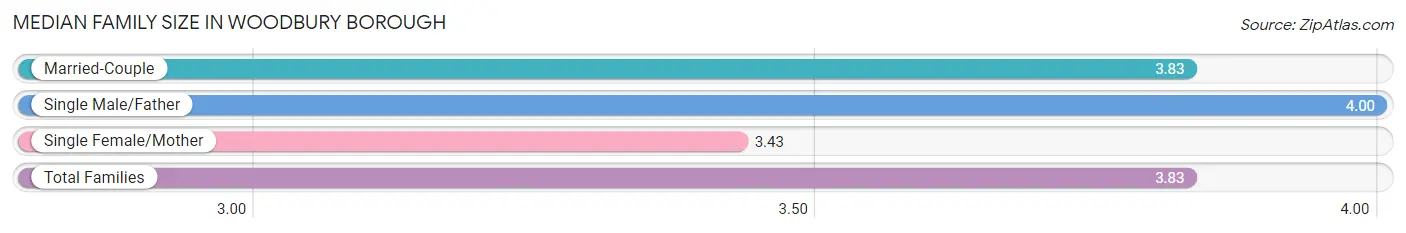
Median Family Size in Woodbury borough
The median family size in Woodbury borough is 3.83 persons per family, with single male/father families (16 | 17.4%) accounting for the largest median family size of 4 persons per family. On the other hand, single female/mother families (7 | 7.6%) represent the smallest median family size with 3.43 persons per family.
| Family Type | # Families | Family Size |
| Married-Couple | 69 (75.0%) | 3.83 |
| Single Male/Father | 16 (17.4%) | 4.00 |
| Single Female/Mother | 7 (7.6%) | 3.43 |
| Total Families | 92 (100.0%) | 3.83 |
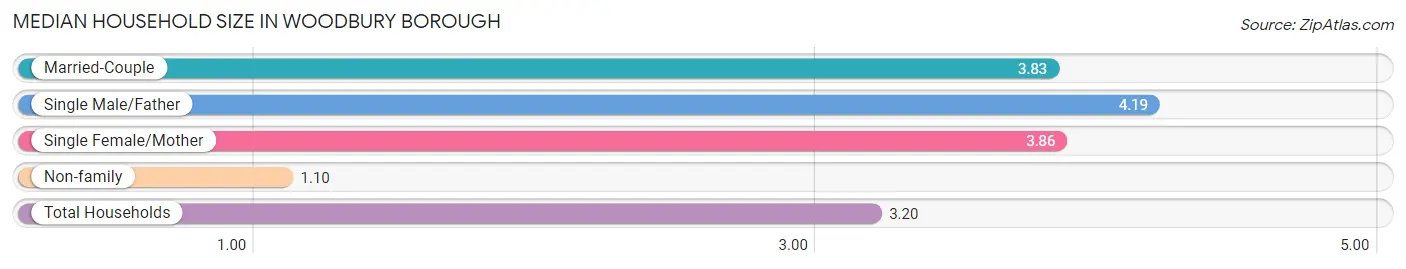
Median Household Size in Woodbury borough
The median household size in Woodbury borough is 3.20 persons per household, with single male/father households (16 | 13.1%) accounting for the largest median household size of 4.19 persons per household. non-family households (30 | 24.6%) represent the smallest median household size with 1.10 persons per household.
| Household Type | # Households | Household Size |
| Married-Couple | 69 (56.6%) | 3.83 |
| Single Male/Father | 16 (13.1%) | 4.19 |
| Single Female/Mother | 7 (5.7%) | 3.86 |
| Non-family | 30 (24.6%) | 1.10 |
| Total Households | 122 (100.0%) | 3.20 |
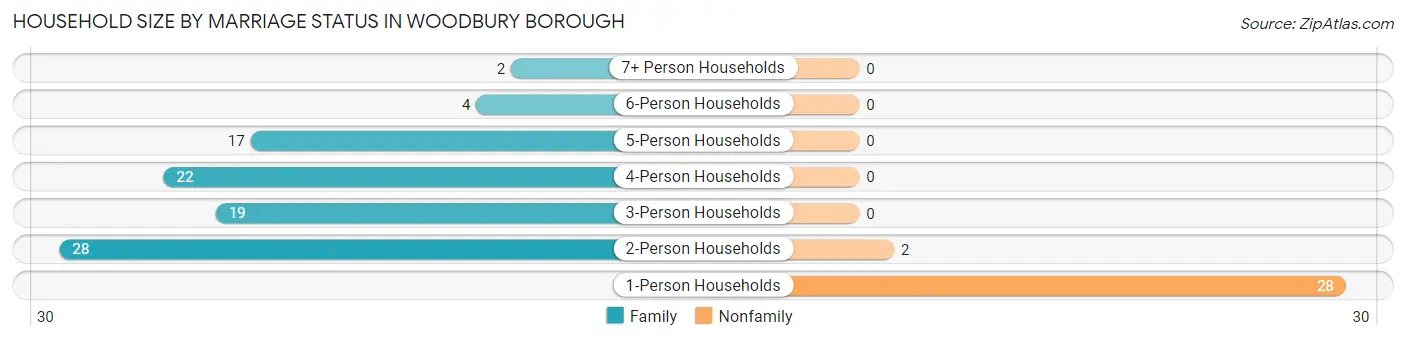
Household Size by Marriage Status in Woodbury borough
Out of a total of 122 households in Woodbury borough, 92 (75.4%) are family households, while 30 (24.6%) are nonfamily households. The most numerous type of family households are 2-person households, comprising 28, and the most common type of nonfamily households are 1-person households, comprising 28.
| Household Size | Family Households | Nonfamily Households |
| 1-Person Households | - | 28 (23.0%) |
| 2-Person Households | 28 (23.0%) | 2 (1.6%) |
| 3-Person Households | 19 (15.6%) | 0 (0.0%) |
| 4-Person Households | 22 (18.0%) | 0 (0.0%) |
| 5-Person Households | 17 (13.9%) | 0 (0.0%) |
| 6-Person Households | 4 (3.3%) | 0 (0.0%) |
| 7+ Person Households | 2 (1.6%) | 0 (0.0%) |
| Total | 92 (75.4%) | 30 (24.6%) |
Female Fertility in Woodbury borough
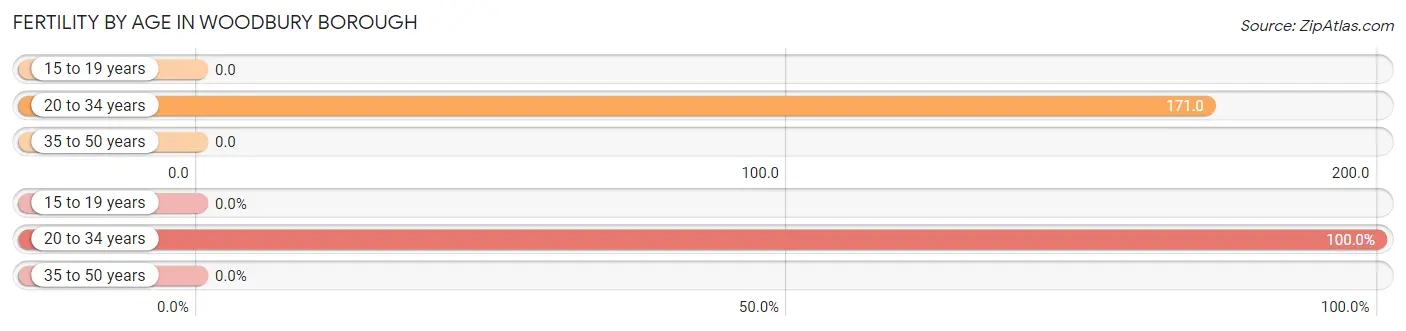
Fertility by Age in Woodbury borough
Average fertility rate in Woodbury borough is 107.0 births per 1,000 women. Women in the age bracket of 20 to 34 years have the highest fertility rate with 171.0 births per 1,000 women. Women in the age bracket of 20 to 34 years acount for 100.0% of all women with births.
| Age Bracket | Women with Births | Births / 1,000 Women |
| 15 to 19 years | 0 (0.0%) | 0.0 |
| 20 to 34 years | 6 (100.0%) | 171.0 |
| 35 to 50 years | 0 (0.0%) | 0.0 |
| Total | 6 (100.0%) | 107.0 |
Fertility by Age by Marriage Status in Woodbury borough
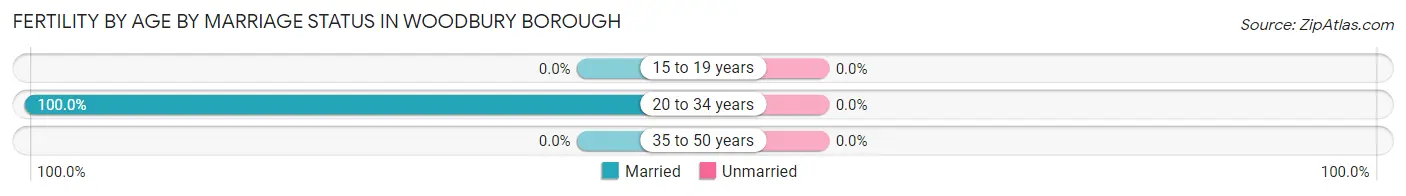
| Age Bracket | Married | Unmarried |
| 15 to 19 years | 0 (0.0%) | 0 (0.0%) |
| 20 to 34 years | 6 (100.0%) | 0 (0.0%) |
| 35 to 50 years | 0 (0.0%) | 0 (0.0%) |
| Total | 6 (100.0%) | 0 (0.0%) |
Fertility by Education in Woodbury borough
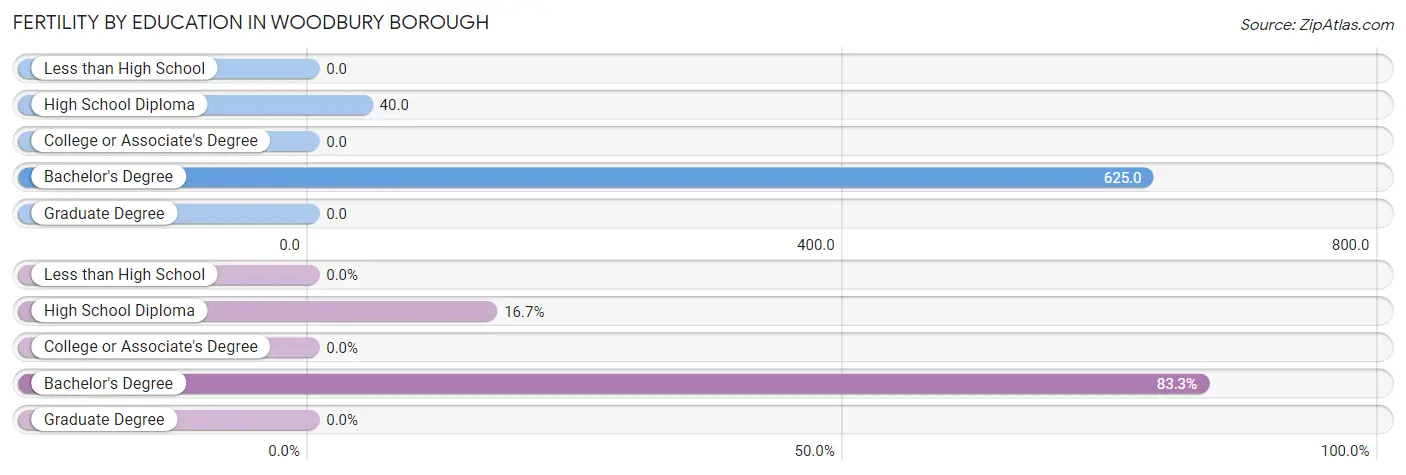
| Educational Attainment | Women with Births | Births / 1,000 Women |
| Less than High School | 0 (0.0%) | 0.0 |
| High School Diploma | 1 (16.7%) | 40.0 |
| College or Associate's Degree | 0 (0.0%) | 0.0 |
| Bachelor's Degree | 5 (83.3%) | 625.0 |
| Graduate Degree | 0 (0.0%) | 0.0 |
| Total | 6 (100.0%) | 107.0 |
Fertility by Education by Marriage Status in Woodbury borough
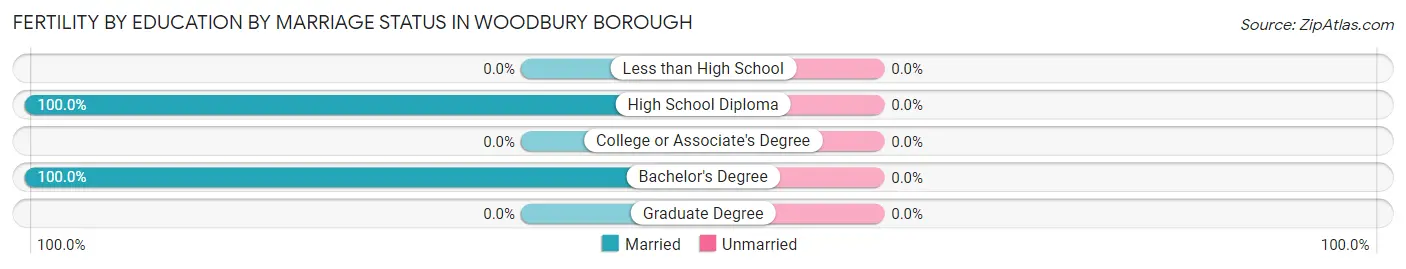
| Educational Attainment | Married | Unmarried |
| Less than High School | 0 (0.0%) | 0 (0.0%) |
| High School Diploma | 1 (100.0%) | 0 (0.0%) |
| College or Associate's Degree | 0 (0.0%) | 0 (0.0%) |
| Bachelor's Degree | 5 (100.0%) | 0 (0.0%) |
| Graduate Degree | 0 (0.0%) | 0 (0.0%) |
| Total | 6 (100.0%) | 0 (0.0%) |
Employment Characteristics in Woodbury borough
Employment by Class of Employer in Woodbury borough
Among the 150 employed individuals in Woodbury borough, private company employees (111 | 74.0%), not-for-profit organizations (14 | 9.3%), and local government employees (14 | 9.3%) make up the most common classes of employment.
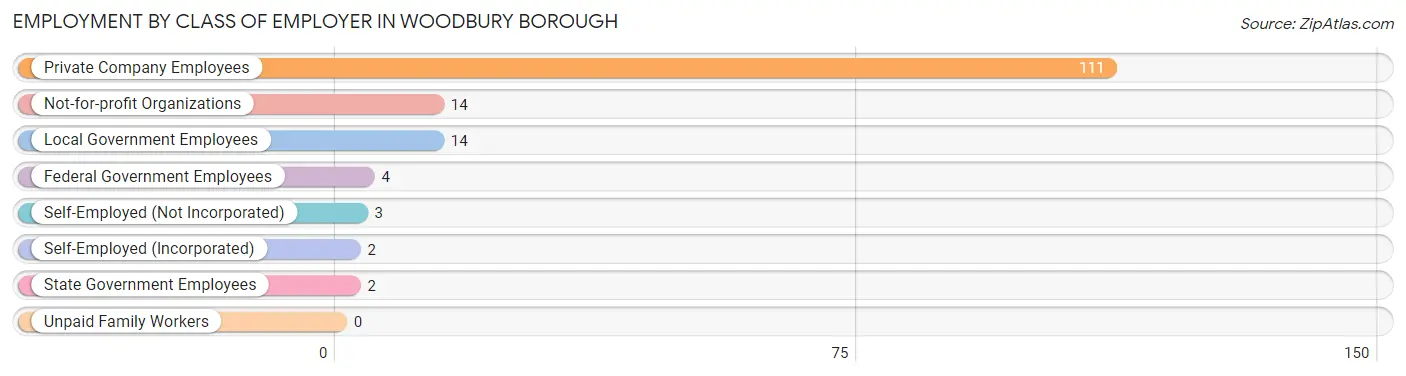
| Employer Class | # Employees | % Employees |
| Private Company Employees | 111 | 74.0% |
| Self-Employed (Incorporated) | 2 | 1.3% |
| Self-Employed (Not Incorporated) | 3 | 2.0% |
| Not-for-profit Organizations | 14 | 9.3% |
| Local Government Employees | 14 | 9.3% |
| State Government Employees | 2 | 1.3% |
| Federal Government Employees | 4 | 2.7% |
| Unpaid Family Workers | 0 | 0.0% |
| Total | 150 | 100.0% |
Employment Status by Age in Woodbury borough
According to the labor force statistics for Woodbury borough, out of the total population over 16 years of age (254), 66.9% or 170 individuals are in the labor force, with 10.6% or 18 of them unemployed. The age group with the highest labor force participation rate is 20 to 24 years, with 100.0% or 12 individuals in the labor force. Within the labor force, the 25 to 29 years age range has the highest percentage of unemployed individuals, with 27.3% or 9 of them being unemployed.
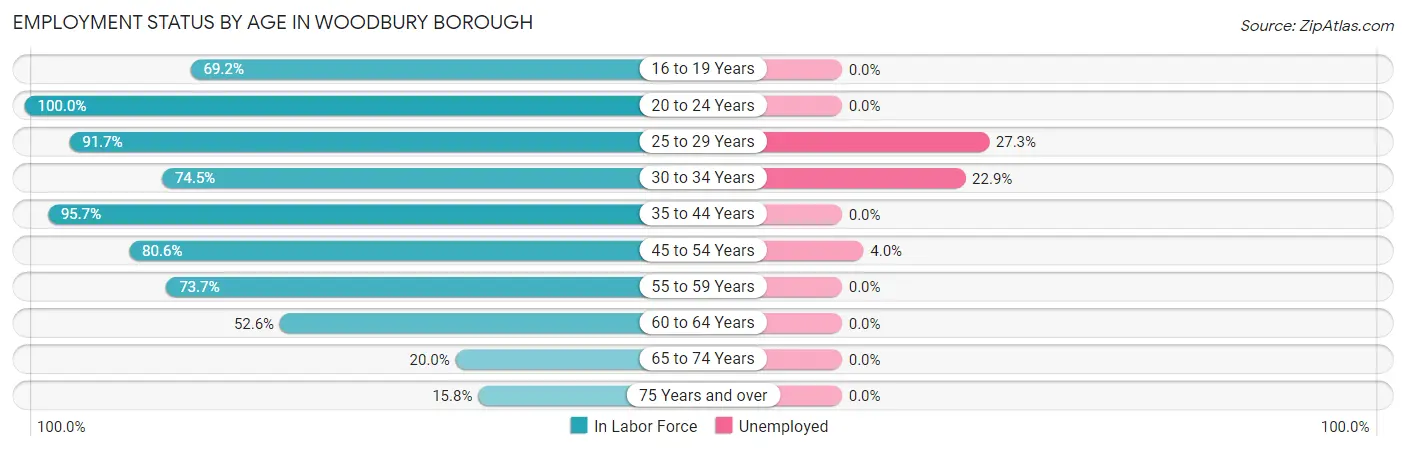
| Age Bracket | In Labor Force | Unemployed |
| 16 to 19 Years | 9 (69.2%) | 0 (0.0%) |
| 20 to 24 Years | 12 (100.0%) | 0 (0.0%) |
| 25 to 29 Years | 33 (91.7%) | 9 (27.3%) |
| 30 to 34 Years | 35 (74.5%) | 8 (22.9%) |
| 35 to 44 Years | 22 (95.7%) | 0 (0.0%) |
| 45 to 54 Years | 25 (80.6%) | 1 (4.0%) |
| 55 to 59 Years | 14 (73.7%) | 0 (0.0%) |
| 60 to 64 Years | 10 (52.6%) | 0 (0.0%) |
| 65 to 74 Years | 7 (20.0%) | 0 (0.0%) |
| 75 Years and over | 3 (15.8%) | 0 (0.0%) |
| Total | 170 (66.9%) | 18 (10.6%) |
Employment Status by Educational Attainment in Woodbury borough
According to labor force statistics for Woodbury borough, 79.4% of individuals (139) out of the total population between 25 and 64 years of age (175) are in the labor force, with 12.9% or 18 of them being unemployed. The group with the highest labor force participation rate are those with the educational attainment of college / associate degree, with 97.9% or 46 individuals in the labor force. Within the labor force, individuals with less than high school education have the highest percentage of unemployment, with 46.7% or 7 of them being unemployed.
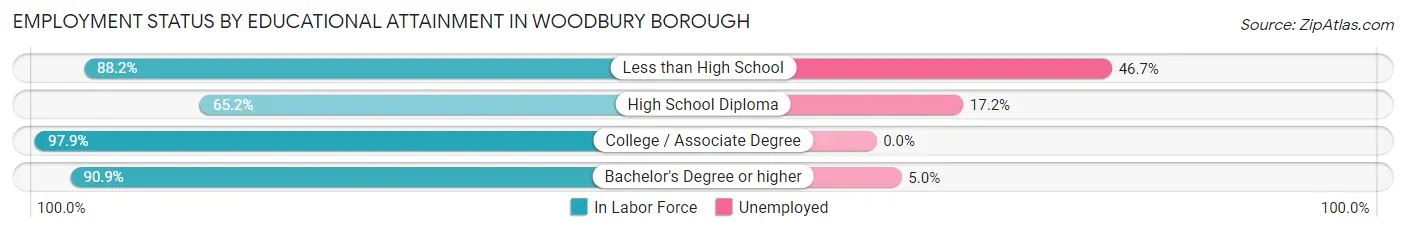
| Educational Attainment | In Labor Force | Unemployed |
| Less than High School | 15 (88.2%) | 8 (46.7%) |
| High School Diploma | 58 (65.2%) | 15 (17.2%) |
| College / Associate Degree | 46 (97.9%) | 0 (0.0%) |
| Bachelor's Degree or higher | 20 (90.9%) | 1 (5.0%) |
| Total | 139 (79.4%) | 23 (12.9%) |
Employment Occupations by Sex in Woodbury borough
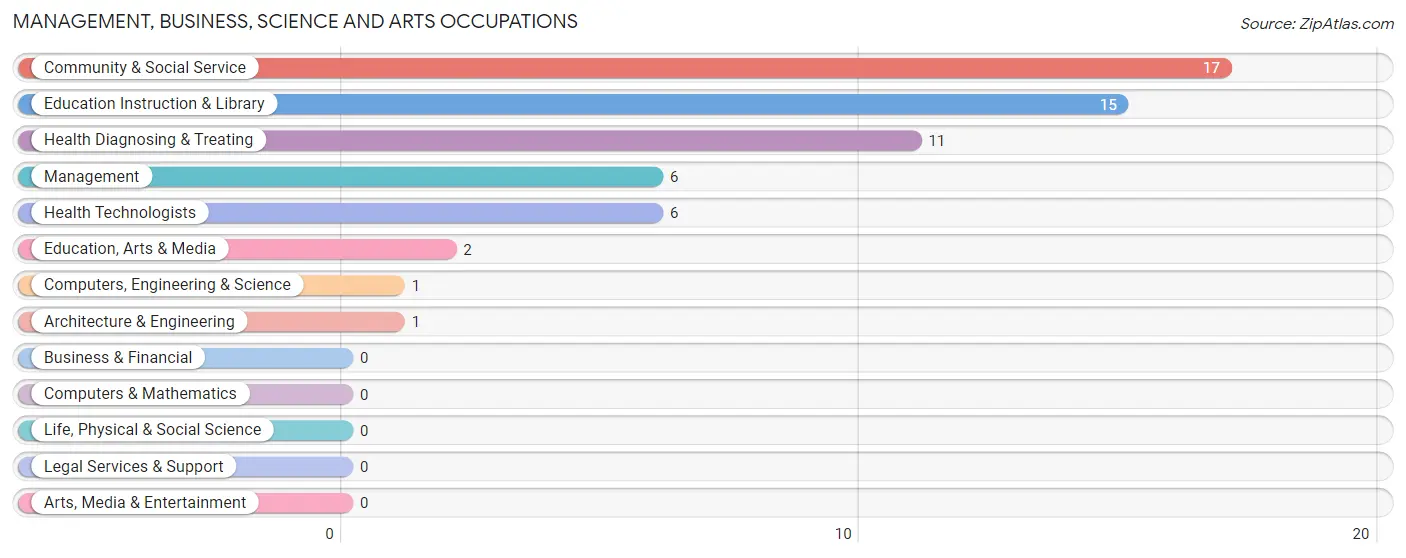
Management, Business, Science and Arts Occupations
The most common Management, Business, Science and Arts occupations in Woodbury borough are Community & Social Service (17 | 11.2%), Education Instruction & Library (15 | 9.9%), Health Diagnosing & Treating (11 | 7.2%), Management (6 | 4.0%), and Health Technologists (6 | 4.0%).
Management, Business, Science and Arts Occupations by Sex
Within the Management, Business, Science and Arts occupations in Woodbury borough, the most male-oriented occupations are Computers, Engineering & Science (100.0%), Architecture & Engineering (100.0%), and Management (66.7%), while the most female-oriented occupations are Education, Arts & Media (100.0%), Health Technologists (100.0%), and Community & Social Service (76.5%).
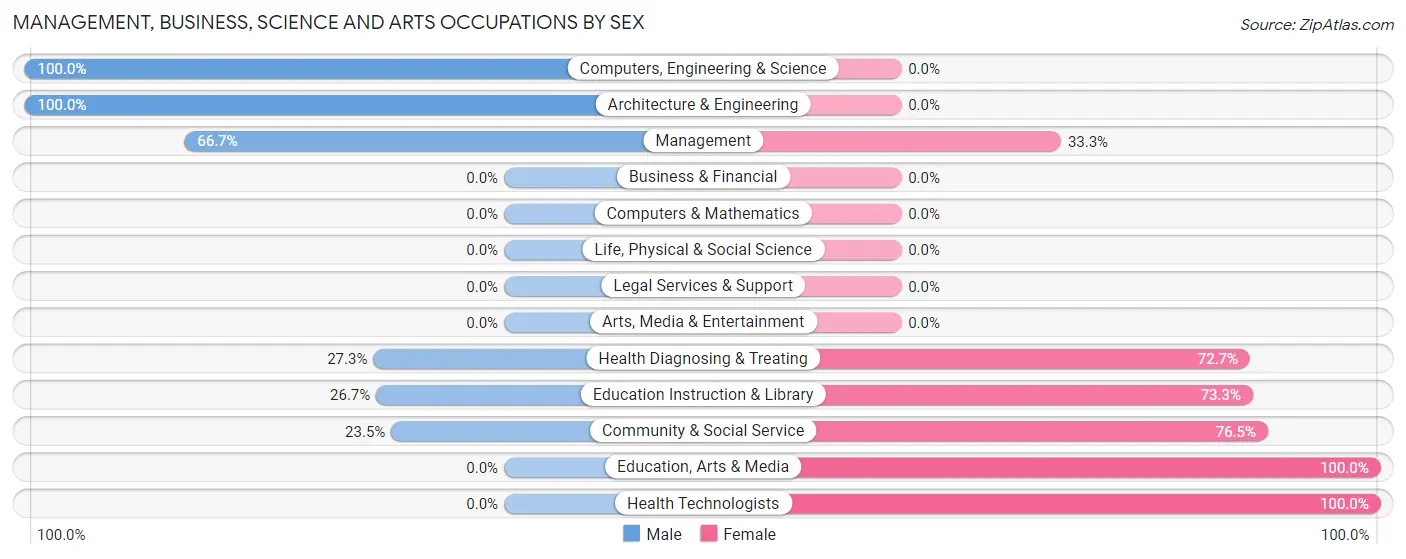
| Occupation | Male | Female |
| Management | 4 (66.7%) | 2 (33.3%) |
| Business & Financial | 0 (0.0%) | 0 (0.0%) |
| Computers, Engineering & Science | 1 (100.0%) | 0 (0.0%) |
| Computers & Mathematics | 0 (0.0%) | 0 (0.0%) |
| Architecture & Engineering | 1 (100.0%) | 0 (0.0%) |
| Life, Physical & Social Science | 0 (0.0%) | 0 (0.0%) |
| Community & Social Service | 4 (23.5%) | 13 (76.5%) |
| Education, Arts & Media | 0 (0.0%) | 2 (100.0%) |
| Legal Services & Support | 0 (0.0%) | 0 (0.0%) |
| Education Instruction & Library | 4 (26.7%) | 11 (73.3%) |
| Arts, Media & Entertainment | 0 (0.0%) | 0 (0.0%) |
| Health Diagnosing & Treating | 3 (27.3%) | 8 (72.7%) |
| Health Technologists | 0 (0.0%) | 6 (100.0%) |
| Total (Category) | 12 (34.3%) | 23 (65.7%) |
| Total (Overall) | 85 (55.9%) | 67 (44.1%) |
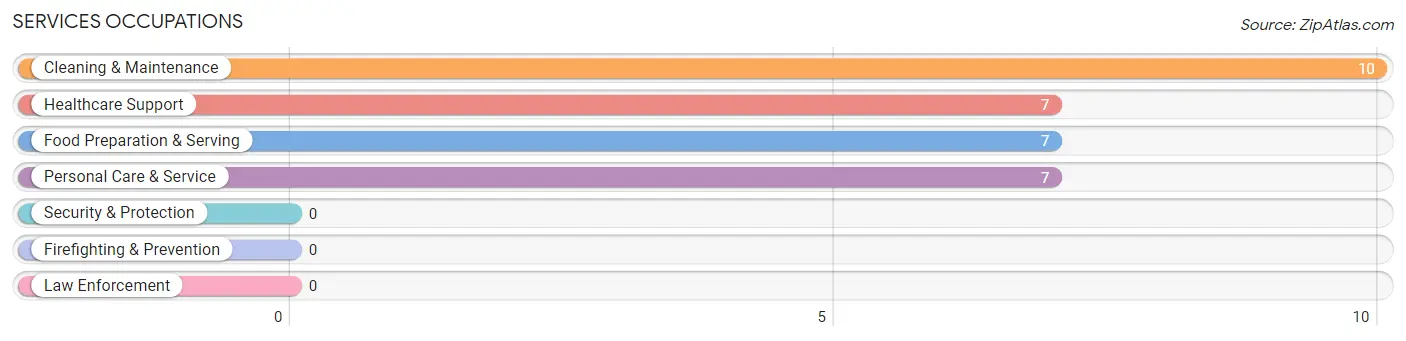
Services Occupations
The most common Services occupations in Woodbury borough are Cleaning & Maintenance (10 | 6.6%), Healthcare Support (7 | 4.6%), Food Preparation & Serving (7 | 4.6%), and Personal Care & Service (7 | 4.6%).
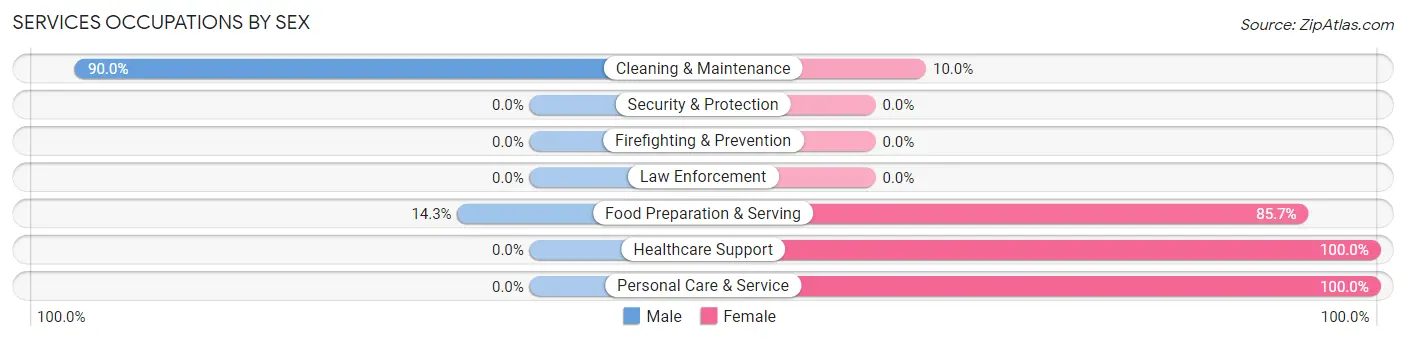
Services Occupations by Sex
Within the Services occupations in Woodbury borough, the most male-oriented occupations are Cleaning & Maintenance (90.0%), and Food Preparation & Serving (14.3%), while the most female-oriented occupations are Healthcare Support (100.0%), Personal Care & Service (100.0%), and Food Preparation & Serving (85.7%).
| Occupation | Male | Female |
| Healthcare Support | 0 (0.0%) | 7 (100.0%) |
| Security & Protection | 0 (0.0%) | 0 (0.0%) |
| Firefighting & Prevention | 0 (0.0%) | 0 (0.0%) |
| Law Enforcement | 0 (0.0%) | 0 (0.0%) |
| Food Preparation & Serving | 1 (14.3%) | 6 (85.7%) |
| Cleaning & Maintenance | 9 (90.0%) | 1 (10.0%) |
| Personal Care & Service | 0 (0.0%) | 7 (100.0%) |
| Total (Category) | 10 (32.3%) | 21 (67.7%) |
| Total (Overall) | 85 (55.9%) | 67 (44.1%) |
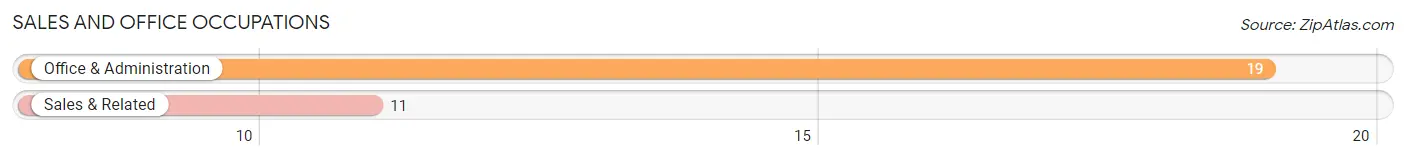
Sales and Office Occupations
The most common Sales and Office occupations in Woodbury borough are Office & Administration (19 | 12.5%), and Sales & Related (11 | 7.2%).
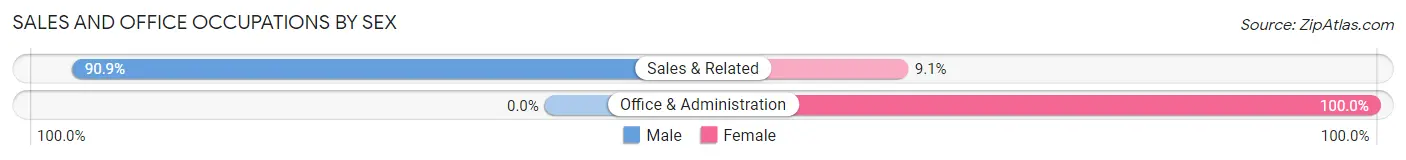
Sales and Office Occupations by Sex
| Occupation | Male | Female |
| Sales & Related | 10 (90.9%) | 1 (9.1%) |
| Office & Administration | 0 (0.0%) | 19 (100.0%) |
| Total (Category) | 10 (33.3%) | 20 (66.7%) |
| Total (Overall) | 85 (55.9%) | 67 (44.1%) |
Natural Resources, Construction and Maintenance Occupations
The most common Natural Resources, Construction and Maintenance occupations in Woodbury borough are Construction & Extraction (12 | 7.9%), Farming, Fishing & Forestry (2 | 1.3%), and Installation, Maintenance & Repair (1 | 0.7%).
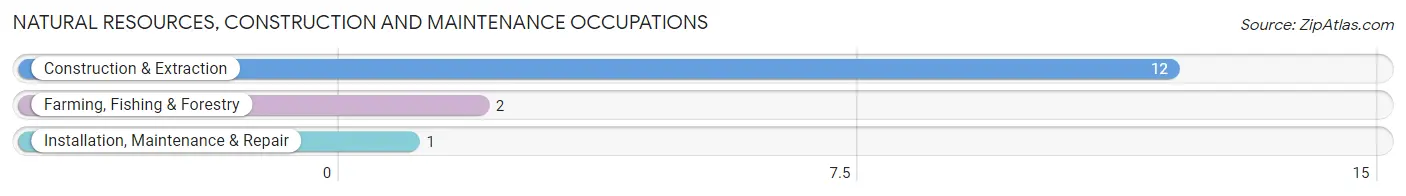
Natural Resources, Construction and Maintenance Occupations by Sex
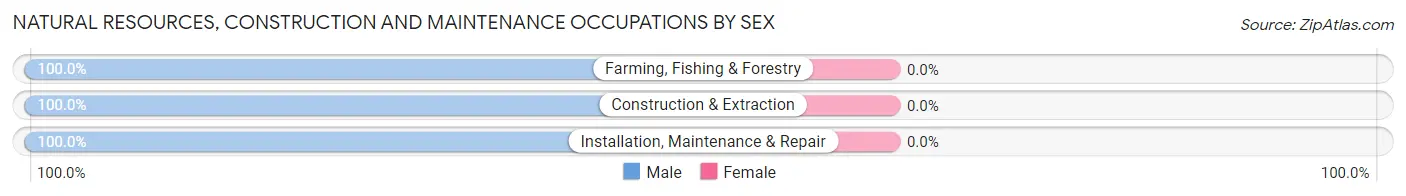
| Occupation | Male | Female |
| Farming, Fishing & Forestry | 2 (100.0%) | 0 (0.0%) |
| Construction & Extraction | 12 (100.0%) | 0 (0.0%) |
| Installation, Maintenance & Repair | 1 (100.0%) | 0 (0.0%) |
| Total (Category) | 15 (100.0%) | 0 (0.0%) |
| Total (Overall) | 85 (55.9%) | 67 (44.1%) |
Production, Transportation and Moving Occupations
The most common Production, Transportation and Moving occupations in Woodbury borough are Production (19 | 12.5%), Transportation (11 | 7.2%), and Material Moving (11 | 7.2%).
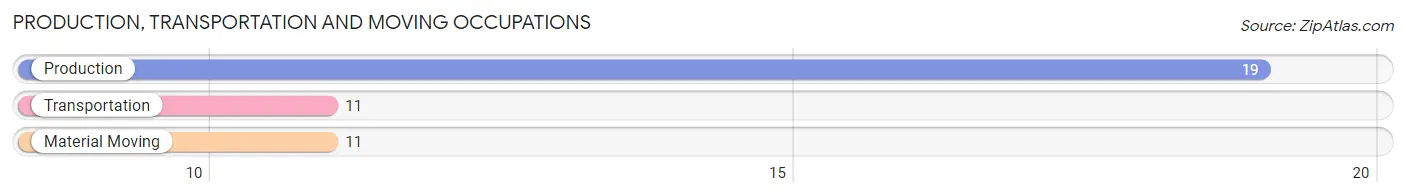
Production, Transportation and Moving Occupations by Sex
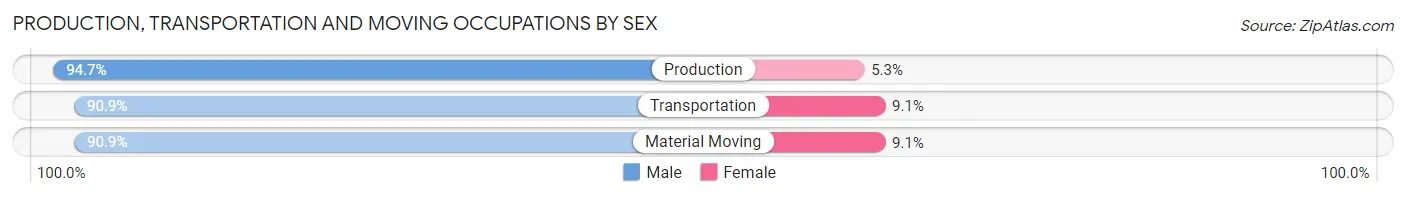
| Occupation | Male | Female |
| Production | 18 (94.7%) | 1 (5.3%) |
| Transportation | 10 (90.9%) | 1 (9.1%) |
| Material Moving | 10 (90.9%) | 1 (9.1%) |
| Total (Category) | 38 (92.7%) | 3 (7.3%) |
| Total (Overall) | 85 (55.9%) | 67 (44.1%) |
Employment Industries by Sex in Woodbury borough
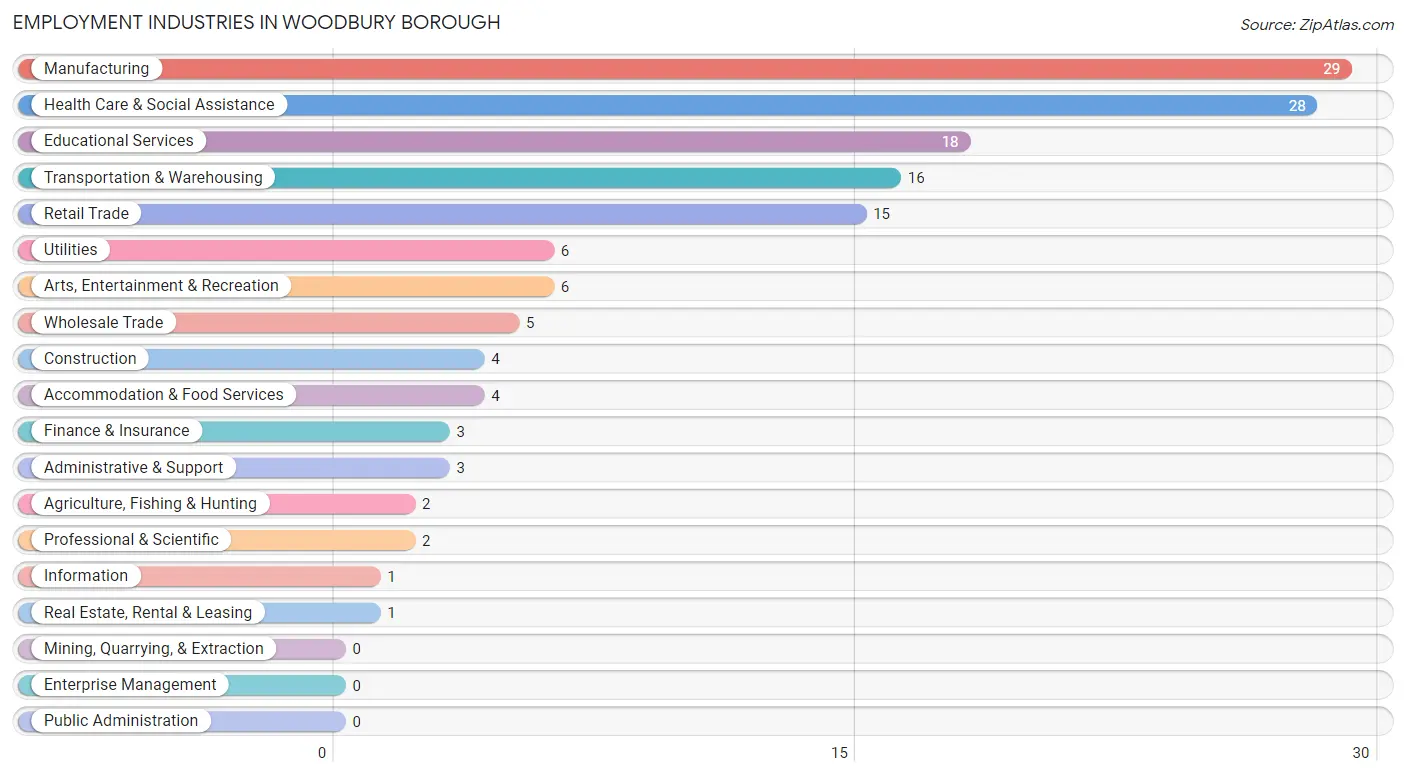
Employment Industries in Woodbury borough
The major employment industries in Woodbury borough include Manufacturing (29 | 19.1%), Health Care & Social Assistance (28 | 18.4%), Educational Services (18 | 11.8%), Transportation & Warehousing (16 | 10.5%), and Retail Trade (15 | 9.9%).
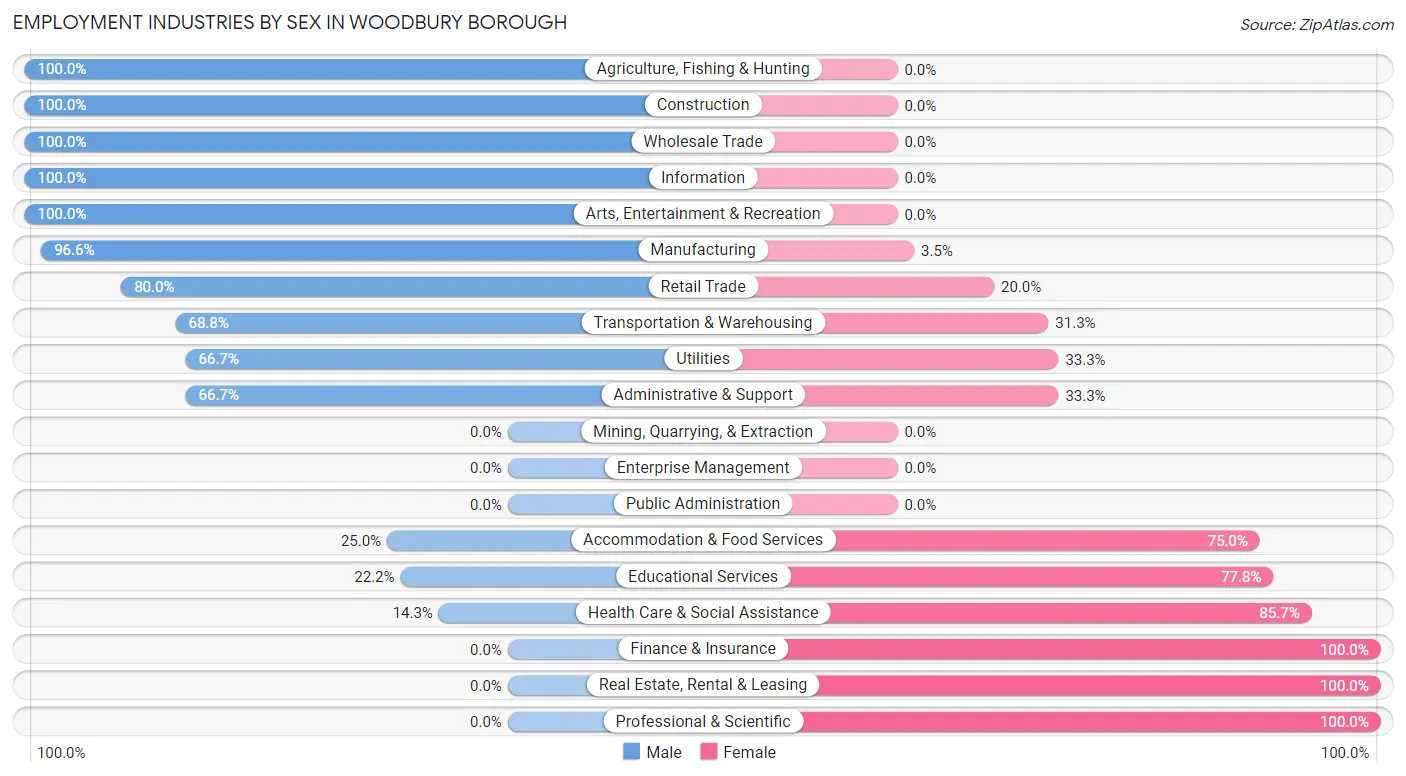
Employment Industries by Sex in Woodbury borough
The Woodbury borough industries that see more men than women are Agriculture, Fishing & Hunting (100.0%), Construction (100.0%), and Wholesale Trade (100.0%), whereas the industries that tend to have a higher number of women are Finance & Insurance (100.0%), Real Estate, Rental & Leasing (100.0%), and Professional & Scientific (100.0%).
| Industry | Male | Female |
| Agriculture, Fishing & Hunting | 2 (100.0%) | 0 (0.0%) |
| Mining, Quarrying, & Extraction | 0 (0.0%) | 0 (0.0%) |
| Construction | 4 (100.0%) | 0 (0.0%) |
| Manufacturing | 28 (96.6%) | 1 (3.5%) |
| Wholesale Trade | 5 (100.0%) | 0 (0.0%) |
| Retail Trade | 12 (80.0%) | 3 (20.0%) |
| Transportation & Warehousing | 11 (68.8%) | 5 (31.2%) |
| Utilities | 4 (66.7%) | 2 (33.3%) |
| Information | 1 (100.0%) | 0 (0.0%) |
| Finance & Insurance | 0 (0.0%) | 3 (100.0%) |
| Real Estate, Rental & Leasing | 0 (0.0%) | 1 (100.0%) |
| Professional & Scientific | 0 (0.0%) | 2 (100.0%) |
| Enterprise Management | 0 (0.0%) | 0 (0.0%) |
| Administrative & Support | 2 (66.7%) | 1 (33.3%) |
| Educational Services | 4 (22.2%) | 14 (77.8%) |
| Health Care & Social Assistance | 4 (14.3%) | 24 (85.7%) |
| Arts, Entertainment & Recreation | 6 (100.0%) | 0 (0.0%) |
| Accommodation & Food Services | 1 (25.0%) | 3 (75.0%) |
| Public Administration | 0 (0.0%) | 0 (0.0%) |
| Total | 85 (55.9%) | 67 (44.1%) |
Education in Woodbury borough
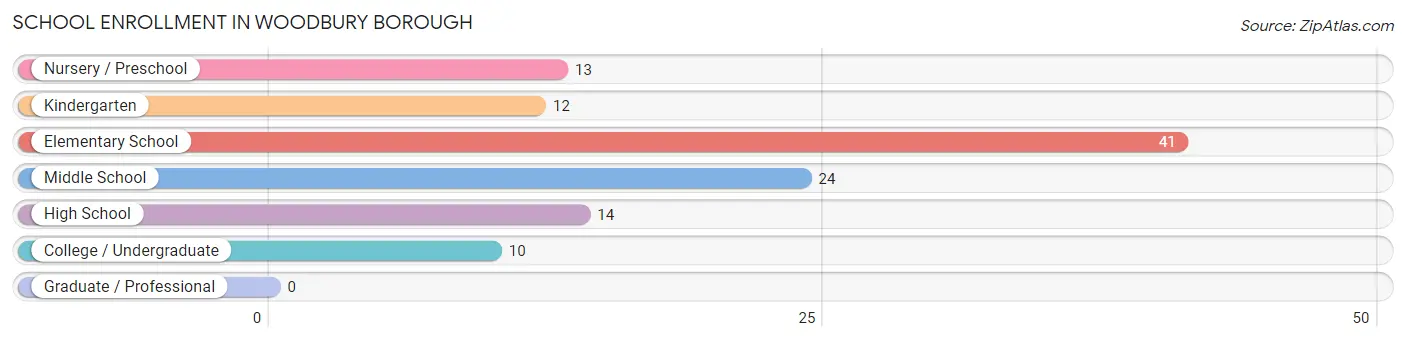
School Enrollment in Woodbury borough
The most common levels of schooling among the 114 students in Woodbury borough are elementary school (41 | 36.0%), middle school (24 | 21.0%), and high school (14 | 12.3%).
| School Level | # Students | % Students |
| Nursery / Preschool | 13 | 11.4% |
| Kindergarten | 12 | 10.5% |
| Elementary School | 41 | 36.0% |
| Middle School | 24 | 21.0% |
| High School | 14 | 12.3% |
| College / Undergraduate | 10 | 8.8% |
| Graduate / Professional | 0 | 0.0% |
| Total | 114 | 100.0% |
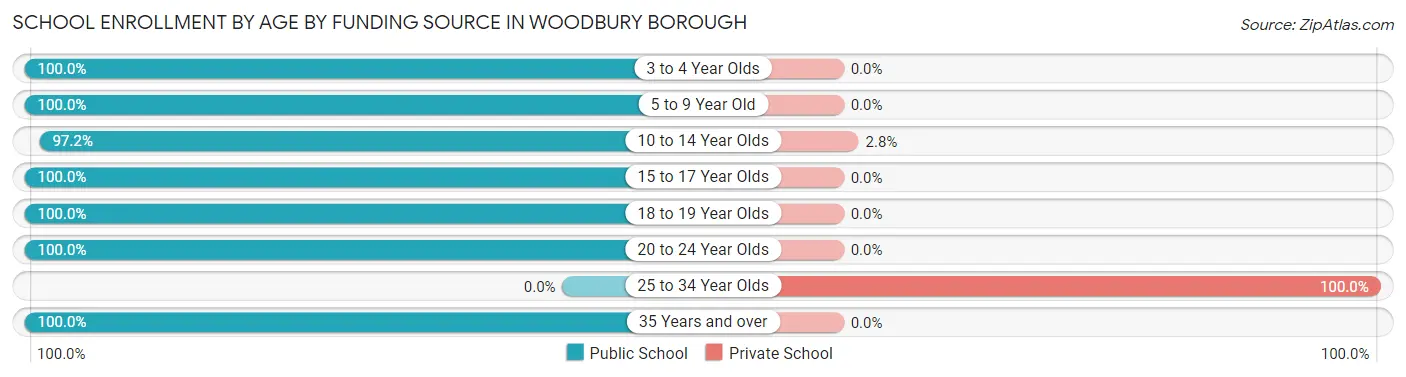
School Enrollment by Age by Funding Source in Woodbury borough
Out of a total of 114 students who are enrolled in schools in Woodbury borough, 8 (7.0%) attend a private institution, while the remaining 106 (93.0%) are enrolled in public schools. The age group of 25 to 34 year olds has the highest likelihood of being enrolled in private schools, with 7 (100.0% in the age bracket) enrolled. Conversely, the age group of 3 to 4 year olds has the lowest likelihood of being enrolled in a private school, with 2 (100.0% in the age bracket) attending a public institution.
| Age Bracket | Public School | Private School |
| 3 to 4 Year Olds | 2 (100.0%) | 0 (0.0%) |
| 5 to 9 Year Old | 58 (100.0%) | 0 (0.0%) |
| 10 to 14 Year Olds | 35 (97.2%) | 1 (2.8%) |
| 15 to 17 Year Olds | 5 (100.0%) | 0 (0.0%) |
| 18 to 19 Year Olds | 3 (100.0%) | 0 (0.0%) |
| 20 to 24 Year Olds | 1 (100.0%) | 0 (0.0%) |
| 25 to 34 Year Olds | 0 (0.0%) | 7 (100.0%) |
| 35 Years and over | 2 (100.0%) | 0 (0.0%) |
| Total | 106 (93.0%) | 8 (7.0%) |
Educational Attainment by Field of Study in Woodbury borough
Education (10 | 35.7%), business (5 | 17.9%), bio, nature & agricultural (4 | 14.3%), arts & humanities (3 | 10.7%), and computers & mathematics (2 | 7.1%) are the most common fields of study among 28 individuals in Woodbury borough who have obtained a bachelor's degree or higher.
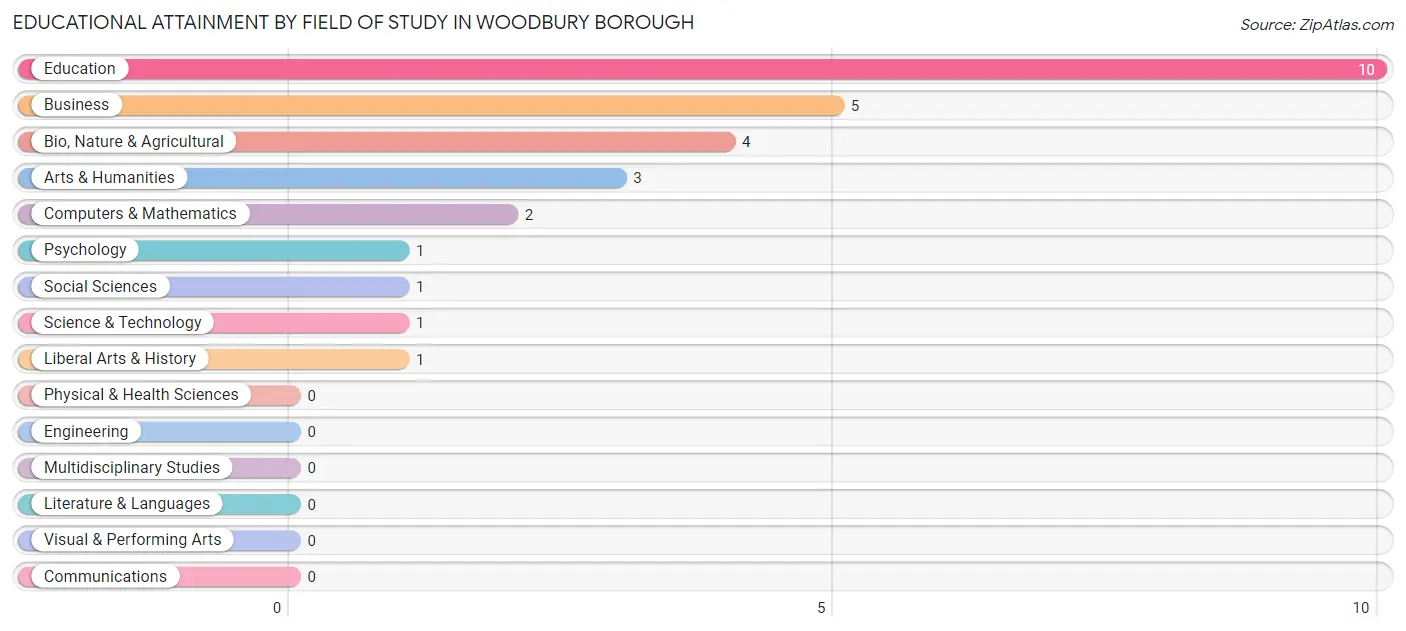
| Field of Study | # Graduates | % Graduates |
| Computers & Mathematics | 2 | 7.1% |
| Bio, Nature & Agricultural | 4 | 14.3% |
| Physical & Health Sciences | 0 | 0.0% |
| Psychology | 1 | 3.6% |
| Social Sciences | 1 | 3.6% |
| Engineering | 0 | 0.0% |
| Multidisciplinary Studies | 0 | 0.0% |
| Science & Technology | 1 | 3.6% |
| Business | 5 | 17.9% |
| Education | 10 | 35.7% |
| Literature & Languages | 0 | 0.0% |
| Liberal Arts & History | 1 | 3.6% |
| Visual & Performing Arts | 0 | 0.0% |
| Communications | 0 | 0.0% |
| Arts & Humanities | 3 | 10.7% |
| Total | 28 | 100.0% |
Transportation & Commute in Woodbury borough
Vehicle Availability by Sex in Woodbury borough
The most prevalent vehicle ownership categories in Woodbury borough are males with 2 vehicles (30, accounting for 36.1%) and females with 2 vehicles (25, making up 44.8%).
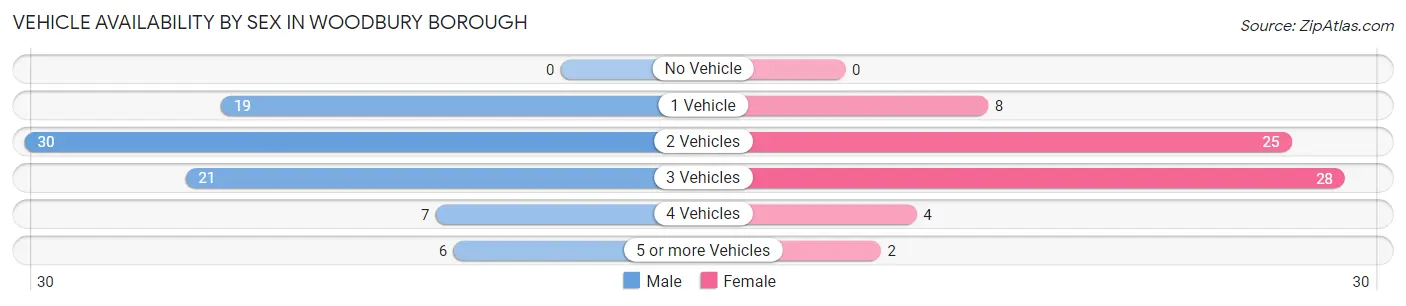
| Vehicles Available | Male | Female |
| No Vehicle | 0 (0.0%) | 0 (0.0%) |
| 1 Vehicle | 19 (22.9%) | 8 (11.9%) |
| 2 Vehicles | 30 (36.1%) | 25 (37.3%) |
| 3 Vehicles | 21 (25.3%) | 28 (41.8%) |
| 4 Vehicles | 7 (8.4%) | 4 (6.0%) |
| 5 or more Vehicles | 6 (7.2%) | 2 (3.0%) |
| Total | 83 (100.0%) | 67 (100.0%) |
Commute Time in Woodbury borough
The most frequently occuring commute durations in Woodbury borough are 20 to 24 minutes (31 commuters, 21.2%), 10 to 14 minutes (24 commuters, 16.4%), and 30 to 34 minutes (19 commuters, 13.0%).
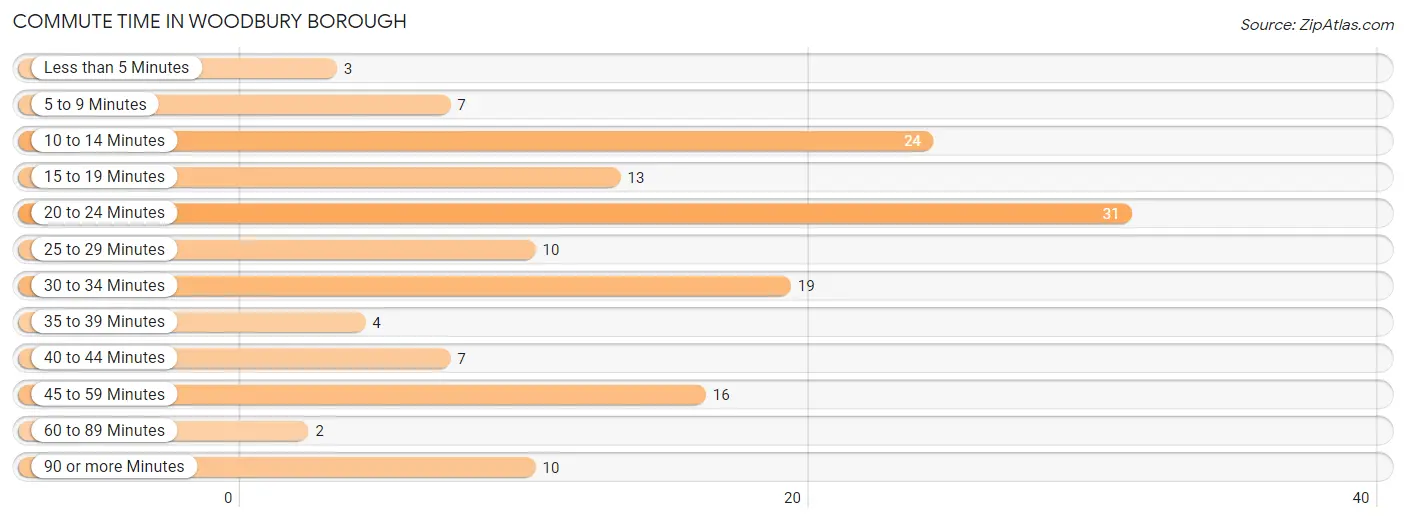
| Commute Time | # Commuters | % Commuters |
| Less than 5 Minutes | 3 | 2.1% |
| 5 to 9 Minutes | 7 | 4.8% |
| 10 to 14 Minutes | 24 | 16.4% |
| 15 to 19 Minutes | 13 | 8.9% |
| 20 to 24 Minutes | 31 | 21.2% |
| 25 to 29 Minutes | 10 | 6.9% |
| 30 to 34 Minutes | 19 | 13.0% |
| 35 to 39 Minutes | 4 | 2.7% |
| 40 to 44 Minutes | 7 | 4.8% |
| 45 to 59 Minutes | 16 | 11.0% |
| 60 to 89 Minutes | 2 | 1.4% |
| 90 or more Minutes | 10 | 6.9% |
Commute Time by Sex in Woodbury borough
The most common commute times in Woodbury borough are 20 to 24 minutes (20 commuters, 24.1%) for males and 10 to 14 minutes (17 commuters, 27.0%) for females.
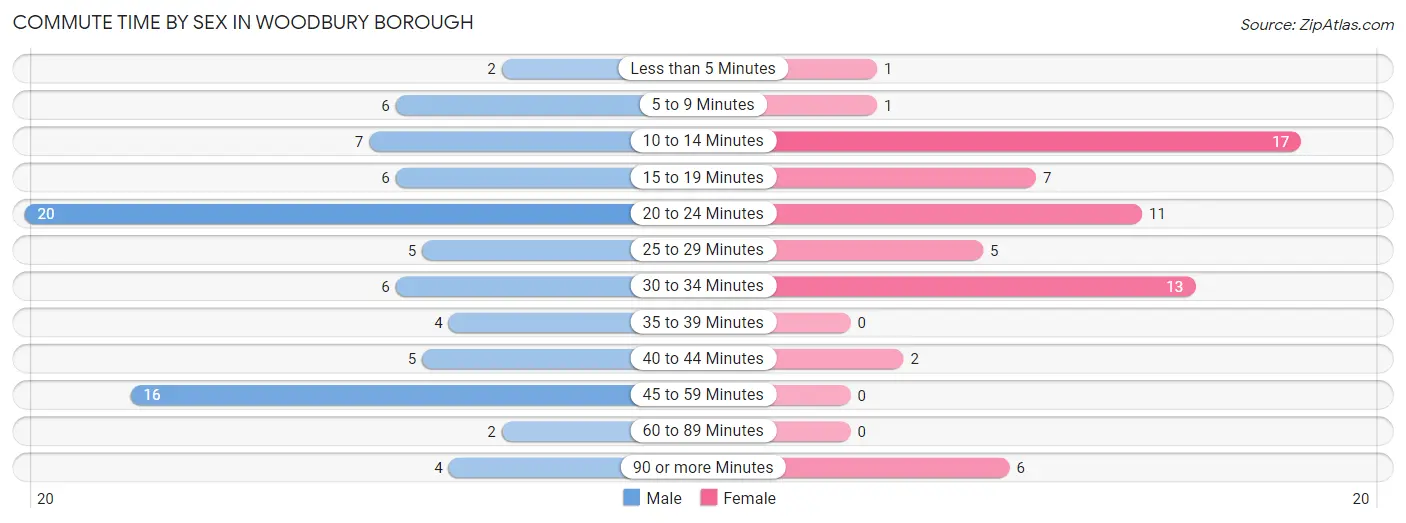
| Commute Time | Male | Female |
| Less than 5 Minutes | 2 (2.4%) | 1 (1.6%) |
| 5 to 9 Minutes | 6 (7.2%) | 1 (1.6%) |
| 10 to 14 Minutes | 7 (8.4%) | 17 (27.0%) |
| 15 to 19 Minutes | 6 (7.2%) | 7 (11.1%) |
| 20 to 24 Minutes | 20 (24.1%) | 11 (17.5%) |
| 25 to 29 Minutes | 5 (6.0%) | 5 (7.9%) |
| 30 to 34 Minutes | 6 (7.2%) | 13 (20.6%) |
| 35 to 39 Minutes | 4 (4.8%) | 0 (0.0%) |
| 40 to 44 Minutes | 5 (6.0%) | 2 (3.2%) |
| 45 to 59 Minutes | 16 (19.3%) | 0 (0.0%) |
| 60 to 89 Minutes | 2 (2.4%) | 0 (0.0%) |
| 90 or more Minutes | 4 (4.8%) | 6 (9.5%) |
Time of Departure to Work by Sex in Woodbury borough
The most frequent times of departure to work in Woodbury borough are 6:00 AM to 6:29 AM (19, 22.9%) for males and 7:30 AM to 7:59 AM (17, 27.0%) for females.
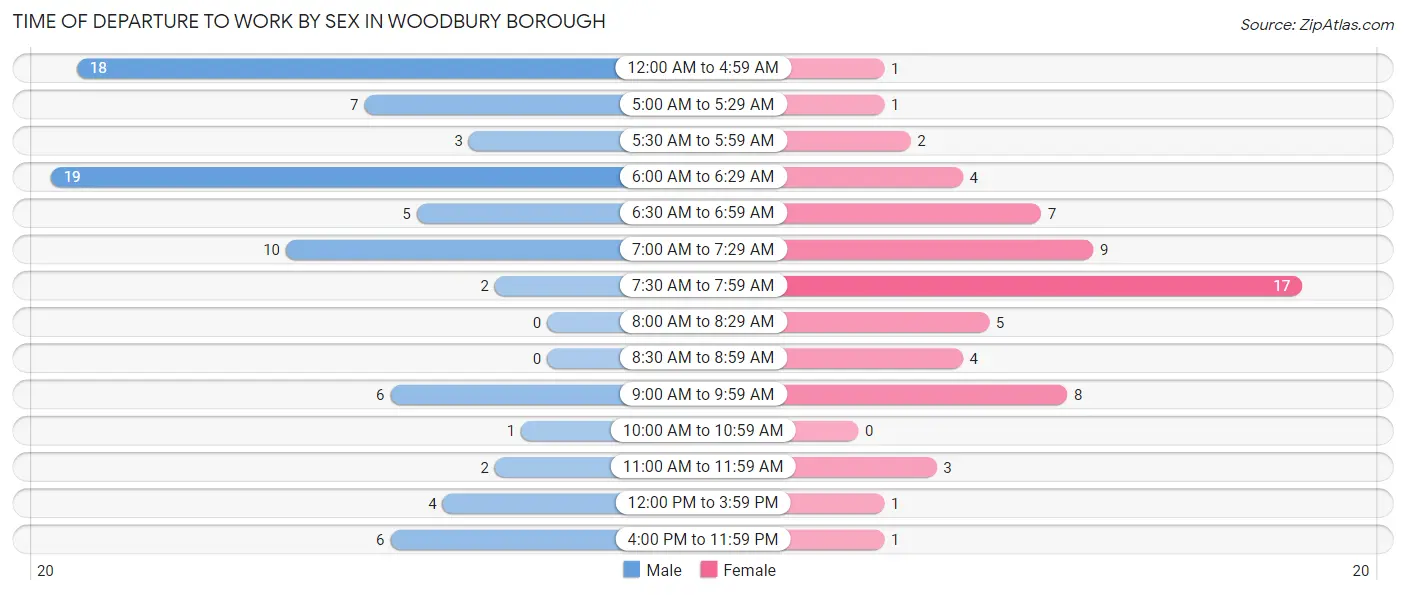
| Time of Departure | Male | Female |
| 12:00 AM to 4:59 AM | 18 (21.7%) | 1 (1.6%) |
| 5:00 AM to 5:29 AM | 7 (8.4%) | 1 (1.6%) |
| 5:30 AM to 5:59 AM | 3 (3.6%) | 2 (3.2%) |
| 6:00 AM to 6:29 AM | 19 (22.9%) | 4 (6.4%) |
| 6:30 AM to 6:59 AM | 5 (6.0%) | 7 (11.1%) |
| 7:00 AM to 7:29 AM | 10 (12.0%) | 9 (14.3%) |
| 7:30 AM to 7:59 AM | 2 (2.4%) | 17 (27.0%) |
| 8:00 AM to 8:29 AM | 0 (0.0%) | 5 (7.9%) |
| 8:30 AM to 8:59 AM | 0 (0.0%) | 4 (6.4%) |
| 9:00 AM to 9:59 AM | 6 (7.2%) | 8 (12.7%) |
| 10:00 AM to 10:59 AM | 1 (1.2%) | 0 (0.0%) |
| 11:00 AM to 11:59 AM | 2 (2.4%) | 3 (4.8%) |
| 12:00 PM to 3:59 PM | 4 (4.8%) | 1 (1.6%) |
| 4:00 PM to 11:59 PM | 6 (7.2%) | 1 (1.6%) |
| Total | 83 (100.0%) | 63 (100.0%) |
Housing Occupancy in Woodbury borough
Occupancy by Ownership in Woodbury borough
Of the total 122 dwellings in Woodbury borough, owner-occupied units account for 104 (85.3%), while renter-occupied units make up 18 (14.7%).
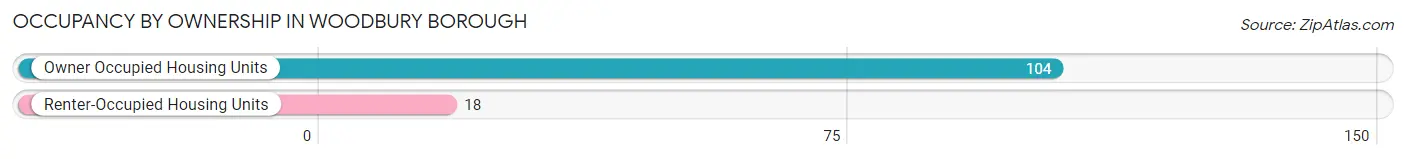
| Occupancy | # Housing Units | % Housing Units |
| Owner Occupied Housing Units | 104 | 85.3% |
| Renter-Occupied Housing Units | 18 | 14.7% |
| Total Occupied Housing Units | 122 | 100.0% |
Occupancy by Household Size in Woodbury borough
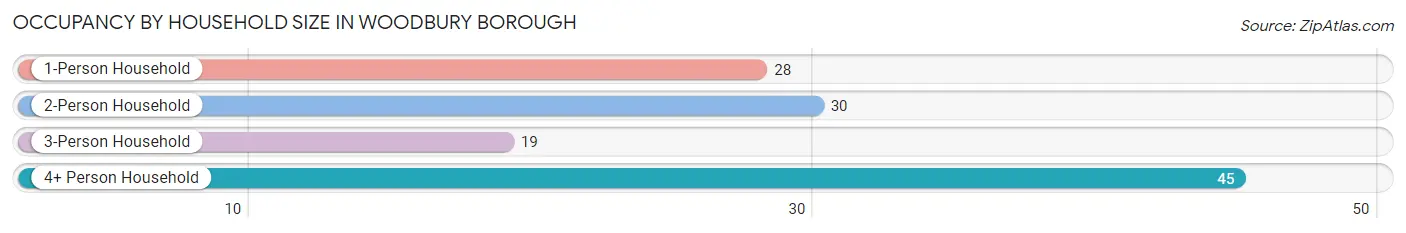
| Household Size | # Housing Units | % Housing Units |
| 1-Person Household | 28 | 23.0% |
| 2-Person Household | 30 | 24.6% |
| 3-Person Household | 19 | 15.6% |
| 4+ Person Household | 45 | 36.9% |
| Total Housing Units | 122 | 100.0% |
Occupancy by Ownership by Household Size in Woodbury borough
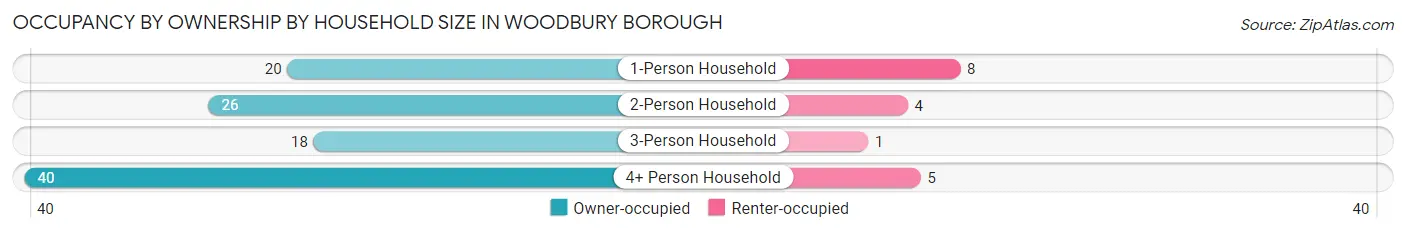
| Household Size | Owner-occupied | Renter-occupied |
| 1-Person Household | 20 (71.4%) | 8 (28.6%) |
| 2-Person Household | 26 (86.7%) | 4 (13.3%) |
| 3-Person Household | 18 (94.7%) | 1 (5.3%) |
| 4+ Person Household | 40 (88.9%) | 5 (11.1%) |
| Total Housing Units | 104 (85.3%) | 18 (14.7%) |
Occupancy by Educational Attainment in Woodbury borough
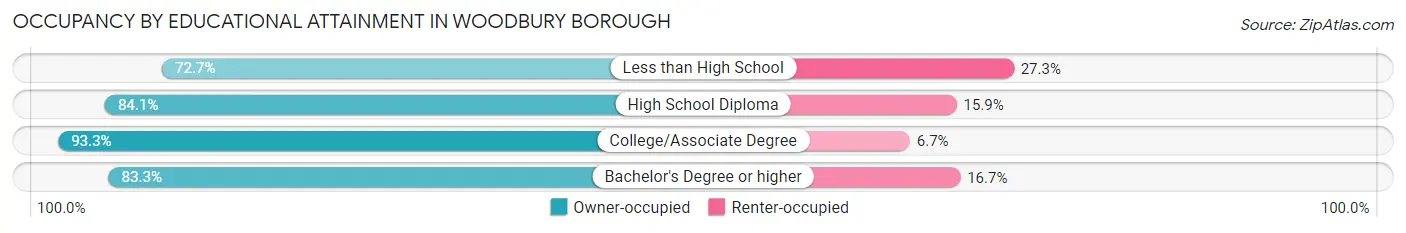
| Household Size | Owner-occupied | Renter-occupied |
| Less than High School | 8 (72.7%) | 3 (27.3%) |
| High School Diploma | 58 (84.1%) | 11 (15.9%) |
| College/Associate Degree | 28 (93.3%) | 2 (6.7%) |
| Bachelor's Degree or higher | 10 (83.3%) | 2 (16.7%) |
Occupancy by Age of Householder in Woodbury borough
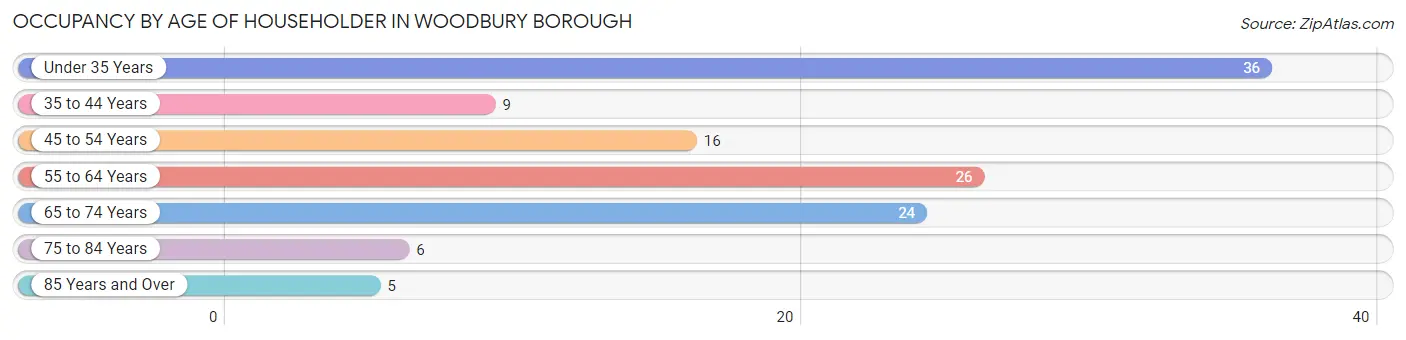
| Age Bracket | # Households | % Households |
| Under 35 Years | 36 | 29.5% |
| 35 to 44 Years | 9 | 7.4% |
| 45 to 54 Years | 16 | 13.1% |
| 55 to 64 Years | 26 | 21.3% |
| 65 to 74 Years | 24 | 19.7% |
| 75 to 84 Years | 6 | 4.9% |
| 85 Years and Over | 5 | 4.1% |
| Total | 122 | 100.0% |
Housing Finances in Woodbury borough
Median Income by Occupancy in Woodbury borough
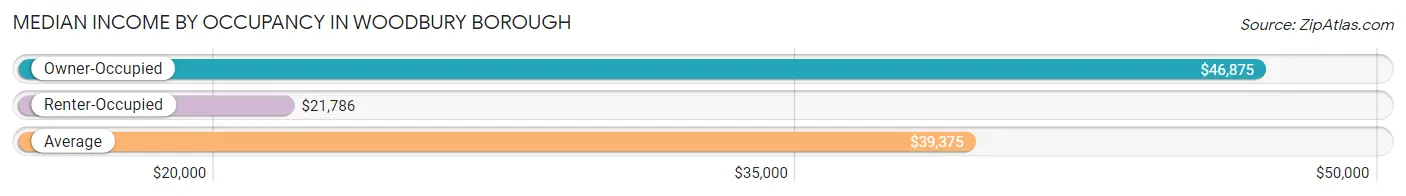
| Occupancy Type | # Households | Median Income |
| Owner-Occupied | 104 (85.3%) | $46,875 |
| Renter-Occupied | 18 (14.7%) | $21,786 |
| Average | 122 (100.0%) | $39,375 |
Occupancy by Householder Income Bracket in Woodbury borough
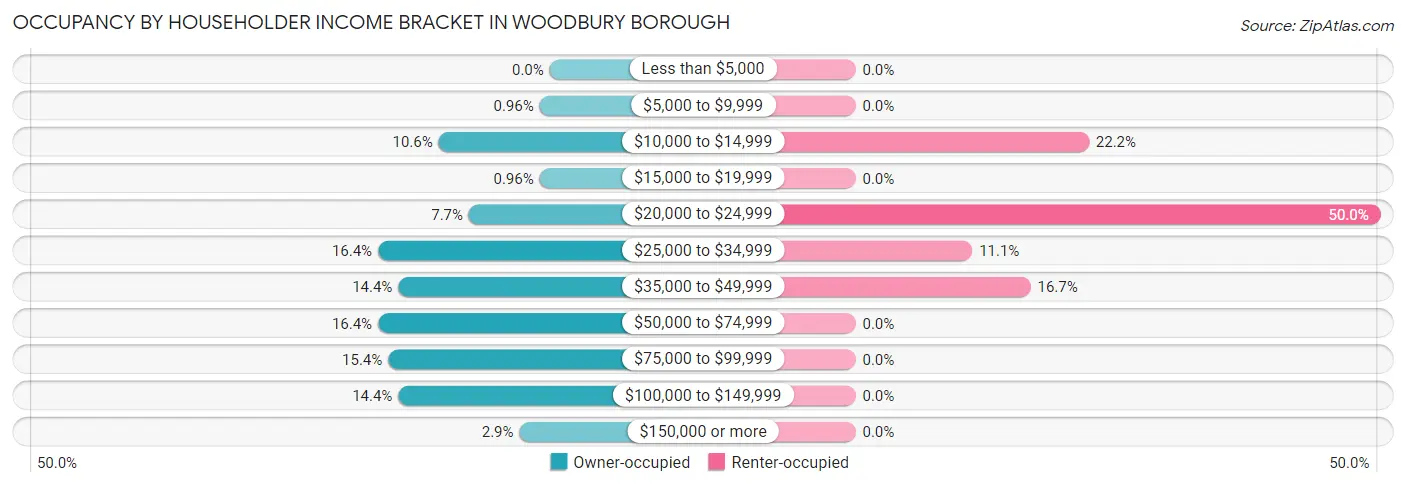
| Income Bracket | Owner-occupied | Renter-occupied |
| Less than $5,000 | 0 (0.0%) | 0 (0.0%) |
| $5,000 to $9,999 | 1 (1.0%) | 0 (0.0%) |
| $10,000 to $14,999 | 11 (10.6%) | 4 (22.2%) |
| $15,000 to $19,999 | 1 (1.0%) | 0 (0.0%) |
| $20,000 to $24,999 | 8 (7.7%) | 9 (50.0%) |
| $25,000 to $34,999 | 17 (16.4%) | 2 (11.1%) |
| $35,000 to $49,999 | 15 (14.4%) | 3 (16.7%) |
| $50,000 to $74,999 | 17 (16.4%) | 0 (0.0%) |
| $75,000 to $99,999 | 16 (15.4%) | 0 (0.0%) |
| $100,000 to $149,999 | 15 (14.4%) | 0 (0.0%) |
| $150,000 or more | 3 (2.9%) | 0 (0.0%) |
| Total | 104 (100.0%) | 18 (100.0%) |
Monthly Housing Cost Tiers in Woodbury borough
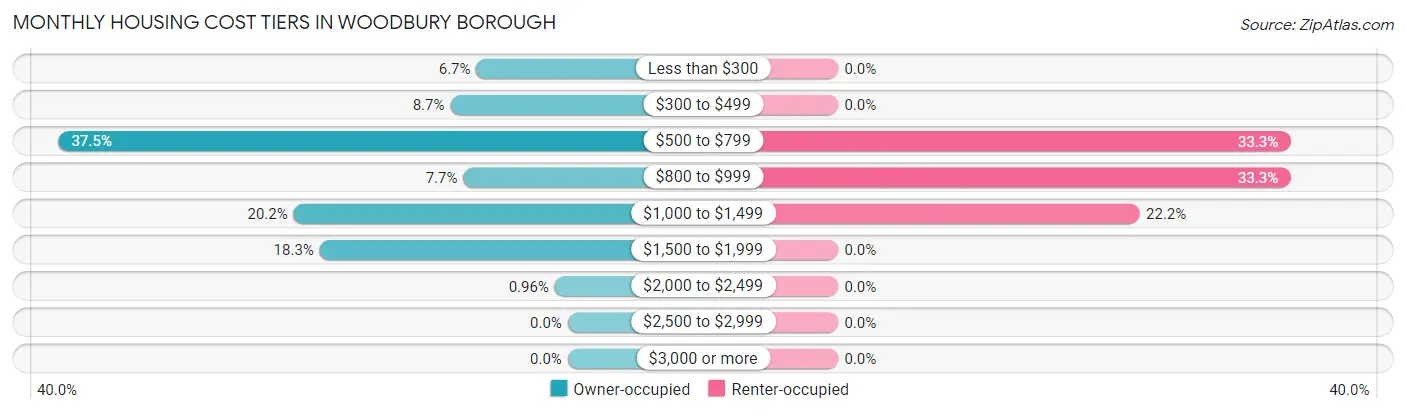
| Monthly Cost | Owner-occupied | Renter-occupied |
| Less than $300 | 7 (6.7%) | 0 (0.0%) |
| $300 to $499 | 9 (8.6%) | 0 (0.0%) |
| $500 to $799 | 39 (37.5%) | 6 (33.3%) |
| $800 to $999 | 8 (7.7%) | 6 (33.3%) |
| $1,000 to $1,499 | 21 (20.2%) | 4 (22.2%) |
| $1,500 to $1,999 | 19 (18.3%) | 0 (0.0%) |
| $2,000 to $2,499 | 1 (1.0%) | 0 (0.0%) |
| $2,500 to $2,999 | 0 (0.0%) | 0 (0.0%) |
| $3,000 or more | 0 (0.0%) | 0 (0.0%) |
| Total | 104 (100.0%) | 18 (100.0%) |
Physical Housing Characteristics in Woodbury borough
Housing Structures in Woodbury borough
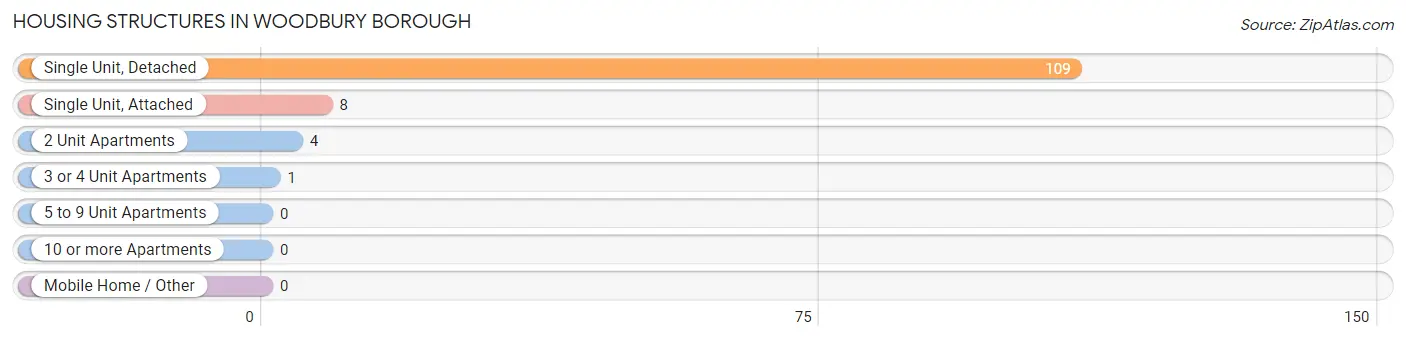
| Structure Type | # Housing Units | % Housing Units |
| Single Unit, Detached | 109 | 89.3% |
| Single Unit, Attached | 8 | 6.6% |
| 2 Unit Apartments | 4 | 3.3% |
| 3 or 4 Unit Apartments | 1 | 0.8% |
| 5 to 9 Unit Apartments | 0 | 0.0% |
| 10 or more Apartments | 0 | 0.0% |
| Mobile Home / Other | 0 | 0.0% |
| Total | 122 | 100.0% |
Housing Structures by Occupancy in Woodbury borough
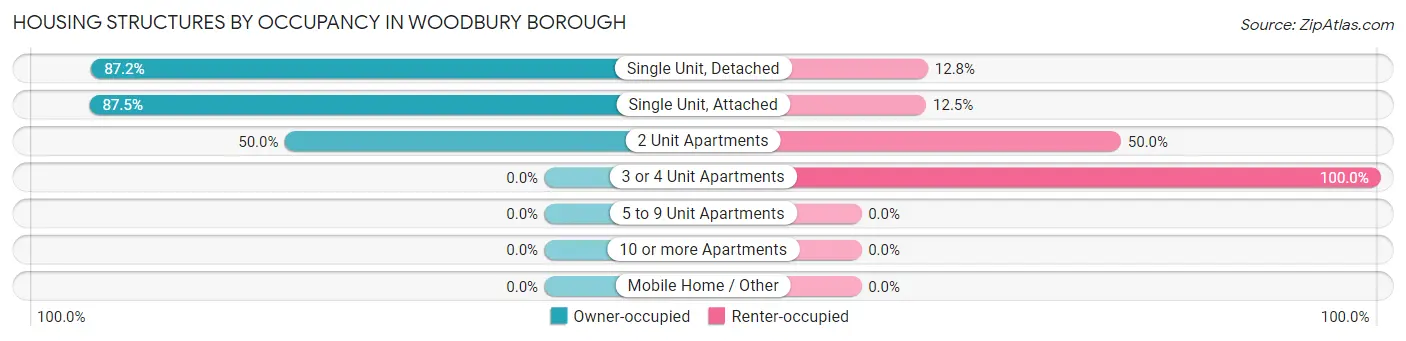
| Structure Type | Owner-occupied | Renter-occupied |
| Single Unit, Detached | 95 (87.2%) | 14 (12.8%) |
| Single Unit, Attached | 7 (87.5%) | 1 (12.5%) |
| 2 Unit Apartments | 2 (50.0%) | 2 (50.0%) |
| 3 or 4 Unit Apartments | 0 (0.0%) | 1 (100.0%) |
| 5 to 9 Unit Apartments | 0 (0.0%) | 0 (0.0%) |
| 10 or more Apartments | 0 (0.0%) | 0 (0.0%) |
| Mobile Home / Other | 0 (0.0%) | 0 (0.0%) |
| Total | 104 (85.3%) | 18 (14.7%) |
Housing Structures by Number of Rooms in Woodbury borough
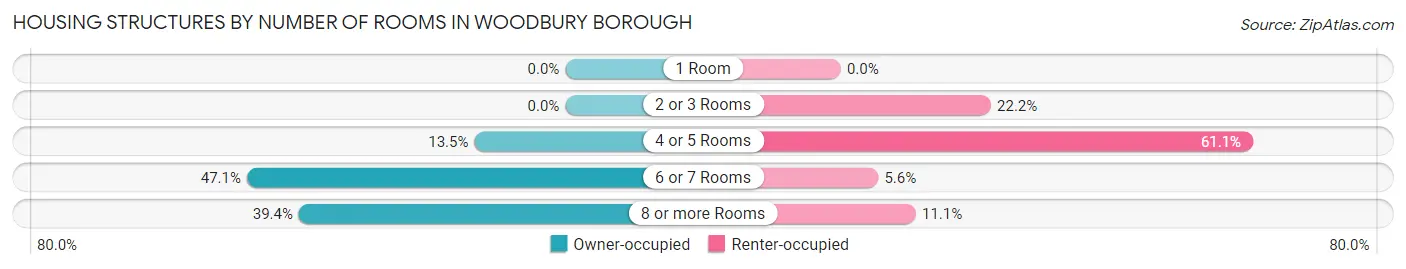
| Number of Rooms | Owner-occupied | Renter-occupied |
| 1 Room | 0 (0.0%) | 0 (0.0%) |
| 2 or 3 Rooms | 0 (0.0%) | 4 (22.2%) |
| 4 or 5 Rooms | 14 (13.5%) | 11 (61.1%) |
| 6 or 7 Rooms | 49 (47.1%) | 1 (5.6%) |
| 8 or more Rooms | 41 (39.4%) | 2 (11.1%) |
| Total | 104 (100.0%) | 18 (100.0%) |
Housing Structure by Heating Type in Woodbury borough
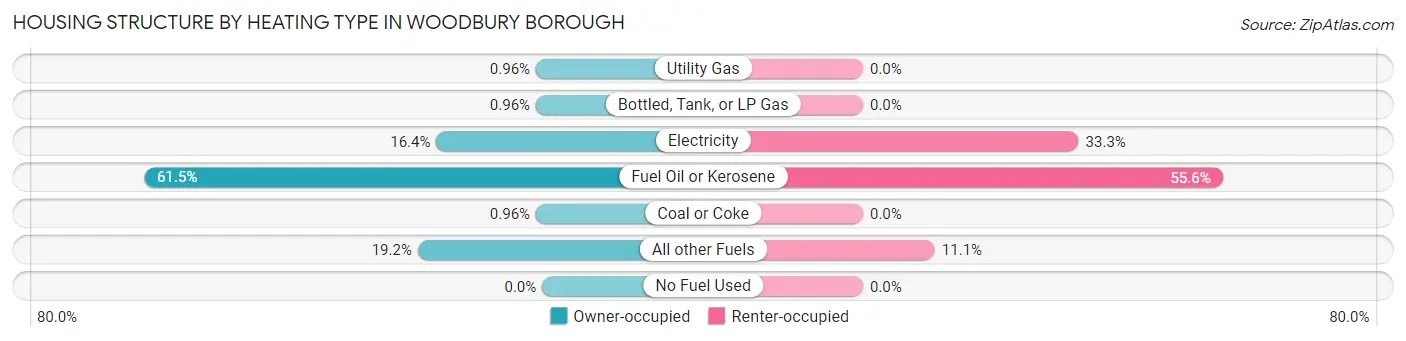
| Heating Type | Owner-occupied | Renter-occupied |
| Utility Gas | 1 (1.0%) | 0 (0.0%) |
| Bottled, Tank, or LP Gas | 1 (1.0%) | 0 (0.0%) |
| Electricity | 17 (16.4%) | 6 (33.3%) |
| Fuel Oil or Kerosene | 64 (61.5%) | 10 (55.6%) |
| Coal or Coke | 1 (1.0%) | 0 (0.0%) |
| All other Fuels | 20 (19.2%) | 2 (11.1%) |
| No Fuel Used | 0 (0.0%) | 0 (0.0%) |
| Total | 104 (100.0%) | 18 (100.0%) |
Household Vehicle Usage in Woodbury borough
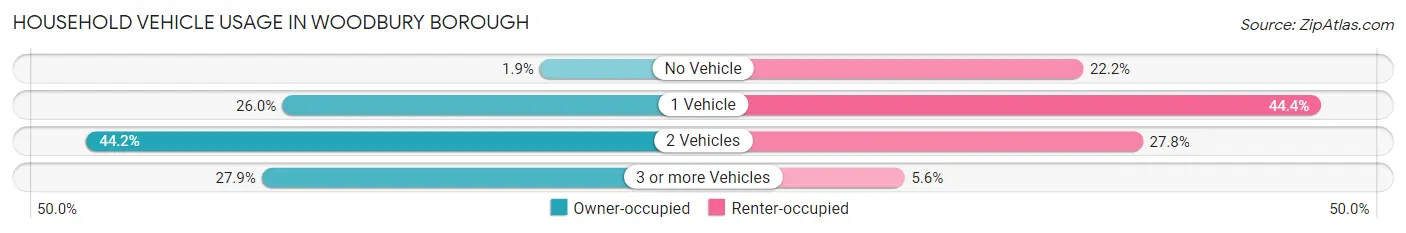
| Vehicles per Household | Owner-occupied | Renter-occupied |
| No Vehicle | 2 (1.9%) | 4 (22.2%) |
| 1 Vehicle | 27 (26.0%) | 8 (44.4%) |
| 2 Vehicles | 46 (44.2%) | 5 (27.8%) |
| 3 or more Vehicles | 29 (27.9%) | 1 (5.6%) |
| Total | 104 (100.0%) | 18 (100.0%) |
Real Estate & Mortgages in Woodbury borough
Real Estate and Mortgage Overview in Woodbury borough
| Characteristic | Without Mortgage | With Mortgage |
| Housing Units | 56 | 48 |
| Median Property Value | $118,100 | $157,500 |
| Median Household Income | $37,917 | $0 |
| Monthly Housing Costs | $624 | $0 |
| Real Estate Taxes | $1,600 | $0 |
Property Value by Mortgage Status in Woodbury borough
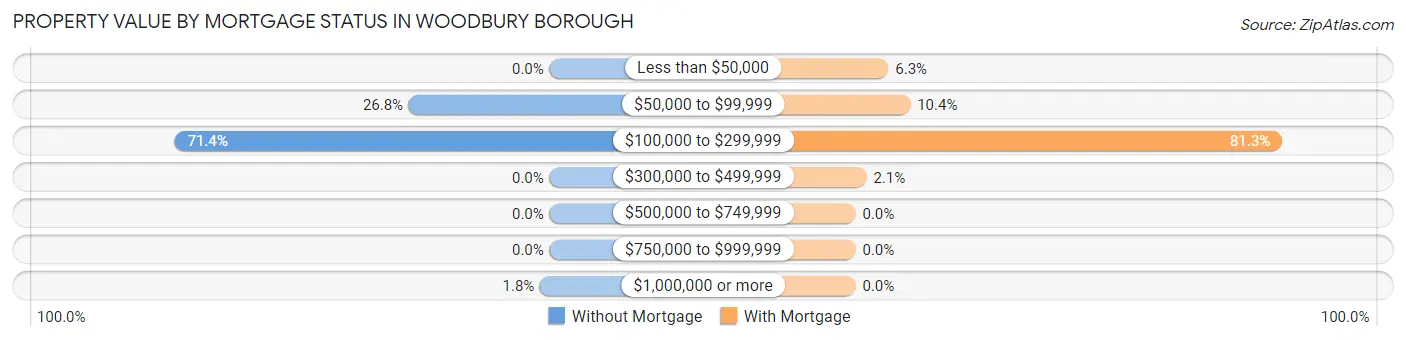
| Property Value | Without Mortgage | With Mortgage |
| Less than $50,000 | 0 (0.0%) | 3 (6.2%) |
| $50,000 to $99,999 | 15 (26.8%) | 5 (10.4%) |
| $100,000 to $299,999 | 40 (71.4%) | 39 (81.2%) |
| $300,000 to $499,999 | 0 (0.0%) | 1 (2.1%) |
| $500,000 to $749,999 | 0 (0.0%) | 0 (0.0%) |
| $750,000 to $999,999 | 0 (0.0%) | 0 (0.0%) |
| $1,000,000 or more | 1 (1.8%) | 0 (0.0%) |
| Total | 56 (100.0%) | 48 (100.0%) |
Household Income by Mortgage Status in Woodbury borough
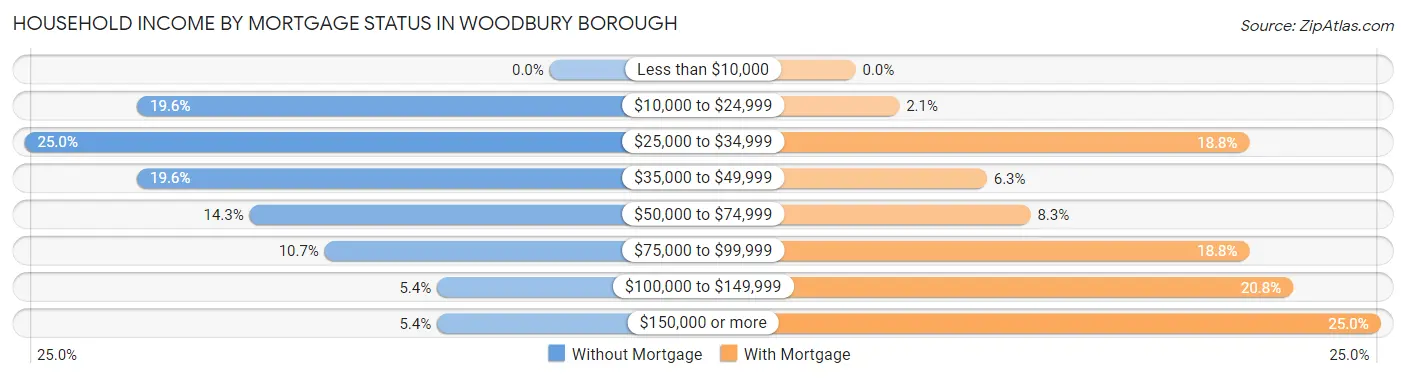
| Household Income | Without Mortgage | With Mortgage |
| Less than $10,000 | 0 (0.0%) | 0 (0.0%) |
| $10,000 to $24,999 | 11 (19.6%) | 1 (2.1%) |
| $25,000 to $34,999 | 14 (25.0%) | 9 (18.8%) |
| $35,000 to $49,999 | 11 (19.6%) | 3 (6.2%) |
| $50,000 to $74,999 | 8 (14.3%) | 4 (8.3%) |
| $75,000 to $99,999 | 6 (10.7%) | 9 (18.8%) |
| $100,000 to $149,999 | 3 (5.4%) | 10 (20.8%) |
| $150,000 or more | 3 (5.4%) | 12 (25.0%) |
| Total | 56 (100.0%) | 48 (100.0%) |
Property Value to Household Income Ratio in Woodbury borough
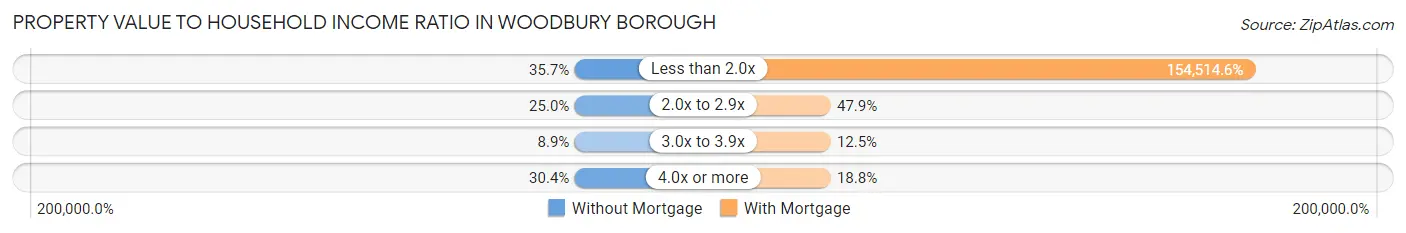
| Value-to-Income Ratio | Without Mortgage | With Mortgage |
| Less than 2.0x | 20 (35.7%) | 74,167 (154,514.6%) |
| 2.0x to 2.9x | 14 (25.0%) | 23 (47.9%) |
| 3.0x to 3.9x | 5 (8.9%) | 6 (12.5%) |
| 4.0x or more | 17 (30.4%) | 9 (18.8%) |
| Total | 56 (100.0%) | 48 (100.0%) |
Real Estate Taxes by Mortgage Status in Woodbury borough
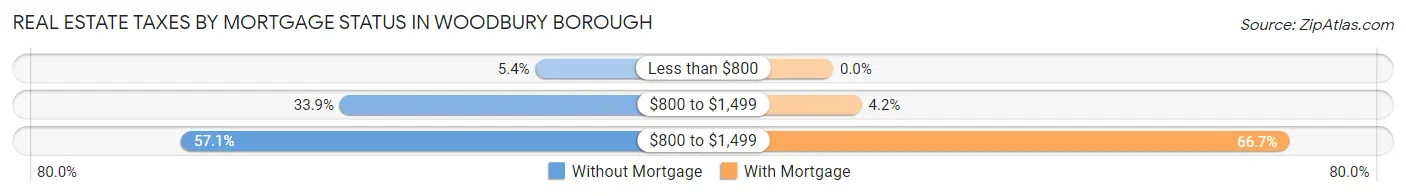
| Property Taxes | Without Mortgage | With Mortgage |
| Less than $800 | 3 (5.4%) | 0 (0.0%) |
| $800 to $1,499 | 19 (33.9%) | 2 (4.2%) |
| $800 to $1,499 | 32 (57.1%) | 32 (66.7%) |
| Total | 56 (100.0%) | 48 (100.0%) |
Health & Disability in Woodbury borough
Health Insurance Coverage by Age in Woodbury borough
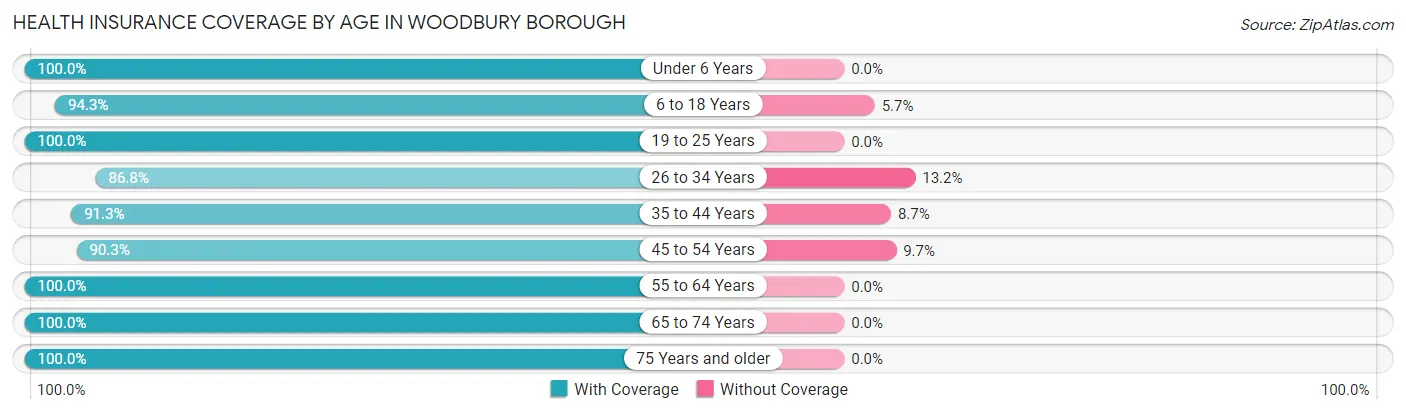
| Age Bracket | With Coverage | Without Coverage |
| Under 6 Years | 62 (100.0%) | 0 (0.0%) |
| 6 to 18 Years | 83 (94.3%) | 5 (5.7%) |
| 19 to 25 Years | 27 (100.0%) | 0 (0.0%) |
| 26 to 34 Years | 59 (86.8%) | 9 (13.2%) |
| 35 to 44 Years | 21 (91.3%) | 2 (8.7%) |
| 45 to 54 Years | 28 (90.3%) | 3 (9.7%) |
| 55 to 64 Years | 38 (100.0%) | 0 (0.0%) |
| 65 to 74 Years | 35 (100.0%) | 0 (0.0%) |
| 75 Years and older | 19 (100.0%) | 0 (0.0%) |
| Total | 372 (95.1%) | 19 (4.9%) |
Health Insurance Coverage by Citizenship Status in Woodbury borough
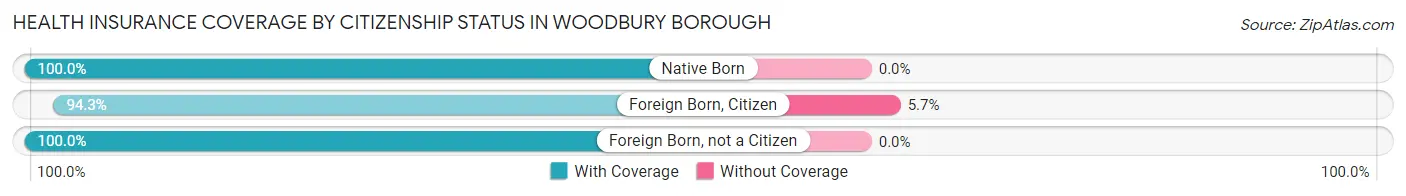
| Citizenship Status | With Coverage | Without Coverage |
| Native Born | 62 (100.0%) | 0 (0.0%) |
| Foreign Born, Citizen | 83 (94.3%) | 5 (5.7%) |
| Foreign Born, not a Citizen | 27 (100.0%) | 0 (0.0%) |
Health Insurance Coverage by Household Income in Woodbury borough
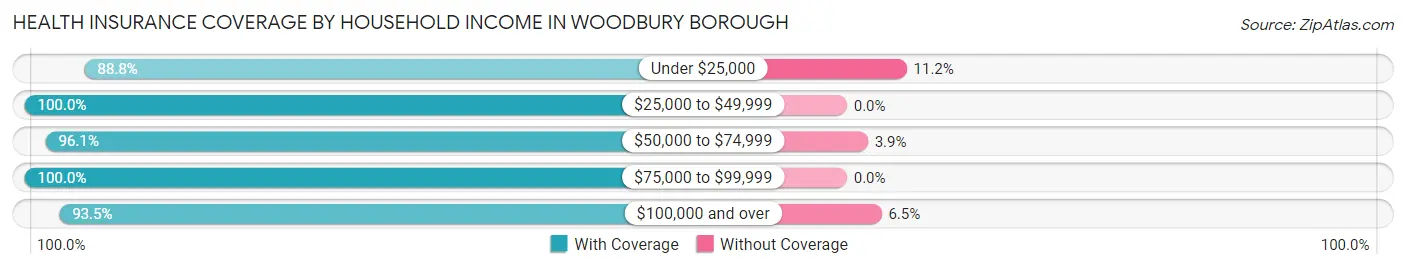
| Household Income | With Coverage | Without Coverage |
| Under $25,000 | 95 (88.8%) | 12 (11.2%) |
| $25,000 to $49,999 | 109 (100.0%) | 0 (0.0%) |
| $50,000 to $74,999 | 49 (96.1%) | 2 (3.9%) |
| $75,000 to $99,999 | 47 (100.0%) | 0 (0.0%) |
| $100,000 and over | 72 (93.5%) | 5 (6.5%) |
Public vs Private Health Insurance Coverage by Age in Woodbury borough
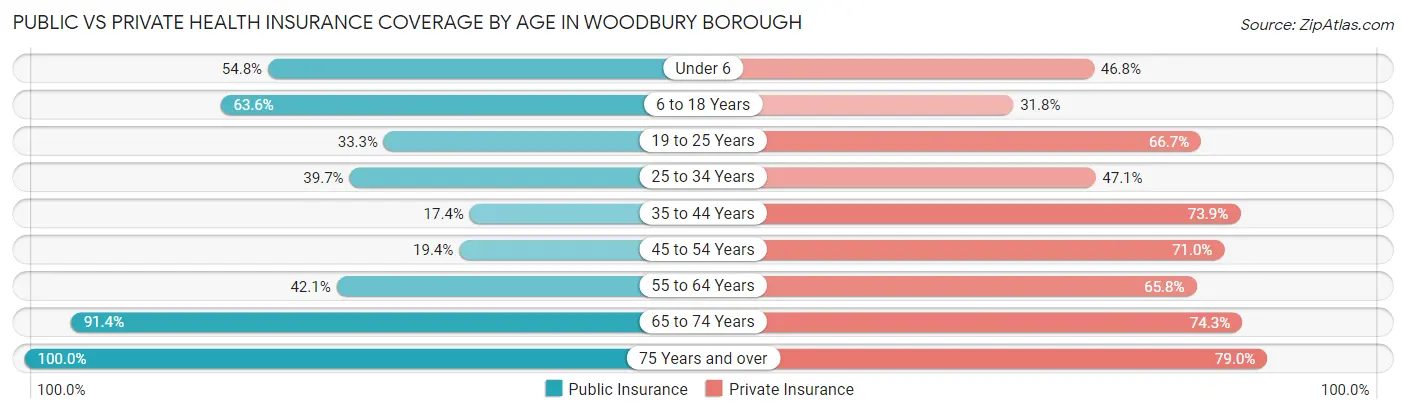
| Age Bracket | Public Insurance | Private Insurance |
| Under 6 | 34 (54.8%) | 29 (46.8%) |
| 6 to 18 Years | 56 (63.6%) | 28 (31.8%) |
| 19 to 25 Years | 9 (33.3%) | 18 (66.7%) |
| 25 to 34 Years | 27 (39.7%) | 32 (47.1%) |
| 35 to 44 Years | 4 (17.4%) | 17 (73.9%) |
| 45 to 54 Years | 6 (19.4%) | 22 (71.0%) |
| 55 to 64 Years | 16 (42.1%) | 25 (65.8%) |
| 65 to 74 Years | 32 (91.4%) | 26 (74.3%) |
| 75 Years and over | 19 (100.0%) | 15 (78.9%) |
| Total | 203 (51.9%) | 212 (54.2%) |
Disability Status by Sex by Age in Woodbury borough
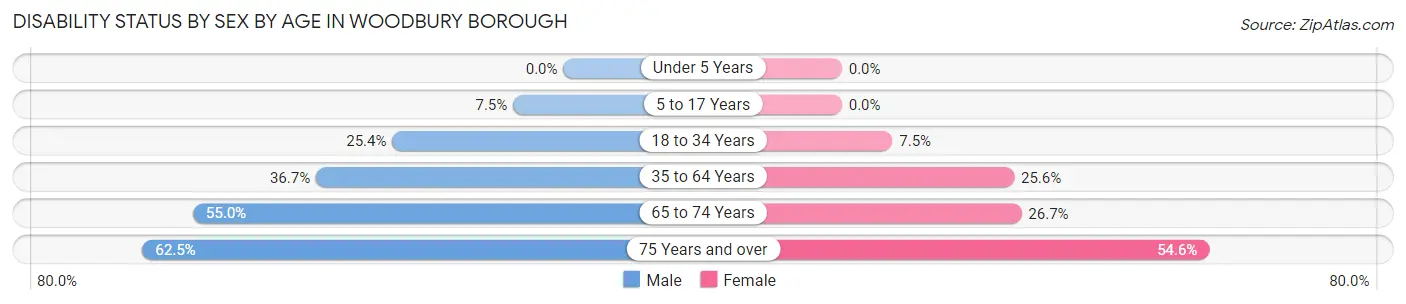
| Age Bracket | Male | Female |
| Under 5 Years | 0 (0.0%) | 0 (0.0%) |
| 5 to 17 Years | 5 (7.5%) | 0 (0.0%) |
| 18 to 34 Years | 16 (25.4%) | 3 (7.5%) |
| 35 to 64 Years | 18 (36.7%) | 11 (25.6%) |
| 65 to 74 Years | 11 (55.0%) | 4 (26.7%) |
| 75 Years and over | 5 (62.5%) | 6 (54.5%) |
Disability Class by Sex by Age in Woodbury borough
Disability Class: Hearing Difficulty
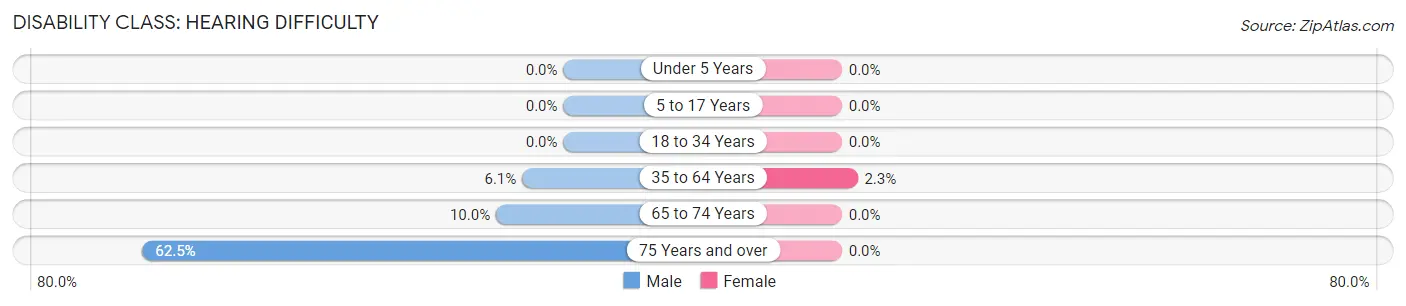
| Age Bracket | Male | Female |
| Under 5 Years | 0 (0.0%) | 0 (0.0%) |
| 5 to 17 Years | 0 (0.0%) | 0 (0.0%) |
| 18 to 34 Years | 0 (0.0%) | 0 (0.0%) |
| 35 to 64 Years | 3 (6.1%) | 1 (2.3%) |
| 65 to 74 Years | 2 (10.0%) | 0 (0.0%) |
| 75 Years and over | 5 (62.5%) | 0 (0.0%) |
Disability Class: Vision Difficulty
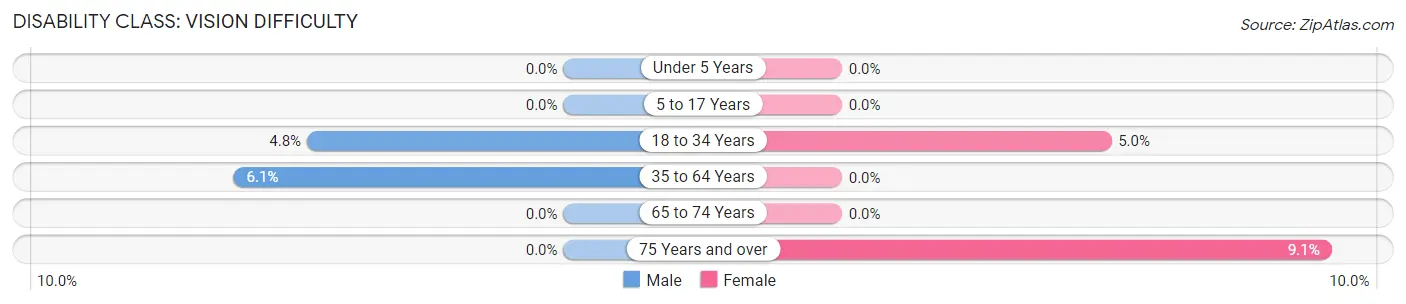
| Age Bracket | Male | Female |
| Under 5 Years | 0 (0.0%) | 0 (0.0%) |
| 5 to 17 Years | 0 (0.0%) | 0 (0.0%) |
| 18 to 34 Years | 3 (4.8%) | 2 (5.0%) |
| 35 to 64 Years | 3 (6.1%) | 0 (0.0%) |
| 65 to 74 Years | 0 (0.0%) | 0 (0.0%) |
| 75 Years and over | 0 (0.0%) | 1 (9.1%) |
Disability Class: Cognitive Difficulty
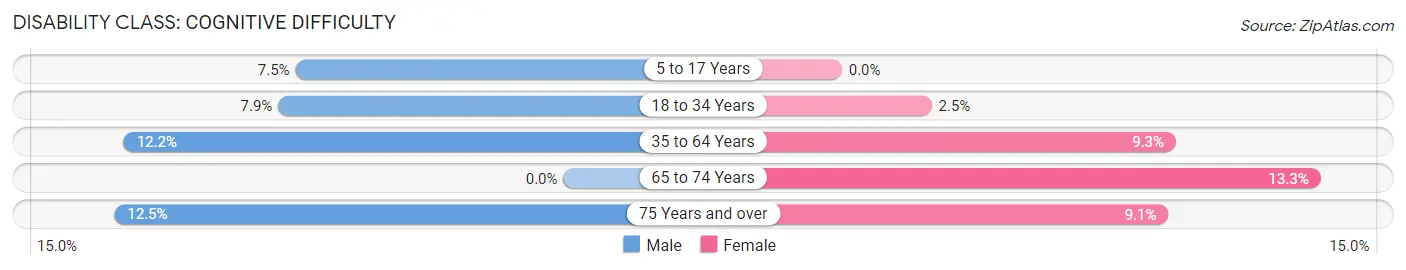
| Age Bracket | Male | Female |
| 5 to 17 Years | 5 (7.5%) | 0 (0.0%) |
| 18 to 34 Years | 5 (7.9%) | 1 (2.5%) |
| 35 to 64 Years | 6 (12.2%) | 4 (9.3%) |
| 65 to 74 Years | 0 (0.0%) | 2 (13.3%) |
| 75 Years and over | 1 (12.5%) | 1 (9.1%) |
Disability Class: Ambulatory Difficulty
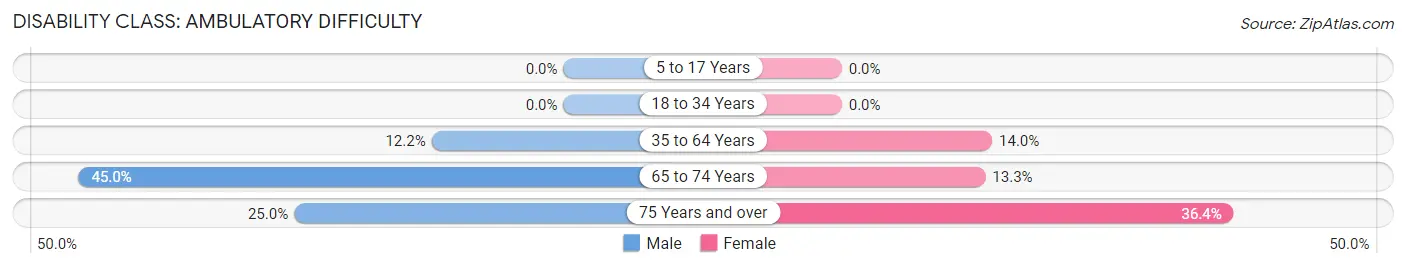
| Age Bracket | Male | Female |
| 5 to 17 Years | 0 (0.0%) | 0 (0.0%) |
| 18 to 34 Years | 0 (0.0%) | 0 (0.0%) |
| 35 to 64 Years | 6 (12.2%) | 6 (14.0%) |
| 65 to 74 Years | 9 (45.0%) | 2 (13.3%) |
| 75 Years and over | 2 (25.0%) | 4 (36.4%) |
Disability Class: Self-Care Difficulty
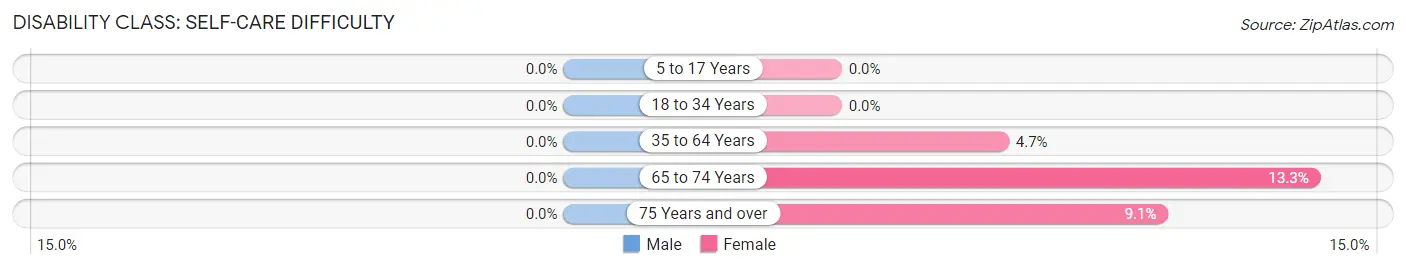
| Age Bracket | Male | Female |
| 5 to 17 Years | 0 (0.0%) | 0 (0.0%) |
| 18 to 34 Years | 0 (0.0%) | 0 (0.0%) |
| 35 to 64 Years | 0 (0.0%) | 2 (4.6%) |
| 65 to 74 Years | 0 (0.0%) | 2 (13.3%) |
| 75 Years and over | 0 (0.0%) | 1 (9.1%) |
Technology Access in Woodbury borough
Computing Device Access in Woodbury borough
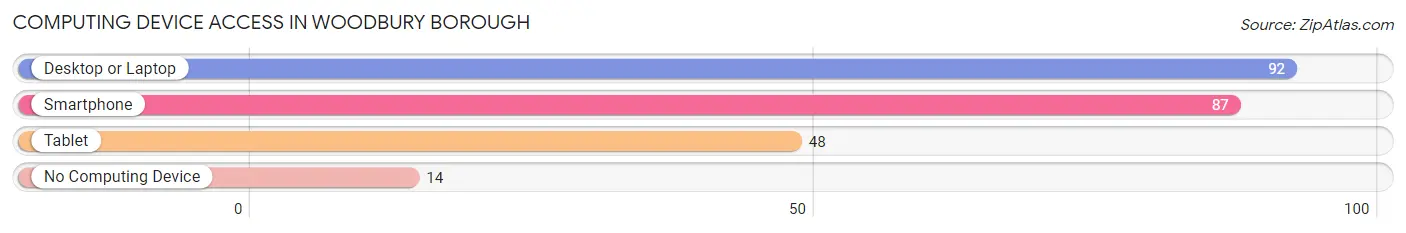
| Device Type | # Households | % Households |
| Desktop or Laptop | 92 | 75.4% |
| Smartphone | 87 | 71.3% |
| Tablet | 48 | 39.3% |
| No Computing Device | 14 | 11.5% |
| Total | 122 | 100.0% |
Internet Access in Woodbury borough
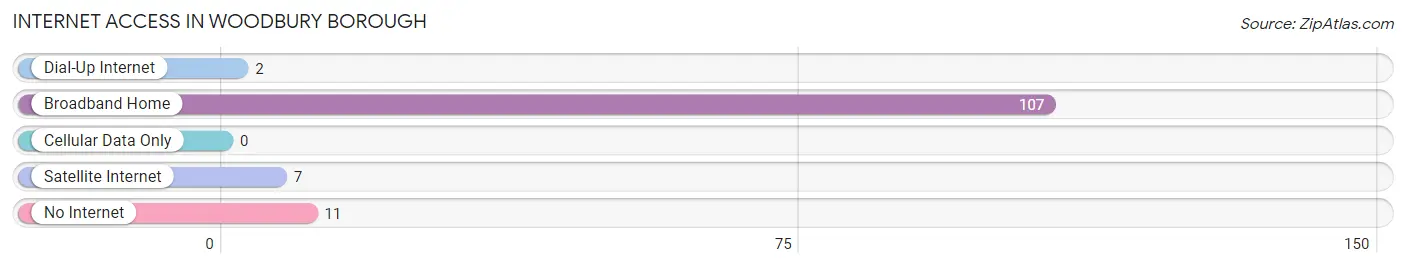
| Internet Type | # Households | % Households |
| Dial-Up Internet | 2 | 1.6% |
| Broadband Home | 107 | 87.7% |
| Cellular Data Only | 0 | 0.0% |
| Satellite Internet | 7 | 5.7% |
| No Internet | 11 | 9.0% |
| Total | 122 | 100.0% |
Woodbury borough Summary
Woodbury Borough is a small borough located in Bedford County, Pennsylvania. It is situated in the foothills of the Allegheny Mountains and is part of the Altoona Metropolitan Statistical Area. The borough has a population of approximately 1,400 people and covers an area of 0.6 square miles.
History
Woodbury Borough was founded in 1845 by a group of settlers from the nearby town of Bedford. The settlers were looking for a place to build a new community and chose the area due to its proximity to the Allegheny Mountains. The town was named after the nearby Woodbury Creek, which was named after a local Native American chief.
The first settlers in Woodbury were mostly farmers and the town quickly grew to become a thriving agricultural community. The town was also known for its coal mining industry, which provided jobs for many of the residents.
In the late 19th century, the town began to experience a period of growth and development. The town was incorporated in 1891 and the first mayor was elected in 1892. The town continued to grow and by the early 20th century, it had become a popular tourist destination.
Geography
Woodbury Borough is located in Bedford County, Pennsylvania. It is situated in the foothills of the Allegheny Mountains and is part of the Altoona Metropolitan Statistical Area. The borough has a total area of 0.6 square miles and is bordered by the towns of Bedford, Everett, and Hopewell.
The borough is located at an elevation of 1,400 feet and is situated on the banks of the Woodbury Creek. The creek is a tributary of the Juniata River and is a popular spot for fishing and other recreational activities.
The climate in Woodbury is classified as humid continental, with hot summers and cold winters. The average annual temperature is around 50 degrees Fahrenheit and the average annual precipitation is around 40 inches.
Economy
The economy of Woodbury Borough is largely based on agriculture and tourism. The town is home to several farms, which produce a variety of crops, including corn, soybeans, and hay. The town is also home to several wineries, which produce a variety of wines.
Tourism is also an important part of the local economy. The town is home to several historic sites, including the Woodbury Historic District, which is listed on the National Register of Historic Places. The town is also home to several parks and recreational areas, which attract visitors from all over the region.
Demographics
As of the 2010 census, the population of Woodbury Borough was 1,400 people. The racial makeup of the borough was 97.3% White, 0.7% African American, 0.3% Native American, 0.3% Asian, and 1.3% from other races. The median household income was $41,250 and the median family income was $50,000.
The population of Woodbury Borough is largely made up of families. The town has a median age of 41.7 years and the majority of the population is married. The town also has a large number of retirees, with nearly 20% of the population over the age of 65.
Conclusion
Woodbury Borough is a small borough located in Bedford County, Pennsylvania. It is situated in the foothills of the Allegheny Mountains and is part of the Altoona Metropolitan Statistical Area. The borough has a population of approximately 1,400 people and covers an area of 0.6 square miles. The economy of Woodbury Borough is largely based on agriculture and tourism. The town is home to several farms, wineries, and historic sites, which attract visitors from all over the region. The population of Woodbury Borough is largely made up of families and the town has a median age of 41.7 years.
Common Questions
What is Per Capita Income in Woodbury borough?
Per Capita income in Woodbury borough is $17,803.
What is the Median Family Income in Woodbury borough?
Median Family Income in Woodbury borough is $62,500.
What is the Median Household income in Woodbury borough?
Median Household Income in Woodbury borough is $39,375.
What is Income or Wage Gap in Woodbury borough?
Income or Wage Gap in Woodbury borough is 32.8%.
Women in Woodbury borough earn 67.2 cents for every dollar earned by a man.
What is Inequality or Gini Index in Woodbury borough?
Inequality or Gini Index in Woodbury borough is 0.38.
What is the Total Population of Woodbury borough?
Total Population of Woodbury borough is 391.
What is the Total Male Population of Woodbury borough?
Total Male Population of Woodbury borough is 216.
What is the Total Female Population of Woodbury borough?
Total Female Population of Woodbury borough is 175.
What is the Ratio of Males per 100 Females in Woodbury borough?
There are 123.43 Males per 100 Females in Woodbury borough.
What is the Ratio of Females per 100 Males in Woodbury borough?
There are 81.02 Females per 100 Males in Woodbury borough.
What is the Median Population Age in Woodbury borough?
Median Population Age in Woodbury borough is 29.8 Years.
What is the Average Family Size in Woodbury borough
Average Family Size in Woodbury borough is 3.8 People.
What is the Average Household Size in Woodbury borough
Average Household Size in Woodbury borough is 3.2 People.
How Large is the Labor Force in Woodbury borough?
There are 170 People in the Labor Forcein in Woodbury borough.
What is the Percentage of People in the Labor Force in Woodbury borough?
66.9% of People are in the Labor Force in Woodbury borough.
What is the Unemployment Rate in Woodbury borough?
Unemployment Rate in Woodbury borough is 10.6%.