Winterstown borough, PA Map & Demographics
Winterstown borough Overview
$34,207
PER CAPITA INCOME
$73,750
AVG FAMILY INCOME
$59,167
AVG HOUSEHOLD INCOME
43.7%
WAGE / INCOME GAP [ % ]
56.3¢/ $1
WAGE / INCOME GAP [ $ ]
0.43
INEQUALITY / GINI INDEX
505
TOTAL POPULATION
227
MALE POPULATION
278
FEMALE POPULATION
81.65
MALES / 100 FEMALES
122.47
FEMALES / 100 MALES
48.8
MEDIAN AGE
2.8
AVG FAMILY SIZE
2.4
AVG HOUSEHOLD SIZE
269
LABOR FORCE [ PEOPLE ]
65.0%
PERCENT IN LABOR FORCE
5.6%
UNEMPLOYMENT RATE
Income in Winterstown borough
Income Overview in Winterstown borough
Per Capita Income in Winterstown borough is $34,207, while median incomes of families and households are $73,750 and $59,167 respectively.
| Characteristic | Number | Measure |
| Per Capita Income | 505 | $34,207 |
| Median Family Income | 142 | $73,750 |
| Mean Family Income | 142 | $84,461 |
| Median Household Income | 214 | $59,167 |
| Mean Household Income | 214 | $79,583 |
| Income Deficit | 142 | $0 |
| Wage / Income Gap (%) | 505 | 43.71% |
| Wage / Income Gap ($) | 505 | 56.29¢ per $1 |
| Gini / Inequality Index | 505 | 0.43 |
Earnings by Sex in Winterstown borough
Average Earnings in Winterstown borough are $37,000, $47,656 for men and $26,827 for women, a difference of 43.7%.
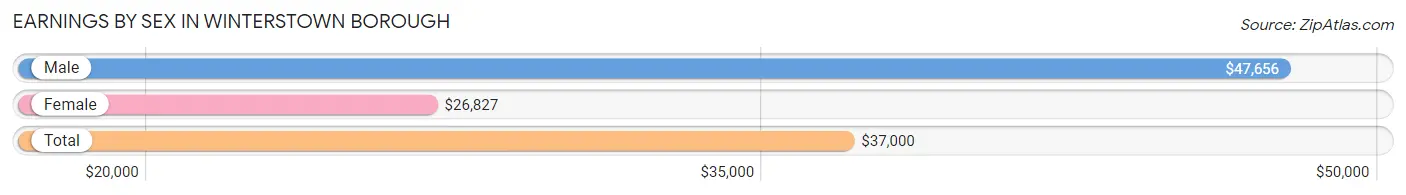
| Sex | Number | Average Earnings |
| Male | 143 (51.4%) | $47,656 |
| Female | 135 (48.6%) | $26,827 |
| Total | 278 (100.0%) | $37,000 |
Earnings by Sex by Income Bracket in Winterstown borough
The most common earnings brackets in Winterstown borough are $22,500 to $24,999 for men (19 | 13.3%) and $40,000 to $44,999 for women (16 | 11.8%).
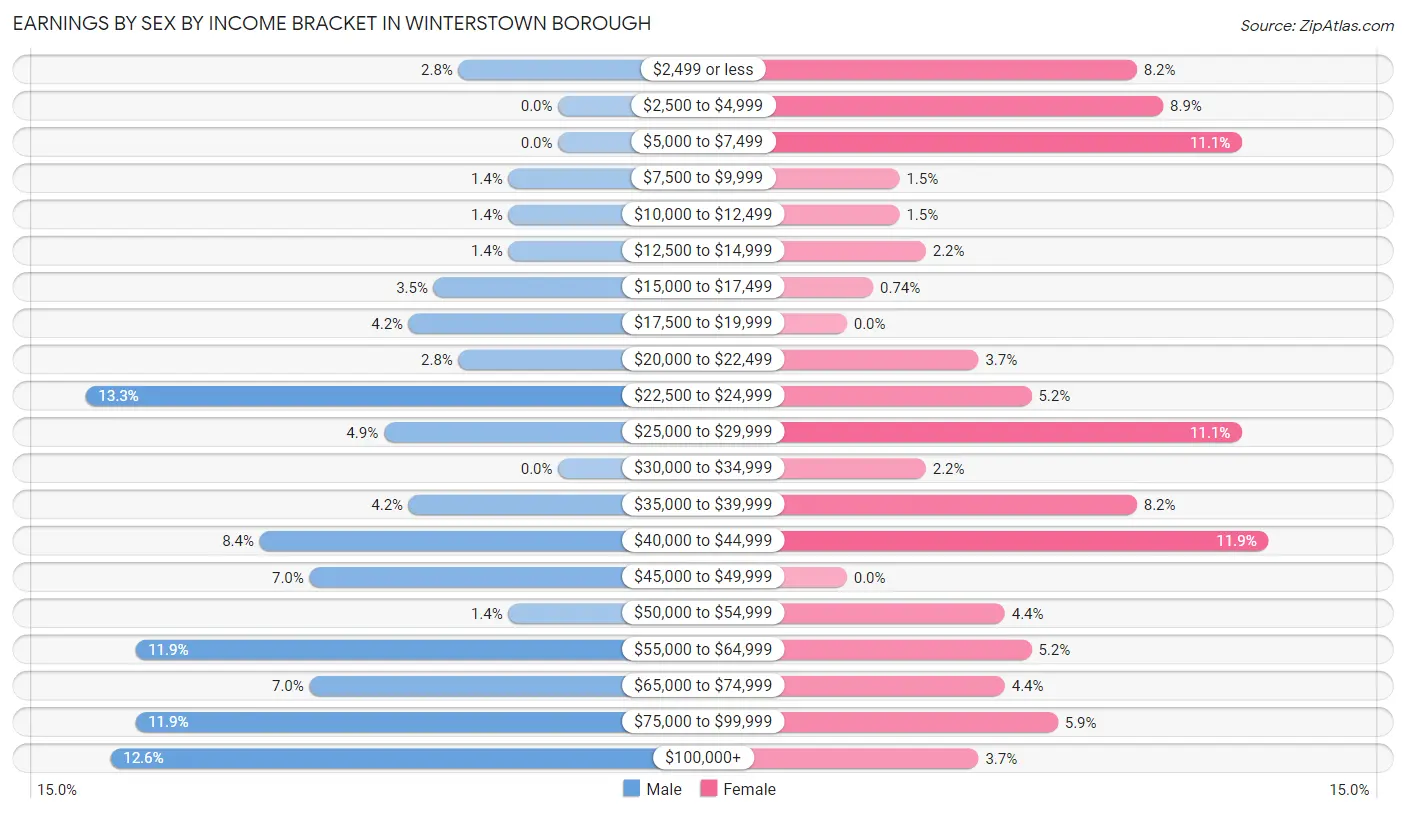
| Income | Male | Female |
| $2,499 or less | 4 (2.8%) | 11 (8.2%) |
| $2,500 to $4,999 | 0 (0.0%) | 12 (8.9%) |
| $5,000 to $7,499 | 0 (0.0%) | 15 (11.1%) |
| $7,500 to $9,999 | 2 (1.4%) | 2 (1.5%) |
| $10,000 to $12,499 | 2 (1.4%) | 2 (1.5%) |
| $12,500 to $14,999 | 2 (1.4%) | 3 (2.2%) |
| $15,000 to $17,499 | 5 (3.5%) | 1 (0.7%) |
| $17,500 to $19,999 | 6 (4.2%) | 0 (0.0%) |
| $20,000 to $22,499 | 4 (2.8%) | 5 (3.7%) |
| $22,500 to $24,999 | 19 (13.3%) | 7 (5.2%) |
| $25,000 to $29,999 | 7 (4.9%) | 15 (11.1%) |
| $30,000 to $34,999 | 0 (0.0%) | 3 (2.2%) |
| $35,000 to $39,999 | 6 (4.2%) | 11 (8.2%) |
| $40,000 to $44,999 | 12 (8.4%) | 16 (11.8%) |
| $45,000 to $49,999 | 10 (7.0%) | 0 (0.0%) |
| $50,000 to $54,999 | 2 (1.4%) | 6 (4.4%) |
| $55,000 to $64,999 | 17 (11.9%) | 7 (5.2%) |
| $65,000 to $74,999 | 10 (7.0%) | 6 (4.4%) |
| $75,000 to $99,999 | 17 (11.9%) | 8 (5.9%) |
| $100,000+ | 18 (12.6%) | 5 (3.7%) |
| Total | 143 (100.0%) | 135 (100.0%) |
Earnings by Sex by Educational Attainment in Winterstown borough
Average earnings in Winterstown borough are $49,844 for men and $33,750 for women, a difference of 32.3%. Men with an educational attainment of college or associate's degree enjoy the highest average annual earnings of $56,154, while those with high school diploma education earn the least with $43,333. Women with an educational attainment of graduate degree earn the most with the average annual earnings of $95,250, while those with high school diploma education have the smallest earnings of $22,000.
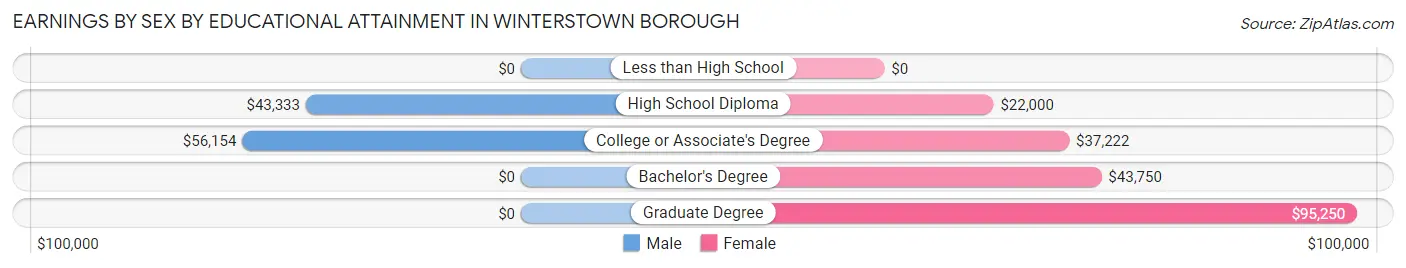
| Educational Attainment | Male Income | Female Income |
| Less than High School | - | - |
| High School Diploma | $43,333 | $22,000 |
| College or Associate's Degree | $56,154 | $37,222 |
| Bachelor's Degree | - | - |
| Graduate Degree | - | - |
| Total | $49,844 | $33,750 |
Family Income in Winterstown borough
Family Income Brackets in Winterstown borough
According to the Winterstown borough family income data, there are 32 families falling into the $100,000 to $149,999 income range, which is the most common income bracket and makes up 22.5% of all families.
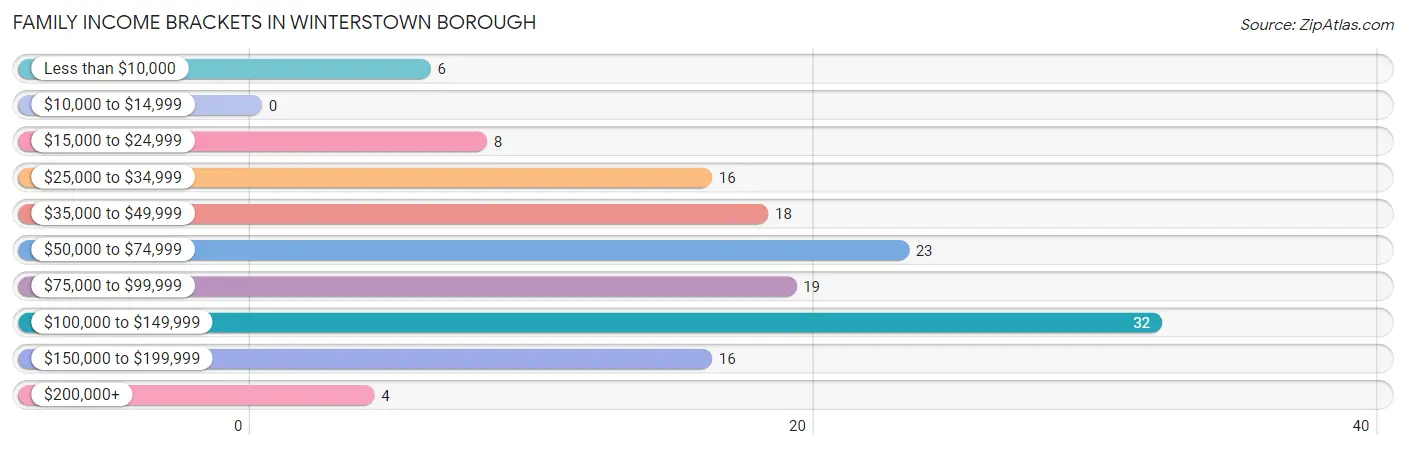
| Income Bracket | # Families | % Families |
| Less than $10,000 | 6 | 4.2% |
| $10,000 to $14,999 | 0 | 0.0% |
| $15,000 to $24,999 | 8 | 5.6% |
| $25,000 to $34,999 | 16 | 11.3% |
| $35,000 to $49,999 | 18 | 12.7% |
| $50,000 to $74,999 | 23 | 16.2% |
| $75,000 to $99,999 | 19 | 13.4% |
| $100,000 to $149,999 | 32 | 22.5% |
| $150,000 to $199,999 | 16 | 11.3% |
| $200,000+ | 4 | 2.8% |
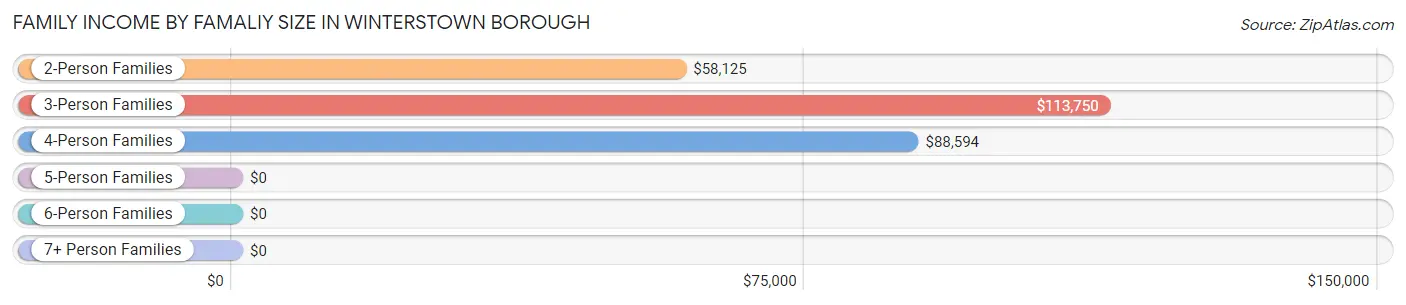
Family Income by Famaliy Size in Winterstown borough
3-person families (30 | 21.1%) account for the highest median family income in Winterstown borough with $113,750 per family, while 3-person families (30 | 21.1%) have the highest median income of $37,917 per family member.
| Income Bracket | # Families | Median Income |
| 2-Person Families | 79 (55.6%) | $58,125 |
| 3-Person Families | 30 (21.1%) | $113,750 |
| 4-Person Families | 25 (17.6%) | $88,594 |
| 5-Person Families | 5 (3.5%) | $0 |
| 6-Person Families | 3 (2.1%) | $0 |
| 7+ Person Families | 0 (0.0%) | $0 |
| Total | 142 (100.0%) | $73,750 |
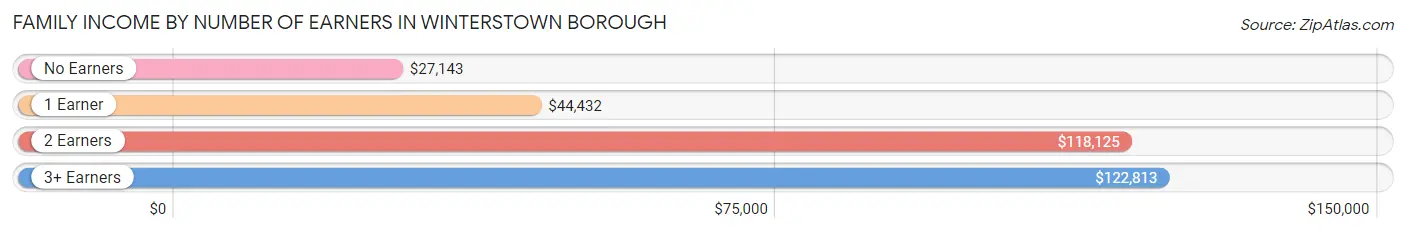
Family Income by Number of Earners in Winterstown borough
The median family income in Winterstown borough is $73,750, with families comprising 3+ earners (18) having the highest median family income of $122,813, while families with no earners (38) have the lowest median family income of $27,143, accounting for 12.7% and 26.8% of families, respectively.
| Number of Earners | # Families | Median Income |
| No Earners | 38 (26.8%) | $27,143 |
| 1 Earner | 31 (21.8%) | $44,432 |
| 2 Earners | 55 (38.7%) | $118,125 |
| 3+ Earners | 18 (12.7%) | $122,813 |
| Total | 142 (100.0%) | $73,750 |
Household Income in Winterstown borough
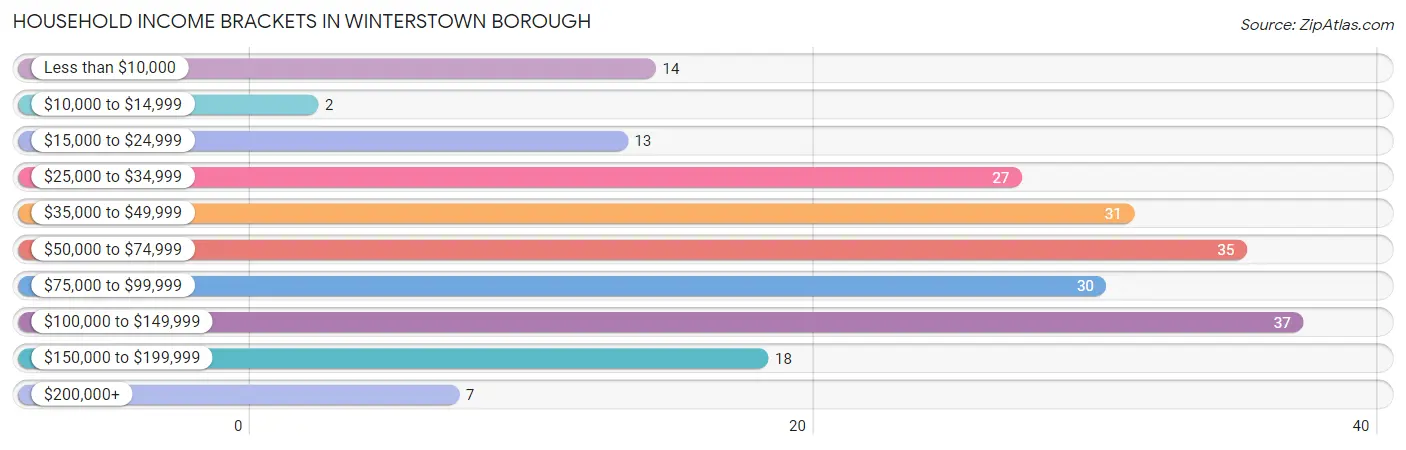
Household Income Brackets in Winterstown borough
With 37 households falling in the category, the $100,000 to $149,999 income range is the most frequent in Winterstown borough, accounting for 17.3% of all households. In contrast, only 2 households (0.9%) fall into the $10,000 to $14,999 income bracket, making it the least populous group.
| Income Bracket | # Households | % Households |
| Less than $10,000 | 14 | 6.5% |
| $10,000 to $14,999 | 2 | 0.9% |
| $15,000 to $24,999 | 13 | 6.1% |
| $25,000 to $34,999 | 27 | 12.6% |
| $35,000 to $49,999 | 31 | 14.5% |
| $50,000 to $74,999 | 35 | 16.4% |
| $75,000 to $99,999 | 30 | 14.0% |
| $100,000 to $149,999 | 37 | 17.3% |
| $150,000 to $199,999 | 18 | 8.4% |
| $200,000+ | 7 | 3.3% |
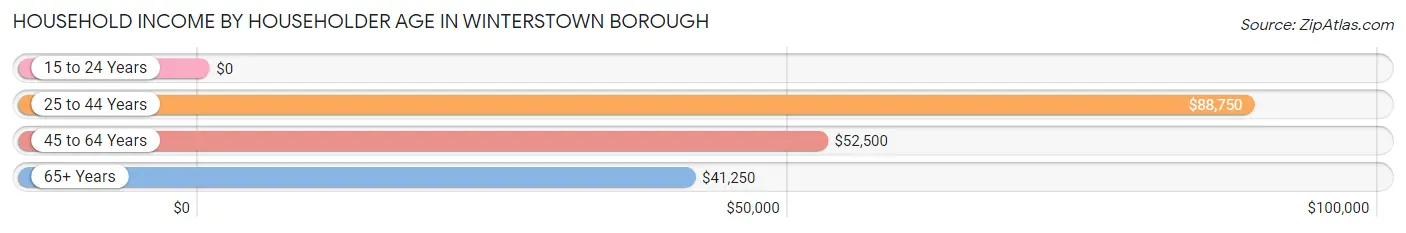
Household Income by Householder Age in Winterstown borough
The median household income in Winterstown borough is $59,167, with the highest median household income of $88,750 found in the 25 to 44 years age bracket for the primary householder. A total of 46 households (21.5%) fall into this category. Meanwhile, the 15 to 24 years age bracket for the primary householder has the lowest median household income of $0, with 2 households (0.9%) in this group.
| Income Bracket | # Households | Median Income |
| 15 to 24 Years | 2 (0.9%) | $0 |
| 25 to 44 Years | 46 (21.5%) | $88,750 |
| 45 to 64 Years | 102 (47.7%) | $52,500 |
| 65+ Years | 64 (29.9%) | $41,250 |
| Total | 214 (100.0%) | $59,167 |
Poverty in Winterstown borough
Income Below Poverty by Sex and Age in Winterstown borough
With 7.9% poverty level for males and 9.3% for females among the residents of Winterstown borough, 65 to 74 year old males and 45 to 54 year old females are the most vulnerable to poverty, with 6 males (24.0%) and 12 females (41.4%) in their respective age groups living below the poverty level.
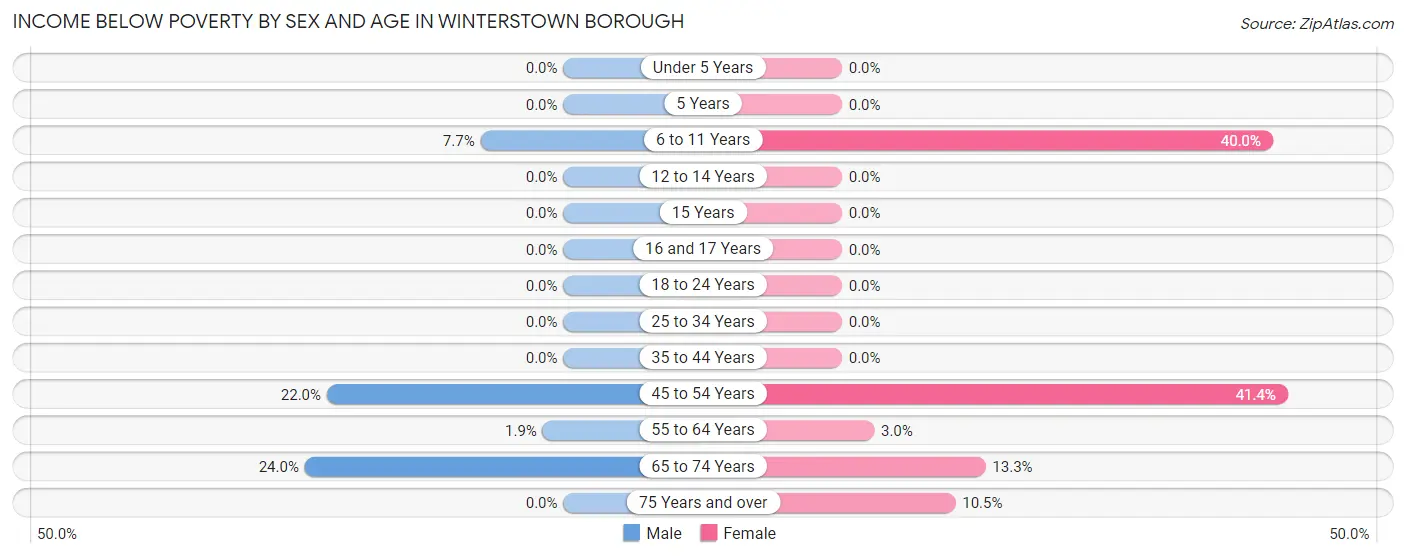
| Age Bracket | Male | Female |
| Under 5 Years | 0 (0.0%) | 0 (0.0%) |
| 5 Years | 0 (0.0%) | 0 (0.0%) |
| 6 to 11 Years | 2 (7.7%) | 6 (40.0%) |
| 12 to 14 Years | 0 (0.0%) | 0 (0.0%) |
| 15 Years | 0 (0.0%) | 0 (0.0%) |
| 16 and 17 Years | 0 (0.0%) | 0 (0.0%) |
| 18 to 24 Years | 0 (0.0%) | 0 (0.0%) |
| 25 to 34 Years | 0 (0.0%) | 0 (0.0%) |
| 35 to 44 Years | 0 (0.0%) | 0 (0.0%) |
| 45 to 54 Years | 9 (22.0%) | 12 (41.4%) |
| 55 to 64 Years | 1 (1.9%) | 2 (3.0%) |
| 65 to 74 Years | 6 (24.0%) | 4 (13.3%) |
| 75 Years and over | 0 (0.0%) | 2 (10.5%) |
| Total | 18 (7.9%) | 26 (9.3%) |
Income Above Poverty by Sex and Age in Winterstown borough
According to the poverty statistics in Winterstown borough, males aged 15 years and females aged under 5 years are the age groups that are most secure financially, with 100.0% of males and 100.0% of females in these age groups living above the poverty line.
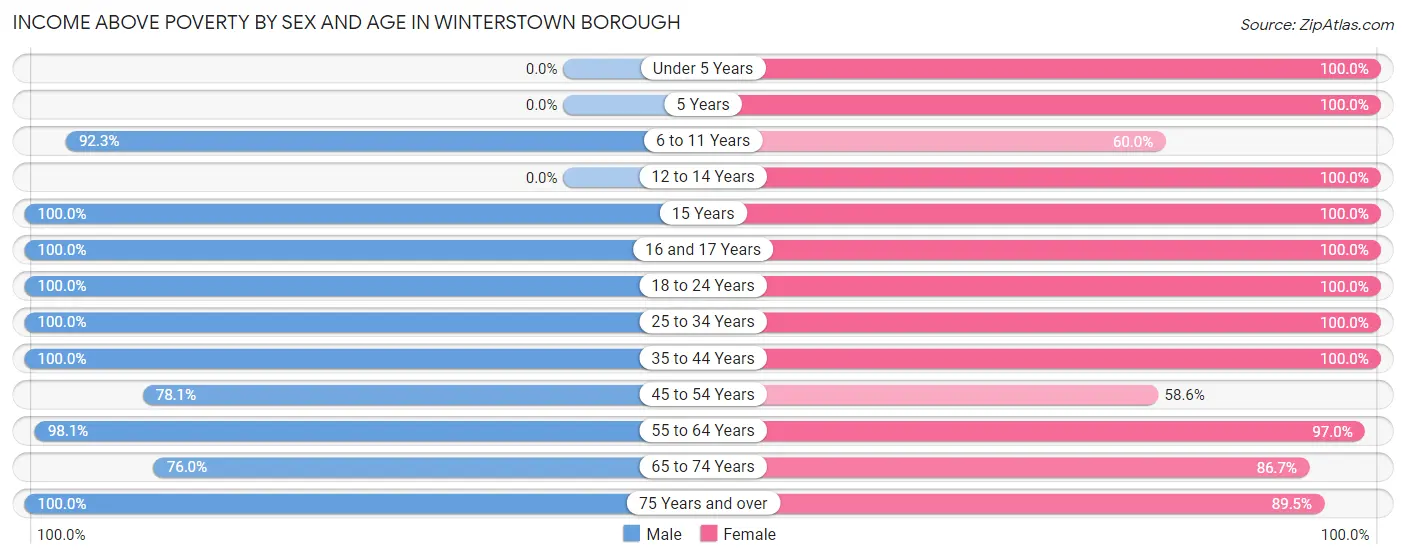
| Age Bracket | Male | Female |
| Under 5 Years | 0 (0.0%) | 21 (100.0%) |
| 5 Years | 0 (0.0%) | 15 (100.0%) |
| 6 to 11 Years | 24 (92.3%) | 9 (60.0%) |
| 12 to 14 Years | 0 (0.0%) | 9 (100.0%) |
| 15 Years | 2 (100.0%) | 3 (100.0%) |
| 16 and 17 Years | 4 (100.0%) | 2 (100.0%) |
| 18 to 24 Years | 14 (100.0%) | 14 (100.0%) |
| 25 to 34 Years | 27 (100.0%) | 24 (100.0%) |
| 35 to 44 Years | 16 (100.0%) | 30 (100.0%) |
| 45 to 54 Years | 32 (78.0%) | 17 (58.6%) |
| 55 to 64 Years | 51 (98.1%) | 65 (97.0%) |
| 65 to 74 Years | 19 (76.0%) | 26 (86.7%) |
| 75 Years and over | 20 (100.0%) | 17 (89.5%) |
| Total | 209 (92.1%) | 252 (90.6%) |
Income Below Poverty Among Married-Couple Families in Winterstown borough
The poverty statistics for married-couple families in Winterstown borough show that 6.2% or 7 of the total 112 families live below the poverty line. Families with no children have the highest poverty rate of 7.2%, comprising of 6 families. On the other hand, families with 3 or 4 children have the lowest poverty rate of 0.0%, which includes 0 families.
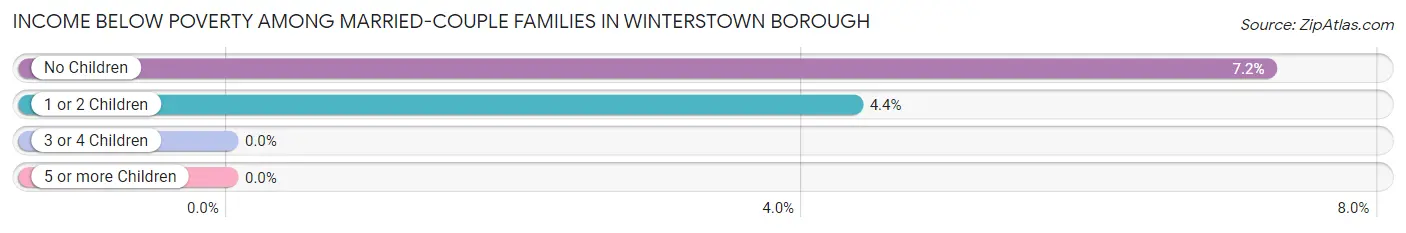
| Children | Above Poverty | Below Poverty |
| No Children | 77 (92.8%) | 6 (7.2%) |
| 1 or 2 Children | 22 (95.7%) | 1 (4.3%) |
| 3 or 4 Children | 6 (100.0%) | 0 (0.0%) |
| 5 or more Children | 0 (0.0%) | 0 (0.0%) |
| Total | 105 (93.8%) | 7 (6.2%) |
Income Below Poverty Among Single-Parent Households in Winterstown borough
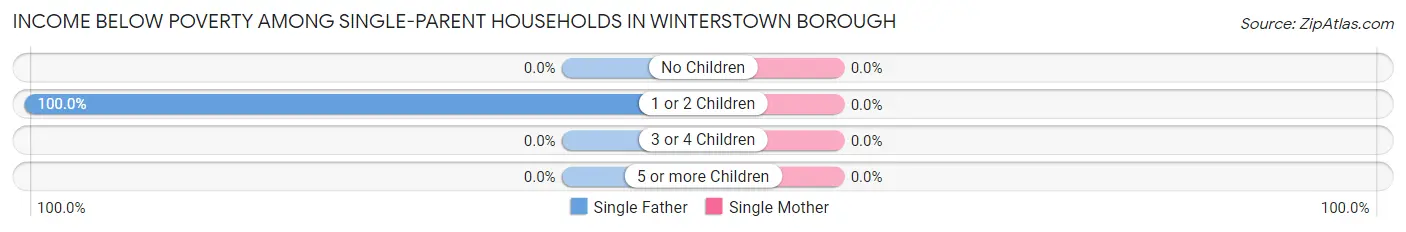
| Children | Single Father | Single Mother |
| No Children | 0 (0.0%) | 0 (0.0%) |
| 1 or 2 Children | 7 (100.0%) | 0 (0.0%) |
| 3 or 4 Children | 0 (0.0%) | 0 (0.0%) |
| 5 or more Children | 0 (0.0%) | 0 (0.0%) |
| Total | 7 (100.0%) | 0 (0.0%) |
Income Below Poverty Among Married-Couple vs Single-Parent Households in Winterstown borough
The poverty data for Winterstown borough shows that 7 of the married-couple family households (6.2%) and 7 of the single-parent households (23.3%) are living below the poverty level. Within the married-couple family households, those with no children have the highest poverty rate, with 6 households (7.2%) falling below the poverty line. Among the single-parent households, those with 1 or 2 children have the highest poverty rate, with 7 household (36.8%) living below poverty.
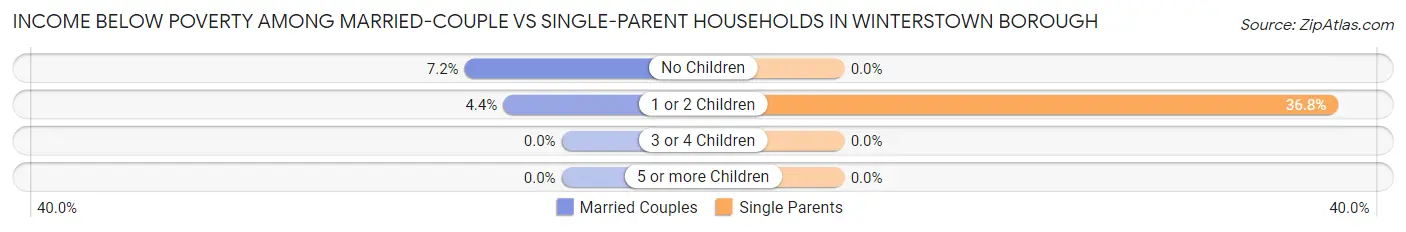
| Children | Married-Couple Families | Single-Parent Households |
| No Children | 6 (7.2%) | 0 (0.0%) |
| 1 or 2 Children | 1 (4.3%) | 7 (36.8%) |
| 3 or 4 Children | 0 (0.0%) | 0 (0.0%) |
| 5 or more Children | 0 (0.0%) | 0 (0.0%) |
| Total | 7 (6.2%) | 7 (23.3%) |
Race in Winterstown borough
The most populous races in Winterstown borough are White / Caucasian (493 | 97.6%), Hispanic or Latino (21 | 4.2%), and Two or more Races (12 | 2.4%).
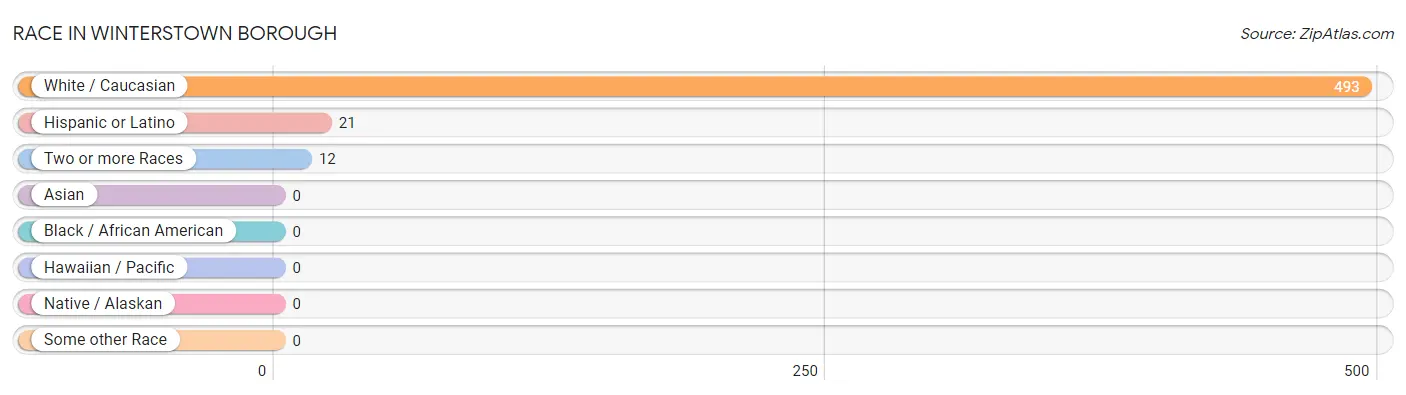
| Race | # Population | % Population |
| Asian | 0 | 0.0% |
| Black / African American | 0 | 0.0% |
| Hawaiian / Pacific | 0 | 0.0% |
| Hispanic or Latino | 21 | 4.2% |
| Native / Alaskan | 0 | 0.0% |
| White / Caucasian | 493 | 97.6% |
| Two or more Races | 12 | 2.4% |
| Some other Race | 0 | 0.0% |
| Total | 505 | 100.0% |
Ancestry in Winterstown borough
The most populous ancestries reported in Winterstown borough are German (132 | 26.1%), Irish (65 | 12.9%), English (56 | 11.1%), Italian (44 | 8.7%), and American (30 | 5.9%), together accounting for 64.7% of all Winterstown borough residents.
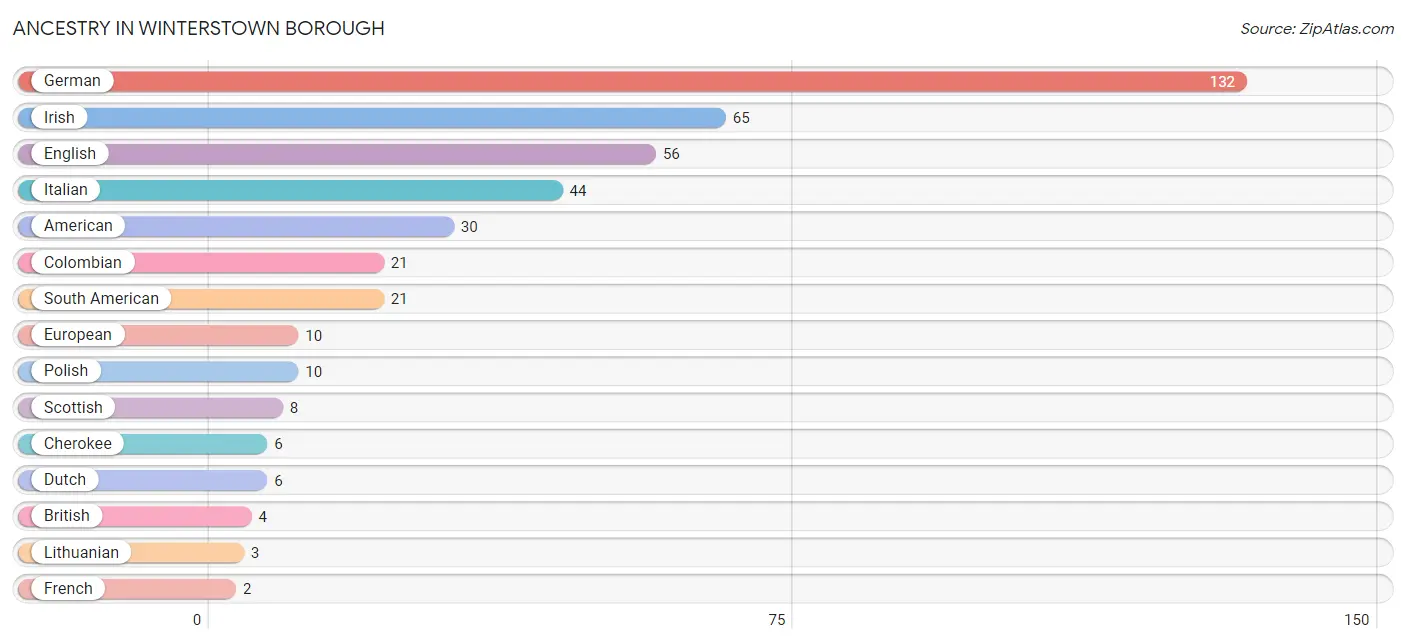
| Ancestry | # Population | % Population |
| American | 30 | 5.9% |
| British | 4 | 0.8% |
| Cherokee | 6 | 1.2% |
| Colombian | 21 | 4.2% |
| Dutch | 6 | 1.2% |
| English | 56 | 11.1% |
| European | 10 | 2.0% |
| French | 2 | 0.4% |
| German | 132 | 26.1% |
| Irish | 65 | 12.9% |
| Italian | 44 | 8.7% |
| Lithuanian | 3 | 0.6% |
| Polish | 10 | 2.0% |
| Russian | 1 | 0.2% |
| Scottish | 8 | 1.6% |
| South American | 21 | 4.2% |
| Welsh | 2 | 0.4% | View All 17 Rows |
Immigrants in Winterstown borough
The most numerous immigrant groups reported in Winterstown borough came from Europe (3 | 0.6%), Italy (2 | 0.4%), Southern Europe (2 | 0.4%), Eastern Europe (1 | 0.2%), and Russia (1 | 0.2%), together accounting for 1.8% of all Winterstown borough residents.
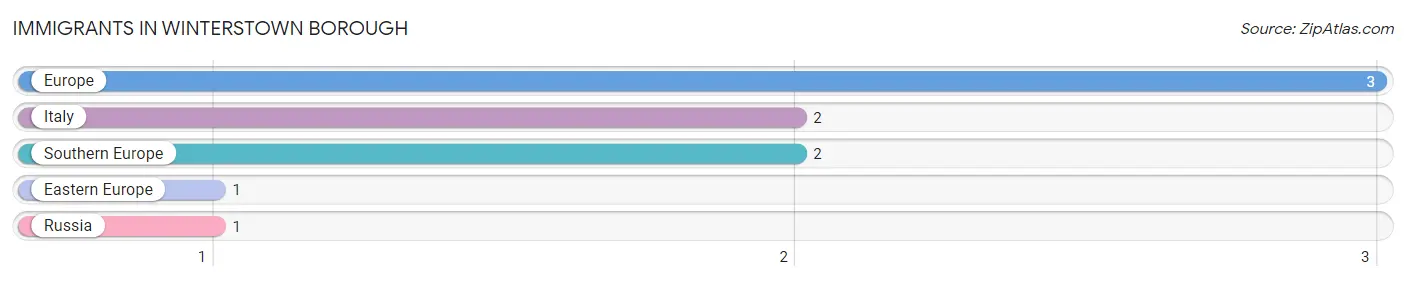
| Immigration Origin | # Population | % Population |
| Eastern Europe | 1 | 0.2% |
| Europe | 3 | 0.6% |
| Italy | 2 | 0.4% |
| Russia | 1 | 0.2% |
| Southern Europe | 2 | 0.4% | View All 5 Rows |
Sex and Age in Winterstown borough
Sex and Age in Winterstown borough
The most populous age groups in Winterstown borough are 55 to 59 Years (27 | 11.9%) for men and 60 to 64 Years (39 | 14.0%) for women.
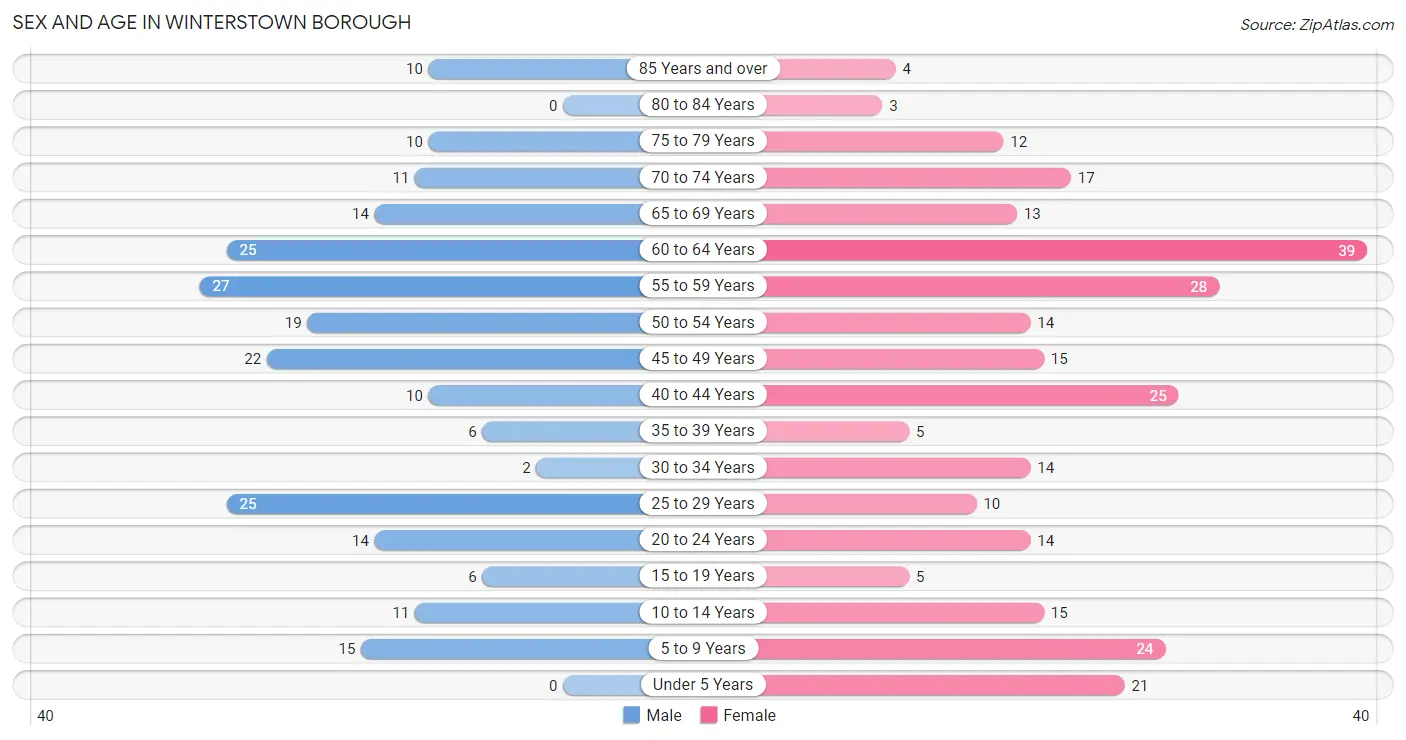
| Age Bracket | Male | Female |
| Under 5 Years | 0 (0.0%) | 21 (7.5%) |
| 5 to 9 Years | 15 (6.6%) | 24 (8.6%) |
| 10 to 14 Years | 11 (4.9%) | 15 (5.4%) |
| 15 to 19 Years | 6 (2.6%) | 5 (1.8%) |
| 20 to 24 Years | 14 (6.2%) | 14 (5.0%) |
| 25 to 29 Years | 25 (11.0%) | 10 (3.6%) |
| 30 to 34 Years | 2 (0.9%) | 14 (5.0%) |
| 35 to 39 Years | 6 (2.6%) | 5 (1.8%) |
| 40 to 44 Years | 10 (4.4%) | 25 (9.0%) |
| 45 to 49 Years | 22 (9.7%) | 15 (5.4%) |
| 50 to 54 Years | 19 (8.4%) | 14 (5.0%) |
| 55 to 59 Years | 27 (11.9%) | 28 (10.1%) |
| 60 to 64 Years | 25 (11.0%) | 39 (14.0%) |
| 65 to 69 Years | 14 (6.2%) | 13 (4.7%) |
| 70 to 74 Years | 11 (4.9%) | 17 (6.1%) |
| 75 to 79 Years | 10 (4.4%) | 12 (4.3%) |
| 80 to 84 Years | 0 (0.0%) | 3 (1.1%) |
| 85 Years and over | 10 (4.4%) | 4 (1.4%) |
| Total | 227 (100.0%) | 278 (100.0%) |
Families and Households in Winterstown borough
Median Family Size in Winterstown borough
The median family size in Winterstown borough is 2.81 persons per family, with single female/mother families (23 | 16.2%) accounting for the largest median family size of 3.3 persons per family. On the other hand, single male/father families (7 | 4.9%) represent the smallest median family size with 1.86 persons per family.
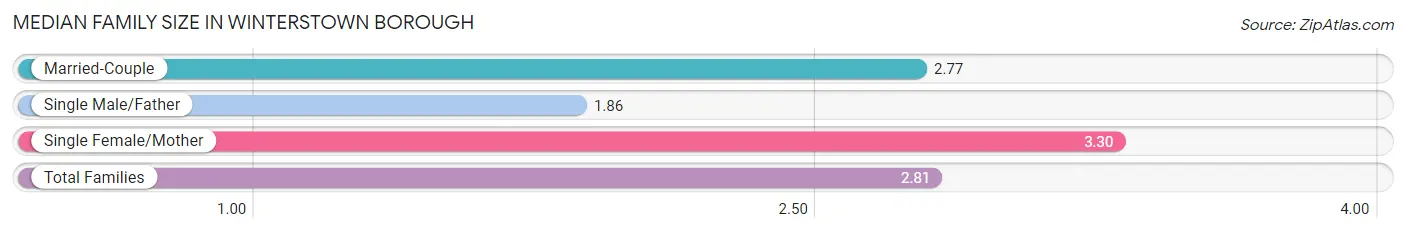
| Family Type | # Families | Family Size |
| Married-Couple | 112 (78.9%) | 2.77 |
| Single Male/Father | 7 (4.9%) | 1.86 |
| Single Female/Mother | 23 (16.2%) | 3.30 |
| Total Families | 142 (100.0%) | 2.81 |
Median Household Size in Winterstown borough
The median household size in Winterstown borough is 2.36 persons per household, with single female/mother households (23 | 10.7%) accounting for the largest median household size of 3.96 persons per household. non-family households (72 | 33.6%) represent the smallest median household size with 1.25 persons per household.
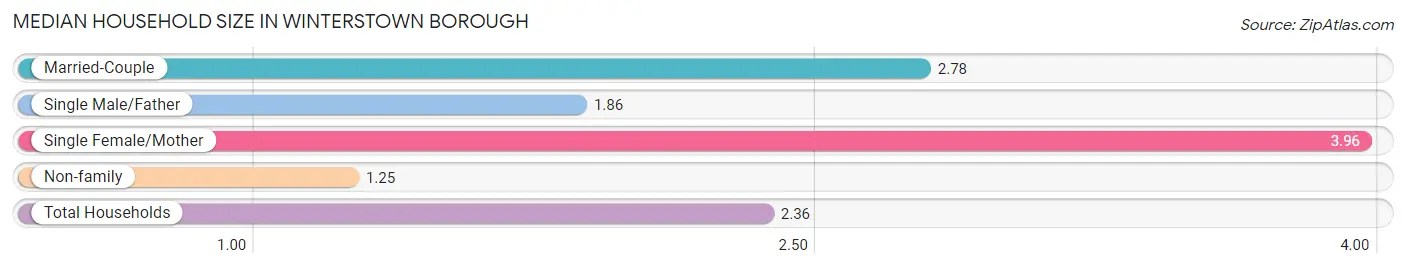
| Household Type | # Households | Household Size |
| Married-Couple | 112 (52.3%) | 2.78 |
| Single Male/Father | 7 (3.3%) | 1.86 |
| Single Female/Mother | 23 (10.7%) | 3.96 |
| Non-family | 72 (33.6%) | 1.25 |
| Total Households | 214 (100.0%) | 2.36 |
Household Size by Marriage Status in Winterstown borough
Out of a total of 214 households in Winterstown borough, 142 (66.4%) are family households, while 72 (33.6%) are nonfamily households. The most numerous type of family households are 2-person households, comprising 77, and the most common type of nonfamily households are 1-person households, comprising 58.
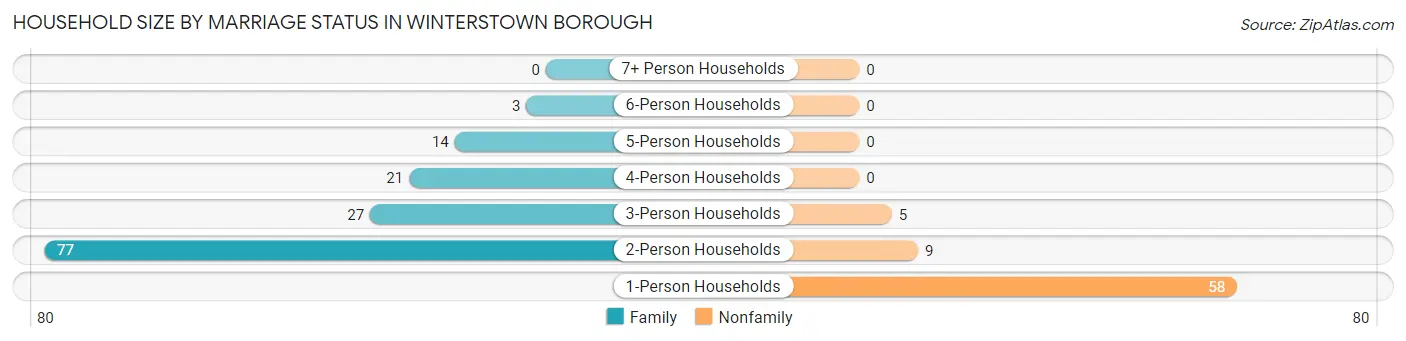
| Household Size | Family Households | Nonfamily Households |
| 1-Person Households | - | 58 (27.1%) |
| 2-Person Households | 77 (36.0%) | 9 (4.2%) |
| 3-Person Households | 27 (12.6%) | 5 (2.3%) |
| 4-Person Households | 21 (9.8%) | 0 (0.0%) |
| 5-Person Households | 14 (6.5%) | 0 (0.0%) |
| 6-Person Households | 3 (1.4%) | 0 (0.0%) |
| 7+ Person Households | 0 (0.0%) | 0 (0.0%) |
| Total | 142 (66.4%) | 72 (33.6%) |
Female Fertility in Winterstown borough
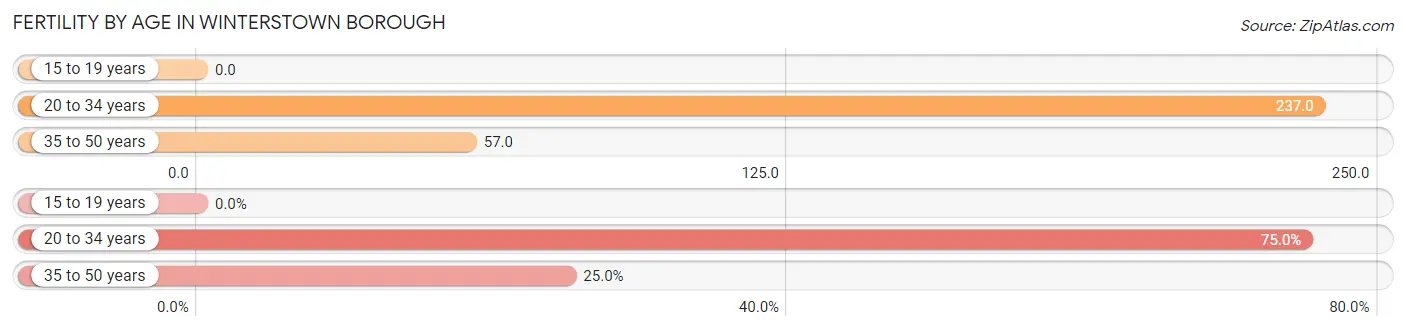
Fertility by Age in Winterstown borough
Average fertility rate in Winterstown borough is 125.0 births per 1,000 women. Women in the age bracket of 20 to 34 years have the highest fertility rate with 237.0 births per 1,000 women. Women in the age bracket of 20 to 34 years acount for 75.0% of all women with births.
| Age Bracket | Women with Births | Births / 1,000 Women |
| 15 to 19 years | 0 (0.0%) | 0.0 |
| 20 to 34 years | 9 (75.0%) | 237.0 |
| 35 to 50 years | 3 (25.0%) | 57.0 |
| Total | 12 (100.0%) | 125.0 |
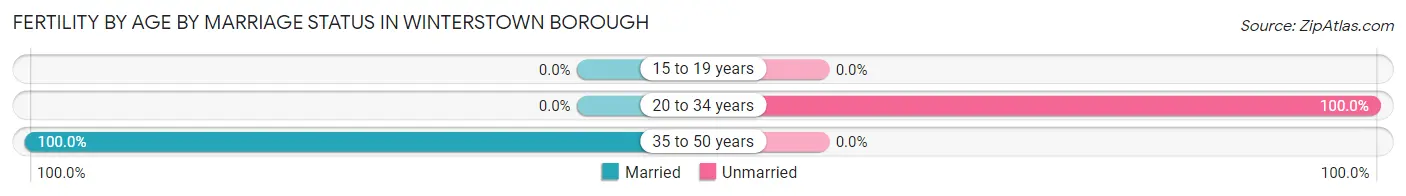
Fertility by Age by Marriage Status in Winterstown borough
25.0% of women with births (12) in Winterstown borough are married. The highest percentage of unmarried women with births falls into 20 to 34 years age bracket with 100.0% of them unmarried at the time of birth, while the lowest percentage of unmarried women with births belong to 35 to 50 years age bracket with 0.0% of them unmarried.
| Age Bracket | Married | Unmarried |
| 15 to 19 years | 0 (0.0%) | 0 (0.0%) |
| 20 to 34 years | 0 (0.0%) | 9 (100.0%) |
| 35 to 50 years | 3 (100.0%) | 0 (0.0%) |
| Total | 3 (25.0%) | 9 (75.0%) |
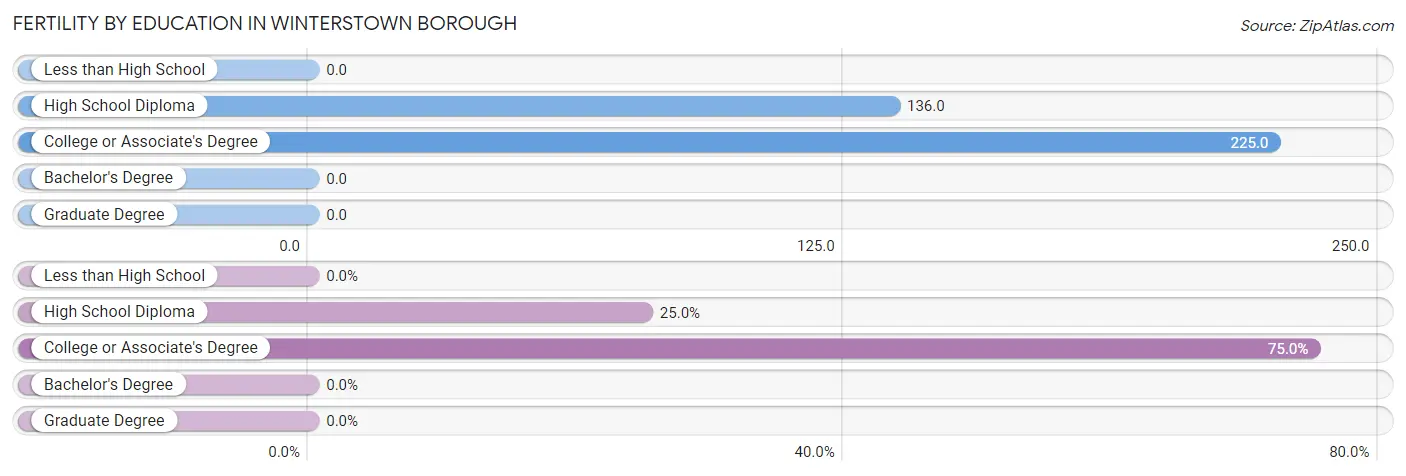
Fertility by Education in Winterstown borough
| Educational Attainment | Women with Births | Births / 1,000 Women |
| Less than High School | 0 (0.0%) | 0.0 |
| High School Diploma | 3 (25.0%) | 136.0 |
| College or Associate's Degree | 9 (75.0%) | 225.0 |
| Bachelor's Degree | 0 (0.0%) | 0.0 |
| Graduate Degree | 0 (0.0%) | 0.0 |
| Total | 12 (100.0%) | 125.0 |
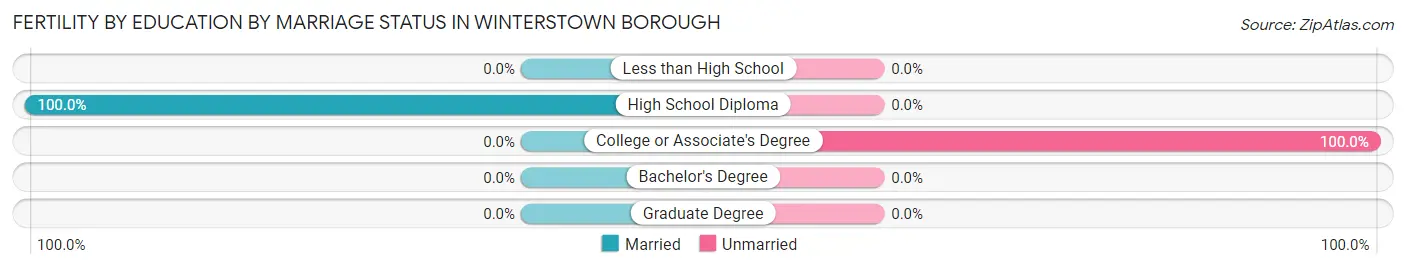
Fertility by Education by Marriage Status in Winterstown borough
75.0% of women with births in Winterstown borough are unmarried. Women with the educational attainment of high school diploma are most likely to be married with 100.0% of them married at childbirth, while women with the educational attainment of college or associate's degree are least likely to be married with 100.0% of them unmarried at childbirth.
| Educational Attainment | Married | Unmarried |
| Less than High School | 0 (0.0%) | 0 (0.0%) |
| High School Diploma | 3 (100.0%) | 0 (0.0%) |
| College or Associate's Degree | 0 (0.0%) | 9 (100.0%) |
| Bachelor's Degree | 0 (0.0%) | 0 (0.0%) |
| Graduate Degree | 0 (0.0%) | 0 (0.0%) |
| Total | 3 (25.0%) | 9 (75.0%) |
Employment Characteristics in Winterstown borough
Employment by Class of Employer in Winterstown borough
Among the 254 employed individuals in Winterstown borough, private company employees (180 | 70.9%), not-for-profit organizations (34 | 13.4%), and local government employees (16 | 6.3%) make up the most common classes of employment.
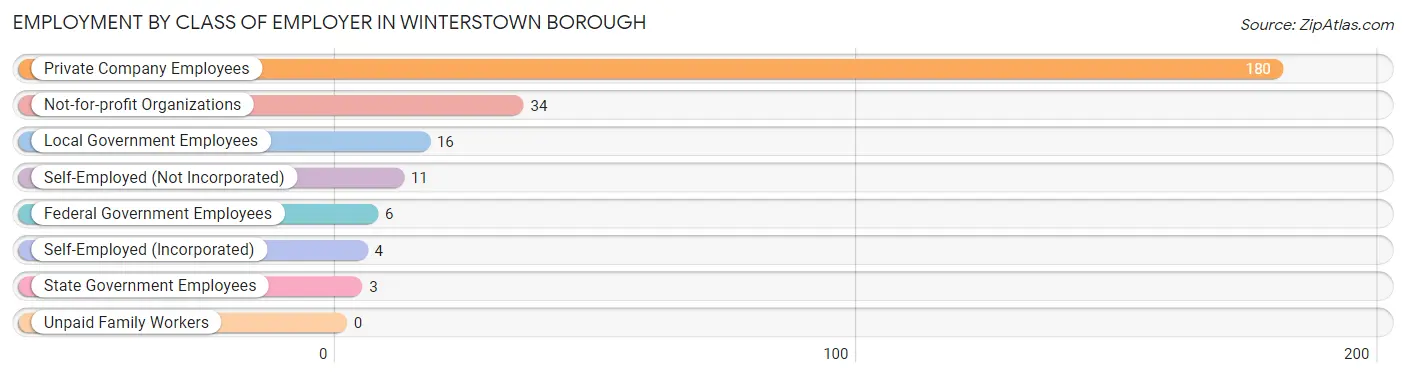
| Employer Class | # Employees | % Employees |
| Private Company Employees | 180 | 70.9% |
| Self-Employed (Incorporated) | 4 | 1.6% |
| Self-Employed (Not Incorporated) | 11 | 4.3% |
| Not-for-profit Organizations | 34 | 13.4% |
| Local Government Employees | 16 | 6.3% |
| State Government Employees | 3 | 1.2% |
| Federal Government Employees | 6 | 2.4% |
| Unpaid Family Workers | 0 | 0.0% |
| Total | 254 | 100.0% |
Employment Status by Age in Winterstown borough
According to the labor force statistics for Winterstown borough, out of the total population over 16 years of age (414), 65.0% or 269 individuals are in the labor force, with 5.6% or 15 of them unemployed. The age group with the highest labor force participation rate is 20 to 24 years, with 100.0% or 28 individuals in the labor force. Within the labor force, the 25 to 29 years age range has the highest percentage of unemployed individuals, with 28.6% or 10 of them being unemployed.
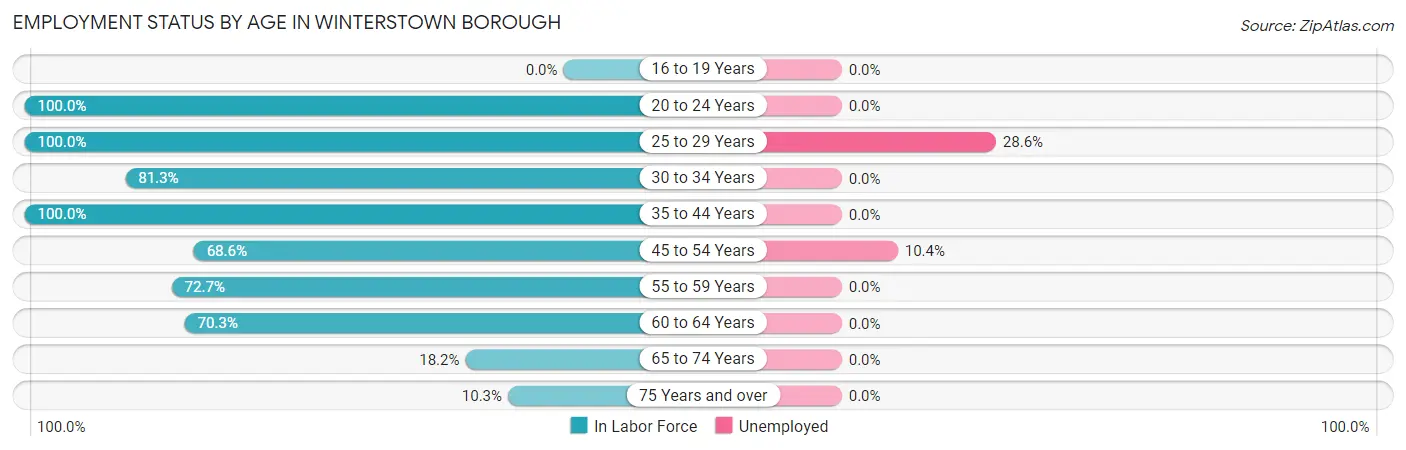
| Age Bracket | In Labor Force | Unemployed |
| 16 to 19 Years | 0 (0.0%) | 0 (0.0%) |
| 20 to 24 Years | 28 (100.0%) | 0 (0.0%) |
| 25 to 29 Years | 35 (100.0%) | 10 (28.6%) |
| 30 to 34 Years | 13 (81.3%) | 0 (0.0%) |
| 35 to 44 Years | 46 (100.0%) | 0 (0.0%) |
| 45 to 54 Years | 48 (68.6%) | 5 (10.4%) |
| 55 to 59 Years | 40 (72.7%) | 0 (0.0%) |
| 60 to 64 Years | 45 (70.3%) | 0 (0.0%) |
| 65 to 74 Years | 10 (18.2%) | 0 (0.0%) |
| 75 Years and over | 4 (10.3%) | 0 (0.0%) |
| Total | 269 (65.0%) | 15 (5.6%) |
Employment Status by Educational Attainment in Winterstown borough
According to labor force statistics for Winterstown borough, 79.4% of individuals (227) out of the total population between 25 and 64 years of age (286) are in the labor force, with 6.6% or 15 of them being unemployed. The group with the highest labor force participation rate are those with the educational attainment of bachelor's degree or higher, with 100.0% or 41 individuals in the labor force. Within the labor force, individuals with high school diploma education have the highest percentage of unemployment, with 13.2% or 15 of them being unemployed.
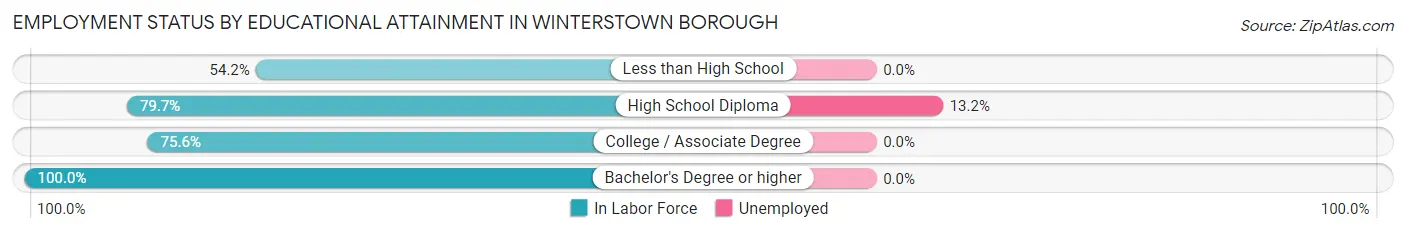
| Educational Attainment | In Labor Force | Unemployed |
| Less than High School | 13 (54.2%) | 0 (0.0%) |
| High School Diploma | 114 (79.7%) | 19 (13.2%) |
| College / Associate Degree | 59 (75.6%) | 0 (0.0%) |
| Bachelor's Degree or higher | 41 (100.0%) | 0 (0.0%) |
| Total | 227 (79.4%) | 19 (6.6%) |
Employment Occupations by Sex in Winterstown borough
Management, Business, Science and Arts Occupations
The most common Management, Business, Science and Arts occupations in Winterstown borough are Health Diagnosing & Treating (29 | 11.4%), Community & Social Service (22 | 8.7%), Education Instruction & Library (18 | 7.1%), Computers, Engineering & Science (15 | 5.9%), and Health Technologists (11 | 4.3%).
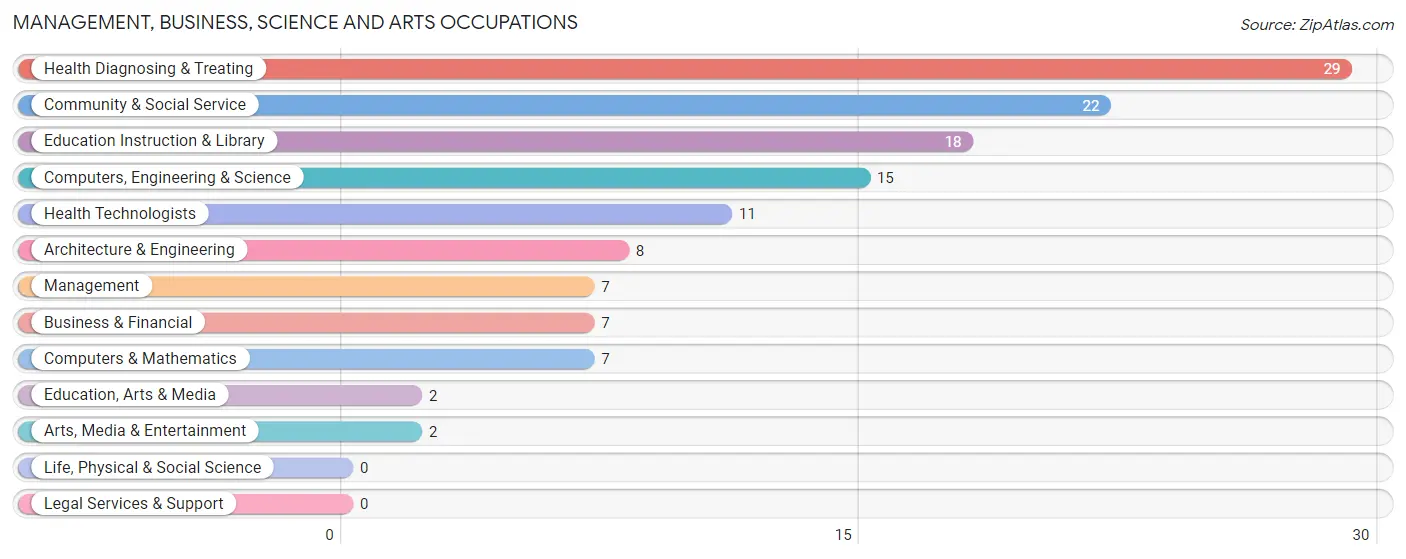
Management, Business, Science and Arts Occupations by Sex
Within the Management, Business, Science and Arts occupations in Winterstown borough, the most male-oriented occupations are Computers, Engineering & Science (100.0%), Computers & Mathematics (100.0%), and Architecture & Engineering (100.0%), while the most female-oriented occupations are Education, Arts & Media (100.0%), Health Diagnosing & Treating (100.0%), and Health Technologists (100.0%).
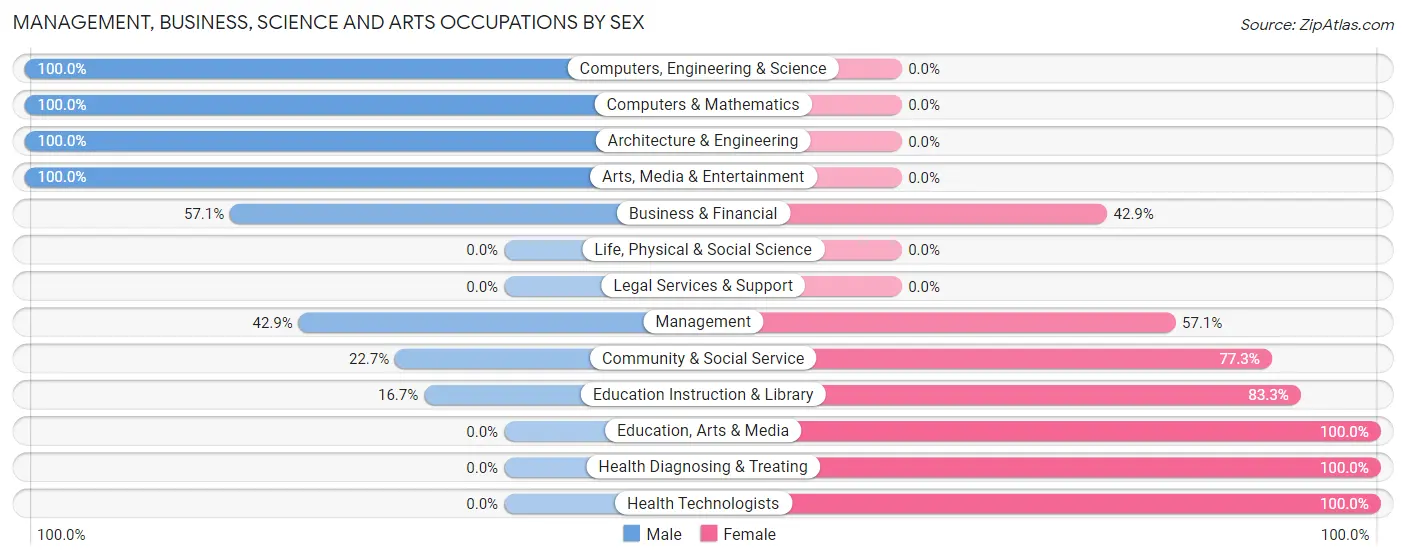
| Occupation | Male | Female |
| Management | 3 (42.9%) | 4 (57.1%) |
| Business & Financial | 4 (57.1%) | 3 (42.9%) |
| Computers, Engineering & Science | 15 (100.0%) | 0 (0.0%) |
| Computers & Mathematics | 7 (100.0%) | 0 (0.0%) |
| Architecture & Engineering | 8 (100.0%) | 0 (0.0%) |
| Life, Physical & Social Science | 0 (0.0%) | 0 (0.0%) |
| Community & Social Service | 5 (22.7%) | 17 (77.3%) |
| Education, Arts & Media | 0 (0.0%) | 2 (100.0%) |
| Legal Services & Support | 0 (0.0%) | 0 (0.0%) |
| Education Instruction & Library | 3 (16.7%) | 15 (83.3%) |
| Arts, Media & Entertainment | 2 (100.0%) | 0 (0.0%) |
| Health Diagnosing & Treating | 0 (0.0%) | 29 (100.0%) |
| Health Technologists | 0 (0.0%) | 11 (100.0%) |
| Total (Category) | 27 (33.8%) | 53 (66.2%) |
| Total (Overall) | 124 (48.8%) | 130 (51.2%) |
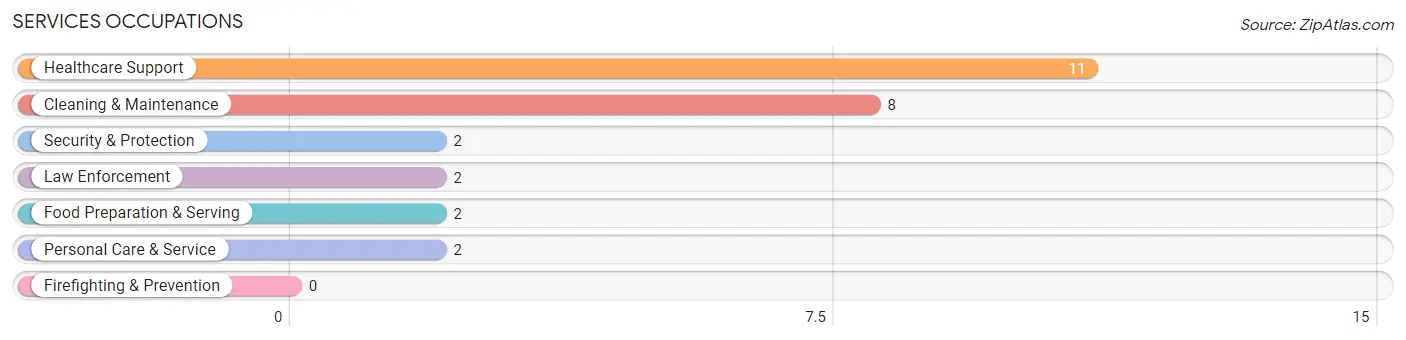
Services Occupations
The most common Services occupations in Winterstown borough are Healthcare Support (11 | 4.3%), Cleaning & Maintenance (8 | 3.2%), Security & Protection (2 | 0.8%), Law Enforcement (2 | 0.8%), and Food Preparation & Serving (2 | 0.8%).
Services Occupations by Sex
Within the Services occupations in Winterstown borough, the most male-oriented occupations are Security & Protection (100.0%), Law Enforcement (100.0%), and Cleaning & Maintenance (87.5%), while the most female-oriented occupations are Healthcare Support (100.0%), Food Preparation & Serving (100.0%), and Personal Care & Service (100.0%).
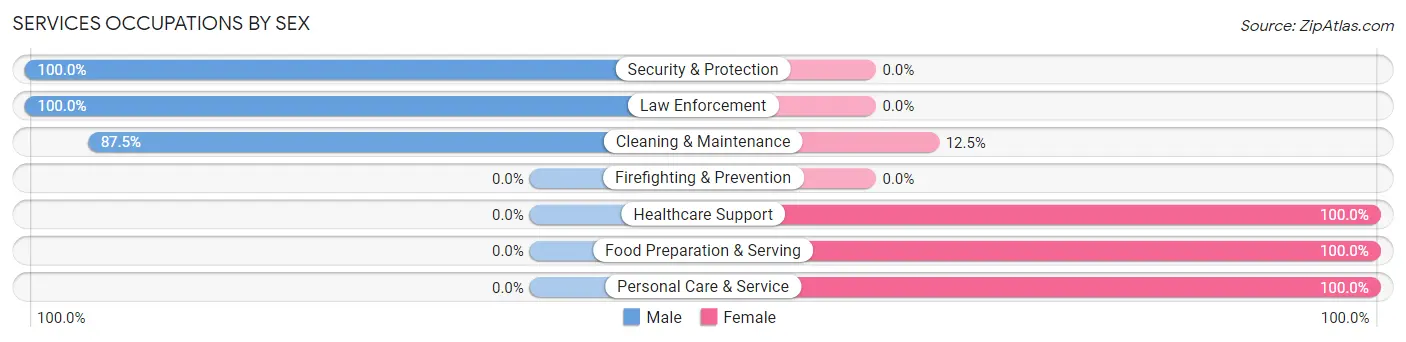
| Occupation | Male | Female |
| Healthcare Support | 0 (0.0%) | 11 (100.0%) |
| Security & Protection | 2 (100.0%) | 0 (0.0%) |
| Firefighting & Prevention | 0 (0.0%) | 0 (0.0%) |
| Law Enforcement | 2 (100.0%) | 0 (0.0%) |
| Food Preparation & Serving | 0 (0.0%) | 2 (100.0%) |
| Cleaning & Maintenance | 7 (87.5%) | 1 (12.5%) |
| Personal Care & Service | 0 (0.0%) | 2 (100.0%) |
| Total (Category) | 9 (36.0%) | 16 (64.0%) |
| Total (Overall) | 124 (48.8%) | 130 (51.2%) |
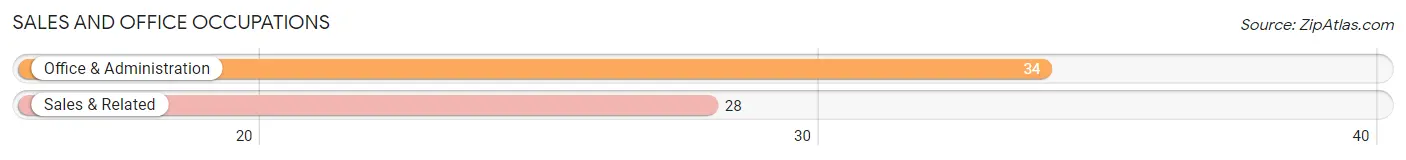
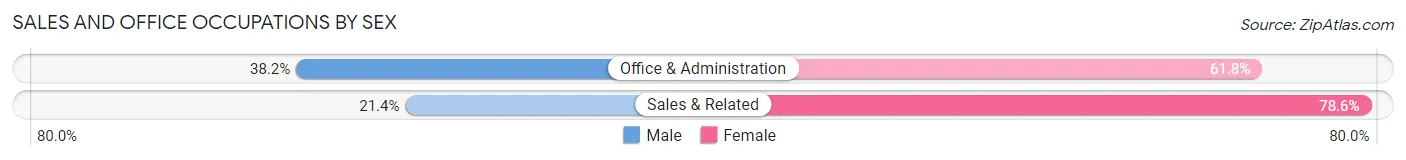
Sales and Office Occupations
The most common Sales and Office occupations in Winterstown borough are Office & Administration (34 | 13.4%), and Sales & Related (28 | 11.0%).
Sales and Office Occupations by Sex
| Occupation | Male | Female |
| Sales & Related | 6 (21.4%) | 22 (78.6%) |
| Office & Administration | 13 (38.2%) | 21 (61.8%) |
| Total (Category) | 19 (30.6%) | 43 (69.4%) |
| Total (Overall) | 124 (48.8%) | 130 (51.2%) |
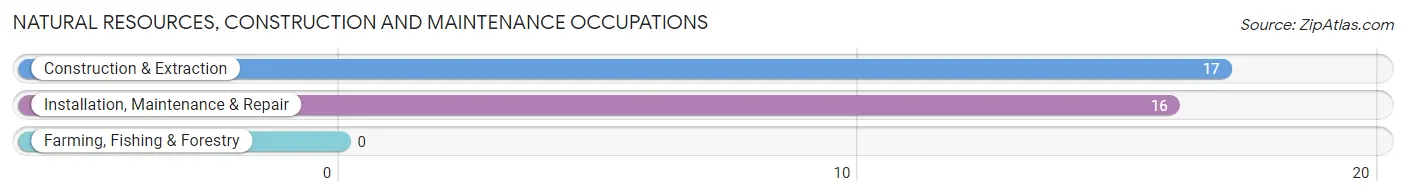
Natural Resources, Construction and Maintenance Occupations
The most common Natural Resources, Construction and Maintenance occupations in Winterstown borough are Construction & Extraction (17 | 6.7%), and Installation, Maintenance & Repair (16 | 6.3%).
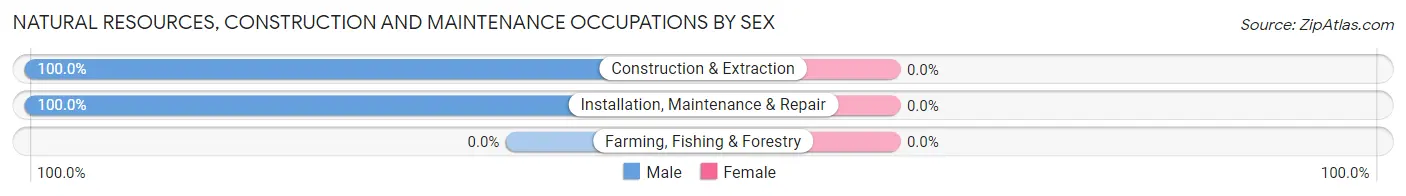
Natural Resources, Construction and Maintenance Occupations by Sex
| Occupation | Male | Female |
| Farming, Fishing & Forestry | 0 (0.0%) | 0 (0.0%) |
| Construction & Extraction | 17 (100.0%) | 0 (0.0%) |
| Installation, Maintenance & Repair | 16 (100.0%) | 0 (0.0%) |
| Total (Category) | 33 (100.0%) | 0 (0.0%) |
| Total (Overall) | 124 (48.8%) | 130 (51.2%) |
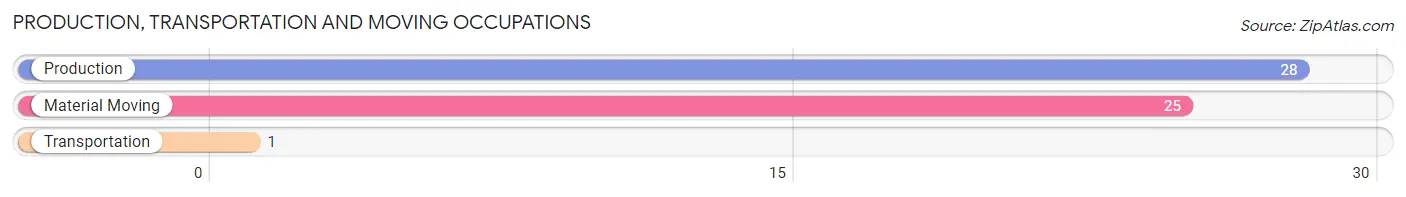
Production, Transportation and Moving Occupations
The most common Production, Transportation and Moving occupations in Winterstown borough are Production (28 | 11.0%), Material Moving (25 | 9.8%), and Transportation (1 | 0.4%).
Production, Transportation and Moving Occupations by Sex
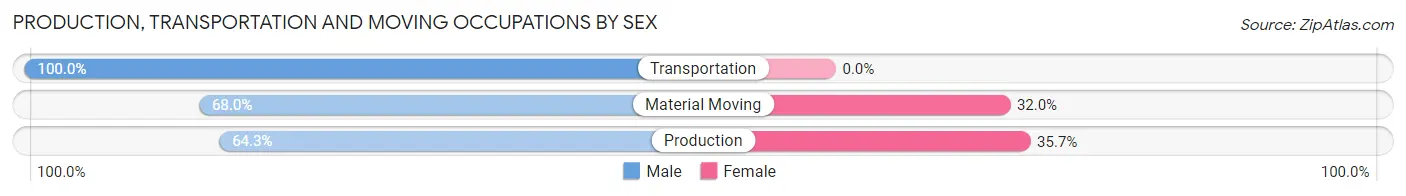
| Occupation | Male | Female |
| Production | 18 (64.3%) | 10 (35.7%) |
| Transportation | 1 (100.0%) | 0 (0.0%) |
| Material Moving | 17 (68.0%) | 8 (32.0%) |
| Total (Category) | 36 (66.7%) | 18 (33.3%) |
| Total (Overall) | 124 (48.8%) | 130 (51.2%) |
Employment Industries by Sex in Winterstown borough
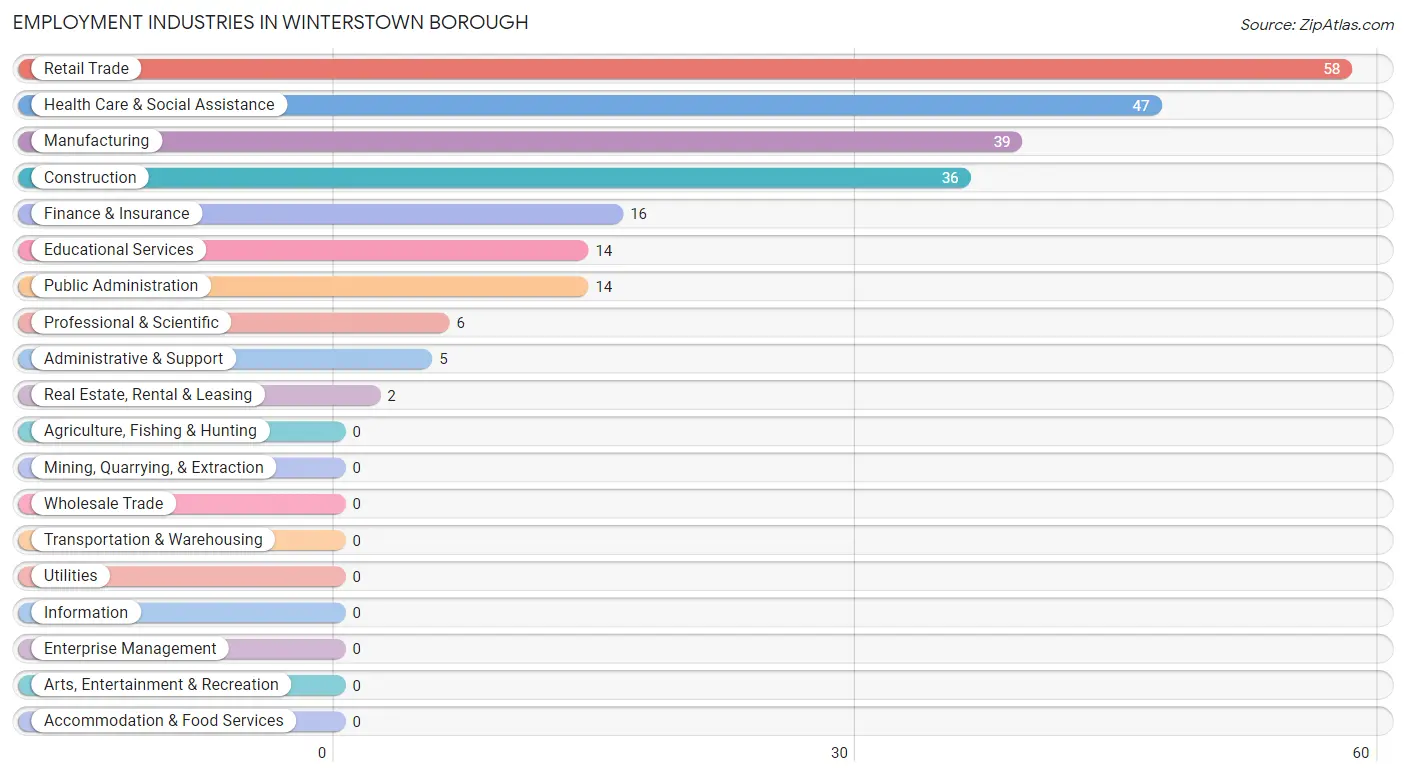
Employment Industries in Winterstown borough
The major employment industries in Winterstown borough include Retail Trade (58 | 22.8%), Health Care & Social Assistance (47 | 18.5%), Manufacturing (39 | 15.3%), Construction (36 | 14.2%), and Finance & Insurance (16 | 6.3%).
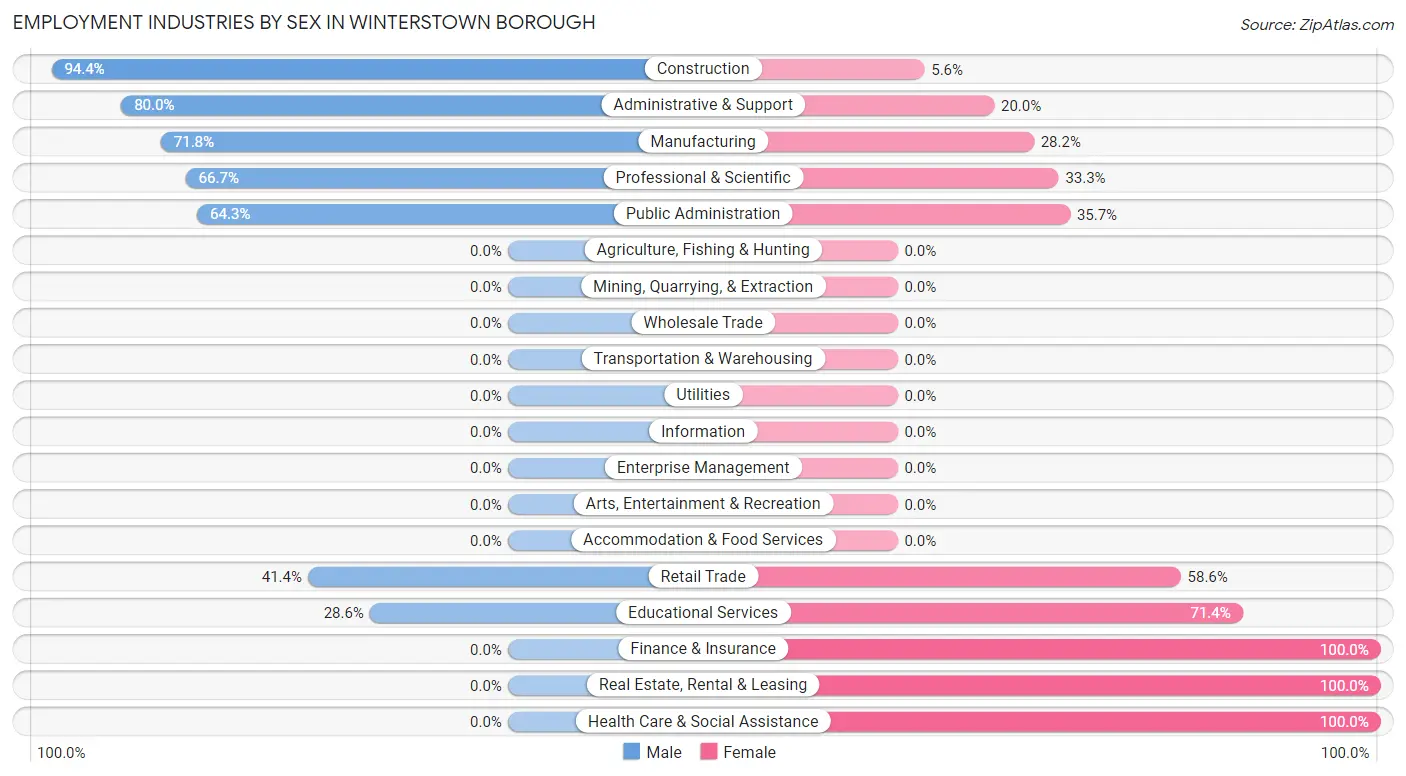
Employment Industries by Sex in Winterstown borough
The Winterstown borough industries that see more men than women are Construction (94.4%), Administrative & Support (80.0%), and Manufacturing (71.8%), whereas the industries that tend to have a higher number of women are Finance & Insurance (100.0%), Real Estate, Rental & Leasing (100.0%), and Health Care & Social Assistance (100.0%).
| Industry | Male | Female |
| Agriculture, Fishing & Hunting | 0 (0.0%) | 0 (0.0%) |
| Mining, Quarrying, & Extraction | 0 (0.0%) | 0 (0.0%) |
| Construction | 34 (94.4%) | 2 (5.6%) |
| Manufacturing | 28 (71.8%) | 11 (28.2%) |
| Wholesale Trade | 0 (0.0%) | 0 (0.0%) |
| Retail Trade | 24 (41.4%) | 34 (58.6%) |
| Transportation & Warehousing | 0 (0.0%) | 0 (0.0%) |
| Utilities | 0 (0.0%) | 0 (0.0%) |
| Information | 0 (0.0%) | 0 (0.0%) |
| Finance & Insurance | 0 (0.0%) | 16 (100.0%) |
| Real Estate, Rental & Leasing | 0 (0.0%) | 2 (100.0%) |
| Professional & Scientific | 4 (66.7%) | 2 (33.3%) |
| Enterprise Management | 0 (0.0%) | 0 (0.0%) |
| Administrative & Support | 4 (80.0%) | 1 (20.0%) |
| Educational Services | 4 (28.6%) | 10 (71.4%) |
| Health Care & Social Assistance | 0 (0.0%) | 47 (100.0%) |
| Arts, Entertainment & Recreation | 0 (0.0%) | 0 (0.0%) |
| Accommodation & Food Services | 0 (0.0%) | 0 (0.0%) |
| Public Administration | 9 (64.3%) | 5 (35.7%) |
| Total | 124 (48.8%) | 130 (51.2%) |
Education in Winterstown borough
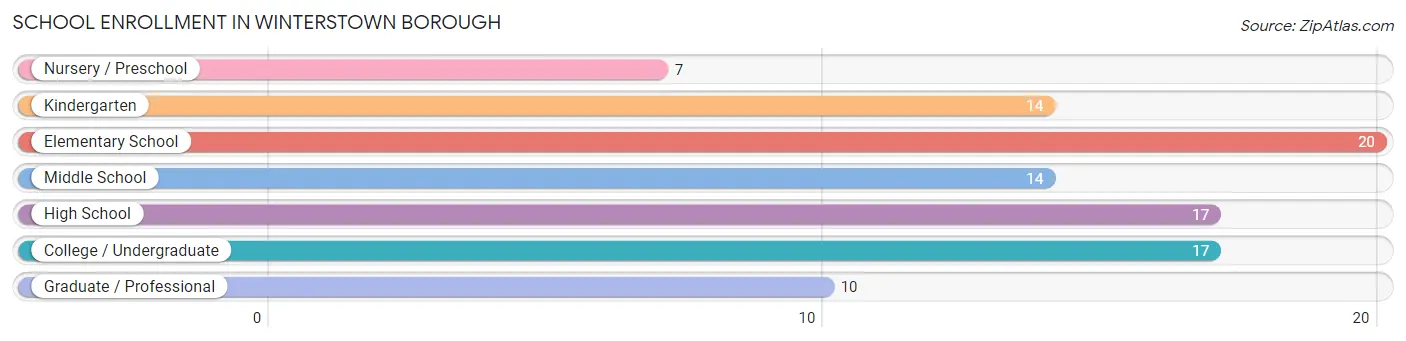
School Enrollment in Winterstown borough
The most common levels of schooling among the 99 students in Winterstown borough are elementary school (20 | 20.2%), high school (17 | 17.2%), and college / undergraduate (17 | 17.2%).
| School Level | # Students | % Students |
| Nursery / Preschool | 7 | 7.1% |
| Kindergarten | 14 | 14.1% |
| Elementary School | 20 | 20.2% |
| Middle School | 14 | 14.1% |
| High School | 17 | 17.2% |
| College / Undergraduate | 17 | 17.2% |
| Graduate / Professional | 10 | 10.1% |
| Total | 99 | 100.0% |
School Enrollment by Age by Funding Source in Winterstown borough
Out of a total of 99 students who are enrolled in schools in Winterstown borough, 8 (8.1%) attend a private institution, while the remaining 91 (91.9%) are enrolled in public schools. The age group of 35 years and over has the highest likelihood of being enrolled in private schools, with 4 (44.4% in the age bracket) enrolled. Conversely, the age group of 5 to 9 year old has the lowest likelihood of being enrolled in a private school, with 39 (100.0% in the age bracket) attending a public institution.
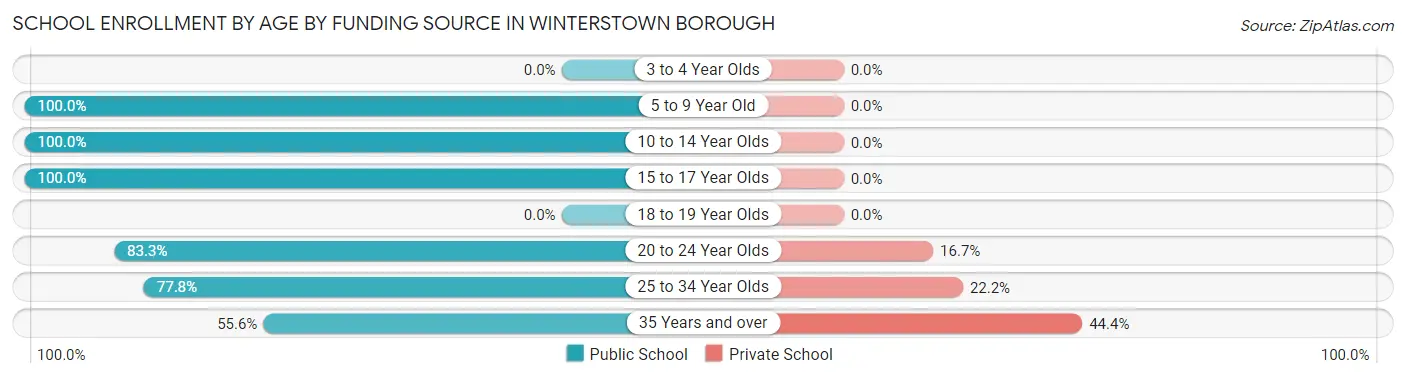
| Age Bracket | Public School | Private School |
| 3 to 4 Year Olds | 0 (0.0%) | 0 (0.0%) |
| 5 to 9 Year Old | 39 (100.0%) | 0 (0.0%) |
| 10 to 14 Year Olds | 19 (100.0%) | 0 (0.0%) |
| 15 to 17 Year Olds | 11 (100.0%) | 0 (0.0%) |
| 18 to 19 Year Olds | 0 (0.0%) | 0 (0.0%) |
| 20 to 24 Year Olds | 10 (83.3%) | 2 (16.7%) |
| 25 to 34 Year Olds | 7 (77.8%) | 2 (22.2%) |
| 35 Years and over | 5 (55.6%) | 4 (44.4%) |
| Total | 91 (91.9%) | 8 (8.1%) |
Educational Attainment by Field of Study in Winterstown borough
Education (16 | 30.2%), bio, nature & agricultural (9 | 17.0%), business (8 | 15.1%), social sciences (7 | 13.2%), and computers & mathematics (4 | 7.5%) are the most common fields of study among 53 individuals in Winterstown borough who have obtained a bachelor's degree or higher.
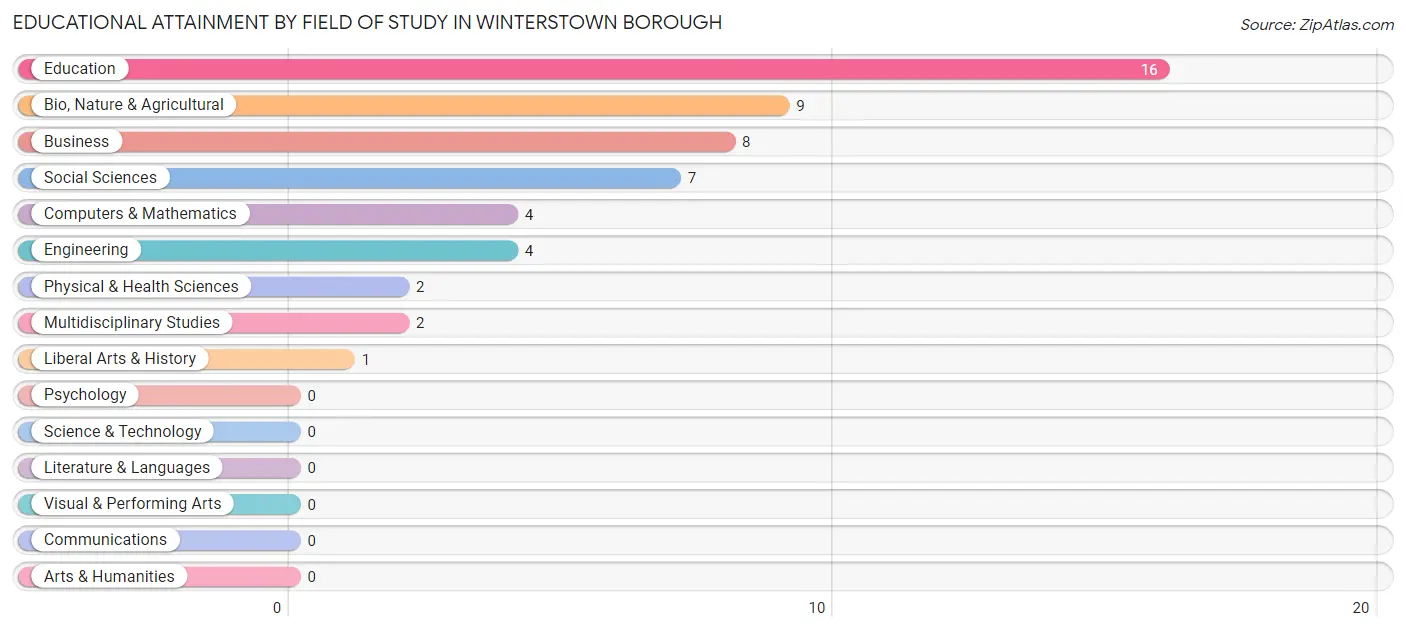
| Field of Study | # Graduates | % Graduates |
| Computers & Mathematics | 4 | 7.5% |
| Bio, Nature & Agricultural | 9 | 17.0% |
| Physical & Health Sciences | 2 | 3.8% |
| Psychology | 0 | 0.0% |
| Social Sciences | 7 | 13.2% |
| Engineering | 4 | 7.5% |
| Multidisciplinary Studies | 2 | 3.8% |
| Science & Technology | 0 | 0.0% |
| Business | 8 | 15.1% |
| Education | 16 | 30.2% |
| Literature & Languages | 0 | 0.0% |
| Liberal Arts & History | 1 | 1.9% |
| Visual & Performing Arts | 0 | 0.0% |
| Communications | 0 | 0.0% |
| Arts & Humanities | 0 | 0.0% |
| Total | 53 | 100.0% |
Transportation & Commute in Winterstown borough
Vehicle Availability by Sex in Winterstown borough
The most prevalent vehicle ownership categories in Winterstown borough are males with 3 vehicles (44, accounting for 35.5%) and females with 3 vehicles (62, making up 33.9%).
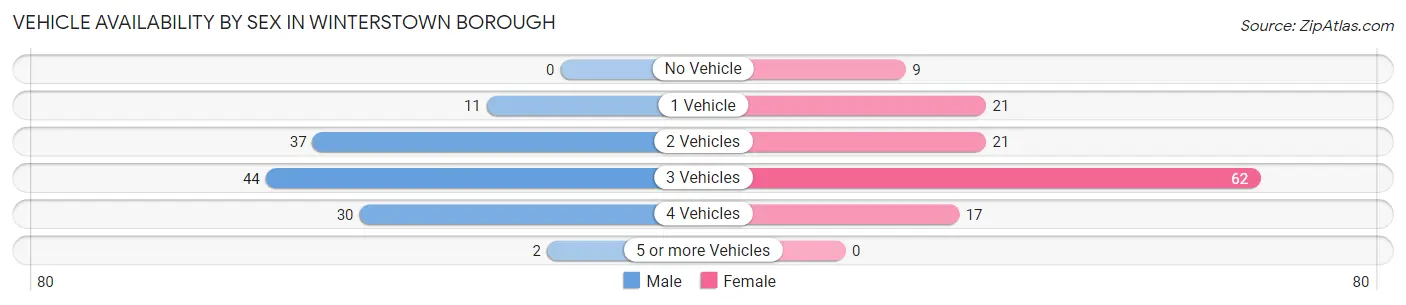
| Vehicles Available | Male | Female |
| No Vehicle | 0 (0.0%) | 9 (6.9%) |
| 1 Vehicle | 11 (8.9%) | 21 (16.2%) |
| 2 Vehicles | 37 (29.8%) | 21 (16.2%) |
| 3 Vehicles | 44 (35.5%) | 62 (47.7%) |
| 4 Vehicles | 30 (24.2%) | 17 (13.1%) |
| 5 or more Vehicles | 2 (1.6%) | 0 (0.0%) |
| Total | 124 (100.0%) | 130 (100.0%) |
Commute Time in Winterstown borough
The most frequently occuring commute durations in Winterstown borough are 20 to 24 minutes (56 commuters, 23.1%), 25 to 29 minutes (38 commuters, 15.6%), and 10 to 14 minutes (29 commuters, 11.9%).
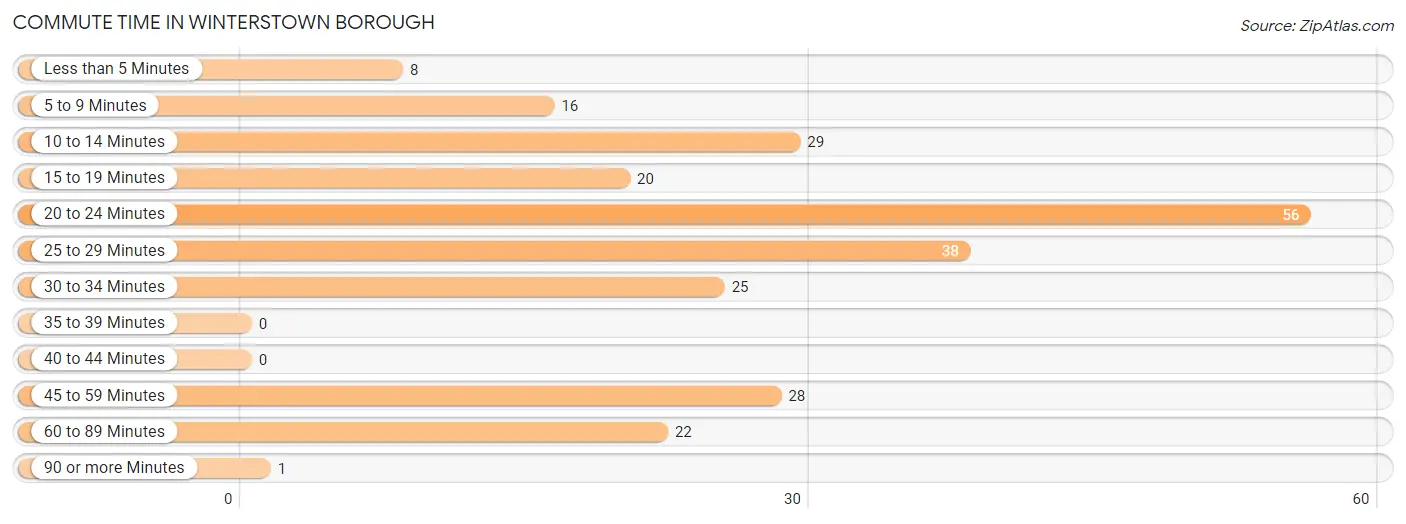
| Commute Time | # Commuters | % Commuters |
| Less than 5 Minutes | 8 | 3.3% |
| 5 to 9 Minutes | 16 | 6.6% |
| 10 to 14 Minutes | 29 | 11.9% |
| 15 to 19 Minutes | 20 | 8.2% |
| 20 to 24 Minutes | 56 | 23.1% |
| 25 to 29 Minutes | 38 | 15.6% |
| 30 to 34 Minutes | 25 | 10.3% |
| 35 to 39 Minutes | 0 | 0.0% |
| 40 to 44 Minutes | 0 | 0.0% |
| 45 to 59 Minutes | 28 | 11.5% |
| 60 to 89 Minutes | 22 | 9.0% |
| 90 or more Minutes | 1 | 0.4% |
Commute Time by Sex in Winterstown borough
The most common commute times in Winterstown borough are 25 to 29 minutes (32 commuters, 26.2%) for males and 20 to 24 minutes (45 commuters, 37.2%) for females.
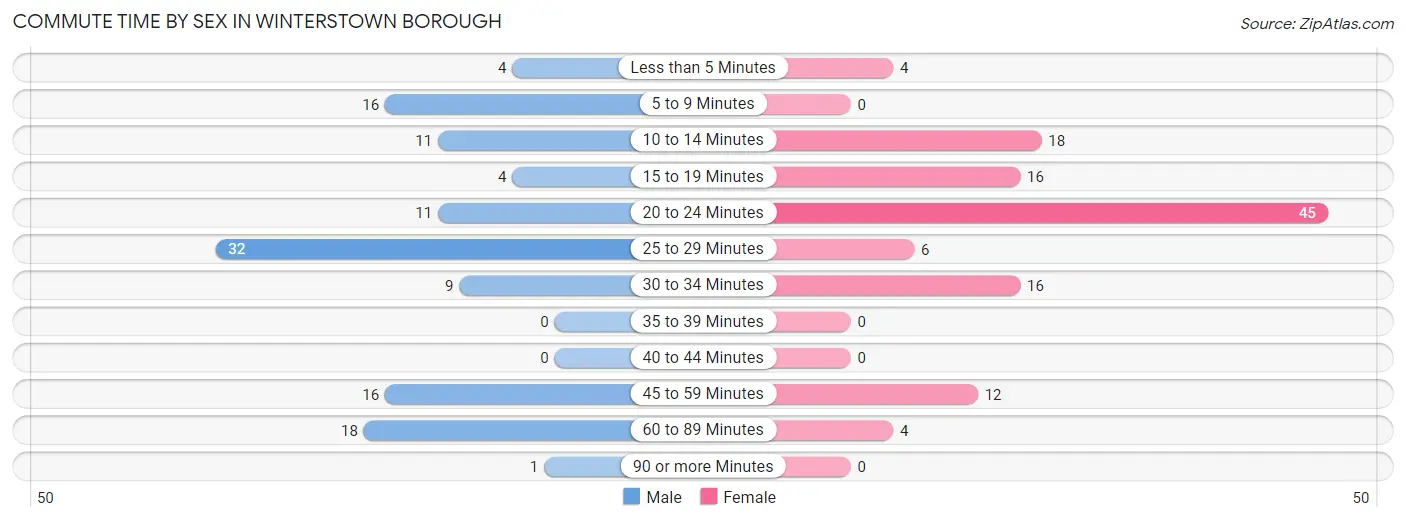
| Commute Time | Male | Female |
| Less than 5 Minutes | 4 (3.3%) | 4 (3.3%) |
| 5 to 9 Minutes | 16 (13.1%) | 0 (0.0%) |
| 10 to 14 Minutes | 11 (9.0%) | 18 (14.9%) |
| 15 to 19 Minutes | 4 (3.3%) | 16 (13.2%) |
| 20 to 24 Minutes | 11 (9.0%) | 45 (37.2%) |
| 25 to 29 Minutes | 32 (26.2%) | 6 (5.0%) |
| 30 to 34 Minutes | 9 (7.4%) | 16 (13.2%) |
| 35 to 39 Minutes | 0 (0.0%) | 0 (0.0%) |
| 40 to 44 Minutes | 0 (0.0%) | 0 (0.0%) |
| 45 to 59 Minutes | 16 (13.1%) | 12 (9.9%) |
| 60 to 89 Minutes | 18 (14.7%) | 4 (3.3%) |
| 90 or more Minutes | 1 (0.8%) | 0 (0.0%) |
Time of Departure to Work by Sex in Winterstown borough
The most frequent times of departure to work in Winterstown borough are 5:30 AM to 5:59 AM (26, 21.3%) for males and 6:30 AM to 6:59 AM (19, 15.7%) for females.
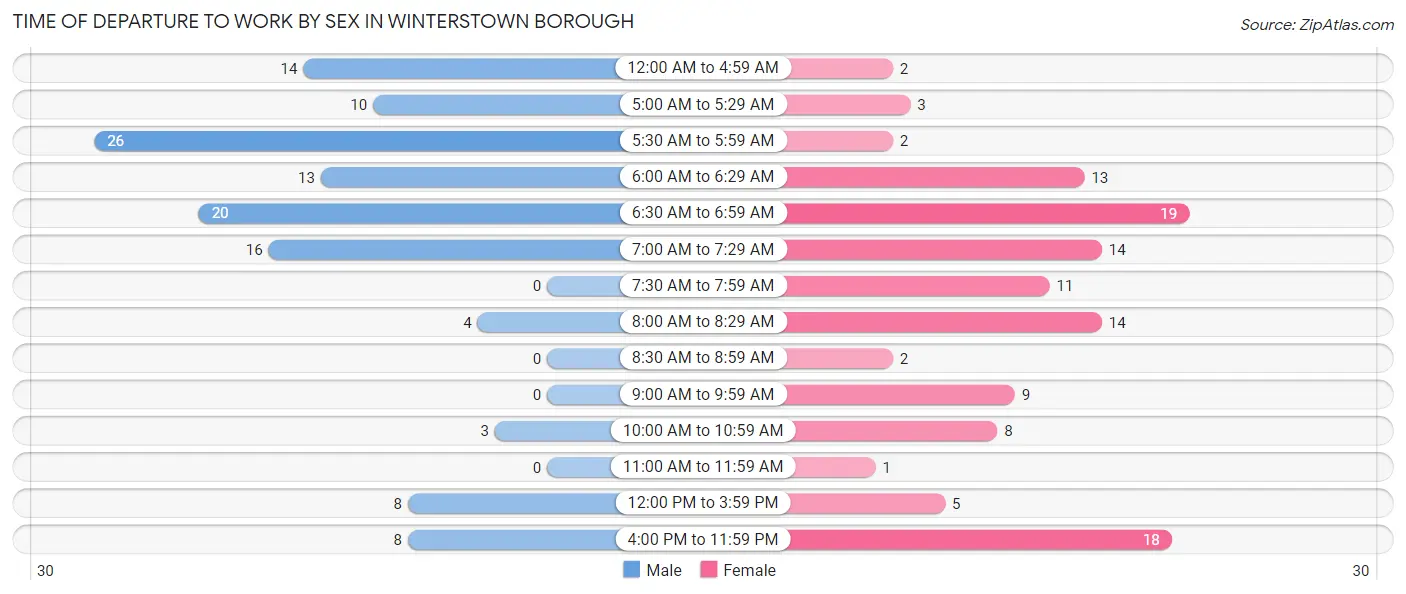
| Time of Departure | Male | Female |
| 12:00 AM to 4:59 AM | 14 (11.5%) | 2 (1.7%) |
| 5:00 AM to 5:29 AM | 10 (8.2%) | 3 (2.5%) |
| 5:30 AM to 5:59 AM | 26 (21.3%) | 2 (1.7%) |
| 6:00 AM to 6:29 AM | 13 (10.7%) | 13 (10.7%) |
| 6:30 AM to 6:59 AM | 20 (16.4%) | 19 (15.7%) |
| 7:00 AM to 7:29 AM | 16 (13.1%) | 14 (11.6%) |
| 7:30 AM to 7:59 AM | 0 (0.0%) | 11 (9.1%) |
| 8:00 AM to 8:29 AM | 4 (3.3%) | 14 (11.6%) |
| 8:30 AM to 8:59 AM | 0 (0.0%) | 2 (1.7%) |
| 9:00 AM to 9:59 AM | 0 (0.0%) | 9 (7.4%) |
| 10:00 AM to 10:59 AM | 3 (2.5%) | 8 (6.6%) |
| 11:00 AM to 11:59 AM | 0 (0.0%) | 1 (0.8%) |
| 12:00 PM to 3:59 PM | 8 (6.6%) | 5 (4.1%) |
| 4:00 PM to 11:59 PM | 8 (6.6%) | 18 (14.9%) |
| Total | 122 (100.0%) | 121 (100.0%) |
Housing Occupancy in Winterstown borough
Occupancy by Ownership in Winterstown borough
Of the total 214 dwellings in Winterstown borough, owner-occupied units account for 155 (72.4%), while renter-occupied units make up 59 (27.6%).
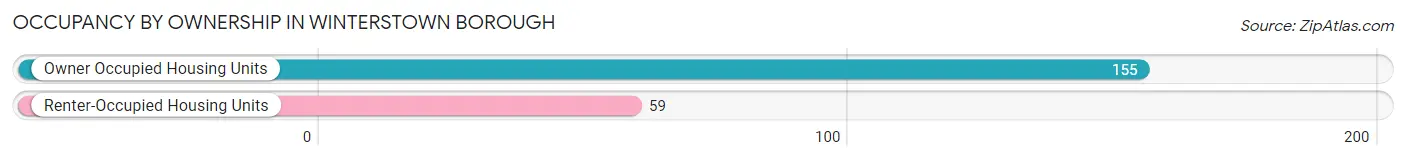
| Occupancy | # Housing Units | % Housing Units |
| Owner Occupied Housing Units | 155 | 72.4% |
| Renter-Occupied Housing Units | 59 | 27.6% |
| Total Occupied Housing Units | 214 | 100.0% |
Occupancy by Household Size in Winterstown borough
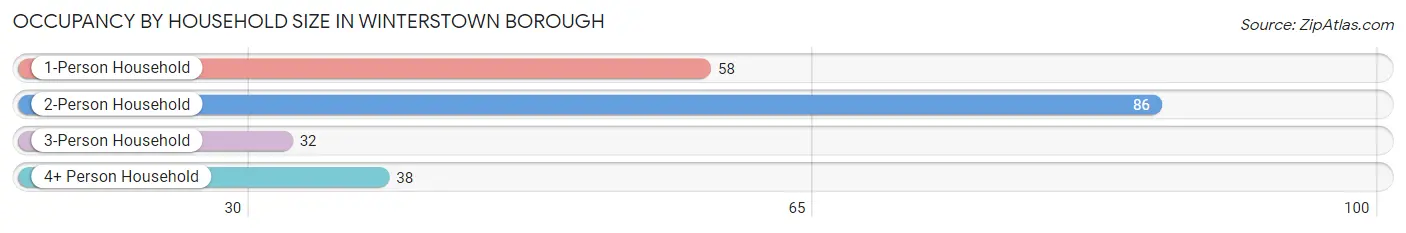
| Household Size | # Housing Units | % Housing Units |
| 1-Person Household | 58 | 27.1% |
| 2-Person Household | 86 | 40.2% |
| 3-Person Household | 32 | 14.9% |
| 4+ Person Household | 38 | 17.8% |
| Total Housing Units | 214 | 100.0% |
Occupancy by Ownership by Household Size in Winterstown borough
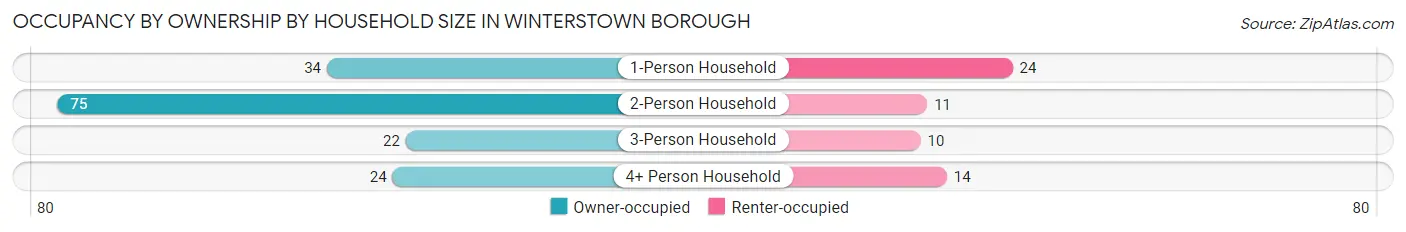
| Household Size | Owner-occupied | Renter-occupied |
| 1-Person Household | 34 (58.6%) | 24 (41.4%) |
| 2-Person Household | 75 (87.2%) | 11 (12.8%) |
| 3-Person Household | 22 (68.8%) | 10 (31.2%) |
| 4+ Person Household | 24 (63.2%) | 14 (36.8%) |
| Total Housing Units | 155 (72.4%) | 59 (27.6%) |
Occupancy by Educational Attainment in Winterstown borough
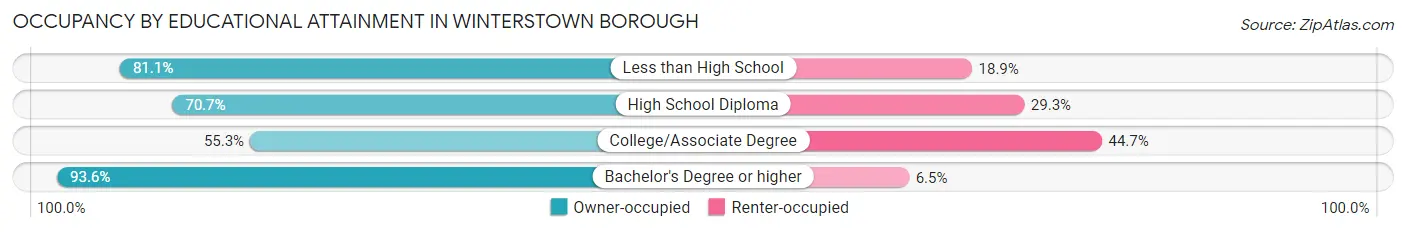
| Household Size | Owner-occupied | Renter-occupied |
| Less than High School | 30 (81.1%) | 7 (18.9%) |
| High School Diploma | 70 (70.7%) | 29 (29.3%) |
| College/Associate Degree | 26 (55.3%) | 21 (44.7%) |
| Bachelor's Degree or higher | 29 (93.5%) | 2 (6.5%) |
Occupancy by Age of Householder in Winterstown borough
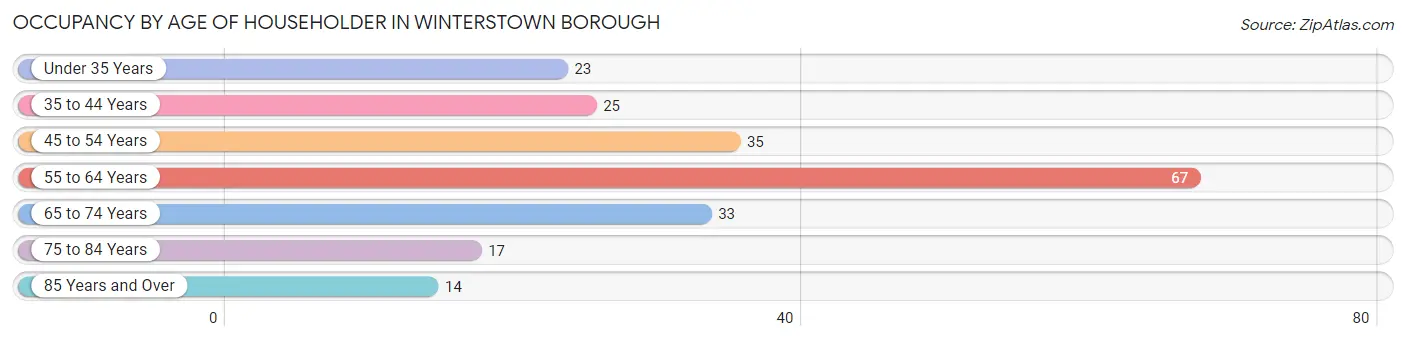
| Age Bracket | # Households | % Households |
| Under 35 Years | 23 | 10.7% |
| 35 to 44 Years | 25 | 11.7% |
| 45 to 54 Years | 35 | 16.4% |
| 55 to 64 Years | 67 | 31.3% |
| 65 to 74 Years | 33 | 15.4% |
| 75 to 84 Years | 17 | 7.9% |
| 85 Years and Over | 14 | 6.5% |
| Total | 214 | 100.0% |
Housing Finances in Winterstown borough
Median Income by Occupancy in Winterstown borough
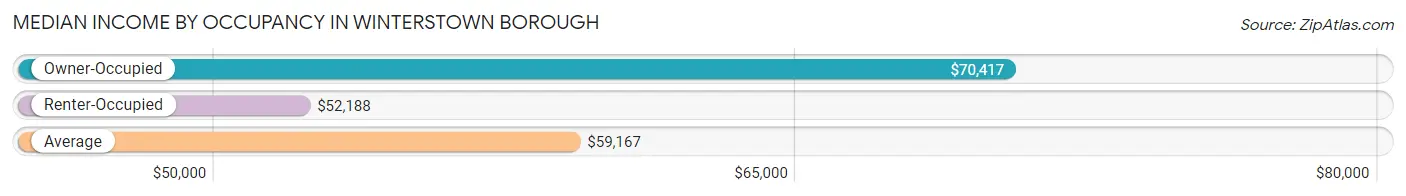
| Occupancy Type | # Households | Median Income |
| Owner-Occupied | 155 (72.4%) | $70,417 |
| Renter-Occupied | 59 (27.6%) | $52,188 |
| Average | 214 (100.0%) | $59,167 |
Occupancy by Householder Income Bracket in Winterstown borough
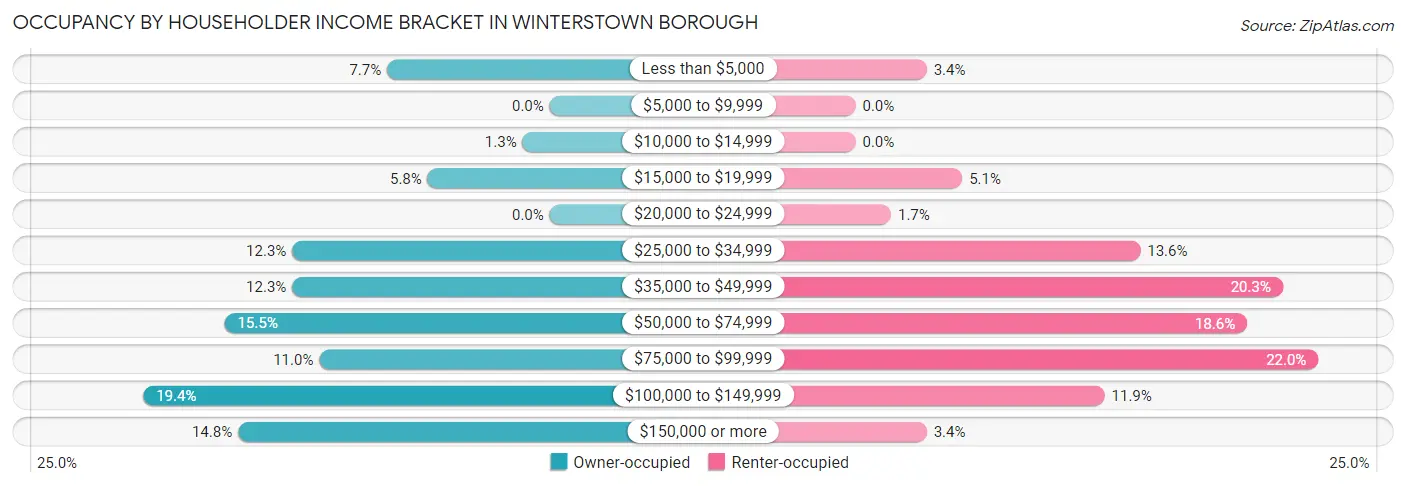
| Income Bracket | Owner-occupied | Renter-occupied |
| Less than $5,000 | 12 (7.7%) | 2 (3.4%) |
| $5,000 to $9,999 | 0 (0.0%) | 0 (0.0%) |
| $10,000 to $14,999 | 2 (1.3%) | 0 (0.0%) |
| $15,000 to $19,999 | 9 (5.8%) | 3 (5.1%) |
| $20,000 to $24,999 | 0 (0.0%) | 1 (1.7%) |
| $25,000 to $34,999 | 19 (12.3%) | 8 (13.6%) |
| $35,000 to $49,999 | 19 (12.3%) | 12 (20.3%) |
| $50,000 to $74,999 | 24 (15.5%) | 11 (18.6%) |
| $75,000 to $99,999 | 17 (11.0%) | 13 (22.0%) |
| $100,000 to $149,999 | 30 (19.4%) | 7 (11.9%) |
| $150,000 or more | 23 (14.8%) | 2 (3.4%) |
| Total | 155 (100.0%) | 59 (100.0%) |
Monthly Housing Cost Tiers in Winterstown borough
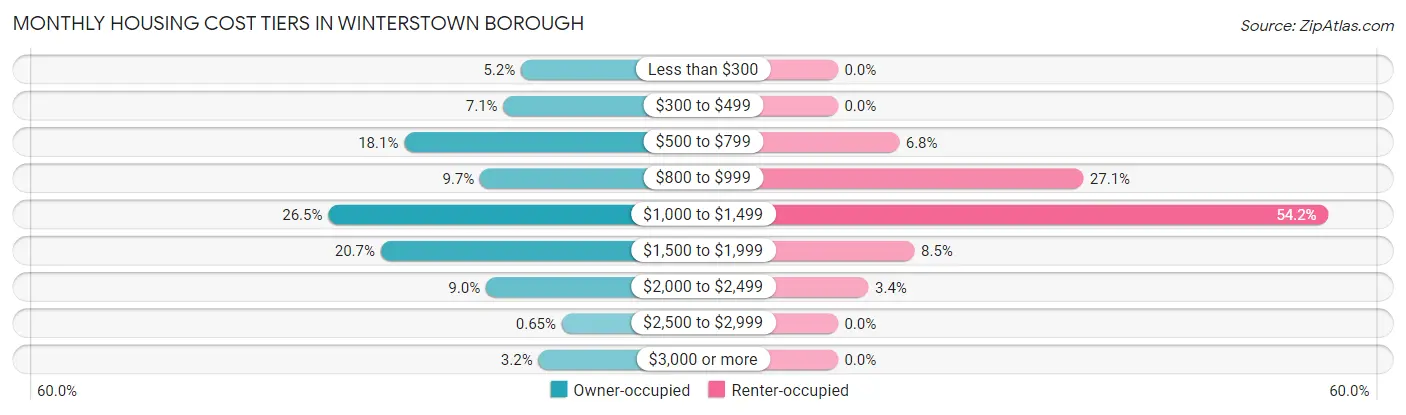
| Monthly Cost | Owner-occupied | Renter-occupied |
| Less than $300 | 8 (5.2%) | 0 (0.0%) |
| $300 to $499 | 11 (7.1%) | 0 (0.0%) |
| $500 to $799 | 28 (18.1%) | 4 (6.8%) |
| $800 to $999 | 15 (9.7%) | 16 (27.1%) |
| $1,000 to $1,499 | 41 (26.5%) | 32 (54.2%) |
| $1,500 to $1,999 | 32 (20.6%) | 5 (8.5%) |
| $2,000 to $2,499 | 14 (9.0%) | 2 (3.4%) |
| $2,500 to $2,999 | 1 (0.6%) | 0 (0.0%) |
| $3,000 or more | 5 (3.2%) | 0 (0.0%) |
| Total | 155 (100.0%) | 59 (100.0%) |
Physical Housing Characteristics in Winterstown borough
Housing Structures in Winterstown borough
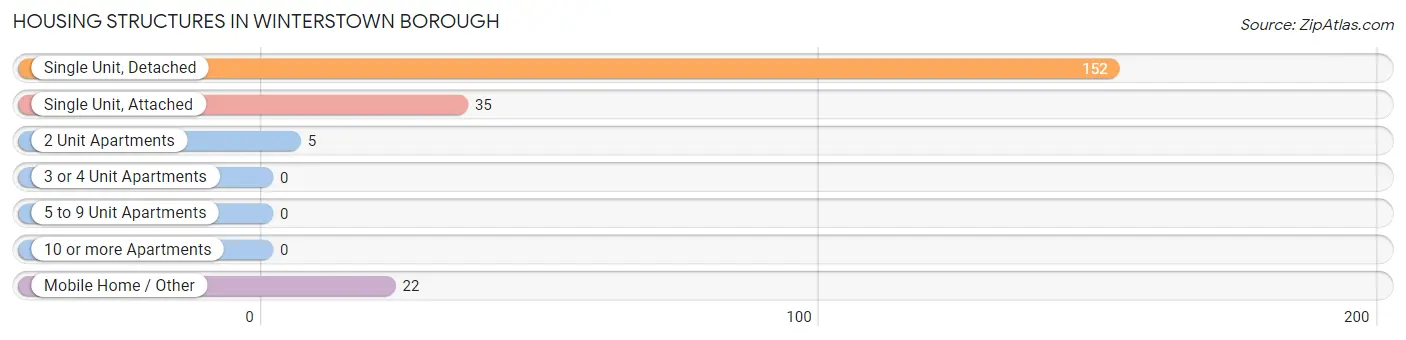
| Structure Type | # Housing Units | % Housing Units |
| Single Unit, Detached | 152 | 71.0% |
| Single Unit, Attached | 35 | 16.4% |
| 2 Unit Apartments | 5 | 2.3% |
| 3 or 4 Unit Apartments | 0 | 0.0% |
| 5 to 9 Unit Apartments | 0 | 0.0% |
| 10 or more Apartments | 0 | 0.0% |
| Mobile Home / Other | 22 | 10.3% |
| Total | 214 | 100.0% |
Housing Structures by Occupancy in Winterstown borough
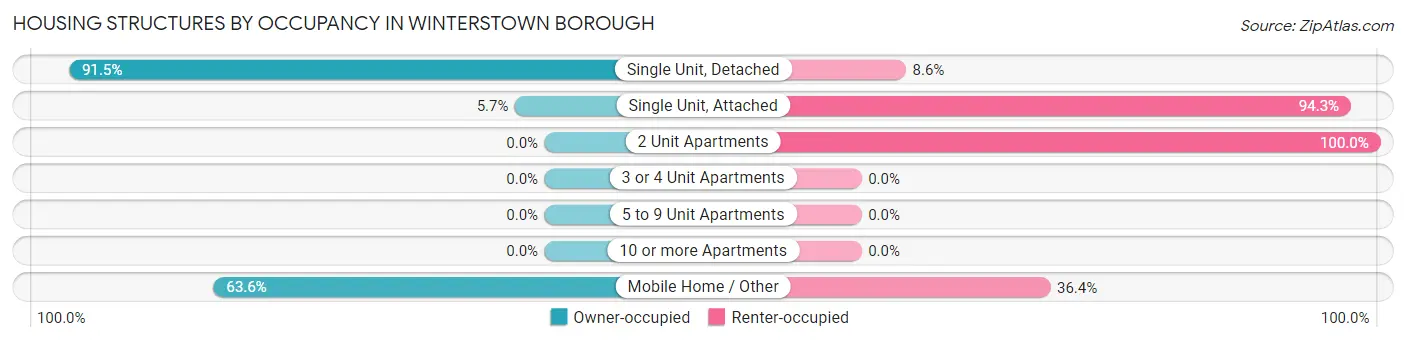
| Structure Type | Owner-occupied | Renter-occupied |
| Single Unit, Detached | 139 (91.4%) | 13 (8.6%) |
| Single Unit, Attached | 2 (5.7%) | 33 (94.3%) |
| 2 Unit Apartments | 0 (0.0%) | 5 (100.0%) |
| 3 or 4 Unit Apartments | 0 (0.0%) | 0 (0.0%) |
| 5 to 9 Unit Apartments | 0 (0.0%) | 0 (0.0%) |
| 10 or more Apartments | 0 (0.0%) | 0 (0.0%) |
| Mobile Home / Other | 14 (63.6%) | 8 (36.4%) |
| Total | 155 (72.4%) | 59 (27.6%) |
Housing Structures by Number of Rooms in Winterstown borough
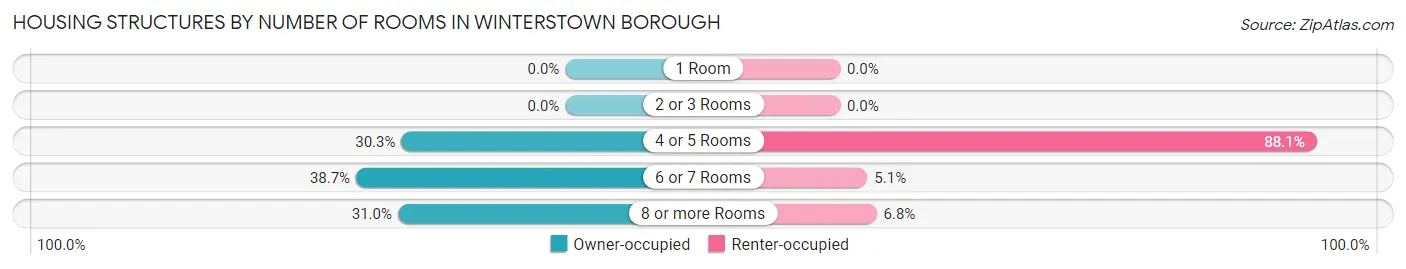
| Number of Rooms | Owner-occupied | Renter-occupied |
| 1 Room | 0 (0.0%) | 0 (0.0%) |
| 2 or 3 Rooms | 0 (0.0%) | 0 (0.0%) |
| 4 or 5 Rooms | 47 (30.3%) | 52 (88.1%) |
| 6 or 7 Rooms | 60 (38.7%) | 3 (5.1%) |
| 8 or more Rooms | 48 (31.0%) | 4 (6.8%) |
| Total | 155 (100.0%) | 59 (100.0%) |
Housing Structure by Heating Type in Winterstown borough
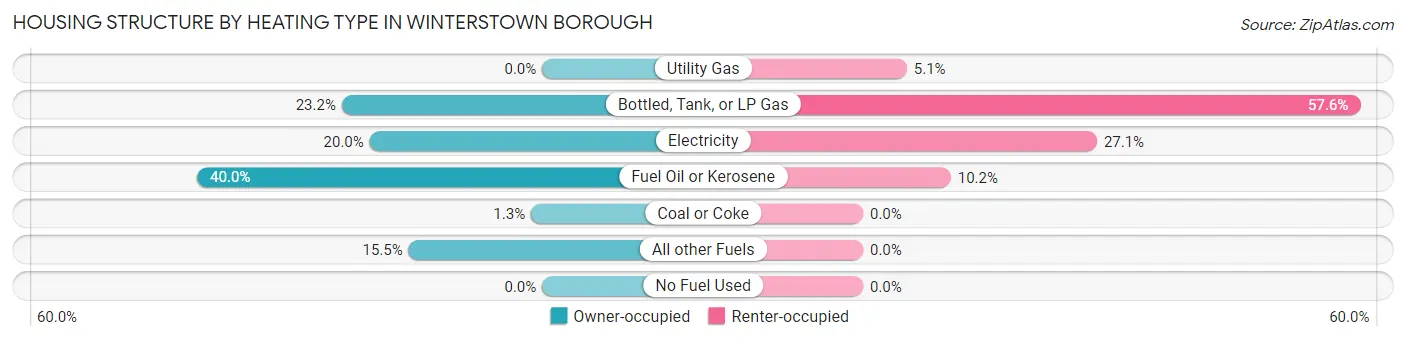
| Heating Type | Owner-occupied | Renter-occupied |
| Utility Gas | 0 (0.0%) | 3 (5.1%) |
| Bottled, Tank, or LP Gas | 36 (23.2%) | 34 (57.6%) |
| Electricity | 31 (20.0%) | 16 (27.1%) |
| Fuel Oil or Kerosene | 62 (40.0%) | 6 (10.2%) |
| Coal or Coke | 2 (1.3%) | 0 (0.0%) |
| All other Fuels | 24 (15.5%) | 0 (0.0%) |
| No Fuel Used | 0 (0.0%) | 0 (0.0%) |
| Total | 155 (100.0%) | 59 (100.0%) |
Household Vehicle Usage in Winterstown borough
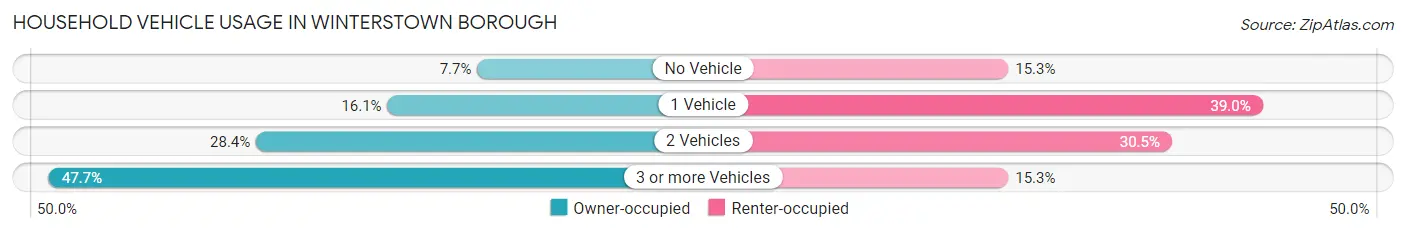
| Vehicles per Household | Owner-occupied | Renter-occupied |
| No Vehicle | 12 (7.7%) | 9 (15.2%) |
| 1 Vehicle | 25 (16.1%) | 23 (39.0%) |
| 2 Vehicles | 44 (28.4%) | 18 (30.5%) |
| 3 or more Vehicles | 74 (47.7%) | 9 (15.2%) |
| Total | 155 (100.0%) | 59 (100.0%) |
Real Estate & Mortgages in Winterstown borough
Real Estate and Mortgage Overview in Winterstown borough
| Characteristic | Without Mortgage | With Mortgage |
| Housing Units | 69 | 86 |
| Median Property Value | $179,200 | $246,200 |
| Median Household Income | $29,659 | $19 |
| Monthly Housing Costs | $725 | $5 |
| Real Estate Taxes | $3,950 | $2 |
Property Value by Mortgage Status in Winterstown borough
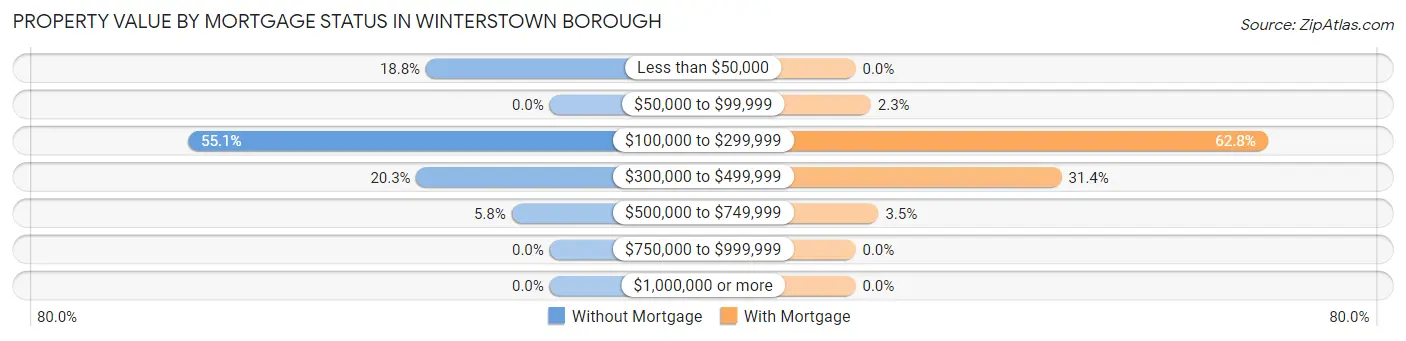
| Property Value | Without Mortgage | With Mortgage |
| Less than $50,000 | 13 (18.8%) | 0 (0.0%) |
| $50,000 to $99,999 | 0 (0.0%) | 2 (2.3%) |
| $100,000 to $299,999 | 38 (55.1%) | 54 (62.8%) |
| $300,000 to $499,999 | 14 (20.3%) | 27 (31.4%) |
| $500,000 to $749,999 | 4 (5.8%) | 3 (3.5%) |
| $750,000 to $999,999 | 0 (0.0%) | 0 (0.0%) |
| $1,000,000 or more | 0 (0.0%) | 0 (0.0%) |
| Total | 69 (100.0%) | 86 (100.0%) |
Household Income by Mortgage Status in Winterstown borough
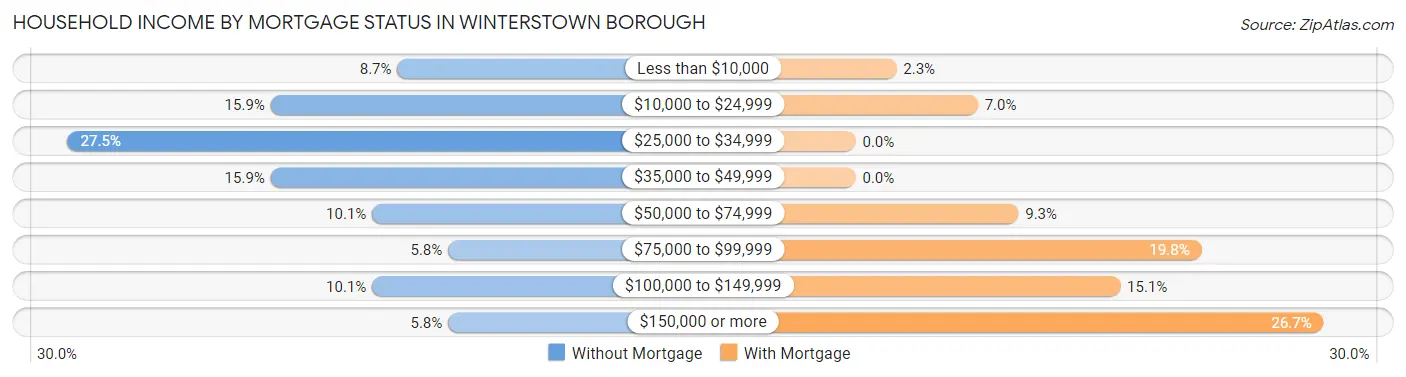
| Household Income | Without Mortgage | With Mortgage |
| Less than $10,000 | 6 (8.7%) | 2 (2.3%) |
| $10,000 to $24,999 | 11 (15.9%) | 6 (7.0%) |
| $25,000 to $34,999 | 19 (27.5%) | 0 (0.0%) |
| $35,000 to $49,999 | 11 (15.9%) | 0 (0.0%) |
| $50,000 to $74,999 | 7 (10.1%) | 8 (9.3%) |
| $75,000 to $99,999 | 4 (5.8%) | 17 (19.8%) |
| $100,000 to $149,999 | 7 (10.1%) | 13 (15.1%) |
| $150,000 or more | 4 (5.8%) | 23 (26.7%) |
| Total | 69 (100.0%) | 86 (100.0%) |
Property Value to Household Income Ratio in Winterstown borough
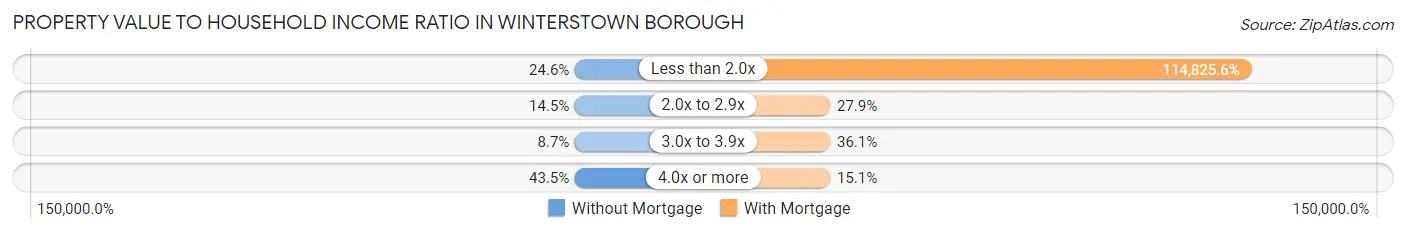
| Value-to-Income Ratio | Without Mortgage | With Mortgage |
| Less than 2.0x | 17 (24.6%) | 98,750 (114,825.6%) |
| 2.0x to 2.9x | 10 (14.5%) | 24 (27.9%) |
| 3.0x to 3.9x | 6 (8.7%) | 31 (36.0%) |
| 4.0x or more | 30 (43.5%) | 13 (15.1%) |
| Total | 69 (100.0%) | 86 (100.0%) |
Real Estate Taxes by Mortgage Status in Winterstown borough
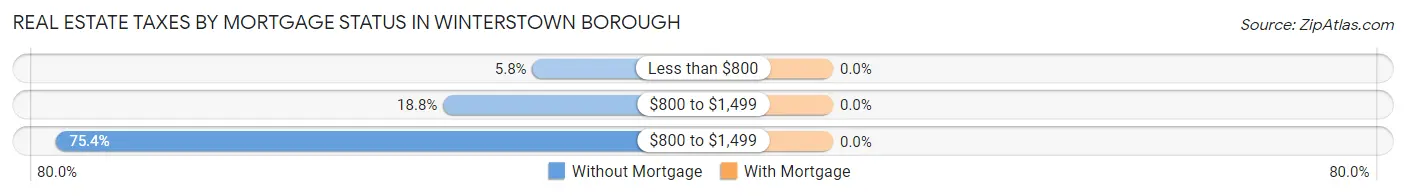
| Property Taxes | Without Mortgage | With Mortgage |
| Less than $800 | 4 (5.8%) | 0 (0.0%) |
| $800 to $1,499 | 13 (18.8%) | 0 (0.0%) |
| $800 to $1,499 | 52 (75.4%) | 0 (0.0%) |
| Total | 69 (100.0%) | 86 (100.0%) |
Health & Disability in Winterstown borough
Health Insurance Coverage by Age in Winterstown borough
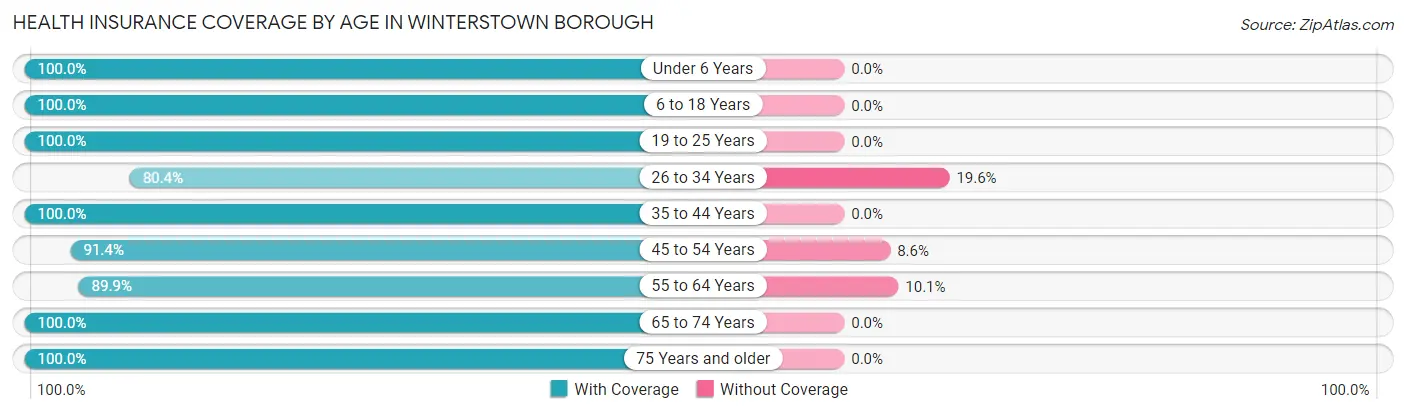
| Age Bracket | With Coverage | Without Coverage |
| Under 6 Years | 36 (100.0%) | 0 (0.0%) |
| 6 to 18 Years | 61 (100.0%) | 0 (0.0%) |
| 19 to 25 Years | 28 (100.0%) | 0 (0.0%) |
| 26 to 34 Years | 41 (80.4%) | 10 (19.6%) |
| 35 to 44 Years | 46 (100.0%) | 0 (0.0%) |
| 45 to 54 Years | 64 (91.4%) | 6 (8.6%) |
| 55 to 64 Years | 107 (89.9%) | 12 (10.1%) |
| 65 to 74 Years | 55 (100.0%) | 0 (0.0%) |
| 75 Years and older | 39 (100.0%) | 0 (0.0%) |
| Total | 477 (94.5%) | 28 (5.5%) |
Health Insurance Coverage by Citizenship Status in Winterstown borough
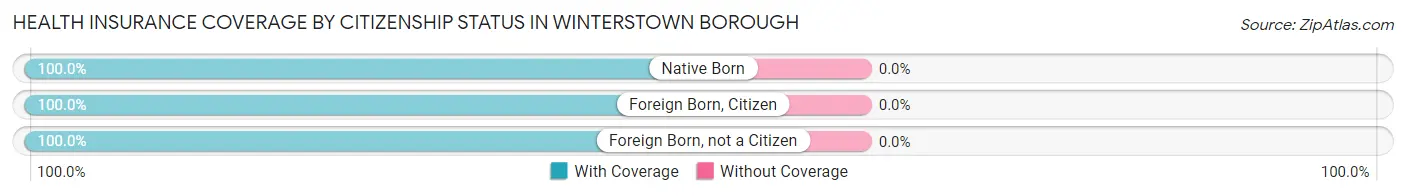
| Citizenship Status | With Coverage | Without Coverage |
| Native Born | 36 (100.0%) | 0 (0.0%) |
| Foreign Born, Citizen | 61 (100.0%) | 0 (0.0%) |
| Foreign Born, not a Citizen | 28 (100.0%) | 0 (0.0%) |
Health Insurance Coverage by Household Income in Winterstown borough
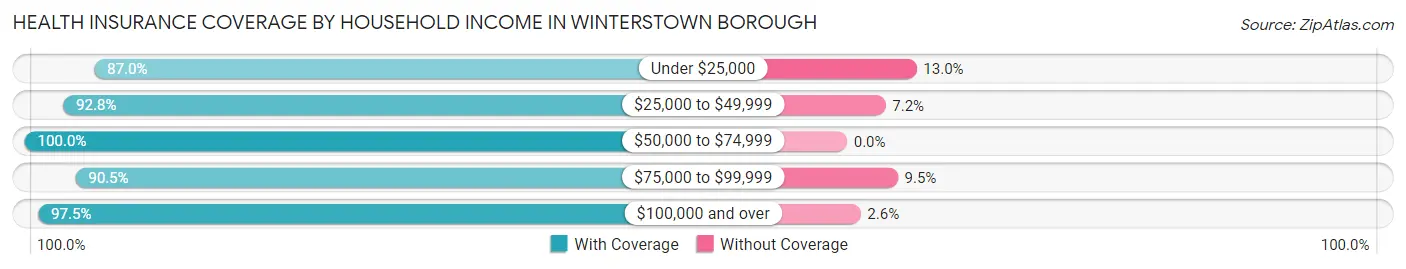
| Household Income | With Coverage | Without Coverage |
| Under $25,000 | 40 (87.0%) | 6 (13.0%) |
| $25,000 to $49,999 | 90 (92.8%) | 7 (7.2%) |
| $50,000 to $74,999 | 61 (100.0%) | 0 (0.0%) |
| $75,000 to $99,999 | 95 (90.5%) | 10 (9.5%) |
| $100,000 and over | 191 (97.5%) | 5 (2.5%) |
Public vs Private Health Insurance Coverage by Age in Winterstown borough
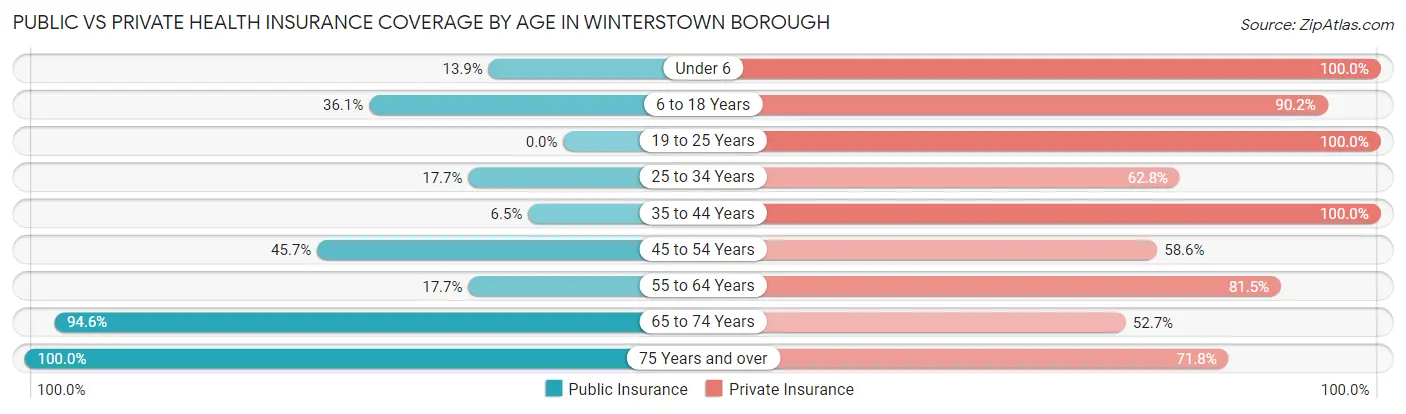
| Age Bracket | Public Insurance | Private Insurance |
| Under 6 | 5 (13.9%) | 36 (100.0%) |
| 6 to 18 Years | 22 (36.1%) | 55 (90.2%) |
| 19 to 25 Years | 0 (0.0%) | 28 (100.0%) |
| 25 to 34 Years | 9 (17.6%) | 32 (62.7%) |
| 35 to 44 Years | 3 (6.5%) | 46 (100.0%) |
| 45 to 54 Years | 32 (45.7%) | 41 (58.6%) |
| 55 to 64 Years | 21 (17.6%) | 97 (81.5%) |
| 65 to 74 Years | 52 (94.6%) | 29 (52.7%) |
| 75 Years and over | 39 (100.0%) | 28 (71.8%) |
| Total | 183 (36.2%) | 392 (77.6%) |
Disability Status by Sex by Age in Winterstown borough
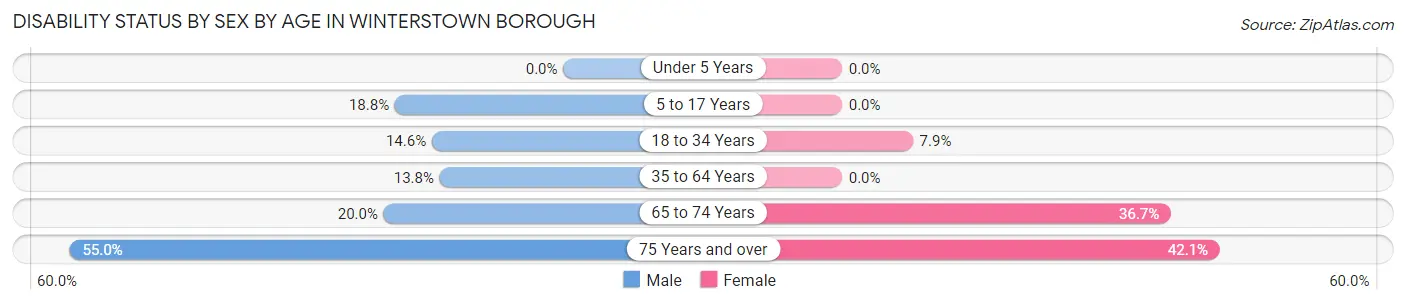
| Age Bracket | Male | Female |
| Under 5 Years | 0 (0.0%) | 0 (0.0%) |
| 5 to 17 Years | 6 (18.8%) | 0 (0.0%) |
| 18 to 34 Years | 6 (14.6%) | 3 (7.9%) |
| 35 to 64 Years | 15 (13.8%) | 0 (0.0%) |
| 65 to 74 Years | 5 (20.0%) | 11 (36.7%) |
| 75 Years and over | 11 (55.0%) | 8 (42.1%) |
Disability Class by Sex by Age in Winterstown borough
Disability Class: Hearing Difficulty
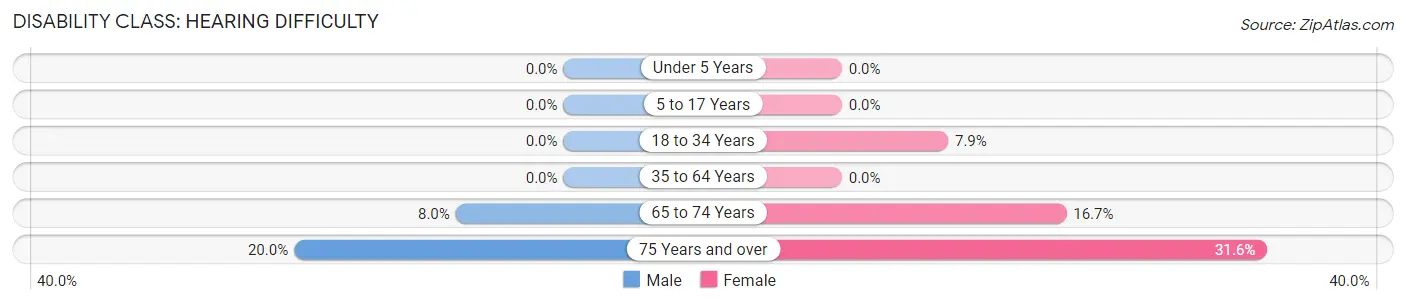
| Age Bracket | Male | Female |
| Under 5 Years | 0 (0.0%) | 0 (0.0%) |
| 5 to 17 Years | 0 (0.0%) | 0 (0.0%) |
| 18 to 34 Years | 0 (0.0%) | 3 (7.9%) |
| 35 to 64 Years | 0 (0.0%) | 0 (0.0%) |
| 65 to 74 Years | 2 (8.0%) | 5 (16.7%) |
| 75 Years and over | 4 (20.0%) | 6 (31.6%) |
Disability Class: Vision Difficulty
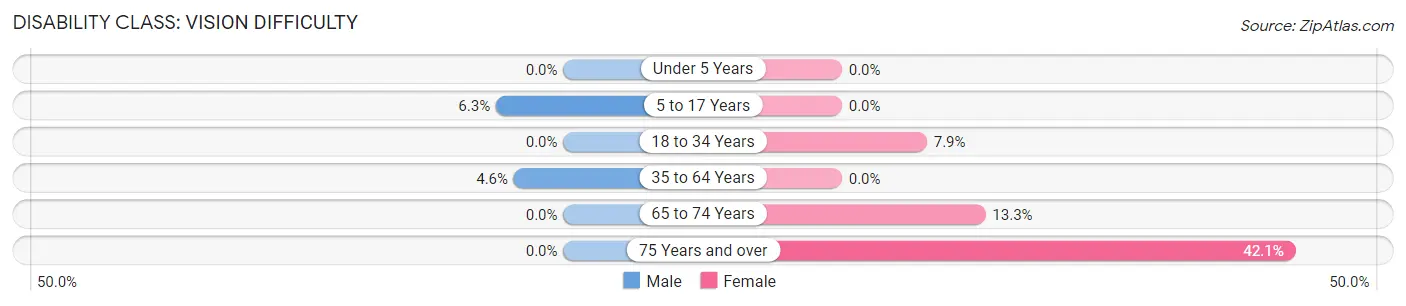
| Age Bracket | Male | Female |
| Under 5 Years | 0 (0.0%) | 0 (0.0%) |
| 5 to 17 Years | 2 (6.2%) | 0 (0.0%) |
| 18 to 34 Years | 0 (0.0%) | 3 (7.9%) |
| 35 to 64 Years | 5 (4.6%) | 0 (0.0%) |
| 65 to 74 Years | 0 (0.0%) | 4 (13.3%) |
| 75 Years and over | 0 (0.0%) | 8 (42.1%) |
Disability Class: Cognitive Difficulty
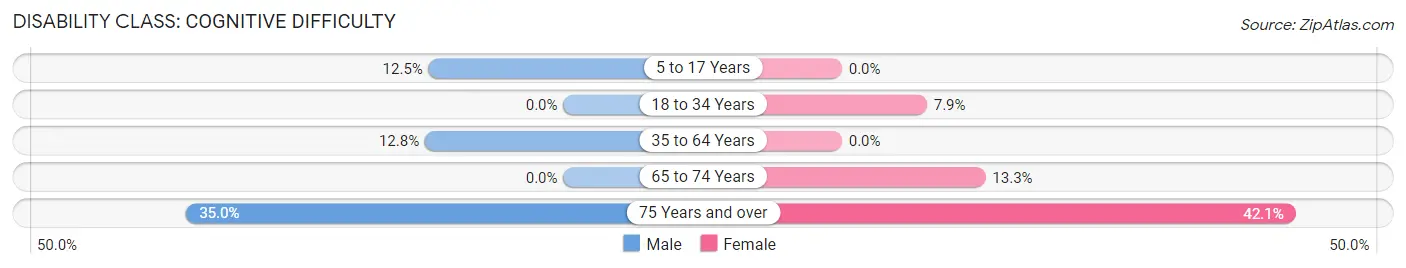
| Age Bracket | Male | Female |
| 5 to 17 Years | 4 (12.5%) | 0 (0.0%) |
| 18 to 34 Years | 0 (0.0%) | 3 (7.9%) |
| 35 to 64 Years | 14 (12.8%) | 0 (0.0%) |
| 65 to 74 Years | 0 (0.0%) | 4 (13.3%) |
| 75 Years and over | 7 (35.0%) | 8 (42.1%) |
Disability Class: Ambulatory Difficulty
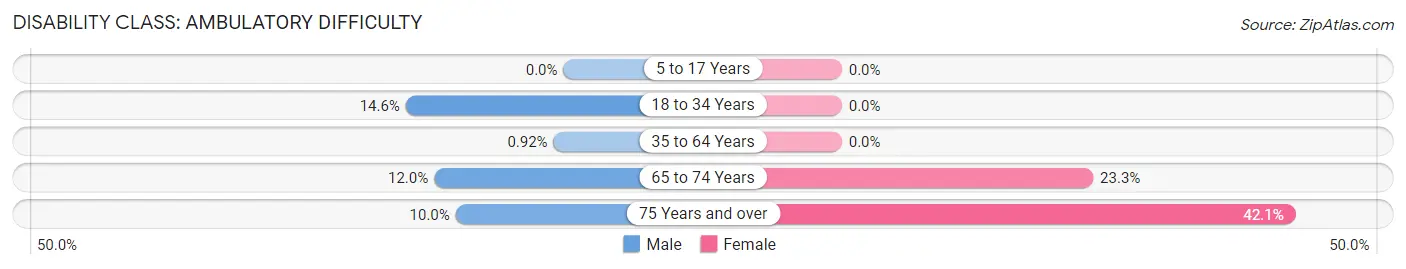
| Age Bracket | Male | Female |
| 5 to 17 Years | 0 (0.0%) | 0 (0.0%) |
| 18 to 34 Years | 6 (14.6%) | 0 (0.0%) |
| 35 to 64 Years | 1 (0.9%) | 0 (0.0%) |
| 65 to 74 Years | 3 (12.0%) | 7 (23.3%) |
| 75 Years and over | 2 (10.0%) | 8 (42.1%) |
Disability Class: Self-Care Difficulty
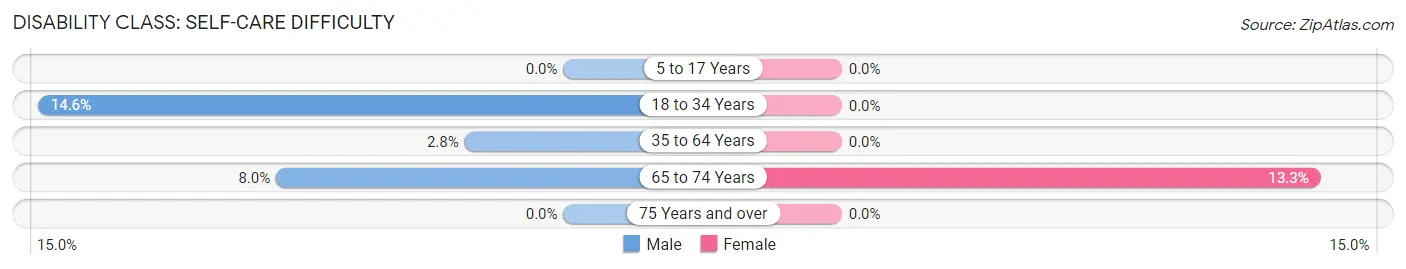
| Age Bracket | Male | Female |
| 5 to 17 Years | 0 (0.0%) | 0 (0.0%) |
| 18 to 34 Years | 6 (14.6%) | 0 (0.0%) |
| 35 to 64 Years | 3 (2.8%) | 0 (0.0%) |
| 65 to 74 Years | 2 (8.0%) | 4 (13.3%) |
| 75 Years and over | 0 (0.0%) | 0 (0.0%) |
Technology Access in Winterstown borough
Computing Device Access in Winterstown borough
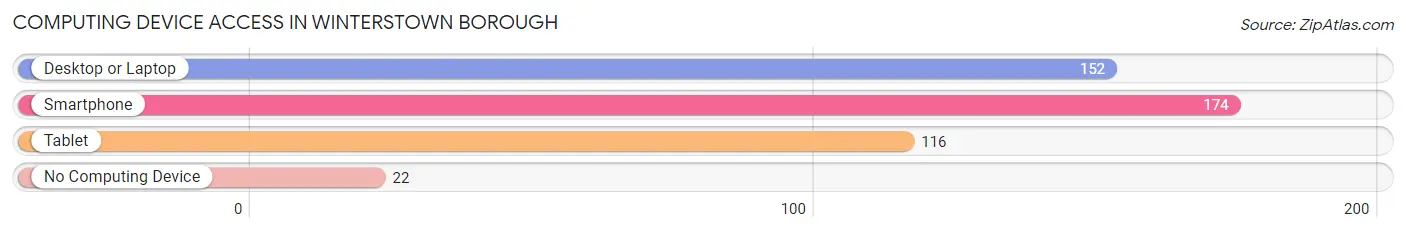
| Device Type | # Households | % Households |
| Desktop or Laptop | 152 | 71.0% |
| Smartphone | 174 | 81.3% |
| Tablet | 116 | 54.2% |
| No Computing Device | 22 | 10.3% |
| Total | 214 | 100.0% |
Internet Access in Winterstown borough
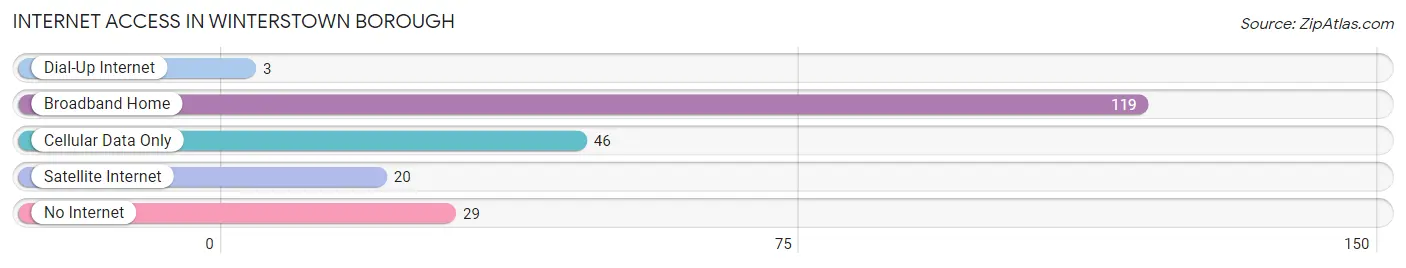
| Internet Type | # Households | % Households |
| Dial-Up Internet | 3 | 1.4% |
| Broadband Home | 119 | 55.6% |
| Cellular Data Only | 46 | 21.5% |
| Satellite Internet | 20 | 9.3% |
| No Internet | 29 | 13.6% |
| Total | 214 | 100.0% |
Winterstown borough Summary
Winterstown Borough is a small borough located in York County, Pennsylvania. It is situated in the southeastern corner of the county, just north of the Susquehanna River. The borough is bordered by East Hopewell Township to the north, Lower Chanceford Township to the east, and York Township to the south and west. The population of Winterstown Borough was 1,093 at the 2010 census.
History
The area that is now Winterstown Borough was first settled in the late 1700s by German immigrants. The first settler was John Winter, who purchased land in the area in 1790. The area was known as Winterstown until 1845, when it was incorporated as a borough. The borough was named after John Winter, who was the first settler in the area.
The borough was a small farming community until the late 1800s, when the railroad was built through the area. This brought new industry and jobs to the area, and the population began to grow. The borough was home to several factories, including a brickyard, a sawmill, and a flour mill.
Geography
Winterstown Borough is located at 39°45'45" North, 76°37'45" West (39.7625, -76.6292). According to the United States Census Bureau, the borough has a total area of 0.6 square miles (1.6 km2), all of it land.
The borough is located in the Piedmont region of Pennsylvania, and is part of the Susquehanna Valley. The terrain is mostly flat, with some rolling hills. The borough is located in the humid continental climate zone, with hot, humid summers and cold, snowy winters.
Economy
The economy of Winterstown Borough is largely based on agriculture and manufacturing. The borough is home to several farms, which produce a variety of crops, including corn, soybeans, and hay. The borough is also home to several small manufacturing businesses, including a furniture factory and a printing company.
The borough is also home to several small businesses, including restaurants, retail stores, and professional services. The borough is home to several churches, as well as a library and a post office.
Demographics
As of the 2010 census, the population of Winterstown Borough was 1,093. The racial makeup of the borough was 97.2% White, 0.7% African American, 0.2% Native American, 0.2% Asian, 0.2% from other races, and 1.7% from two or more races. Hispanic or Latino of any race were 1.2% of the population.
The median household income in the borough was $45,833, and the median family income was $51,250. The per capita income for the borough was $20,945. About 8.2% of families and 10.2% of the population were below the poverty line, including 14.3% of those under age 18 and 5.2% of those age 65 or over.
Common Questions
What is Per Capita Income in Winterstown borough?
Per Capita income in Winterstown borough is $34,207.
What is the Median Family Income in Winterstown borough?
Median Family Income in Winterstown borough is $73,750.
What is the Median Household income in Winterstown borough?
Median Household Income in Winterstown borough is $59,167.
What is Income or Wage Gap in Winterstown borough?
Income or Wage Gap in Winterstown borough is 43.7%.
Women in Winterstown borough earn 56.3 cents for every dollar earned by a man.
What is Inequality or Gini Index in Winterstown borough?
Inequality or Gini Index in Winterstown borough is 0.43.
What is the Total Population of Winterstown borough?
Total Population of Winterstown borough is 505.
What is the Total Male Population of Winterstown borough?
Total Male Population of Winterstown borough is 227.
What is the Total Female Population of Winterstown borough?
Total Female Population of Winterstown borough is 278.
What is the Ratio of Males per 100 Females in Winterstown borough?
There are 81.65 Males per 100 Females in Winterstown borough.
What is the Ratio of Females per 100 Males in Winterstown borough?
There are 122.47 Females per 100 Males in Winterstown borough.
What is the Median Population Age in Winterstown borough?
Median Population Age in Winterstown borough is 48.8 Years.
What is the Average Family Size in Winterstown borough
Average Family Size in Winterstown borough is 2.8 People.
What is the Average Household Size in Winterstown borough
Average Household Size in Winterstown borough is 2.4 People.
How Large is the Labor Force in Winterstown borough?
There are 269 People in the Labor Forcein in Winterstown borough.
What is the Percentage of People in the Labor Force in Winterstown borough?
65.0% of People are in the Labor Force in Winterstown borough.
What is the Unemployment Rate in Winterstown borough?
Unemployment Rate in Winterstown borough is 5.6%.