Windber borough, PA Map & Demographics
Windber borough Overview
$30,545
PER CAPITA INCOME
$61,607
AVG FAMILY INCOME
$48,299
AVG HOUSEHOLD INCOME
28.5%
WAGE / INCOME GAP [ % ]
71.5¢/ $1
WAGE / INCOME GAP [ $ ]
0.46
INEQUALITY / GINI INDEX
3,930
TOTAL POPULATION
1,867
MALE POPULATION
2,063
FEMALE POPULATION
90.50
MALES / 100 FEMALES
110.50
FEMALES / 100 MALES
41.5
MEDIAN AGE
2.9
AVG FAMILY SIZE
2.2
AVG HOUSEHOLD SIZE
2,012
LABOR FORCE [ PEOPLE ]
65.1%
PERCENT IN LABOR FORCE
2.6%
UNEMPLOYMENT RATE
Income in Windber borough
Income Overview in Windber borough
Per Capita Income in Windber borough is $30,545, while median incomes of families and households are $61,607 and $48,299 respectively.
| Characteristic | Number | Measure |
| Per Capita Income | 3,930 | $30,545 |
| Median Family Income | 1,047 | $61,607 |
| Mean Family Income | 1,047 | $75,526 |
| Median Household Income | 1,755 | $48,299 |
| Mean Household Income | 1,755 | $67,221 |
| Income Deficit | 1,047 | $0 |
| Wage / Income Gap (%) | 3,930 | 28.51% |
| Wage / Income Gap ($) | 3,930 | 71.49¢ per $1 |
| Gini / Inequality Index | 3,930 | 0.46 |
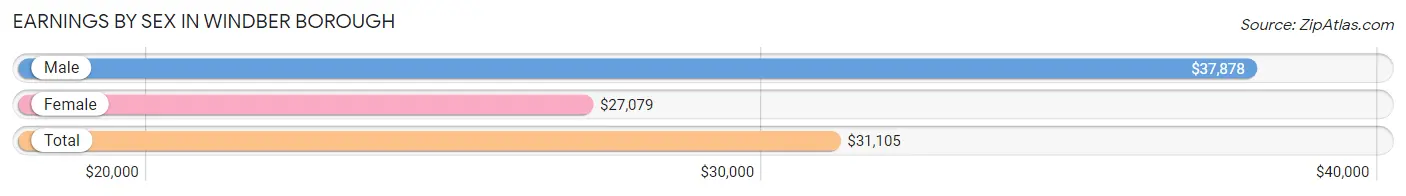
Earnings by Sex in Windber borough
Average Earnings in Windber borough are $31,105, $37,878 for men and $27,079 for women, a difference of 28.5%.
| Sex | Number | Average Earnings |
| Male | 1,083 (51.5%) | $37,878 |
| Female | 1,019 (48.5%) | $27,079 |
| Total | 2,102 (100.0%) | $31,105 |
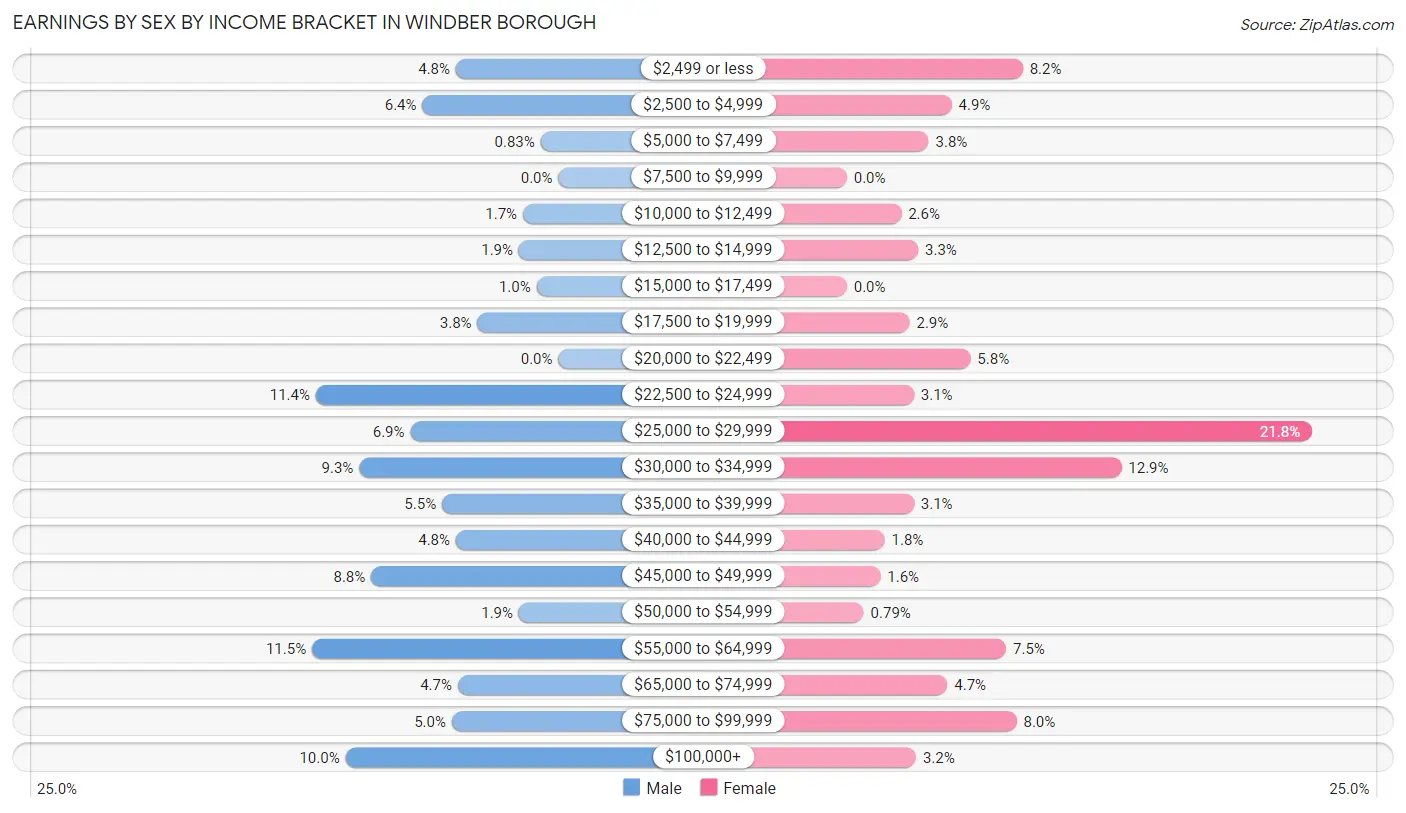
Earnings by Sex by Income Bracket in Windber borough
The most common earnings brackets in Windber borough are $55,000 to $64,999 for men (125 | 11.5%) and $25,000 to $29,999 for women (222 | 21.8%).
| Income | Male | Female |
| $2,499 or less | 52 (4.8%) | 84 (8.2%) |
| $2,500 to $4,999 | 69 (6.4%) | 50 (4.9%) |
| $5,000 to $7,499 | 9 (0.8%) | 39 (3.8%) |
| $7,500 to $9,999 | 0 (0.0%) | 0 (0.0%) |
| $10,000 to $12,499 | 18 (1.7%) | 26 (2.5%) |
| $12,500 to $14,999 | 20 (1.8%) | 34 (3.3%) |
| $15,000 to $17,499 | 11 (1.0%) | 0 (0.0%) |
| $17,500 to $19,999 | 41 (3.8%) | 30 (2.9%) |
| $20,000 to $22,499 | 0 (0.0%) | 59 (5.8%) |
| $22,500 to $24,999 | 123 (11.4%) | 32 (3.1%) |
| $25,000 to $29,999 | 75 (6.9%) | 222 (21.8%) |
| $30,000 to $34,999 | 101 (9.3%) | 131 (12.9%) |
| $35,000 to $39,999 | 59 (5.4%) | 32 (3.1%) |
| $40,000 to $44,999 | 52 (4.8%) | 18 (1.8%) |
| $45,000 to $49,999 | 95 (8.8%) | 16 (1.6%) |
| $50,000 to $54,999 | 20 (1.8%) | 8 (0.8%) |
| $55,000 to $64,999 | 125 (11.5%) | 76 (7.5%) |
| $65,000 to $74,999 | 51 (4.7%) | 48 (4.7%) |
| $75,000 to $99,999 | 54 (5.0%) | 81 (8.0%) |
| $100,000+ | 108 (10.0%) | 33 (3.2%) |
| Total | 1,083 (100.0%) | 1,019 (100.0%) |
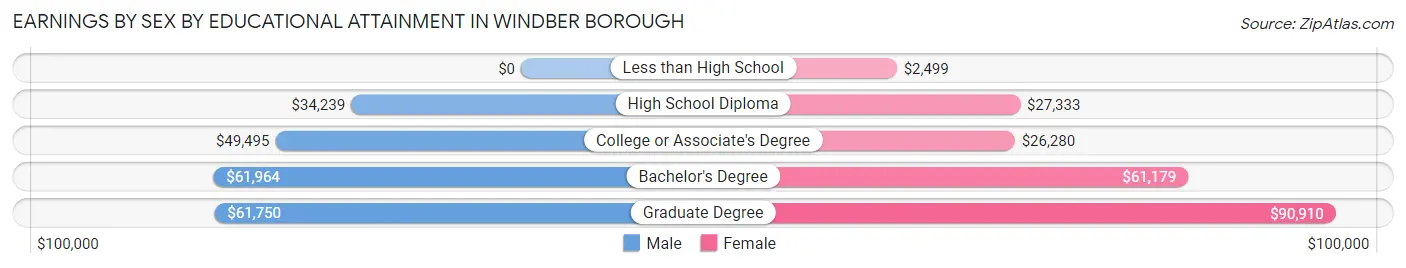
Earnings by Sex by Educational Attainment in Windber borough
Average earnings in Windber borough are $42,214 for men and $27,964 for women, a difference of 33.8%. Men with an educational attainment of bachelor's degree enjoy the highest average annual earnings of $61,964, while those with high school diploma education earn the least with $34,239. Women with an educational attainment of graduate degree earn the most with the average annual earnings of $90,910, while those with less than high school education have the smallest earnings of $2,499.
| Educational Attainment | Male Income | Female Income |
| Less than High School | - | - |
| High School Diploma | $34,239 | $27,333 |
| College or Associate's Degree | $49,495 | $26,280 |
| Bachelor's Degree | $61,964 | $61,179 |
| Graduate Degree | $61,750 | $90,910 |
| Total | $42,214 | $27,964 |
Family Income in Windber borough
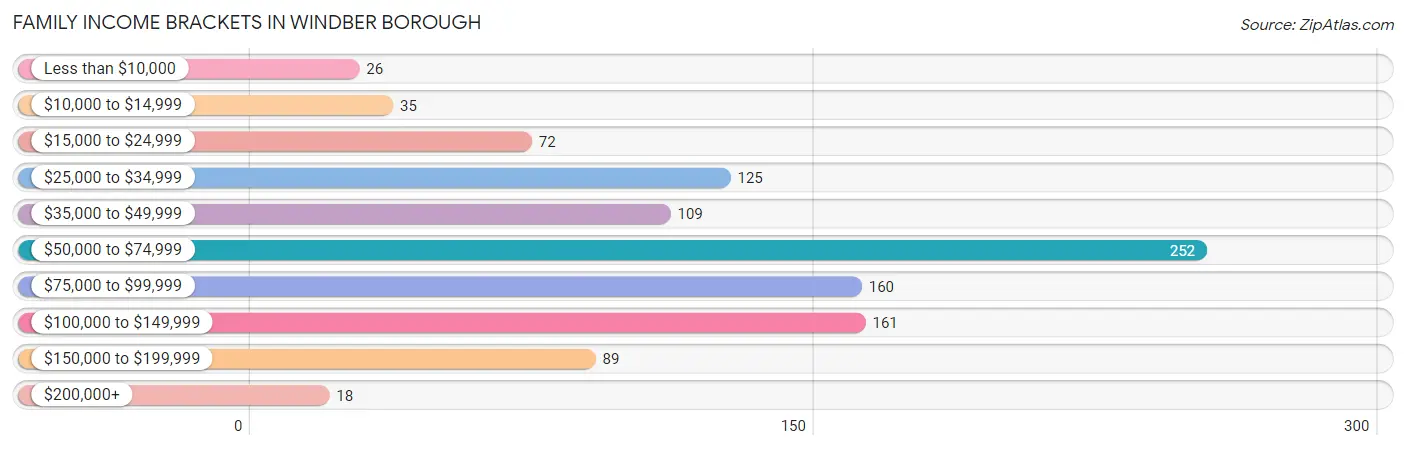
Family Income Brackets in Windber borough
According to the Windber borough family income data, there are 252 families falling into the $50,000 to $74,999 income range, which is the most common income bracket and makes up 24.1% of all families. Conversely, the $200,000+ income bracket is the least frequent group with only 18 families (1.7%) belonging to this category.
| Income Bracket | # Families | % Families |
| Less than $10,000 | 26 | 2.5% |
| $10,000 to $14,999 | 35 | 3.3% |
| $15,000 to $24,999 | 72 | 6.9% |
| $25,000 to $34,999 | 125 | 11.9% |
| $35,000 to $49,999 | 109 | 10.4% |
| $50,000 to $74,999 | 252 | 24.1% |
| $75,000 to $99,999 | 160 | 15.3% |
| $100,000 to $149,999 | 161 | 15.4% |
| $150,000 to $199,999 | 89 | 8.5% |
| $200,000+ | 18 | 1.7% |
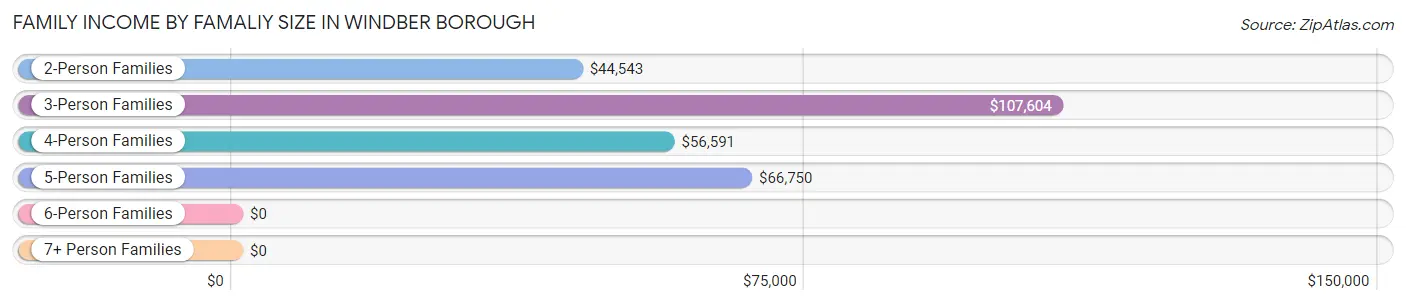
Family Income by Famaliy Size in Windber borough
3-person families (180 | 17.2%) account for the highest median family income in Windber borough with $107,604 per family, while 3-person families (180 | 17.2%) have the highest median income of $35,868 per family member.
| Income Bracket | # Families | Median Income |
| 2-Person Families | 527 (50.3%) | $44,543 |
| 3-Person Families | 180 (17.2%) | $107,604 |
| 4-Person Families | 272 (26.0%) | $56,591 |
| 5-Person Families | 56 (5.3%) | $66,750 |
| 6-Person Families | 12 (1.1%) | $0 |
| 7+ Person Families | 0 (0.0%) | $0 |
| Total | 1,047 (100.0%) | $61,607 |
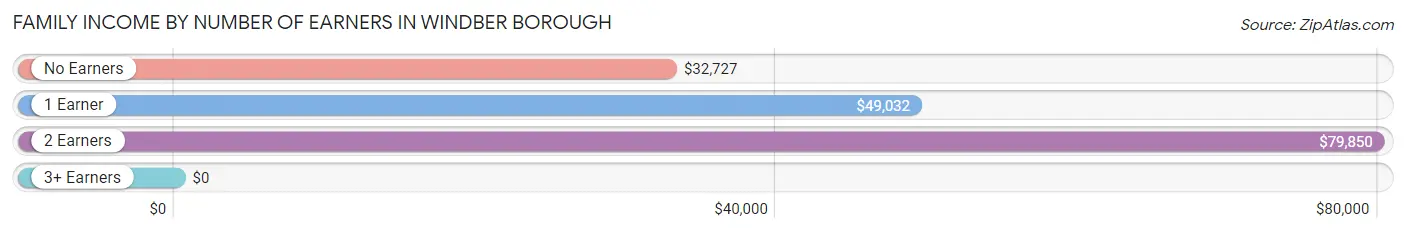
Family Income by Number of Earners in Windber borough
| Number of Earners | # Families | Median Income |
| No Earners | 150 (14.3%) | $32,727 |
| 1 Earner | 338 (32.3%) | $49,032 |
| 2 Earners | 419 (40.0%) | $79,850 |
| 3+ Earners | 140 (13.4%) | $0 |
| Total | 1,047 (100.0%) | $61,607 |
Household Income in Windber borough
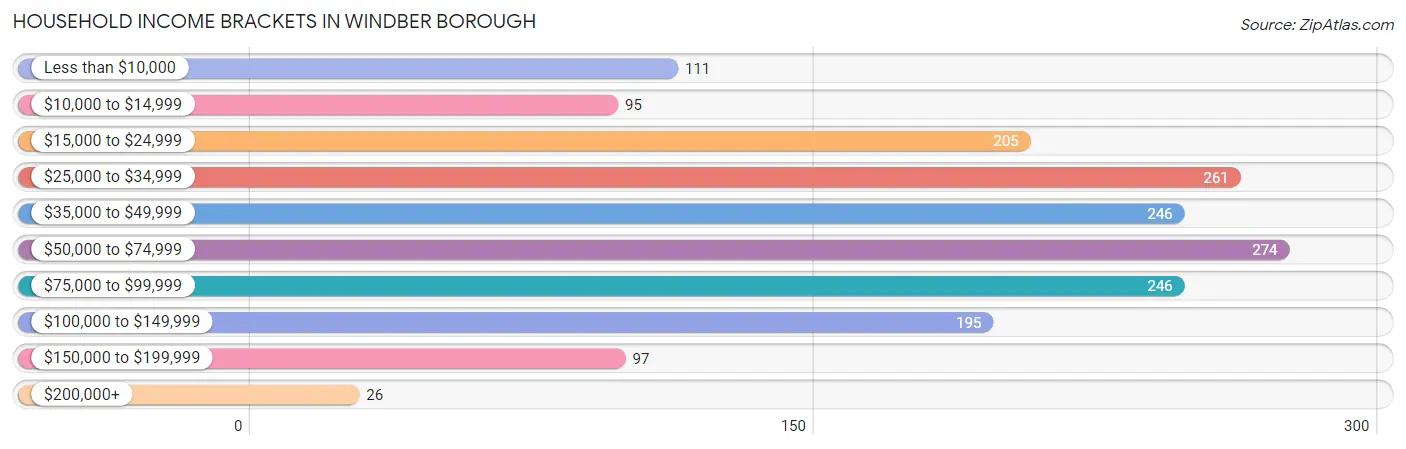
Household Income Brackets in Windber borough
With 274 households falling in the category, the $50,000 to $74,999 income range is the most frequent in Windber borough, accounting for 15.6% of all households. In contrast, only 26 households (1.5%) fall into the $200,000+ income bracket, making it the least populous group.
| Income Bracket | # Households | % Households |
| Less than $10,000 | 111 | 6.3% |
| $10,000 to $14,999 | 95 | 5.4% |
| $15,000 to $24,999 | 205 | 11.7% |
| $25,000 to $34,999 | 261 | 14.9% |
| $35,000 to $49,999 | 246 | 14.0% |
| $50,000 to $74,999 | 274 | 15.6% |
| $75,000 to $99,999 | 246 | 14.0% |
| $100,000 to $149,999 | 195 | 11.1% |
| $150,000 to $199,999 | 97 | 5.5% |
| $200,000+ | 26 | 1.5% |
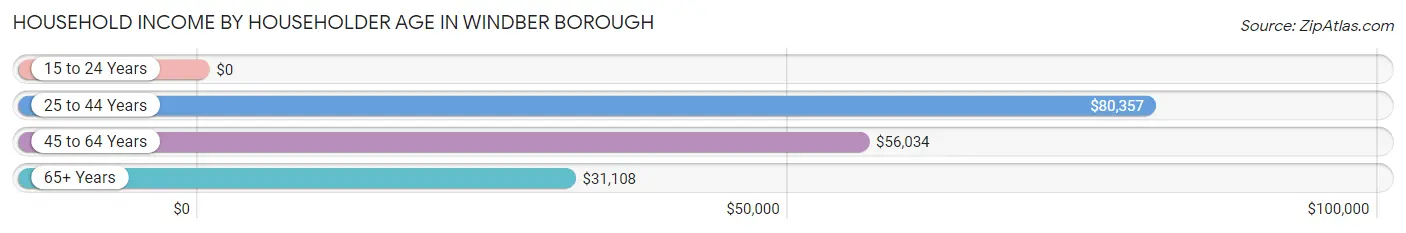
Household Income by Householder Age in Windber borough
The median household income in Windber borough is $48,299, with the highest median household income of $80,357 found in the 25 to 44 years age bracket for the primary householder. A total of 524 households (29.9%) fall into this category. Meanwhile, the 15 to 24 years age bracket for the primary householder has the lowest median household income of $0, with 25 households (1.4%) in this group.
| Income Bracket | # Households | Median Income |
| 15 to 24 Years | 25 (1.4%) | $0 |
| 25 to 44 Years | 524 (29.9%) | $80,357 |
| 45 to 64 Years | 681 (38.8%) | $56,034 |
| 65+ Years | 525 (29.9%) | $31,108 |
| Total | 1,755 (100.0%) | $48,299 |
Poverty in Windber borough
Income Below Poverty by Sex and Age in Windber borough
With 12.3% poverty level for males and 11.4% for females among the residents of Windber borough, 16 and 17 year old males and 65 to 74 year old females are the most vulnerable to poverty, with 8 males (40.0%) and 59 females (28.2%) in their respective age groups living below the poverty level.
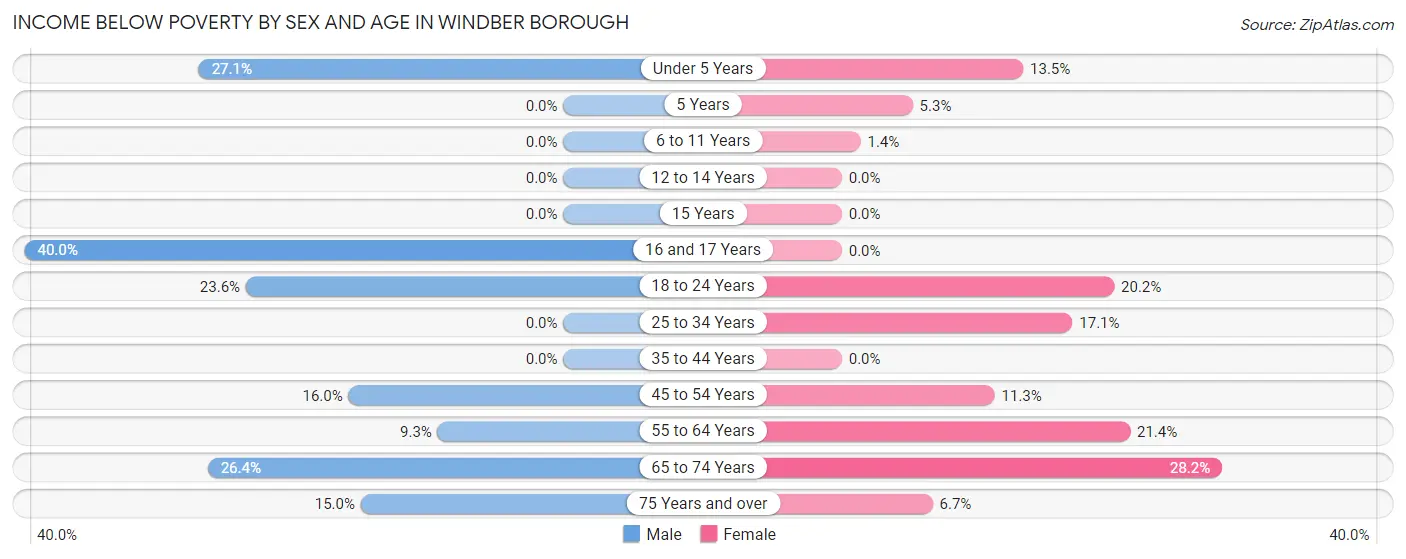
| Age Bracket | Male | Female |
| Under 5 Years | 62 (27.1%) | 7 (13.5%) |
| 5 Years | 0 (0.0%) | 3 (5.3%) |
| 6 to 11 Years | 0 (0.0%) | 2 (1.4%) |
| 12 to 14 Years | 0 (0.0%) | 0 (0.0%) |
| 15 Years | 0 (0.0%) | 0 (0.0%) |
| 16 and 17 Years | 8 (40.0%) | 0 (0.0%) |
| 18 to 24 Years | 33 (23.6%) | 18 (20.2%) |
| 25 to 34 Years | 0 (0.0%) | 44 (17.1%) |
| 35 to 44 Years | 0 (0.0%) | 0 (0.0%) |
| 45 to 54 Years | 52 (16.0%) | 27 (11.3%) |
| 55 to 64 Years | 25 (9.3%) | 58 (21.4%) |
| 65 to 74 Years | 33 (26.4%) | 59 (28.2%) |
| 75 Years and over | 17 (15.0%) | 18 (6.7%) |
| Total | 230 (12.3%) | 236 (11.4%) |
Income Above Poverty by Sex and Age in Windber borough
According to the poverty statistics in Windber borough, males aged 5 years and females aged 12 to 14 years are the age groups that are most secure financially, with 100.0% of males and 100.0% of females in these age groups living above the poverty line.
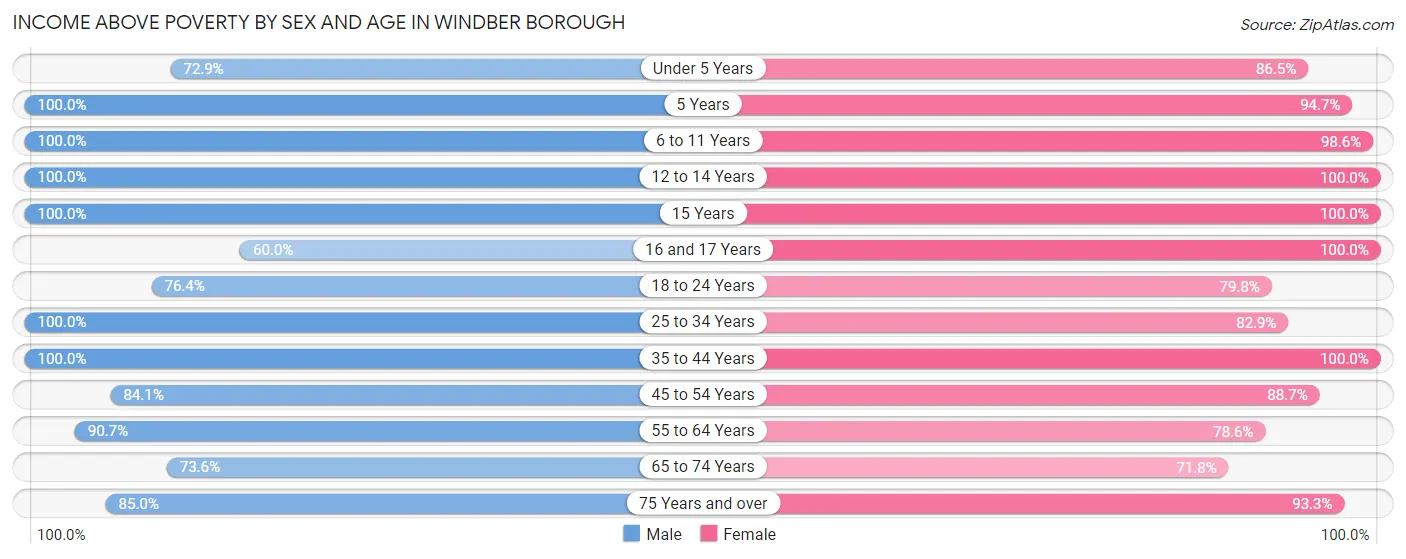
| Age Bracket | Male | Female |
| Under 5 Years | 167 (72.9%) | 45 (86.5%) |
| 5 Years | 38 (100.0%) | 54 (94.7%) |
| 6 to 11 Years | 72 (100.0%) | 142 (98.6%) |
| 12 to 14 Years | 95 (100.0%) | 75 (100.0%) |
| 15 Years | 6 (100.0%) | 71 (100.0%) |
| 16 and 17 Years | 12 (60.0%) | 21 (100.0%) |
| 18 to 24 Years | 107 (76.4%) | 71 (79.8%) |
| 25 to 34 Years | 234 (100.0%) | 213 (82.9%) |
| 35 to 44 Years | 201 (100.0%) | 312 (100.0%) |
| 45 to 54 Years | 274 (84.1%) | 211 (88.7%) |
| 55 to 64 Years | 243 (90.7%) | 213 (78.6%) |
| 65 to 74 Years | 92 (73.6%) | 150 (71.8%) |
| 75 Years and over | 96 (85.0%) | 249 (93.3%) |
| Total | 1,637 (87.7%) | 1,827 (88.6%) |
Income Below Poverty Among Married-Couple Families in Windber borough
The poverty statistics for married-couple families in Windber borough show that 2.1% or 15 of the total 719 families live below the poverty line. Families with no children have the highest poverty rate of 2.3%, comprising of 8 families. On the other hand, families with 3 or 4 children have the lowest poverty rate of 0.0%, which includes 0 families.
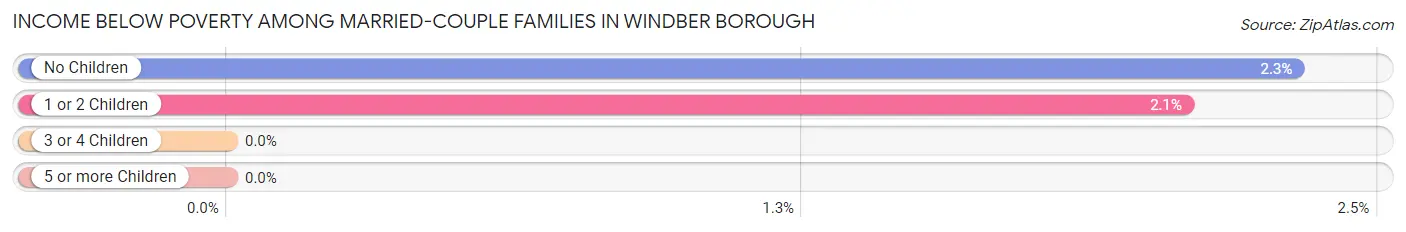
| Children | Above Poverty | Below Poverty |
| No Children | 337 (97.7%) | 8 (2.3%) |
| 1 or 2 Children | 330 (97.9%) | 7 (2.1%) |
| 3 or 4 Children | 37 (100.0%) | 0 (0.0%) |
| 5 or more Children | 0 (0.0%) | 0 (0.0%) |
| Total | 704 (97.9%) | 15 (2.1%) |
Income Below Poverty Among Single-Parent Households in Windber borough
According to the poverty data in Windber borough, 26.0% or 27 single-father households and 32.1% or 72 single-mother households are living below the poverty line. Among single-father households, those with 1 or 2 children have the highest poverty rate, with 27 households (32.9%) experiencing poverty. Likewise, among single-mother households, those with 1 or 2 children have the highest poverty rate, with 48 households (41.7%) falling below the poverty line.
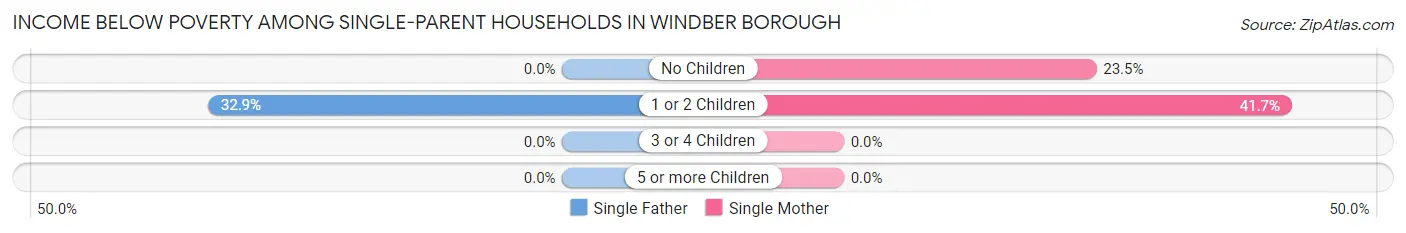
| Children | Single Father | Single Mother |
| No Children | 0 (0.0%) | 24 (23.5%) |
| 1 or 2 Children | 27 (32.9%) | 48 (41.7%) |
| 3 or 4 Children | 0 (0.0%) | 0 (0.0%) |
| 5 or more Children | 0 (0.0%) | 0 (0.0%) |
| Total | 27 (26.0%) | 72 (32.1%) |
Income Below Poverty Among Married-Couple vs Single-Parent Households in Windber borough
The poverty data for Windber borough shows that 15 of the married-couple family households (2.1%) and 99 of the single-parent households (30.2%) are living below the poverty level. Within the married-couple family households, those with no children have the highest poverty rate, with 8 households (2.3%) falling below the poverty line. Among the single-parent households, those with 1 or 2 children have the highest poverty rate, with 75 household (38.1%) living below poverty.
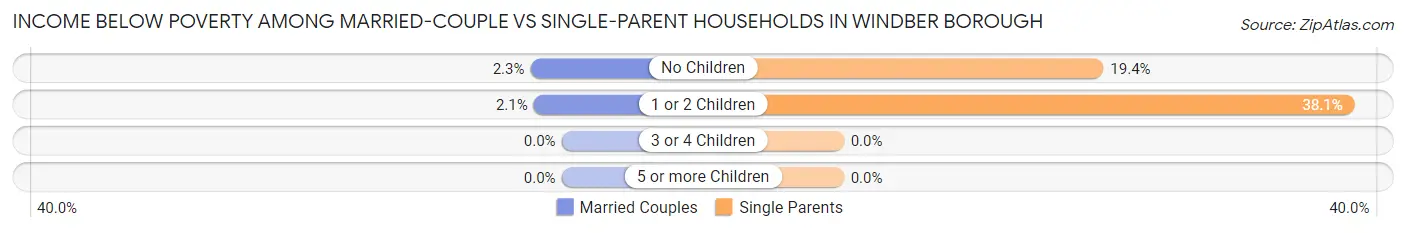
| Children | Married-Couple Families | Single-Parent Households |
| No Children | 8 (2.3%) | 24 (19.4%) |
| 1 or 2 Children | 7 (2.1%) | 75 (38.1%) |
| 3 or 4 Children | 0 (0.0%) | 0 (0.0%) |
| 5 or more Children | 0 (0.0%) | 0 (0.0%) |
| Total | 15 (2.1%) | 99 (30.2%) |
Race in Windber borough
The most populous races in Windber borough are White / Caucasian (3,909 | 99.5%), Two or more Races (21 | 0.5%), and Hispanic or Latino (5 | 0.1%).
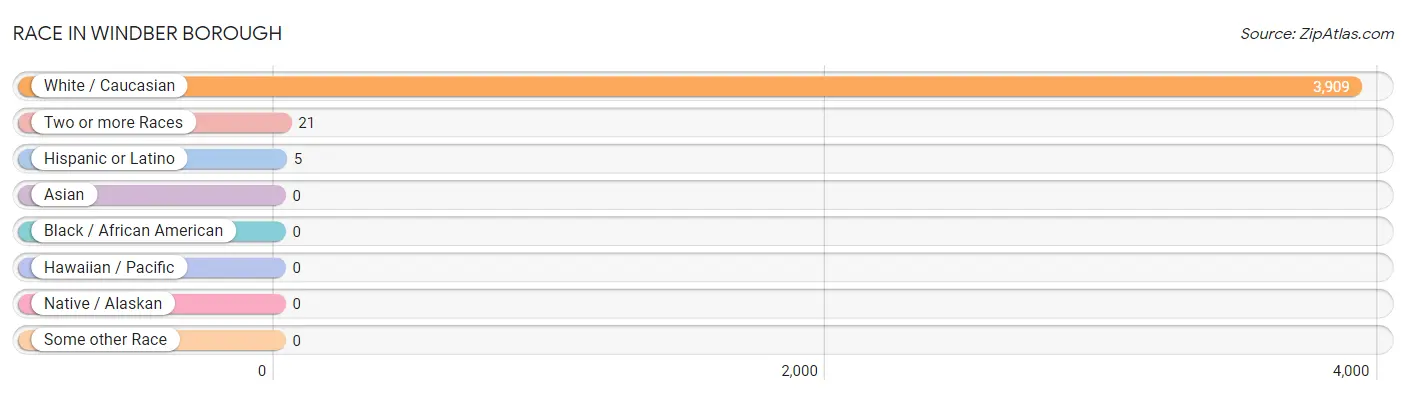
| Race | # Population | % Population |
| Asian | 0 | 0.0% |
| Black / African American | 0 | 0.0% |
| Hawaiian / Pacific | 0 | 0.0% |
| Hispanic or Latino | 5 | 0.1% |
| Native / Alaskan | 0 | 0.0% |
| White / Caucasian | 3,909 | 99.5% |
| Two or more Races | 21 | 0.5% |
| Some other Race | 0 | 0.0% |
| Total | 3,930 | 100.0% |
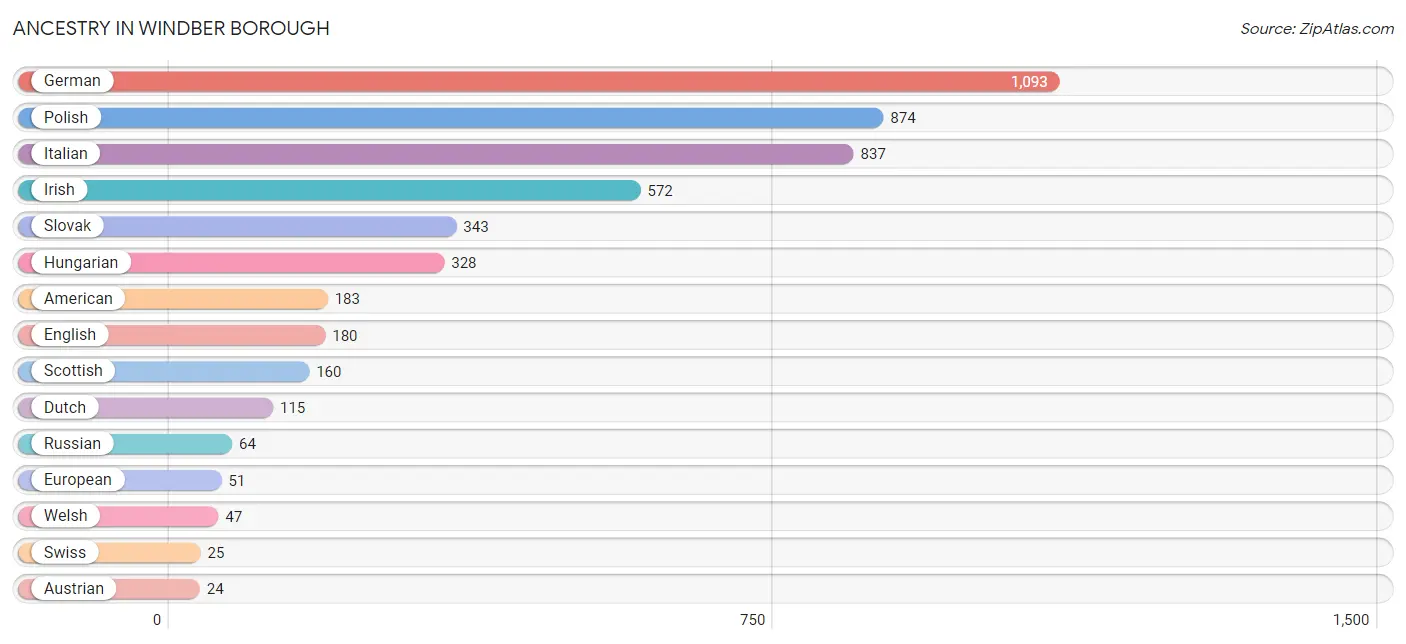
Ancestry in Windber borough
The most populous ancestries reported in Windber borough are German (1,093 | 27.8%), Polish (874 | 22.2%), Italian (837 | 21.3%), Irish (572 | 14.5%), and Slovak (343 | 8.7%), together accounting for 94.6% of all Windber borough residents.
| Ancestry | # Population | % Population |
| American | 183 | 4.7% |
| Arab | 6 | 0.2% |
| Austrian | 24 | 0.6% |
| Cherokee | 2 | 0.1% |
| Cuban | 5 | 0.1% |
| Czech | 21 | 0.5% |
| Czechoslovakian | 8 | 0.2% |
| Dutch | 115 | 2.9% |
| English | 180 | 4.6% |
| European | 51 | 1.3% |
| French | 17 | 0.4% |
| German | 1,093 | 27.8% |
| Greek | 8 | 0.2% |
| Hungarian | 328 | 8.4% |
| Irish | 572 | 14.5% |
| Italian | 837 | 21.3% |
| Lebanese | 6 | 0.2% |
| Lithuanian | 24 | 0.6% |
| Polish | 874 | 22.2% |
| Portuguese | 10 | 0.3% |
| Russian | 64 | 1.6% |
| Scotch-Irish | 8 | 0.2% |
| Scottish | 160 | 4.1% |
| Serbian | 15 | 0.4% |
| Slavic | 19 | 0.5% |
| Slovak | 343 | 8.7% |
| Swiss | 25 | 0.6% |
| Welsh | 47 | 1.2% |
| Yugoslavian | 8 | 0.2% | View All 29 Rows |
Immigrants in Windber borough

| Immigration Origin | # Population | % Population | View All 0 Rows |
Sex and Age in Windber borough
Sex and Age in Windber borough
The most populous age groups in Windber borough are 50 to 54 Years (237 | 12.7%) for men and 40 to 44 Years (215 | 10.4%) for women.
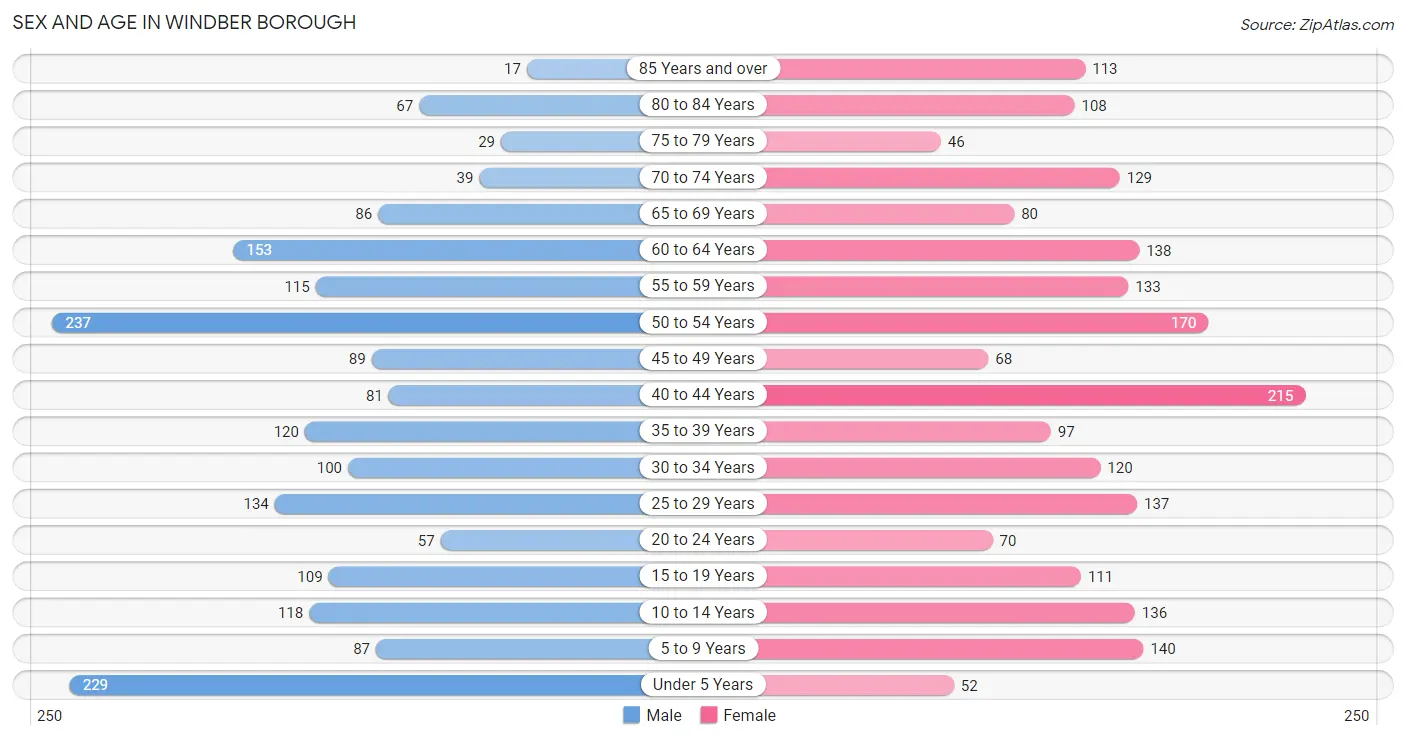
| Age Bracket | Male | Female |
| Under 5 Years | 229 (12.3%) | 52 (2.5%) |
| 5 to 9 Years | 87 (4.7%) | 140 (6.8%) |
| 10 to 14 Years | 118 (6.3%) | 136 (6.6%) |
| 15 to 19 Years | 109 (5.8%) | 111 (5.4%) |
| 20 to 24 Years | 57 (3.0%) | 70 (3.4%) |
| 25 to 29 Years | 134 (7.2%) | 137 (6.6%) |
| 30 to 34 Years | 100 (5.4%) | 120 (5.8%) |
| 35 to 39 Years | 120 (6.4%) | 97 (4.7%) |
| 40 to 44 Years | 81 (4.3%) | 215 (10.4%) |
| 45 to 49 Years | 89 (4.8%) | 68 (3.3%) |
| 50 to 54 Years | 237 (12.7%) | 170 (8.2%) |
| 55 to 59 Years | 115 (6.2%) | 133 (6.5%) |
| 60 to 64 Years | 153 (8.2%) | 138 (6.7%) |
| 65 to 69 Years | 86 (4.6%) | 80 (3.9%) |
| 70 to 74 Years | 39 (2.1%) | 129 (6.2%) |
| 75 to 79 Years | 29 (1.5%) | 46 (2.2%) |
| 80 to 84 Years | 67 (3.6%) | 108 (5.2%) |
| 85 Years and over | 17 (0.9%) | 113 (5.5%) |
| Total | 1,867 (100.0%) | 2,063 (100.0%) |
Families and Households in Windber borough
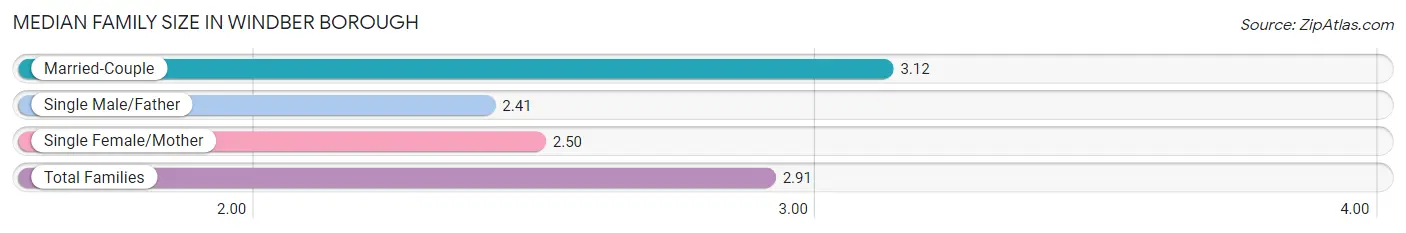
Median Family Size in Windber borough
The median family size in Windber borough is 2.91 persons per family, with married-couple families (719 | 68.7%) accounting for the largest median family size of 3.12 persons per family. On the other hand, single male/father families (104 | 9.9%) represent the smallest median family size with 2.41 persons per family.
| Family Type | # Families | Family Size |
| Married-Couple | 719 (68.7%) | 3.12 |
| Single Male/Father | 104 (9.9%) | 2.41 |
| Single Female/Mother | 224 (21.4%) | 2.50 |
| Total Families | 1,047 (100.0%) | 2.91 |
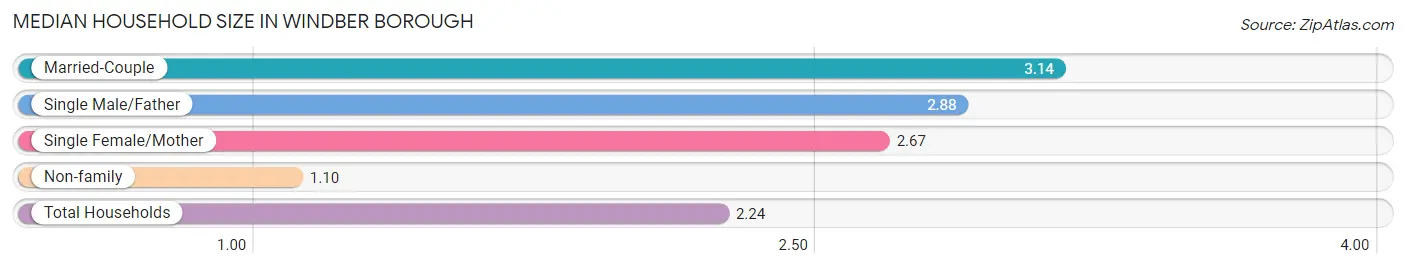
Median Household Size in Windber borough
The median household size in Windber borough is 2.24 persons per household, with married-couple households (719 | 41.0%) accounting for the largest median household size of 3.14 persons per household. non-family households (708 | 40.3%) represent the smallest median household size with 1.10 persons per household.
| Household Type | # Households | Household Size |
| Married-Couple | 719 (41.0%) | 3.14 |
| Single Male/Father | 104 (5.9%) | 2.88 |
| Single Female/Mother | 224 (12.8%) | 2.67 |
| Non-family | 708 (40.3%) | 1.10 |
| Total Households | 1,755 (100.0%) | 2.24 |
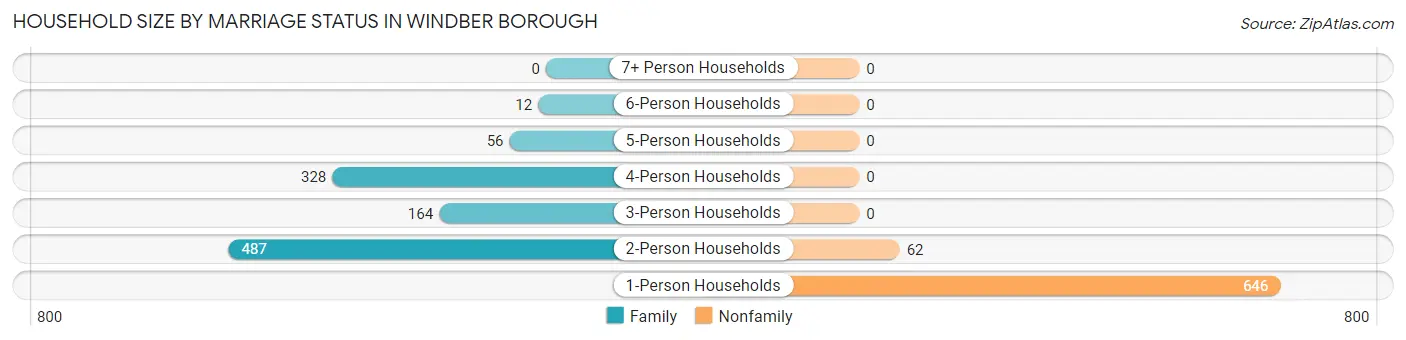
Household Size by Marriage Status in Windber borough
Out of a total of 1,755 households in Windber borough, 1,047 (59.7%) are family households, while 708 (40.3%) are nonfamily households. The most numerous type of family households are 2-person households, comprising 487, and the most common type of nonfamily households are 1-person households, comprising 646.
| Household Size | Family Households | Nonfamily Households |
| 1-Person Households | - | 646 (36.8%) |
| 2-Person Households | 487 (27.8%) | 62 (3.5%) |
| 3-Person Households | 164 (9.3%) | 0 (0.0%) |
| 4-Person Households | 328 (18.7%) | 0 (0.0%) |
| 5-Person Households | 56 (3.2%) | 0 (0.0%) |
| 6-Person Households | 12 (0.7%) | 0 (0.0%) |
| 7+ Person Households | 0 (0.0%) | 0 (0.0%) |
| Total | 1,047 (59.7%) | 708 (40.3%) |
Female Fertility in Windber borough
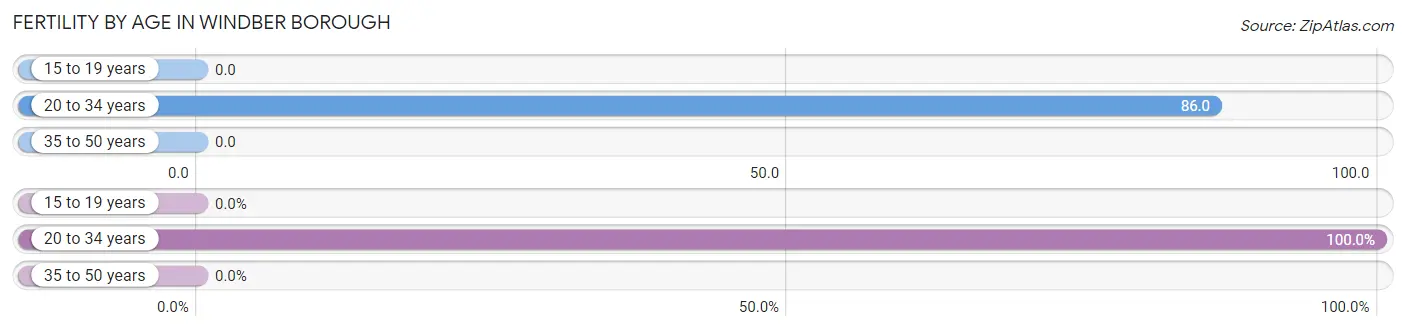
Fertility by Age in Windber borough
Average fertility rate in Windber borough is 31.0 births per 1,000 women. Women in the age bracket of 20 to 34 years have the highest fertility rate with 86.0 births per 1,000 women. Women in the age bracket of 20 to 34 years acount for 100.0% of all women with births.
| Age Bracket | Women with Births | Births / 1,000 Women |
| 15 to 19 years | 0 (0.0%) | 0.0 |
| 20 to 34 years | 28 (100.0%) | 86.0 |
| 35 to 50 years | 0 (0.0%) | 0.0 |
| Total | 28 (100.0%) | 31.0 |
Fertility by Age by Marriage Status in Windber borough
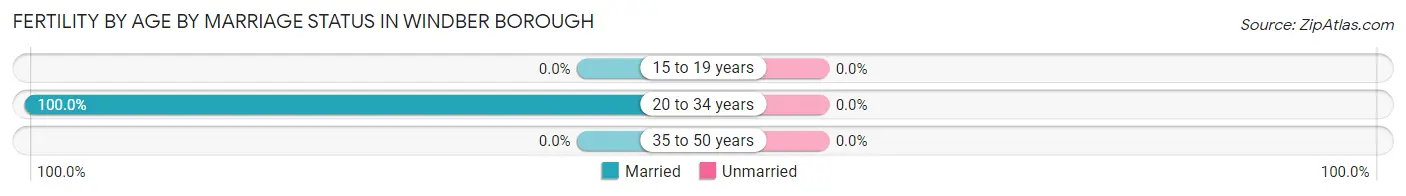
| Age Bracket | Married | Unmarried |
| 15 to 19 years | 0 (0.0%) | 0 (0.0%) |
| 20 to 34 years | 28 (100.0%) | 0 (0.0%) |
| 35 to 50 years | 0 (0.0%) | 0 (0.0%) |
| Total | 28 (100.0%) | 0 (0.0%) |
Fertility by Education in Windber borough

| Educational Attainment | Women with Births | Births / 1,000 Women |
| Less than High School | 0 (0.0%) | 0.0 |
| High School Diploma | 2 (7.1%) | 7.0 |
| College or Associate's Degree | 26 (92.9%) | 94.0 |
| Bachelor's Degree | 0 (0.0%) | 0.0 |
| Graduate Degree | 0 (0.0%) | 0.0 |
| Total | 28 (100.0%) | 31.0 |
Fertility by Education by Marriage Status in Windber borough
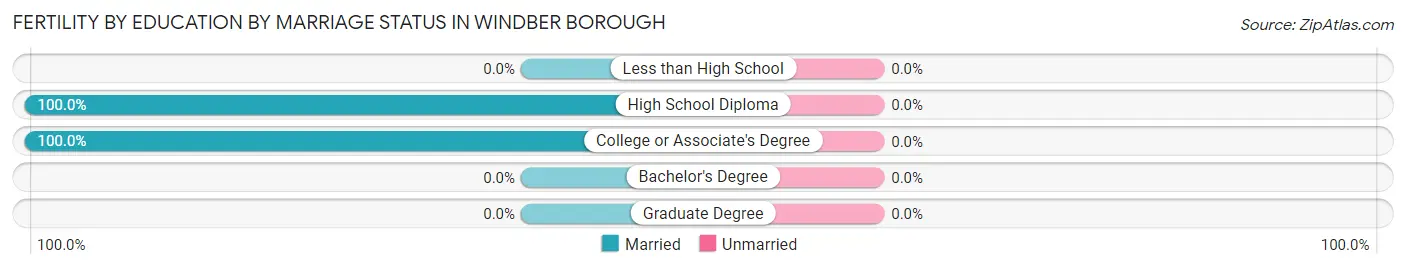
| Educational Attainment | Married | Unmarried |
| Less than High School | 0 (0.0%) | 0 (0.0%) |
| High School Diploma | 2 (100.0%) | 0 (0.0%) |
| College or Associate's Degree | 26 (100.0%) | 0 (0.0%) |
| Bachelor's Degree | 0 (0.0%) | 0 (0.0%) |
| Graduate Degree | 0 (0.0%) | 0 (0.0%) |
| Total | 28 (100.0%) | 0 (0.0%) |
Employment Characteristics in Windber borough
Employment by Class of Employer in Windber borough
Among the 1,949 employed individuals in Windber borough, private company employees (1,521 | 78.0%), not-for-profit organizations (176 | 9.0%), and local government employees (118 | 6.0%) make up the most common classes of employment.
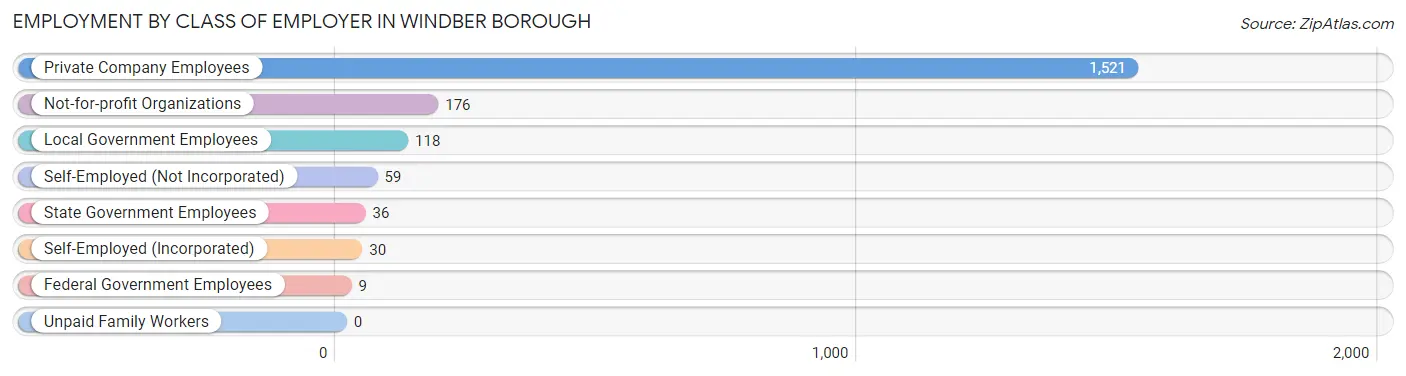
| Employer Class | # Employees | % Employees |
| Private Company Employees | 1,521 | 78.0% |
| Self-Employed (Incorporated) | 30 | 1.5% |
| Self-Employed (Not Incorporated) | 59 | 3.0% |
| Not-for-profit Organizations | 176 | 9.0% |
| Local Government Employees | 118 | 6.0% |
| State Government Employees | 36 | 1.8% |
| Federal Government Employees | 9 | 0.5% |
| Unpaid Family Workers | 0 | 0.0% |
| Total | 1,949 | 100.0% |
Employment Status by Age in Windber borough
According to the labor force statistics for Windber borough, out of the total population over 16 years of age (3,091), 65.1% or 2,012 individuals are in the labor force, with 2.6% or 52 of them unemployed. The age group with the highest labor force participation rate is 35 to 44 years, with 97.9% or 502 individuals in the labor force. Within the labor force, the 30 to 34 years age range has the highest percentage of unemployed individuals, with 12.5% or 23 of them being unemployed.
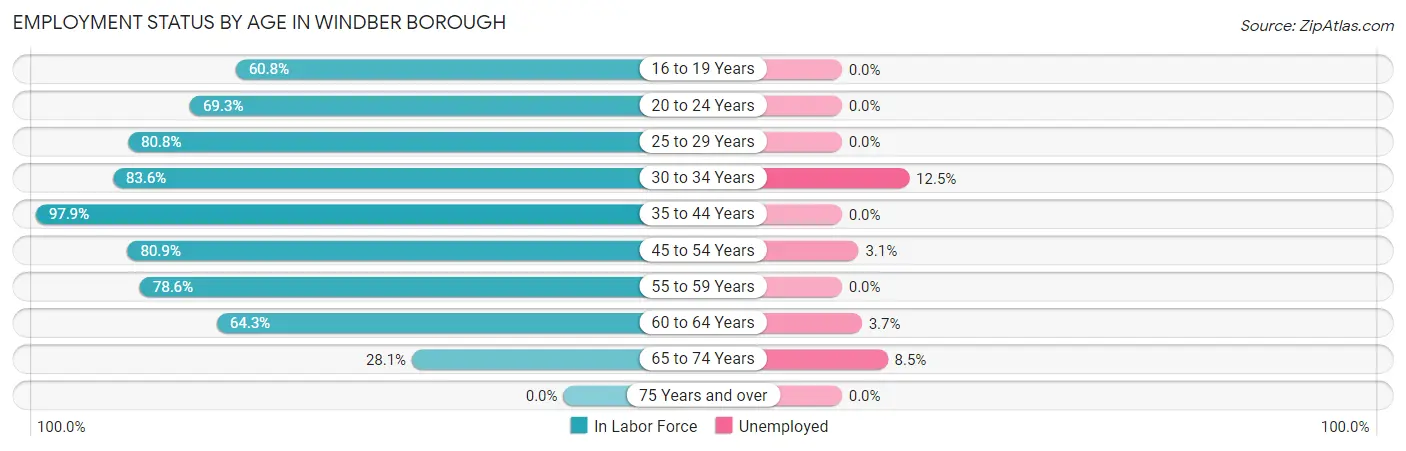
| Age Bracket | In Labor Force | Unemployed |
| 16 to 19 Years | 87 (60.8%) | 0 (0.0%) |
| 20 to 24 Years | 88 (69.3%) | 0 (0.0%) |
| 25 to 29 Years | 219 (80.8%) | 0 (0.0%) |
| 30 to 34 Years | 184 (83.6%) | 23 (12.5%) |
| 35 to 44 Years | 502 (97.9%) | 0 (0.0%) |
| 45 to 54 Years | 456 (80.9%) | 14 (3.1%) |
| 55 to 59 Years | 195 (78.6%) | 0 (0.0%) |
| 60 to 64 Years | 187 (64.3%) | 7 (3.7%) |
| 65 to 74 Years | 94 (28.1%) | 8 (8.5%) |
| 75 Years and over | 0 (0.0%) | 0 (0.0%) |
| Total | 2,012 (65.1%) | 52 (2.6%) |
Employment Status by Educational Attainment in Windber borough
According to labor force statistics for Windber borough, 82.7% of individuals (1,742) out of the total population between 25 and 64 years of age (2,107) are in the labor force, with 2.5% or 44 of them being unemployed. The group with the highest labor force participation rate are those with the educational attainment of bachelor's degree or higher, with 94.1% or 370 individuals in the labor force. Within the labor force, individuals with high school diploma education have the highest percentage of unemployment, with 3.4% or 30 of them being unemployed.
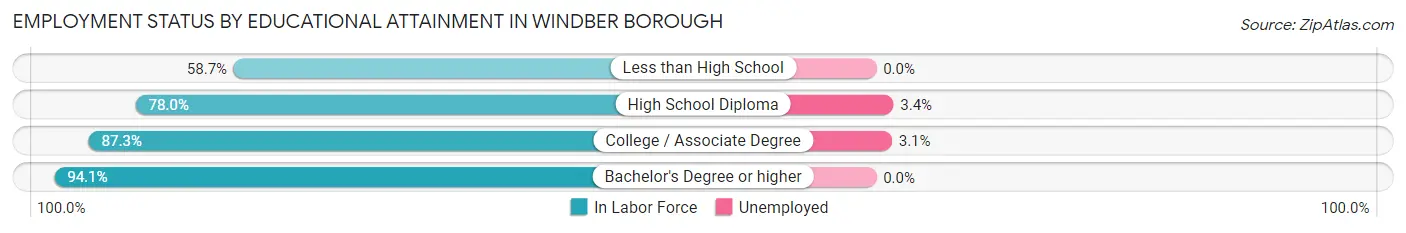
| Educational Attainment | In Labor Force | Unemployed |
| Less than High School | 37 (58.7%) | 0 (0.0%) |
| High School Diploma | 878 (78.0%) | 38 (3.4%) |
| College / Associate Degree | 459 (87.3%) | 16 (3.1%) |
| Bachelor's Degree or higher | 370 (94.1%) | 0 (0.0%) |
| Total | 1,742 (82.7%) | 53 (2.5%) |
Employment Occupations by Sex in Windber borough
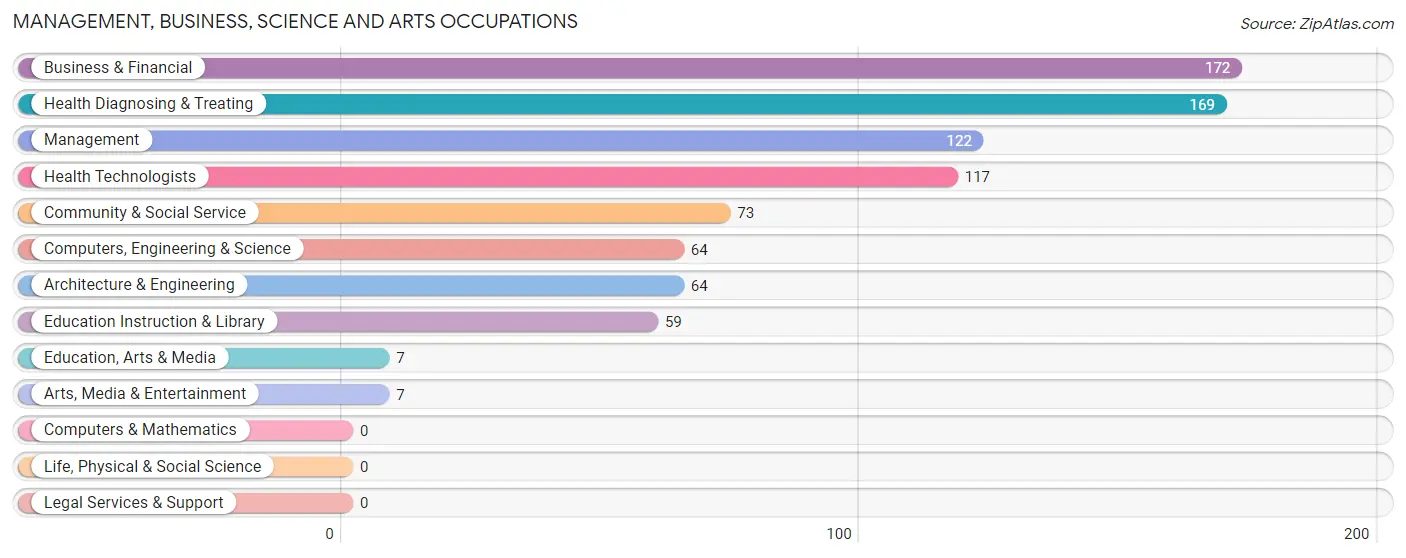
Management, Business, Science and Arts Occupations
The most common Management, Business, Science and Arts occupations in Windber borough are Business & Financial (172 | 8.8%), Health Diagnosing & Treating (169 | 8.6%), Management (122 | 6.2%), Health Technologists (117 | 6.0%), and Community & Social Service (73 | 3.7%).
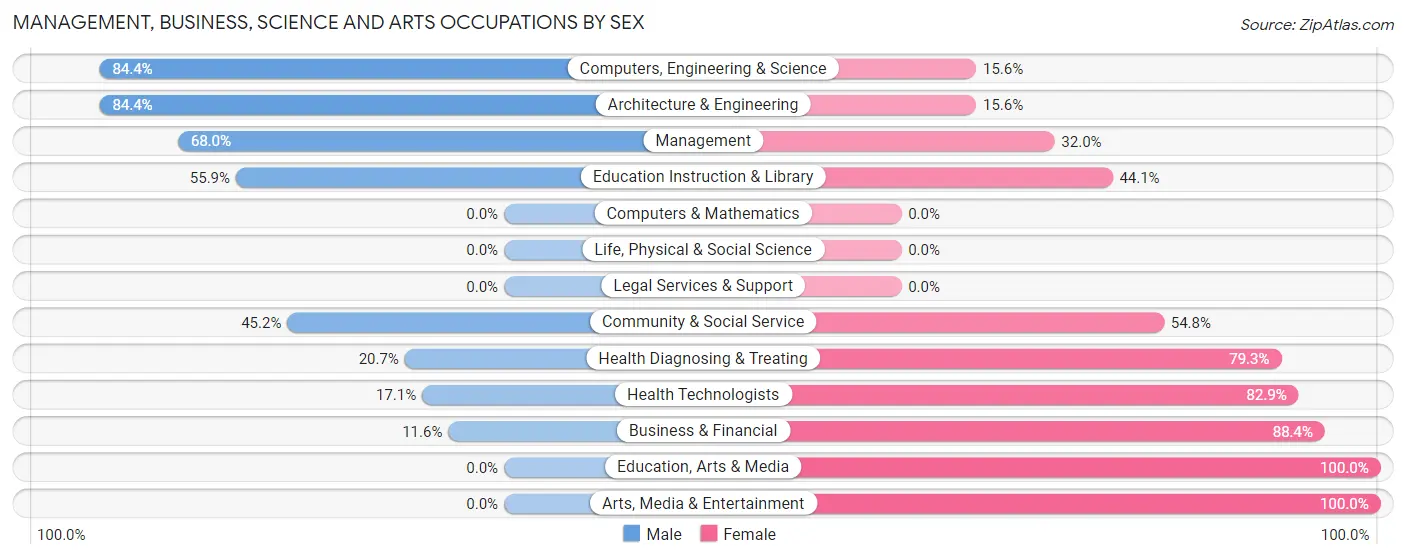
Management, Business, Science and Arts Occupations by Sex
Within the Management, Business, Science and Arts occupations in Windber borough, the most male-oriented occupations are Computers, Engineering & Science (84.4%), Architecture & Engineering (84.4%), and Management (68.0%), while the most female-oriented occupations are Education, Arts & Media (100.0%), Arts, Media & Entertainment (100.0%), and Business & Financial (88.4%).
| Occupation | Male | Female |
| Management | 83 (68.0%) | 39 (32.0%) |
| Business & Financial | 20 (11.6%) | 152 (88.4%) |
| Computers, Engineering & Science | 54 (84.4%) | 10 (15.6%) |
| Computers & Mathematics | 0 (0.0%) | 0 (0.0%) |
| Architecture & Engineering | 54 (84.4%) | 10 (15.6%) |
| Life, Physical & Social Science | 0 (0.0%) | 0 (0.0%) |
| Community & Social Service | 33 (45.2%) | 40 (54.8%) |
| Education, Arts & Media | 0 (0.0%) | 7 (100.0%) |
| Legal Services & Support | 0 (0.0%) | 0 (0.0%) |
| Education Instruction & Library | 33 (55.9%) | 26 (44.1%) |
| Arts, Media & Entertainment | 0 (0.0%) | 7 (100.0%) |
| Health Diagnosing & Treating | 35 (20.7%) | 134 (79.3%) |
| Health Technologists | 20 (17.1%) | 97 (82.9%) |
| Total (Category) | 225 (37.5%) | 375 (62.5%) |
| Total (Overall) | 1,009 (51.5%) | 951 (48.5%) |
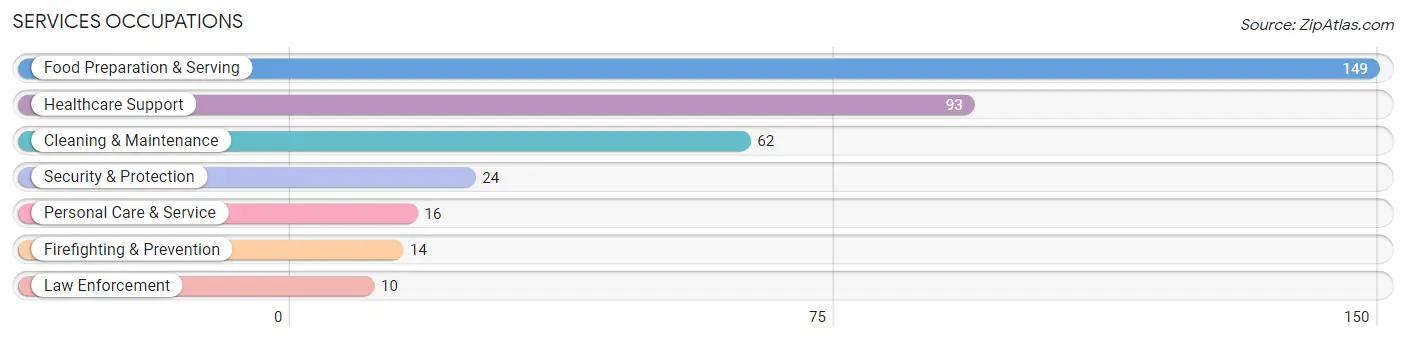
Services Occupations
The most common Services occupations in Windber borough are Food Preparation & Serving (149 | 7.6%), Healthcare Support (93 | 4.7%), Cleaning & Maintenance (62 | 3.2%), Security & Protection (24 | 1.2%), and Personal Care & Service (16 | 0.8%).
Services Occupations by Sex
Within the Services occupations in Windber borough, the most male-oriented occupations are Law Enforcement (100.0%), Cleaning & Maintenance (67.7%), and Personal Care & Service (43.8%), while the most female-oriented occupations are Firefighting & Prevention (100.0%), Healthcare Support (75.3%), and Food Preparation & Serving (67.1%).
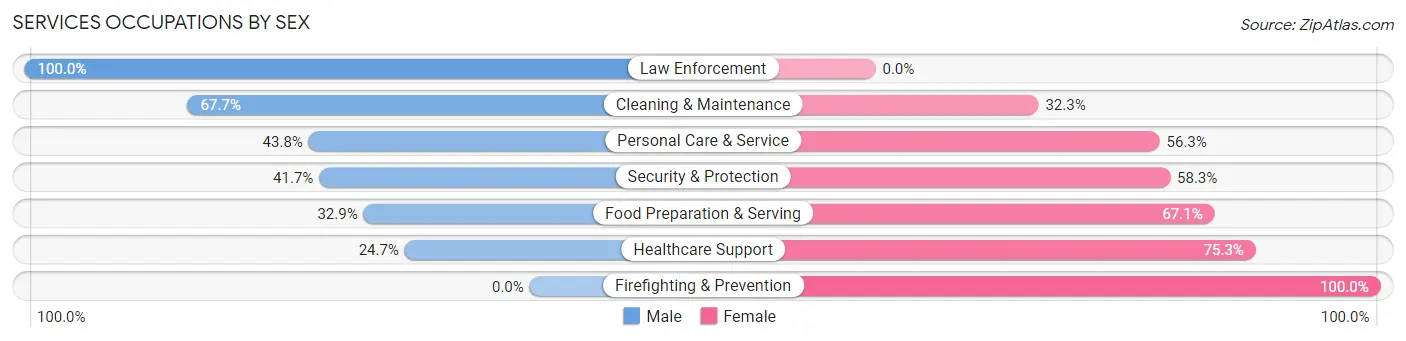
| Occupation | Male | Female |
| Healthcare Support | 23 (24.7%) | 70 (75.3%) |
| Security & Protection | 10 (41.7%) | 14 (58.3%) |
| Firefighting & Prevention | 0 (0.0%) | 14 (100.0%) |
| Law Enforcement | 10 (100.0%) | 0 (0.0%) |
| Food Preparation & Serving | 49 (32.9%) | 100 (67.1%) |
| Cleaning & Maintenance | 42 (67.7%) | 20 (32.3%) |
| Personal Care & Service | 7 (43.8%) | 9 (56.2%) |
| Total (Category) | 131 (38.1%) | 213 (61.9%) |
| Total (Overall) | 1,009 (51.5%) | 951 (48.5%) |
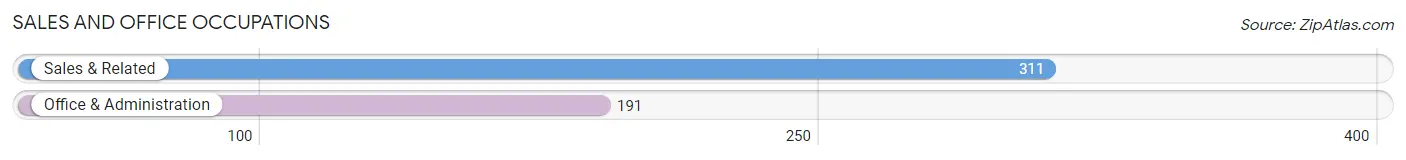
Sales and Office Occupations
The most common Sales and Office occupations in Windber borough are Sales & Related (311 | 15.9%), and Office & Administration (191 | 9.7%).
Sales and Office Occupations by Sex
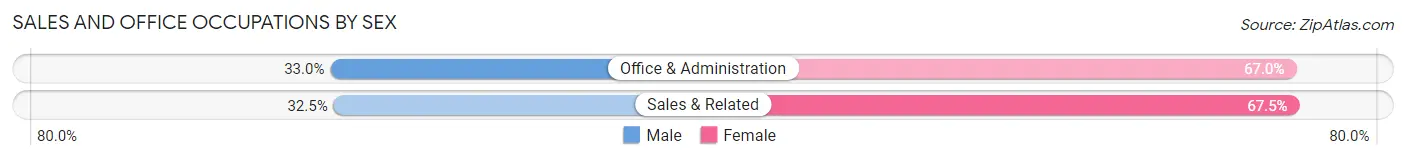
| Occupation | Male | Female |
| Sales & Related | 101 (32.5%) | 210 (67.5%) |
| Office & Administration | 63 (33.0%) | 128 (67.0%) |
| Total (Category) | 164 (32.7%) | 338 (67.3%) |
| Total (Overall) | 1,009 (51.5%) | 951 (48.5%) |
Natural Resources, Construction and Maintenance Occupations
The most common Natural Resources, Construction and Maintenance occupations in Windber borough are Construction & Extraction (51 | 2.6%), and Installation, Maintenance & Repair (36 | 1.8%).
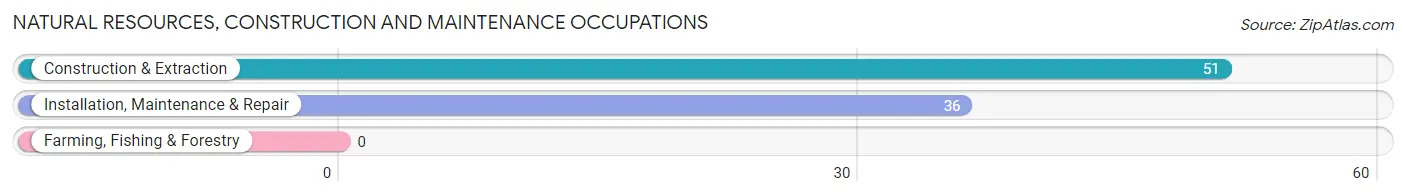
Natural Resources, Construction and Maintenance Occupations by Sex
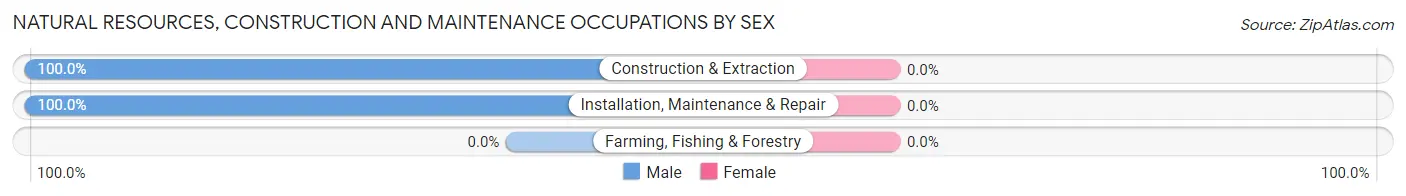
| Occupation | Male | Female |
| Farming, Fishing & Forestry | 0 (0.0%) | 0 (0.0%) |
| Construction & Extraction | 51 (100.0%) | 0 (0.0%) |
| Installation, Maintenance & Repair | 36 (100.0%) | 0 (0.0%) |
| Total (Category) | 87 (100.0%) | 0 (0.0%) |
| Total (Overall) | 1,009 (51.5%) | 951 (48.5%) |
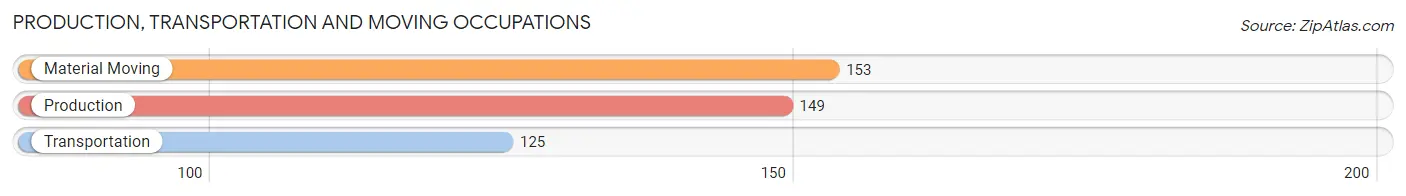
Production, Transportation and Moving Occupations
The most common Production, Transportation and Moving occupations in Windber borough are Material Moving (153 | 7.8%), Production (149 | 7.6%), and Transportation (125 | 6.4%).
Production, Transportation and Moving Occupations by Sex
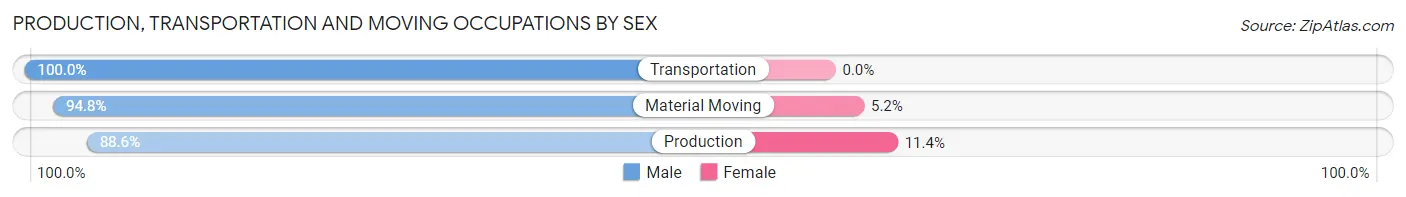
| Occupation | Male | Female |
| Production | 132 (88.6%) | 17 (11.4%) |
| Transportation | 125 (100.0%) | 0 (0.0%) |
| Material Moving | 145 (94.8%) | 8 (5.2%) |
| Total (Category) | 402 (94.2%) | 25 (5.9%) |
| Total (Overall) | 1,009 (51.5%) | 951 (48.5%) |
Employment Industries by Sex in Windber borough
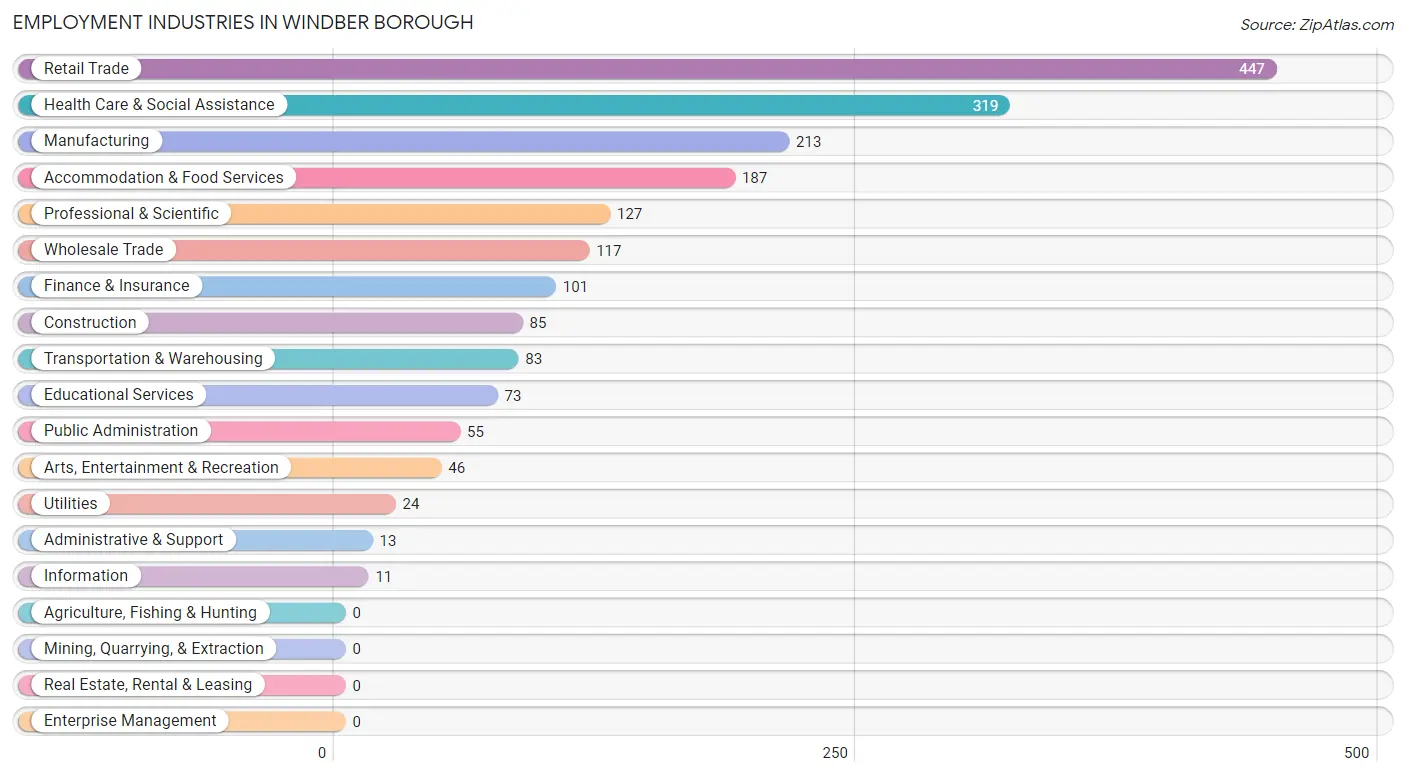
Employment Industries in Windber borough
The major employment industries in Windber borough include Retail Trade (447 | 22.8%), Health Care & Social Assistance (319 | 16.3%), Manufacturing (213 | 10.9%), Accommodation & Food Services (187 | 9.5%), and Professional & Scientific (127 | 6.5%).
Employment Industries by Sex in Windber borough
The Windber borough industries that see more men than women are Transportation & Warehousing (100.0%), Information (100.0%), and Administrative & Support (100.0%), whereas the industries that tend to have a higher number of women are Health Care & Social Assistance (81.8%), Wholesale Trade (69.2%), and Accommodation & Food Services (66.8%).
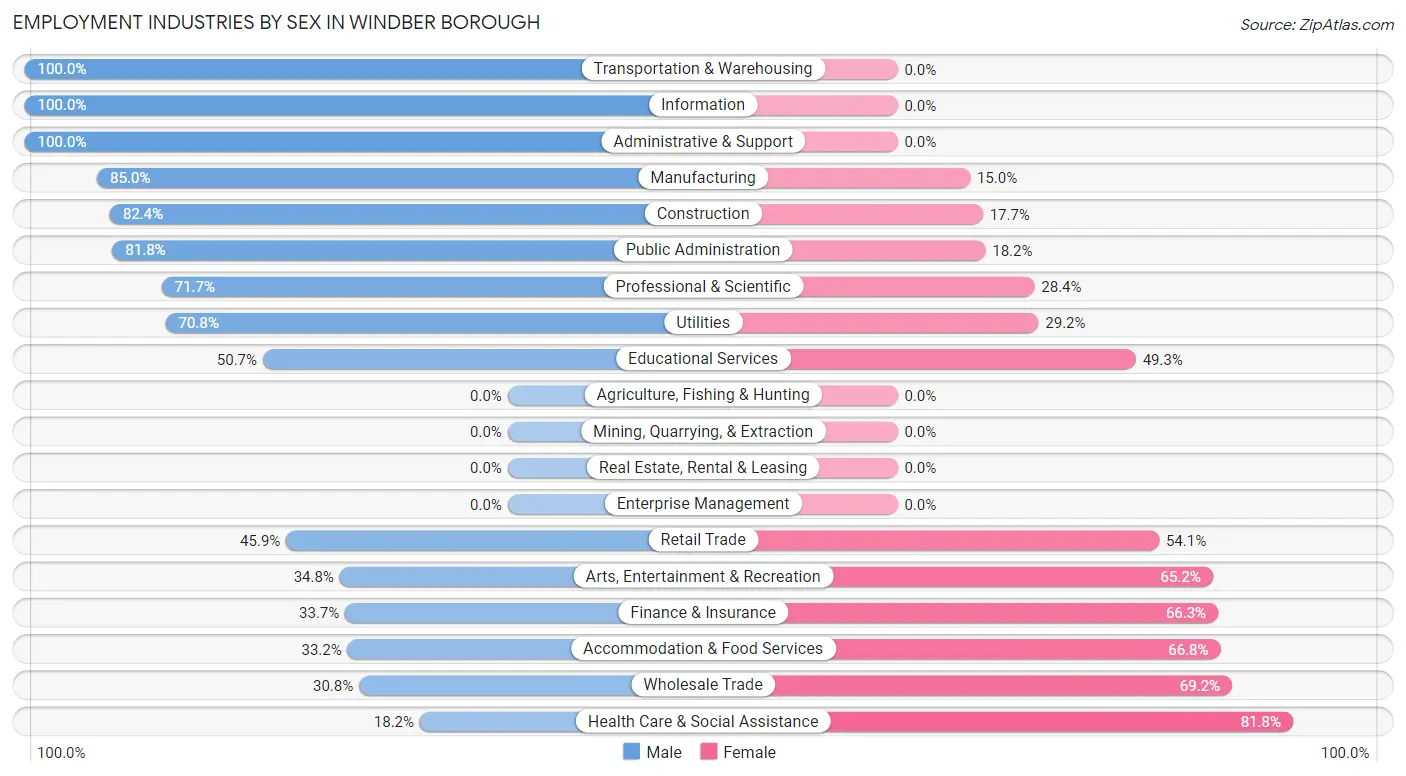
| Industry | Male | Female |
| Agriculture, Fishing & Hunting | 0 (0.0%) | 0 (0.0%) |
| Mining, Quarrying, & Extraction | 0 (0.0%) | 0 (0.0%) |
| Construction | 70 (82.4%) | 15 (17.6%) |
| Manufacturing | 181 (85.0%) | 32 (15.0%) |
| Wholesale Trade | 36 (30.8%) | 81 (69.2%) |
| Retail Trade | 205 (45.9%) | 242 (54.1%) |
| Transportation & Warehousing | 83 (100.0%) | 0 (0.0%) |
| Utilities | 17 (70.8%) | 7 (29.2%) |
| Information | 11 (100.0%) | 0 (0.0%) |
| Finance & Insurance | 34 (33.7%) | 67 (66.3%) |
| Real Estate, Rental & Leasing | 0 (0.0%) | 0 (0.0%) |
| Professional & Scientific | 91 (71.7%) | 36 (28.3%) |
| Enterprise Management | 0 (0.0%) | 0 (0.0%) |
| Administrative & Support | 13 (100.0%) | 0 (0.0%) |
| Educational Services | 37 (50.7%) | 36 (49.3%) |
| Health Care & Social Assistance | 58 (18.2%) | 261 (81.8%) |
| Arts, Entertainment & Recreation | 16 (34.8%) | 30 (65.2%) |
| Accommodation & Food Services | 62 (33.2%) | 125 (66.8%) |
| Public Administration | 45 (81.8%) | 10 (18.2%) |
| Total | 1,009 (51.5%) | 951 (48.5%) |
Education in Windber borough
School Enrollment in Windber borough
The most common levels of schooling among the 864 students in Windber borough are high school (239 | 27.7%), middle school (177 | 20.5%), and elementary school (163 | 18.9%).
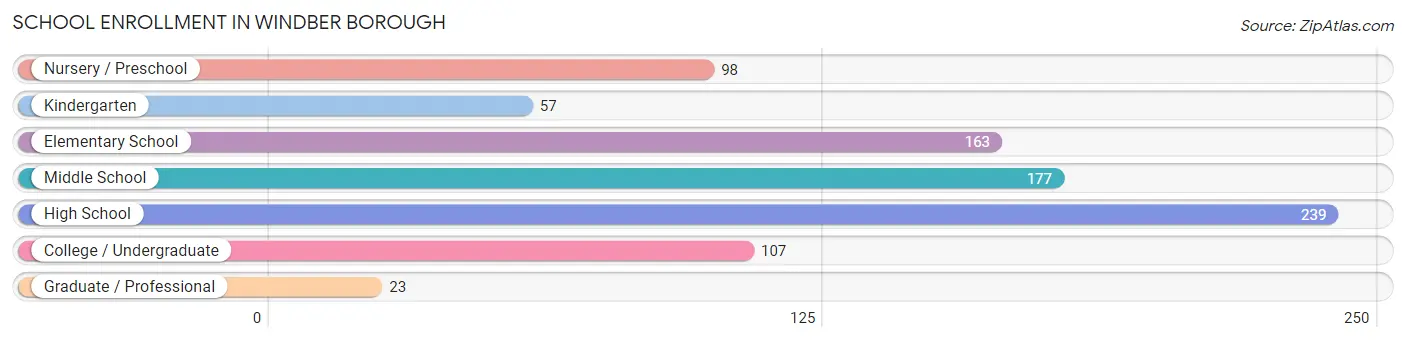
| School Level | # Students | % Students |
| Nursery / Preschool | 98 | 11.3% |
| Kindergarten | 57 | 6.6% |
| Elementary School | 163 | 18.9% |
| Middle School | 177 | 20.5% |
| High School | 239 | 27.7% |
| College / Undergraduate | 107 | 12.4% |
| Graduate / Professional | 23 | 2.7% |
| Total | 864 | 100.0% |
School Enrollment by Age by Funding Source in Windber borough
Out of a total of 864 students who are enrolled in schools in Windber borough, 82 (9.5%) attend a private institution, while the remaining 782 (90.5%) are enrolled in public schools. The age group of 3 to 4 year olds has the highest likelihood of being enrolled in private schools, with 44 (73.3% in the age bracket) enrolled. Conversely, the age group of 5 to 9 year old has the lowest likelihood of being enrolled in a private school, with 220 (100.0% in the age bracket) attending a public institution.
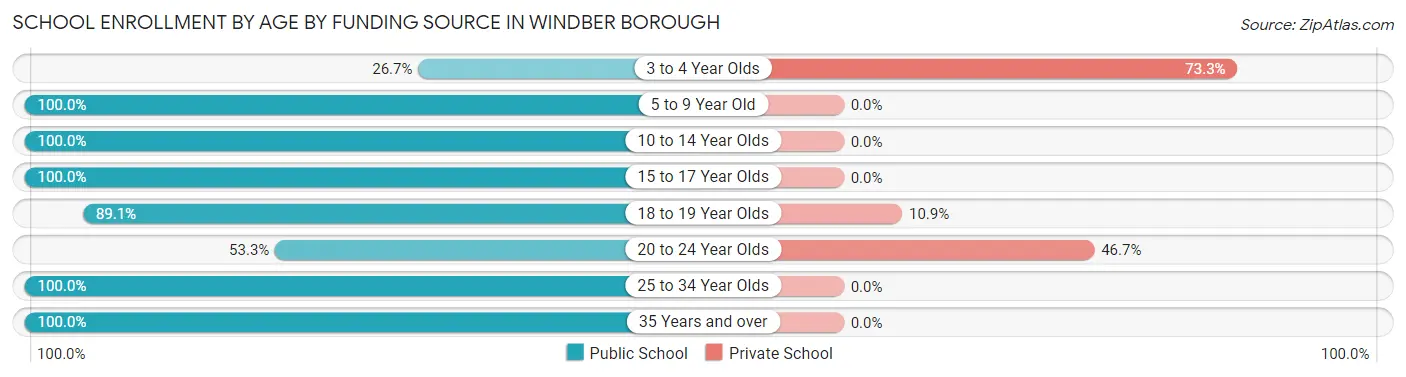
| Age Bracket | Public School | Private School |
| 3 to 4 Year Olds | 16 (26.7%) | 44 (73.3%) |
| 5 to 9 Year Old | 220 (100.0%) | 0 (0.0%) |
| 10 to 14 Year Olds | 254 (100.0%) | 0 (0.0%) |
| 15 to 17 Year Olds | 118 (100.0%) | 0 (0.0%) |
| 18 to 19 Year Olds | 82 (89.1%) | 10 (10.9%) |
| 20 to 24 Year Olds | 32 (53.3%) | 28 (46.7%) |
| 25 to 34 Year Olds | 51 (100.0%) | 0 (0.0%) |
| 35 Years and over | 9 (100.0%) | 0 (0.0%) |
| Total | 782 (90.5%) | 82 (9.5%) |
Educational Attainment by Field of Study in Windber borough
Science & technology (100 | 18.9%), social sciences (81 | 15.3%), business (78 | 14.7%), education (72 | 13.6%), and computers & mathematics (56 | 10.6%) are the most common fields of study among 530 individuals in Windber borough who have obtained a bachelor's degree or higher.
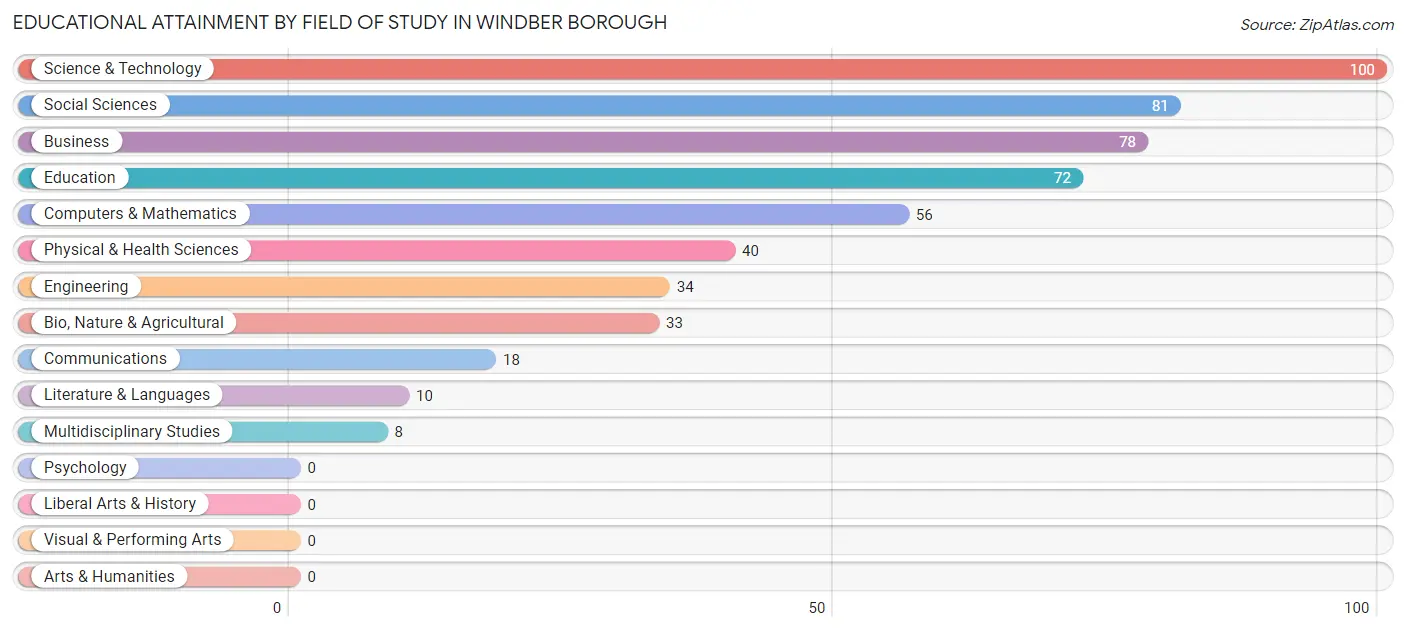
| Field of Study | # Graduates | % Graduates |
| Computers & Mathematics | 56 | 10.6% |
| Bio, Nature & Agricultural | 33 | 6.2% |
| Physical & Health Sciences | 40 | 7.5% |
| Psychology | 0 | 0.0% |
| Social Sciences | 81 | 15.3% |
| Engineering | 34 | 6.4% |
| Multidisciplinary Studies | 8 | 1.5% |
| Science & Technology | 100 | 18.9% |
| Business | 78 | 14.7% |
| Education | 72 | 13.6% |
| Literature & Languages | 10 | 1.9% |
| Liberal Arts & History | 0 | 0.0% |
| Visual & Performing Arts | 0 | 0.0% |
| Communications | 18 | 3.4% |
| Arts & Humanities | 0 | 0.0% |
| Total | 530 | 100.0% |
Transportation & Commute in Windber borough
Vehicle Availability by Sex in Windber borough
The most prevalent vehicle ownership categories in Windber borough are males with 2 vehicles (407, accounting for 40.3%) and females with 2 vehicles (391, making up 43.3%).
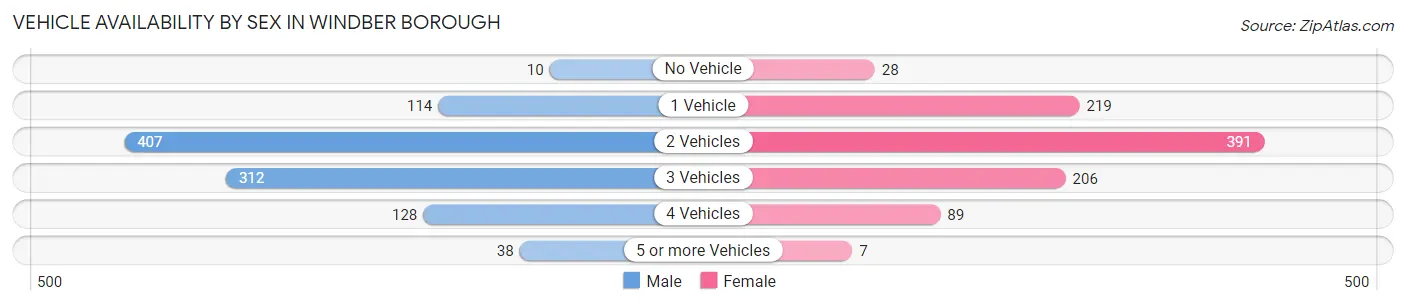
| Vehicles Available | Male | Female |
| No Vehicle | 10 (1.0%) | 28 (3.0%) |
| 1 Vehicle | 114 (11.3%) | 219 (23.3%) |
| 2 Vehicles | 407 (40.3%) | 391 (41.6%) |
| 3 Vehicles | 312 (30.9%) | 206 (21.9%) |
| 4 Vehicles | 128 (12.7%) | 89 (9.5%) |
| 5 or more Vehicles | 38 (3.8%) | 7 (0.7%) |
| Total | 1,009 (100.0%) | 940 (100.0%) |
Commute Time in Windber borough
The most frequently occuring commute durations in Windber borough are 10 to 14 minutes (531 commuters, 28.9%), 5 to 9 minutes (249 commuters, 13.6%), and 20 to 24 minutes (238 commuters, 13.0%).
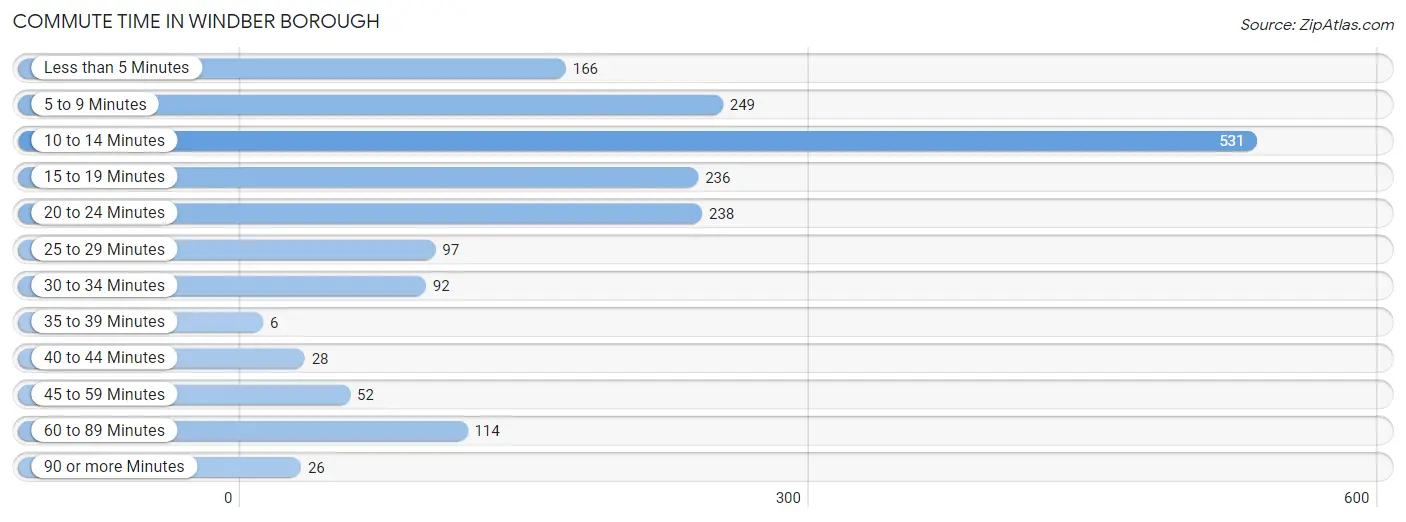
| Commute Time | # Commuters | % Commuters |
| Less than 5 Minutes | 166 | 9.0% |
| 5 to 9 Minutes | 249 | 13.6% |
| 10 to 14 Minutes | 531 | 28.9% |
| 15 to 19 Minutes | 236 | 12.9% |
| 20 to 24 Minutes | 238 | 13.0% |
| 25 to 29 Minutes | 97 | 5.3% |
| 30 to 34 Minutes | 92 | 5.0% |
| 35 to 39 Minutes | 6 | 0.3% |
| 40 to 44 Minutes | 28 | 1.5% |
| 45 to 59 Minutes | 52 | 2.8% |
| 60 to 89 Minutes | 114 | 6.2% |
| 90 or more Minutes | 26 | 1.4% |
Commute Time by Sex in Windber borough
The most common commute times in Windber borough are 10 to 14 minutes (293 commuters, 29.5%) for males and 10 to 14 minutes (238 commuters, 28.3%) for females.
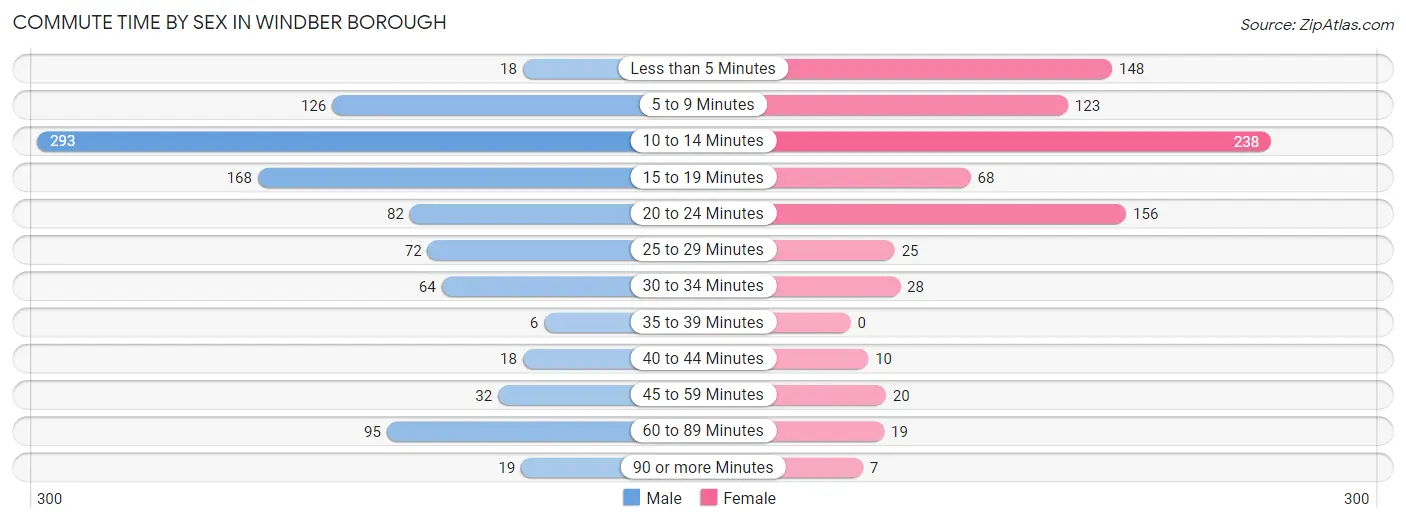
| Commute Time | Male | Female |
| Less than 5 Minutes | 18 (1.8%) | 148 (17.6%) |
| 5 to 9 Minutes | 126 (12.7%) | 123 (14.6%) |
| 10 to 14 Minutes | 293 (29.5%) | 238 (28.3%) |
| 15 to 19 Minutes | 168 (16.9%) | 68 (8.1%) |
| 20 to 24 Minutes | 82 (8.3%) | 156 (18.5%) |
| 25 to 29 Minutes | 72 (7.2%) | 25 (3.0%) |
| 30 to 34 Minutes | 64 (6.5%) | 28 (3.3%) |
| 35 to 39 Minutes | 6 (0.6%) | 0 (0.0%) |
| 40 to 44 Minutes | 18 (1.8%) | 10 (1.2%) |
| 45 to 59 Minutes | 32 (3.2%) | 20 (2.4%) |
| 60 to 89 Minutes | 95 (9.6%) | 19 (2.3%) |
| 90 or more Minutes | 19 (1.9%) | 7 (0.8%) |
Time of Departure to Work by Sex in Windber borough
The most frequent times of departure to work in Windber borough are 7:30 AM to 7:59 AM (178, 17.9%) for males and 7:00 AM to 7:29 AM (140, 16.6%) for females.
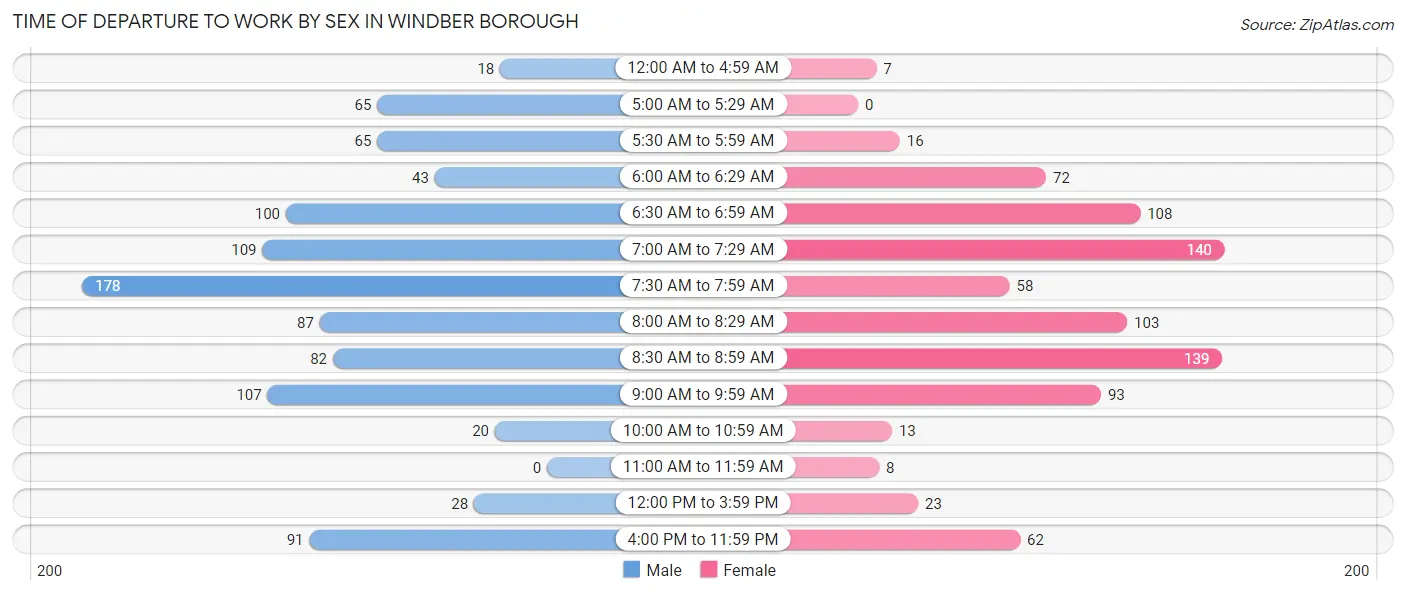
| Time of Departure | Male | Female |
| 12:00 AM to 4:59 AM | 18 (1.8%) | 7 (0.8%) |
| 5:00 AM to 5:29 AM | 65 (6.6%) | 0 (0.0%) |
| 5:30 AM to 5:59 AM | 65 (6.6%) | 16 (1.9%) |
| 6:00 AM to 6:29 AM | 43 (4.3%) | 72 (8.6%) |
| 6:30 AM to 6:59 AM | 100 (10.1%) | 108 (12.8%) |
| 7:00 AM to 7:29 AM | 109 (11.0%) | 140 (16.6%) |
| 7:30 AM to 7:59 AM | 178 (17.9%) | 58 (6.9%) |
| 8:00 AM to 8:29 AM | 87 (8.8%) | 103 (12.2%) |
| 8:30 AM to 8:59 AM | 82 (8.3%) | 139 (16.5%) |
| 9:00 AM to 9:59 AM | 107 (10.8%) | 93 (11.1%) |
| 10:00 AM to 10:59 AM | 20 (2.0%) | 13 (1.5%) |
| 11:00 AM to 11:59 AM | 0 (0.0%) | 8 (0.9%) |
| 12:00 PM to 3:59 PM | 28 (2.8%) | 23 (2.7%) |
| 4:00 PM to 11:59 PM | 91 (9.2%) | 62 (7.4%) |
| Total | 993 (100.0%) | 842 (100.0%) |
Housing Occupancy in Windber borough
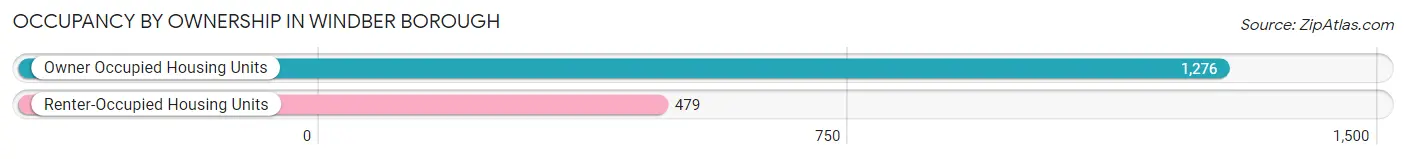
Occupancy by Ownership in Windber borough
Of the total 1,755 dwellings in Windber borough, owner-occupied units account for 1,276 (72.7%), while renter-occupied units make up 479 (27.3%).
| Occupancy | # Housing Units | % Housing Units |
| Owner Occupied Housing Units | 1,276 | 72.7% |
| Renter-Occupied Housing Units | 479 | 27.3% |
| Total Occupied Housing Units | 1,755 | 100.0% |
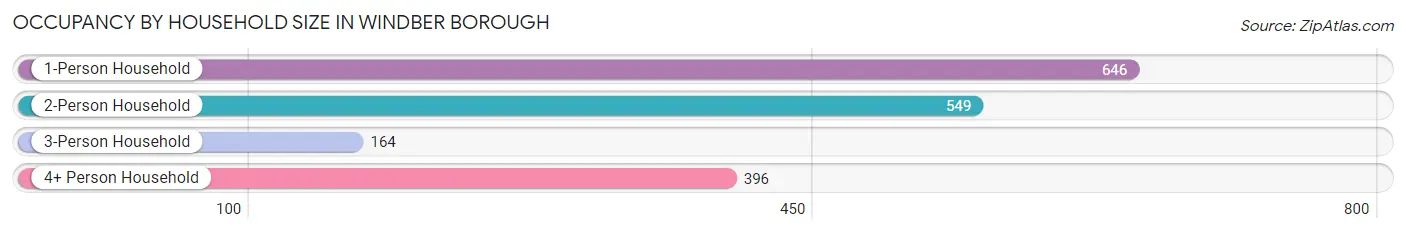
Occupancy by Household Size in Windber borough
| Household Size | # Housing Units | % Housing Units |
| 1-Person Household | 646 | 36.8% |
| 2-Person Household | 549 | 31.3% |
| 3-Person Household | 164 | 9.3% |
| 4+ Person Household | 396 | 22.6% |
| Total Housing Units | 1,755 | 100.0% |
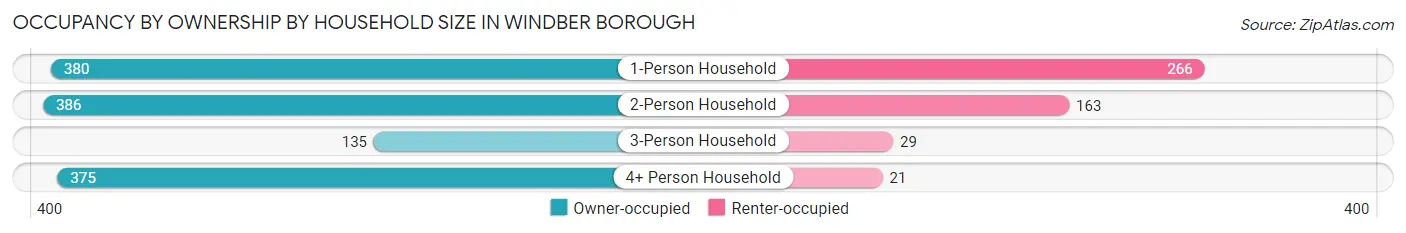
Occupancy by Ownership by Household Size in Windber borough
| Household Size | Owner-occupied | Renter-occupied |
| 1-Person Household | 380 (58.8%) | 266 (41.2%) |
| 2-Person Household | 386 (70.3%) | 163 (29.7%) |
| 3-Person Household | 135 (82.3%) | 29 (17.7%) |
| 4+ Person Household | 375 (94.7%) | 21 (5.3%) |
| Total Housing Units | 1,276 (72.7%) | 479 (27.3%) |
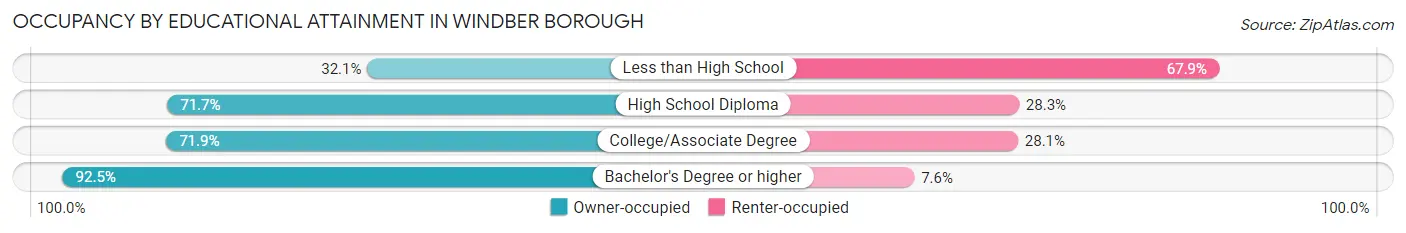
Occupancy by Educational Attainment in Windber borough
| Household Size | Owner-occupied | Renter-occupied |
| Less than High School | 42 (32.1%) | 89 (67.9%) |
| High School Diploma | 608 (71.7%) | 240 (28.3%) |
| College/Associate Degree | 320 (71.9%) | 125 (28.1%) |
| Bachelor's Degree or higher | 306 (92.4%) | 25 (7.5%) |
Occupancy by Age of Householder in Windber borough
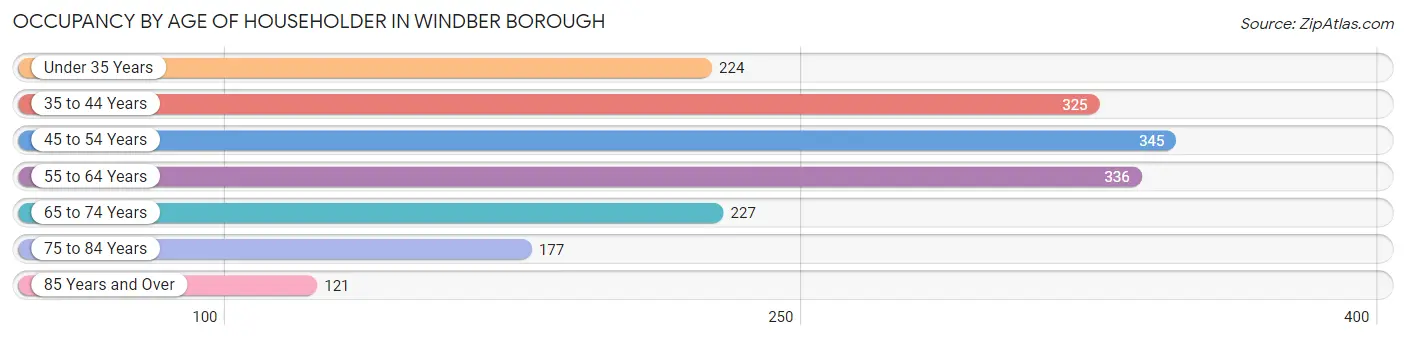
| Age Bracket | # Households | % Households |
| Under 35 Years | 224 | 12.8% |
| 35 to 44 Years | 325 | 18.5% |
| 45 to 54 Years | 345 | 19.7% |
| 55 to 64 Years | 336 | 19.2% |
| 65 to 74 Years | 227 | 12.9% |
| 75 to 84 Years | 177 | 10.1% |
| 85 Years and Over | 121 | 6.9% |
| Total | 1,755 | 100.0% |
Housing Finances in Windber borough
Median Income by Occupancy in Windber borough
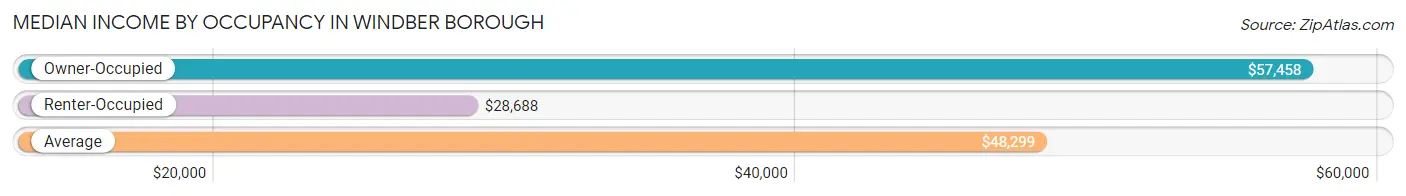
| Occupancy Type | # Households | Median Income |
| Owner-Occupied | 1,276 (72.7%) | $57,458 |
| Renter-Occupied | 479 (27.3%) | $28,688 |
| Average | 1,755 (100.0%) | $48,299 |
Occupancy by Householder Income Bracket in Windber borough
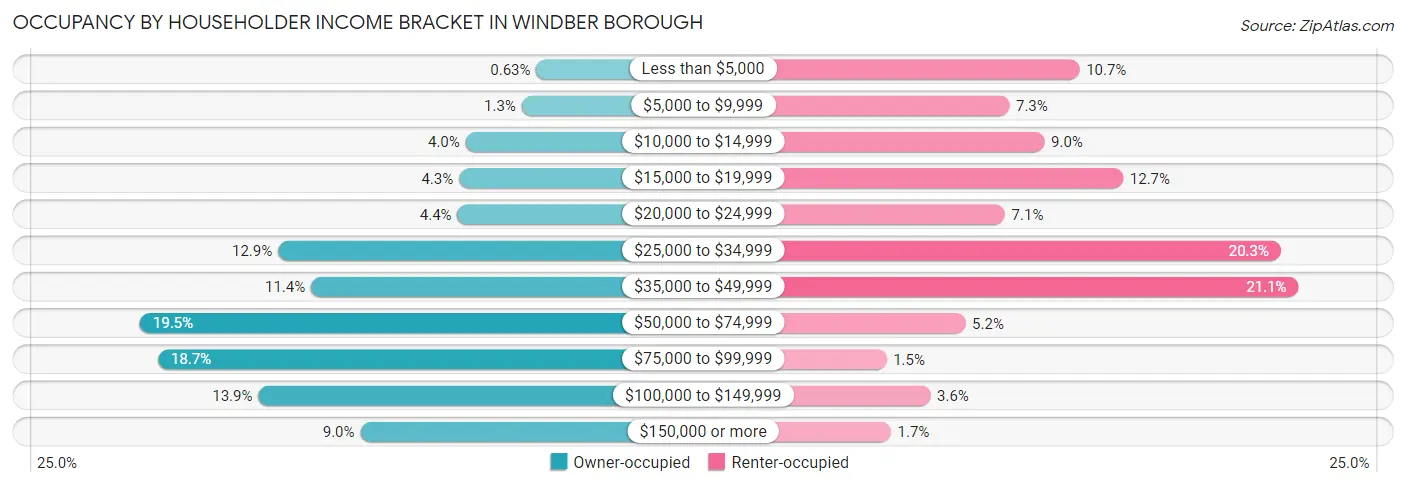
| Income Bracket | Owner-occupied | Renter-occupied |
| Less than $5,000 | 8 (0.6%) | 51 (10.6%) |
| $5,000 to $9,999 | 17 (1.3%) | 35 (7.3%) |
| $10,000 to $14,999 | 51 (4.0%) | 43 (9.0%) |
| $15,000 to $19,999 | 55 (4.3%) | 61 (12.7%) |
| $20,000 to $24,999 | 56 (4.4%) | 34 (7.1%) |
| $25,000 to $34,999 | 165 (12.9%) | 97 (20.3%) |
| $35,000 to $49,999 | 145 (11.4%) | 101 (21.1%) |
| $50,000 to $74,999 | 249 (19.5%) | 25 (5.2%) |
| $75,000 to $99,999 | 238 (18.6%) | 7 (1.5%) |
| $100,000 to $149,999 | 177 (13.9%) | 17 (3.5%) |
| $150,000 or more | 115 (9.0%) | 8 (1.7%) |
| Total | 1,276 (100.0%) | 479 (100.0%) |
Monthly Housing Cost Tiers in Windber borough
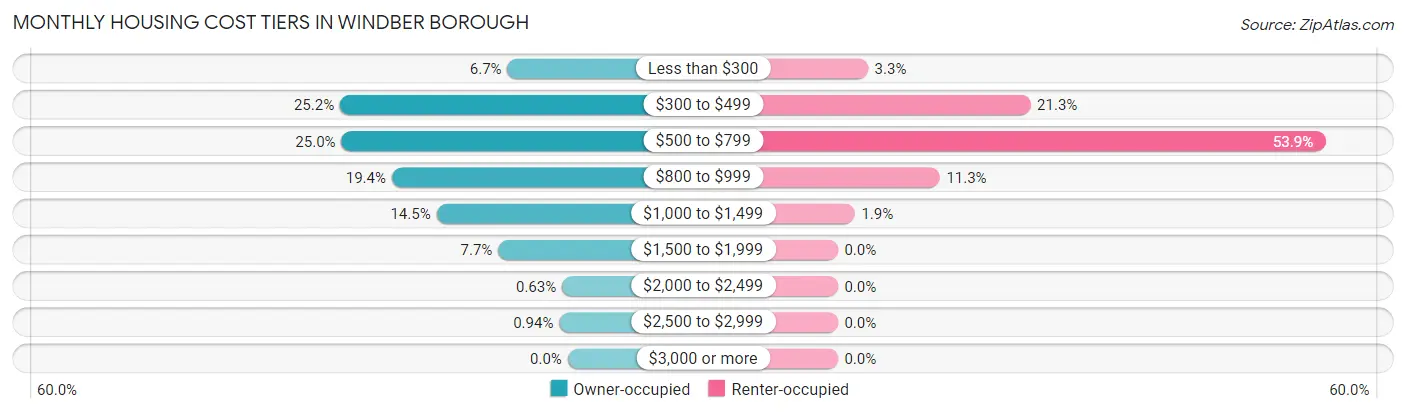
| Monthly Cost | Owner-occupied | Renter-occupied |
| Less than $300 | 85 (6.7%) | 16 (3.3%) |
| $300 to $499 | 321 (25.2%) | 102 (21.3%) |
| $500 to $799 | 319 (25.0%) | 258 (53.9%) |
| $800 to $999 | 248 (19.4%) | 54 (11.3%) |
| $1,000 to $1,499 | 185 (14.5%) | 9 (1.9%) |
| $1,500 to $1,999 | 98 (7.7%) | 0 (0.0%) |
| $2,000 to $2,499 | 8 (0.6%) | 0 (0.0%) |
| $2,500 to $2,999 | 12 (0.9%) | 0 (0.0%) |
| $3,000 or more | 0 (0.0%) | 0 (0.0%) |
| Total | 1,276 (100.0%) | 479 (100.0%) |
Physical Housing Characteristics in Windber borough
Housing Structures in Windber borough
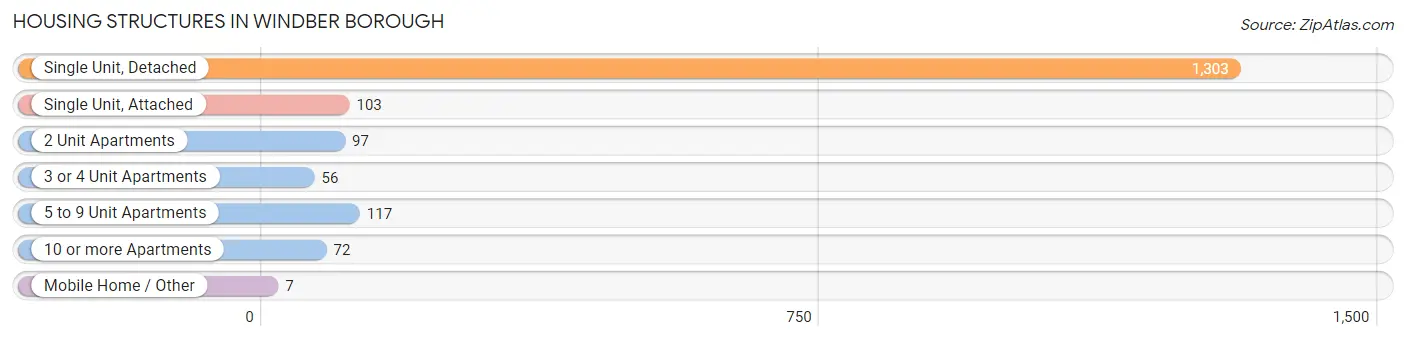
| Structure Type | # Housing Units | % Housing Units |
| Single Unit, Detached | 1,303 | 74.3% |
| Single Unit, Attached | 103 | 5.9% |
| 2 Unit Apartments | 97 | 5.5% |
| 3 or 4 Unit Apartments | 56 | 3.2% |
| 5 to 9 Unit Apartments | 117 | 6.7% |
| 10 or more Apartments | 72 | 4.1% |
| Mobile Home / Other | 7 | 0.4% |
| Total | 1,755 | 100.0% |
Housing Structures by Occupancy in Windber borough
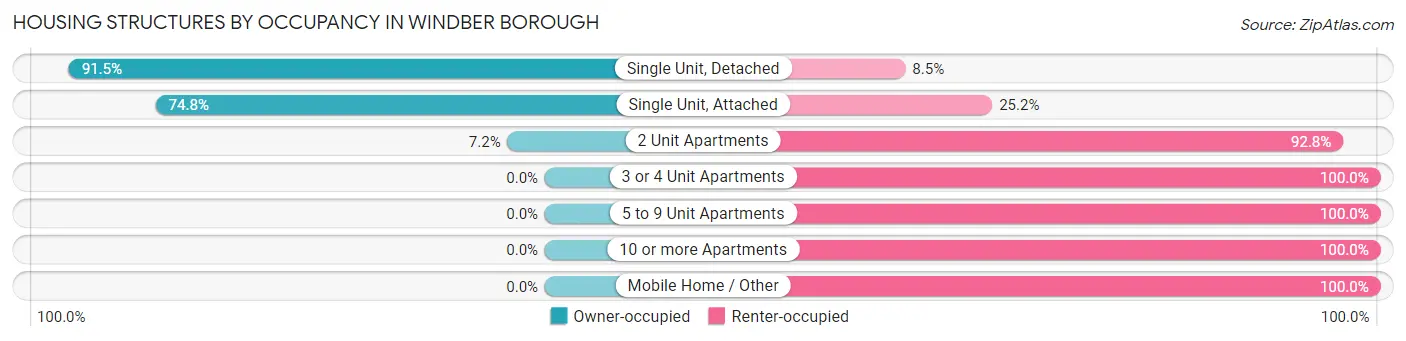
| Structure Type | Owner-occupied | Renter-occupied |
| Single Unit, Detached | 1,192 (91.5%) | 111 (8.5%) |
| Single Unit, Attached | 77 (74.8%) | 26 (25.2%) |
| 2 Unit Apartments | 7 (7.2%) | 90 (92.8%) |
| 3 or 4 Unit Apartments | 0 (0.0%) | 56 (100.0%) |
| 5 to 9 Unit Apartments | 0 (0.0%) | 117 (100.0%) |
| 10 or more Apartments | 0 (0.0%) | 72 (100.0%) |
| Mobile Home / Other | 0 (0.0%) | 7 (100.0%) |
| Total | 1,276 (72.7%) | 479 (27.3%) |
Housing Structures by Number of Rooms in Windber borough
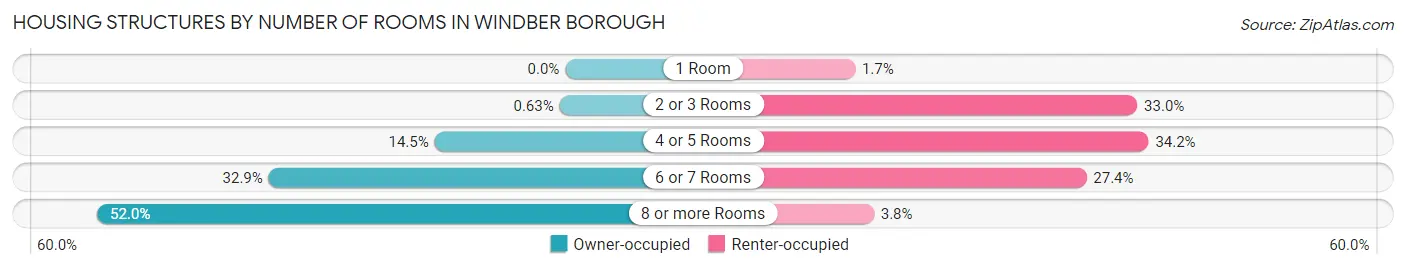
| Number of Rooms | Owner-occupied | Renter-occupied |
| 1 Room | 0 (0.0%) | 8 (1.7%) |
| 2 or 3 Rooms | 8 (0.6%) | 158 (33.0%) |
| 4 or 5 Rooms | 185 (14.5%) | 164 (34.2%) |
| 6 or 7 Rooms | 420 (32.9%) | 131 (27.4%) |
| 8 or more Rooms | 663 (52.0%) | 18 (3.8%) |
| Total | 1,276 (100.0%) | 479 (100.0%) |
Housing Structure by Heating Type in Windber borough
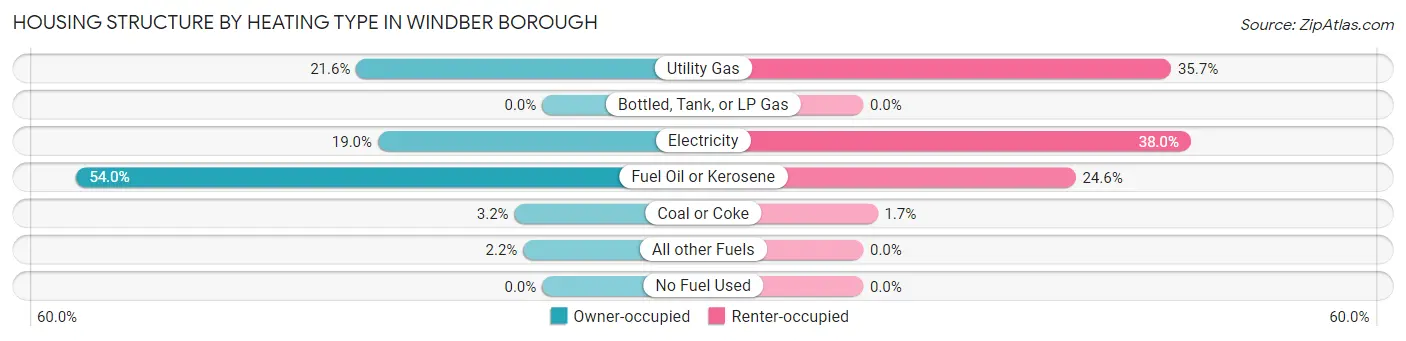
| Heating Type | Owner-occupied | Renter-occupied |
| Utility Gas | 275 (21.5%) | 171 (35.7%) |
| Bottled, Tank, or LP Gas | 0 (0.0%) | 0 (0.0%) |
| Electricity | 243 (19.0%) | 182 (38.0%) |
| Fuel Oil or Kerosene | 689 (54.0%) | 118 (24.6%) |
| Coal or Coke | 41 (3.2%) | 8 (1.7%) |
| All other Fuels | 28 (2.2%) | 0 (0.0%) |
| No Fuel Used | 0 (0.0%) | 0 (0.0%) |
| Total | 1,276 (100.0%) | 479 (100.0%) |
Household Vehicle Usage in Windber borough
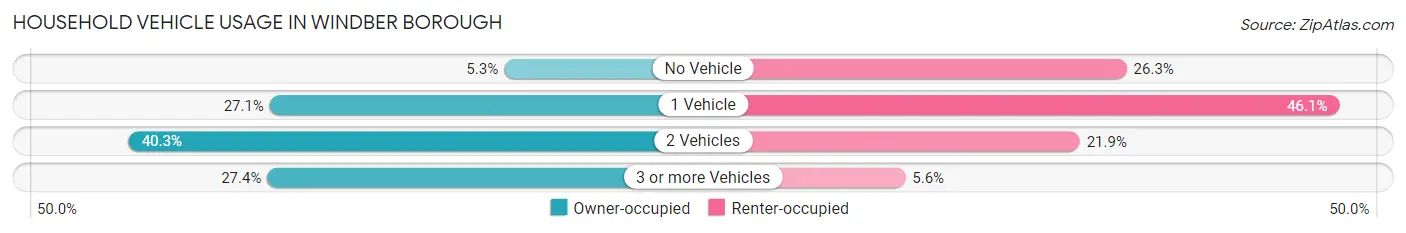
| Vehicles per Household | Owner-occupied | Renter-occupied |
| No Vehicle | 67 (5.2%) | 126 (26.3%) |
| 1 Vehicle | 346 (27.1%) | 221 (46.1%) |
| 2 Vehicles | 514 (40.3%) | 105 (21.9%) |
| 3 or more Vehicles | 349 (27.4%) | 27 (5.6%) |
| Total | 1,276 (100.0%) | 479 (100.0%) |
Real Estate & Mortgages in Windber borough
Real Estate and Mortgage Overview in Windber borough
| Characteristic | Without Mortgage | With Mortgage |
| Housing Units | 691 | 585 |
| Median Property Value | $86,500 | $107,400 |
| Median Household Income | $47,875 | $79 |
| Monthly Housing Costs | $466 | $0 |
| Real Estate Taxes | $985 | $14 |
Property Value by Mortgage Status in Windber borough
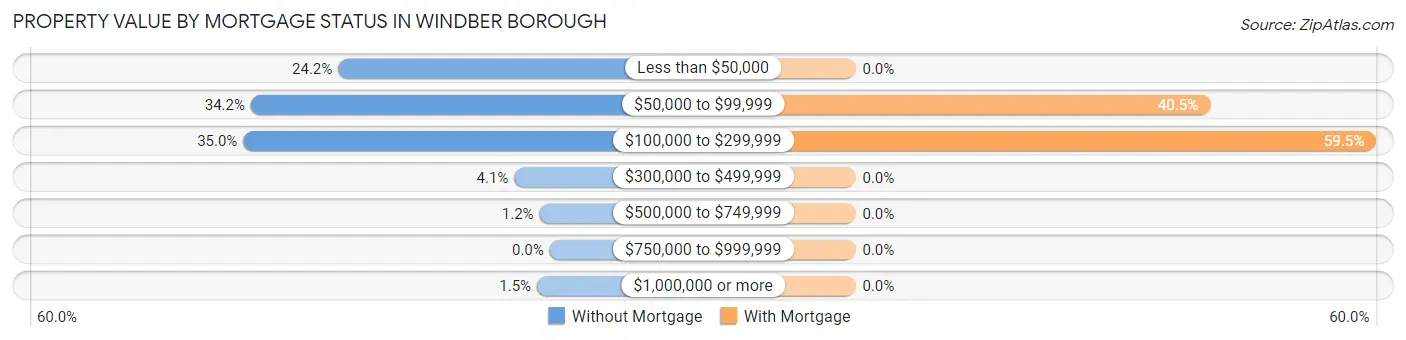
| Property Value | Without Mortgage | With Mortgage |
| Less than $50,000 | 167 (24.2%) | 0 (0.0%) |
| $50,000 to $99,999 | 236 (34.2%) | 237 (40.5%) |
| $100,000 to $299,999 | 242 (35.0%) | 348 (59.5%) |
| $300,000 to $499,999 | 28 (4.1%) | 0 (0.0%) |
| $500,000 to $749,999 | 8 (1.2%) | 0 (0.0%) |
| $750,000 to $999,999 | 0 (0.0%) | 0 (0.0%) |
| $1,000,000 or more | 10 (1.5%) | 0 (0.0%) |
| Total | 691 (100.0%) | 585 (100.0%) |
Household Income by Mortgage Status in Windber borough
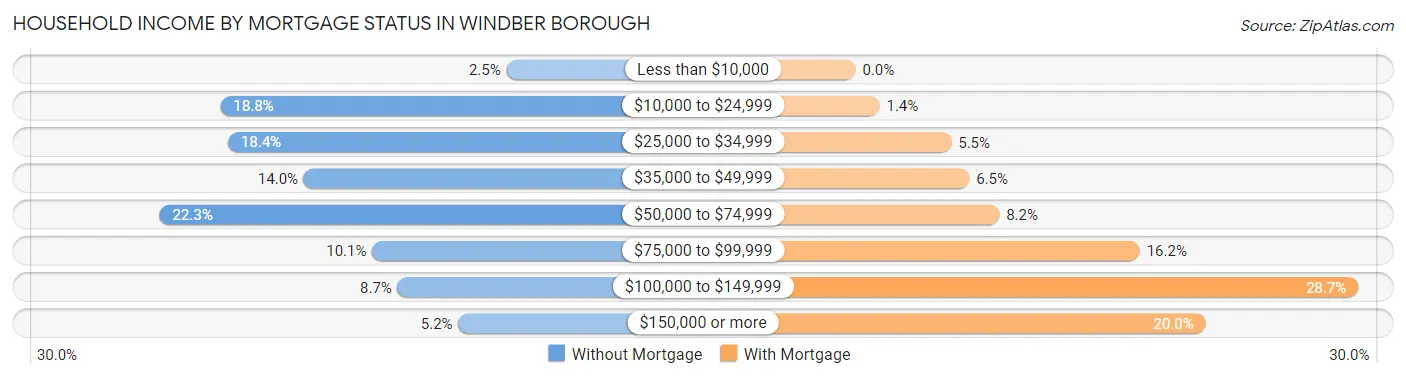
| Household Income | Without Mortgage | With Mortgage |
| Less than $10,000 | 17 (2.5%) | 0 (0.0%) |
| $10,000 to $24,999 | 130 (18.8%) | 8 (1.4%) |
| $25,000 to $34,999 | 127 (18.4%) | 32 (5.5%) |
| $35,000 to $49,999 | 97 (14.0%) | 38 (6.5%) |
| $50,000 to $74,999 | 154 (22.3%) | 48 (8.2%) |
| $75,000 to $99,999 | 70 (10.1%) | 95 (16.2%) |
| $100,000 to $149,999 | 60 (8.7%) | 168 (28.7%) |
| $150,000 or more | 36 (5.2%) | 117 (20.0%) |
| Total | 691 (100.0%) | 585 (100.0%) |
Property Value to Household Income Ratio in Windber borough
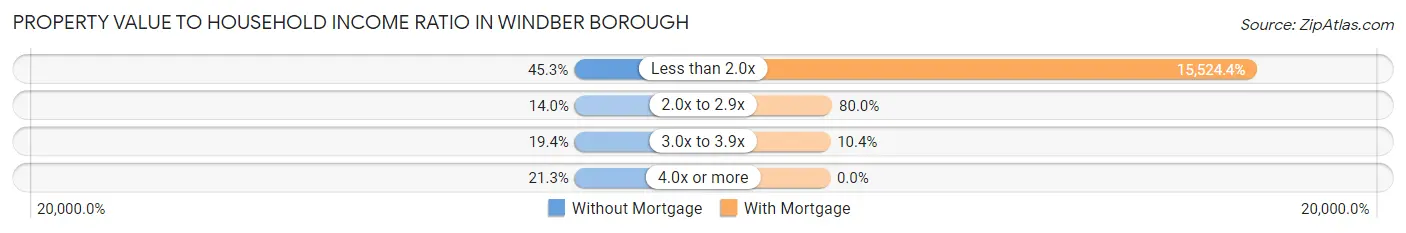
| Value-to-Income Ratio | Without Mortgage | With Mortgage |
| Less than 2.0x | 313 (45.3%) | 90,818 (15,524.4%) |
| 2.0x to 2.9x | 97 (14.0%) | 468 (80.0%) |
| 3.0x to 3.9x | 134 (19.4%) | 61 (10.4%) |
| 4.0x or more | 147 (21.3%) | 0 (0.0%) |
| Total | 691 (100.0%) | 585 (100.0%) |
Real Estate Taxes by Mortgage Status in Windber borough
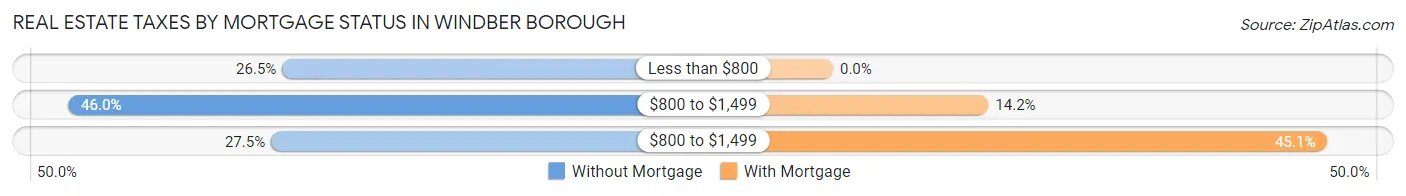
| Property Taxes | Without Mortgage | With Mortgage |
| Less than $800 | 183 (26.5%) | 0 (0.0%) |
| $800 to $1,499 | 318 (46.0%) | 83 (14.2%) |
| $800 to $1,499 | 190 (27.5%) | 264 (45.1%) |
| Total | 691 (100.0%) | 585 (100.0%) |
Health & Disability in Windber borough
Health Insurance Coverage by Age in Windber borough
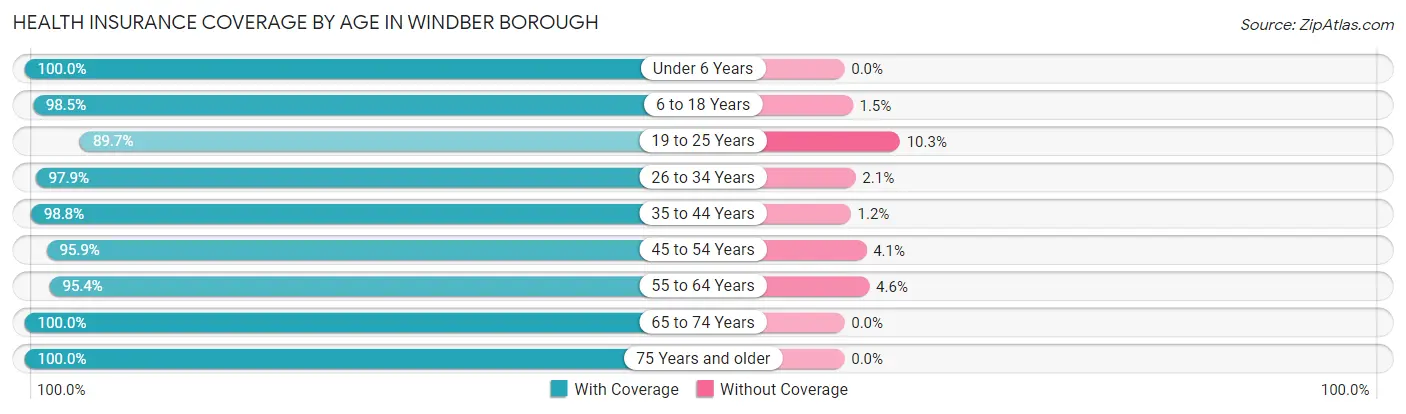
| Age Bracket | With Coverage | Without Coverage |
| Under 6 Years | 376 (100.0%) | 0 (0.0%) |
| 6 to 18 Years | 577 (98.5%) | 9 (1.5%) |
| 19 to 25 Years | 182 (89.7%) | 21 (10.3%) |
| 26 to 34 Years | 426 (97.9%) | 9 (2.1%) |
| 35 to 44 Years | 507 (98.8%) | 6 (1.2%) |
| 45 to 54 Years | 541 (95.9%) | 23 (4.1%) |
| 55 to 64 Years | 514 (95.4%) | 25 (4.6%) |
| 65 to 74 Years | 334 (100.0%) | 0 (0.0%) |
| 75 Years and older | 380 (100.0%) | 0 (0.0%) |
| Total | 3,837 (97.6%) | 93 (2.4%) |
Health Insurance Coverage by Citizenship Status in Windber borough
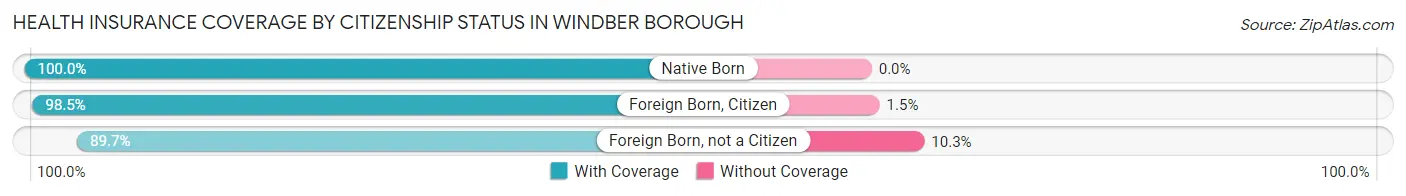
| Citizenship Status | With Coverage | Without Coverage |
| Native Born | 376 (100.0%) | 0 (0.0%) |
| Foreign Born, Citizen | 577 (98.5%) | 9 (1.5%) |
| Foreign Born, not a Citizen | 182 (89.7%) | 21 (10.3%) |
Health Insurance Coverage by Household Income in Windber borough
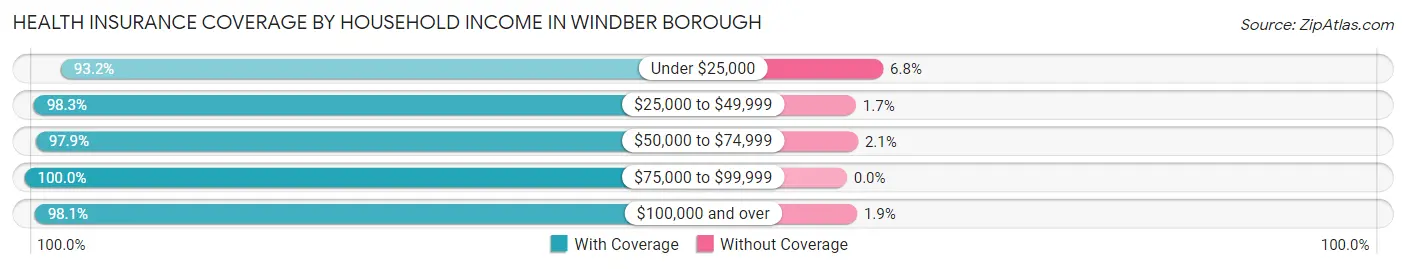
| Household Income | With Coverage | Without Coverage |
| Under $25,000 | 534 (93.2%) | 39 (6.8%) |
| $25,000 to $49,999 | 921 (98.3%) | 16 (1.7%) |
| $50,000 to $74,999 | 838 (97.9%) | 18 (2.1%) |
| $75,000 to $99,999 | 514 (100.0%) | 0 (0.0%) |
| $100,000 and over | 1,030 (98.1%) | 20 (1.9%) |
Public vs Private Health Insurance Coverage by Age in Windber borough
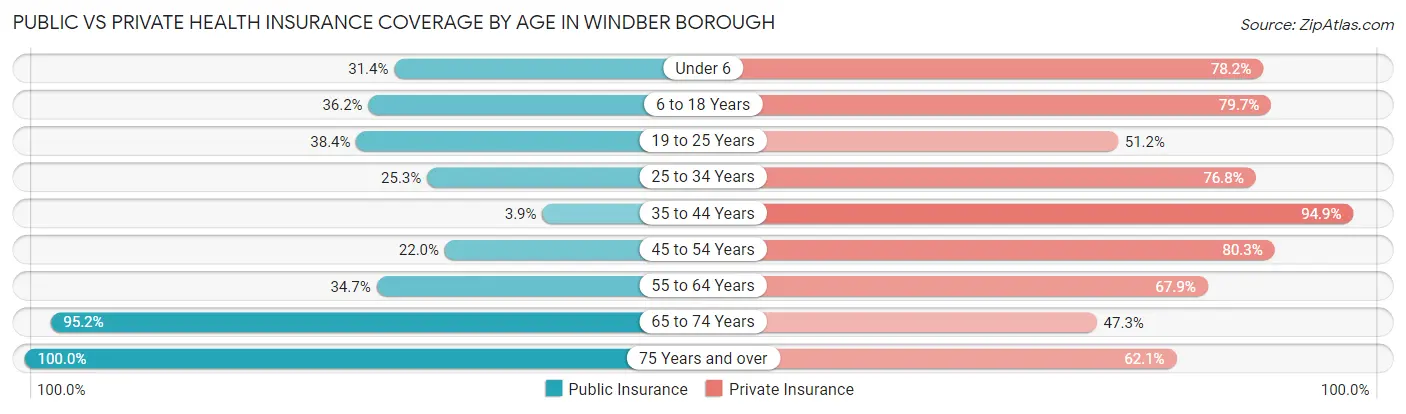
| Age Bracket | Public Insurance | Private Insurance |
| Under 6 | 118 (31.4%) | 294 (78.2%) |
| 6 to 18 Years | 212 (36.2%) | 467 (79.7%) |
| 19 to 25 Years | 78 (38.4%) | 104 (51.2%) |
| 25 to 34 Years | 110 (25.3%) | 334 (76.8%) |
| 35 to 44 Years | 20 (3.9%) | 487 (94.9%) |
| 45 to 54 Years | 124 (22.0%) | 453 (80.3%) |
| 55 to 64 Years | 187 (34.7%) | 366 (67.9%) |
| 65 to 74 Years | 318 (95.2%) | 158 (47.3%) |
| 75 Years and over | 380 (100.0%) | 236 (62.1%) |
| Total | 1,547 (39.4%) | 2,899 (73.8%) |
Disability Status by Sex by Age in Windber borough
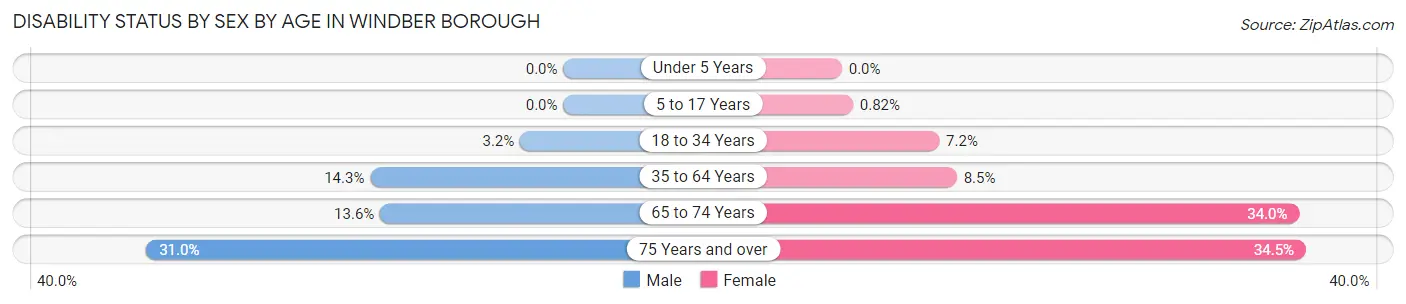
| Age Bracket | Male | Female |
| Under 5 Years | 0 (0.0%) | 0 (0.0%) |
| 5 to 17 Years | 0 (0.0%) | 3 (0.8%) |
| 18 to 34 Years | 12 (3.2%) | 25 (7.2%) |
| 35 to 64 Years | 114 (14.3%) | 70 (8.5%) |
| 65 to 74 Years | 17 (13.6%) | 71 (34.0%) |
| 75 Years and over | 35 (31.0%) | 92 (34.5%) |
Disability Class by Sex by Age in Windber borough
Disability Class: Hearing Difficulty
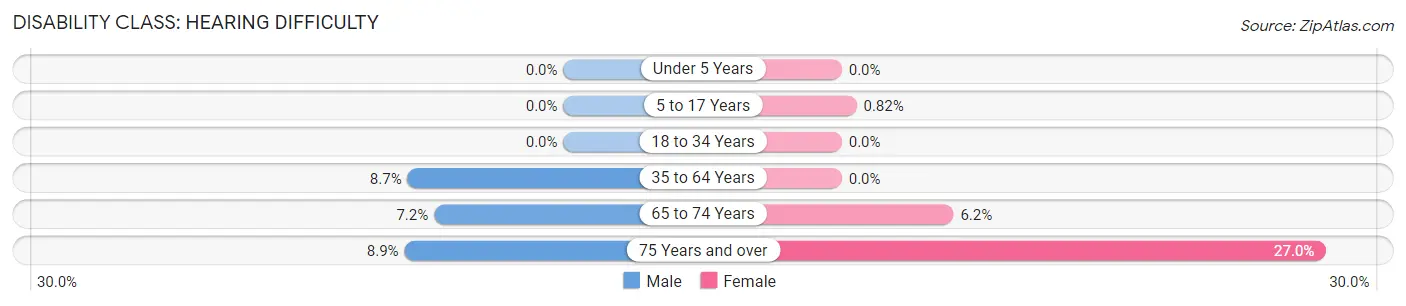
| Age Bracket | Male | Female |
| Under 5 Years | 0 (0.0%) | 0 (0.0%) |
| 5 to 17 Years | 0 (0.0%) | 3 (0.8%) |
| 18 to 34 Years | 0 (0.0%) | 0 (0.0%) |
| 35 to 64 Years | 69 (8.7%) | 0 (0.0%) |
| 65 to 74 Years | 9 (7.2%) | 13 (6.2%) |
| 75 Years and over | 10 (8.8%) | 72 (27.0%) |
Disability Class: Vision Difficulty
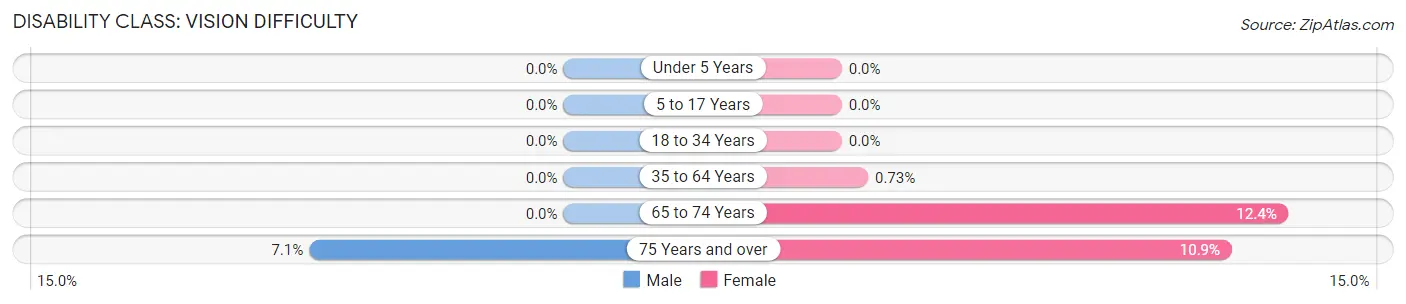
| Age Bracket | Male | Female |
| Under 5 Years | 0 (0.0%) | 0 (0.0%) |
| 5 to 17 Years | 0 (0.0%) | 0 (0.0%) |
| 18 to 34 Years | 0 (0.0%) | 0 (0.0%) |
| 35 to 64 Years | 0 (0.0%) | 6 (0.7%) |
| 65 to 74 Years | 0 (0.0%) | 26 (12.4%) |
| 75 Years and over | 8 (7.1%) | 29 (10.9%) |
Disability Class: Cognitive Difficulty
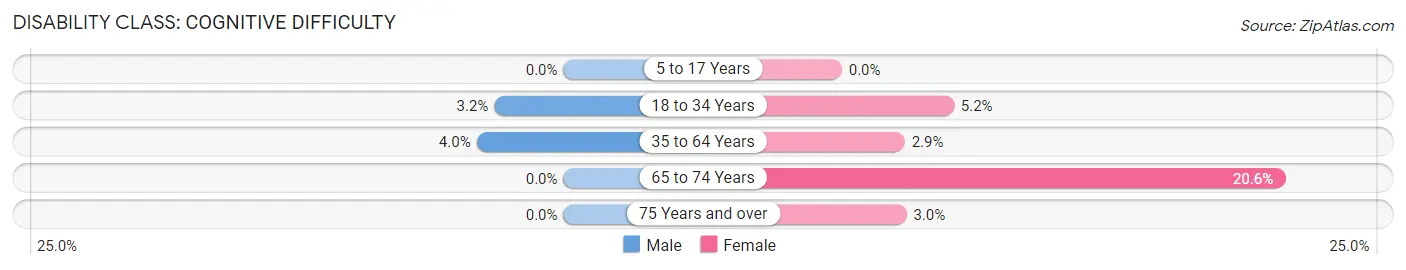
| Age Bracket | Male | Female |
| 5 to 17 Years | 0 (0.0%) | 0 (0.0%) |
| 18 to 34 Years | 12 (3.2%) | 18 (5.2%) |
| 35 to 64 Years | 32 (4.0%) | 24 (2.9%) |
| 65 to 74 Years | 0 (0.0%) | 43 (20.6%) |
| 75 Years and over | 0 (0.0%) | 8 (3.0%) |
Disability Class: Ambulatory Difficulty
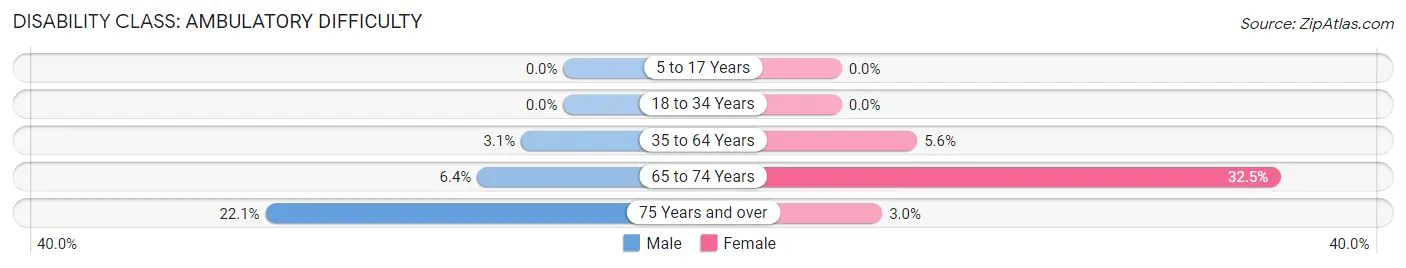
| Age Bracket | Male | Female |
| 5 to 17 Years | 0 (0.0%) | 0 (0.0%) |
| 18 to 34 Years | 0 (0.0%) | 0 (0.0%) |
| 35 to 64 Years | 25 (3.1%) | 46 (5.6%) |
| 65 to 74 Years | 8 (6.4%) | 68 (32.5%) |
| 75 Years and over | 25 (22.1%) | 8 (3.0%) |
Disability Class: Self-Care Difficulty
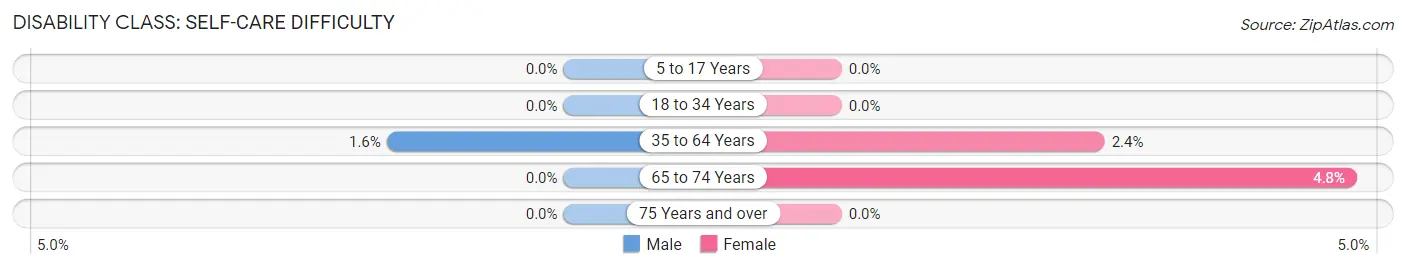
| Age Bracket | Male | Female |
| 5 to 17 Years | 0 (0.0%) | 0 (0.0%) |
| 18 to 34 Years | 0 (0.0%) | 0 (0.0%) |
| 35 to 64 Years | 13 (1.6%) | 20 (2.4%) |
| 65 to 74 Years | 0 (0.0%) | 10 (4.8%) |
| 75 Years and over | 0 (0.0%) | 0 (0.0%) |
Technology Access in Windber borough
Computing Device Access in Windber borough
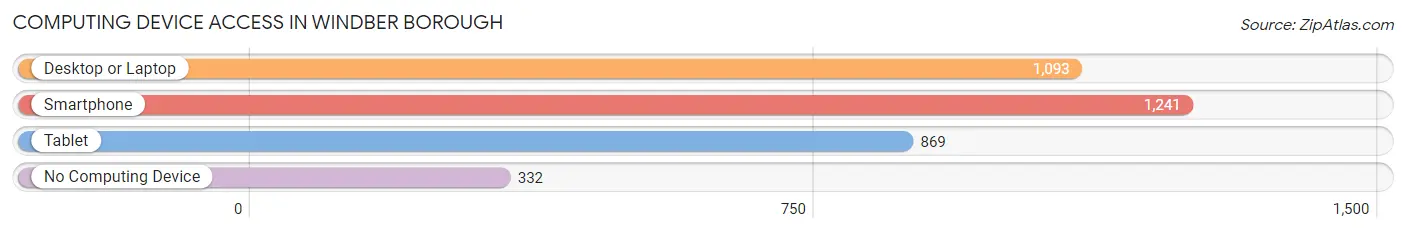
| Device Type | # Households | % Households |
| Desktop or Laptop | 1,093 | 62.3% |
| Smartphone | 1,241 | 70.7% |
| Tablet | 869 | 49.5% |
| No Computing Device | 332 | 18.9% |
| Total | 1,755 | 100.0% |
Internet Access in Windber borough
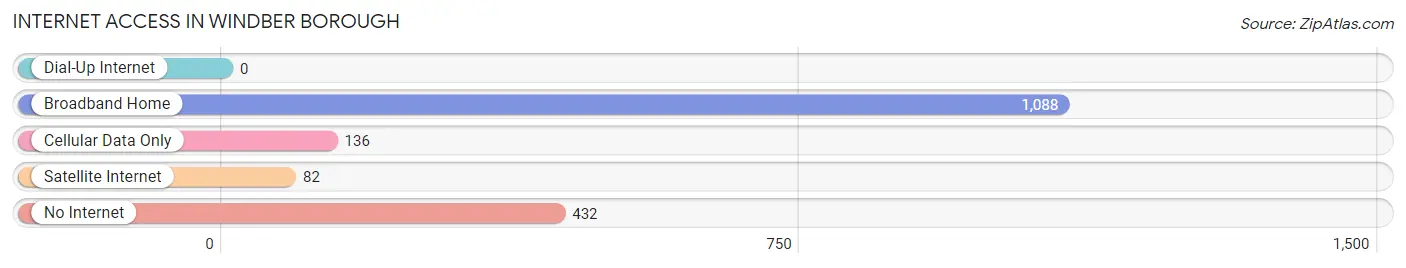
| Internet Type | # Households | % Households |
| Dial-Up Internet | 0 | 0.0% |
| Broadband Home | 1,088 | 62.0% |
| Cellular Data Only | 136 | 7.7% |
| Satellite Internet | 82 | 4.7% |
| No Internet | 432 | 24.6% |
| Total | 1,755 | 100.0% |
Windber borough Summary
Berwind Borough is a small borough located in Somerset County, Pennsylvania. It is situated in the Allegheny Mountains, approximately 50 miles southeast of Pittsburgh. The borough is home to a population of approximately 1,500 people, and is part of the Johnstown Metropolitan Statistical Area.
History
Berwind Borough was founded in 1891 by the Berwind Coal Company. The company was founded by Edward Julius Berwind, a wealthy coal baron from Philadelphia. Berwind purchased the land in order to develop a coal mining operation. The town was named after him, and the company was the primary employer in the area for many years.
The town grew rapidly in the early 20th century, and by 1910 the population had reached 1,000. The town was incorporated in 1911, and the first mayor was elected in 1912. The town continued to grow throughout the 20th century, and by 2000 the population had reached 1,500.
Geography
Berwind Borough is located in the Allegheny Mountains of Somerset County, Pennsylvania. The borough is situated at an elevation of 1,890 feet above sea level. The borough is located approximately 50 miles southeast of Pittsburgh.
The borough is bordered by the towns of Windber, Paint Township, and Shade Township. The borough is located in a rural area, and is surrounded by forests and rolling hills. The borough is located near the Allegheny Front, a mountain range that runs through the area.
The borough is located in a humid continental climate zone, with cold winters and hot summers. The average annual temperature is 48°F, and the average annual precipitation is 40 inches.
Economy
Berwind Borough is a small, rural community with a limited economy. The primary industry in the borough is coal mining, which has been the primary industry in the area since the town was founded in 1891. The Berwind Coal Company is the largest employer in the borough, and employs approximately 500 people.
The borough also has a small manufacturing sector, which includes a few small factories and businesses. The borough also has a few retail stores, restaurants, and other small businesses.
Demographics
Berwind Borough has a population of approximately 1,500 people. The population is predominantly white, with a small minority population. The median household income is $37,000, and the median home value is $90,000.
The borough has a high rate of poverty, with approximately 25% of the population living below the poverty line. The borough also has a high rate of unemployment, with approximately 10% of the population unemployed.
Conclusion
Berwind Borough is a small borough located in Somerset County, Pennsylvania. The borough was founded in 1891 by the Berwind Coal Company, and has a population of approximately 1,500 people. The primary industry in the borough is coal mining, and the borough also has a small manufacturing sector and a few retail stores. The borough has a high rate of poverty and unemployment, and the median household income is $37,000.
Common Questions
What is Per Capita Income in Windber borough?
Per Capita income in Windber borough is $30,545.
What is the Median Family Income in Windber borough?
Median Family Income in Windber borough is $61,607.
What is the Median Household income in Windber borough?
Median Household Income in Windber borough is $48,299.
What is Income or Wage Gap in Windber borough?
Income or Wage Gap in Windber borough is 28.5%.
Women in Windber borough earn 71.5 cents for every dollar earned by a man.
What is Inequality or Gini Index in Windber borough?
Inequality or Gini Index in Windber borough is 0.46.
What is the Total Population of Windber borough?
Total Population of Windber borough is 3,930.
What is the Total Male Population of Windber borough?
Total Male Population of Windber borough is 1,867.
What is the Total Female Population of Windber borough?
Total Female Population of Windber borough is 2,063.
What is the Ratio of Males per 100 Females in Windber borough?
There are 90.50 Males per 100 Females in Windber borough.
What is the Ratio of Females per 100 Males in Windber borough?
There are 110.50 Females per 100 Males in Windber borough.
What is the Median Population Age in Windber borough?
Median Population Age in Windber borough is 41.5 Years.
What is the Average Family Size in Windber borough
Average Family Size in Windber borough is 2.9 People.
What is the Average Household Size in Windber borough
Average Household Size in Windber borough is 2.2 People.
How Large is the Labor Force in Windber borough?
There are 2,012 People in the Labor Forcein in Windber borough.
What is the Percentage of People in the Labor Force in Windber borough?
65.1% of People are in the Labor Force in Windber borough.
What is the Unemployment Rate in Windber borough?
Unemployment Rate in Windber borough is 2.6%.