Wheatland borough, PA Map & Demographics
Wheatland borough Overview
$26,189
PER CAPITA INCOME
$55,625
AVG FAMILY INCOME
$48,750
AVG HOUSEHOLD INCOME
40.1%
WAGE / INCOME GAP [ % ]
59.9¢/ $1
WAGE / INCOME GAP [ $ ]
0.36
INEQUALITY / GINI INDEX
506
TOTAL POPULATION
245
MALE POPULATION
261
FEMALE POPULATION
93.87
MALES / 100 FEMALES
106.53
FEMALES / 100 MALES
44.3
MEDIAN AGE
2.8
AVG FAMILY SIZE
2.1
AVG HOUSEHOLD SIZE
289
LABOR FORCE [ PEOPLE ]
65.5%
PERCENT IN LABOR FORCE
4.2%
UNEMPLOYMENT RATE
Income in Wheatland borough
Income Overview in Wheatland borough
Per Capita Income in Wheatland borough is $26,189, while median incomes of families and households are $55,625 and $48,750 respectively.
| Characteristic | Number | Measure |
| Per Capita Income | 506 | $26,189 |
| Median Family Income | 126 | $55,625 |
| Mean Family Income | 126 | $61,763 |
| Median Household Income | 236 | $48,750 |
| Mean Household Income | 236 | $51,855 |
| Income Deficit | 126 | $0 |
| Wage / Income Gap (%) | 506 | 40.10% |
| Wage / Income Gap ($) | 506 | 59.90¢ per $1 |
| Gini / Inequality Index | 506 | 0.36 |
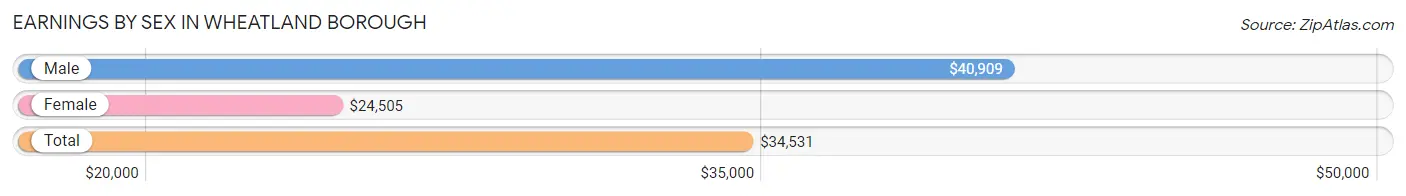
Earnings by Sex in Wheatland borough
Average Earnings in Wheatland borough are $34,531, $40,909 for men and $24,505 for women, a difference of 40.1%.
| Sex | Number | Average Earnings |
| Male | 146 (50.5%) | $40,909 |
| Female | 143 (49.5%) | $24,505 |
| Total | 289 (100.0%) | $34,531 |
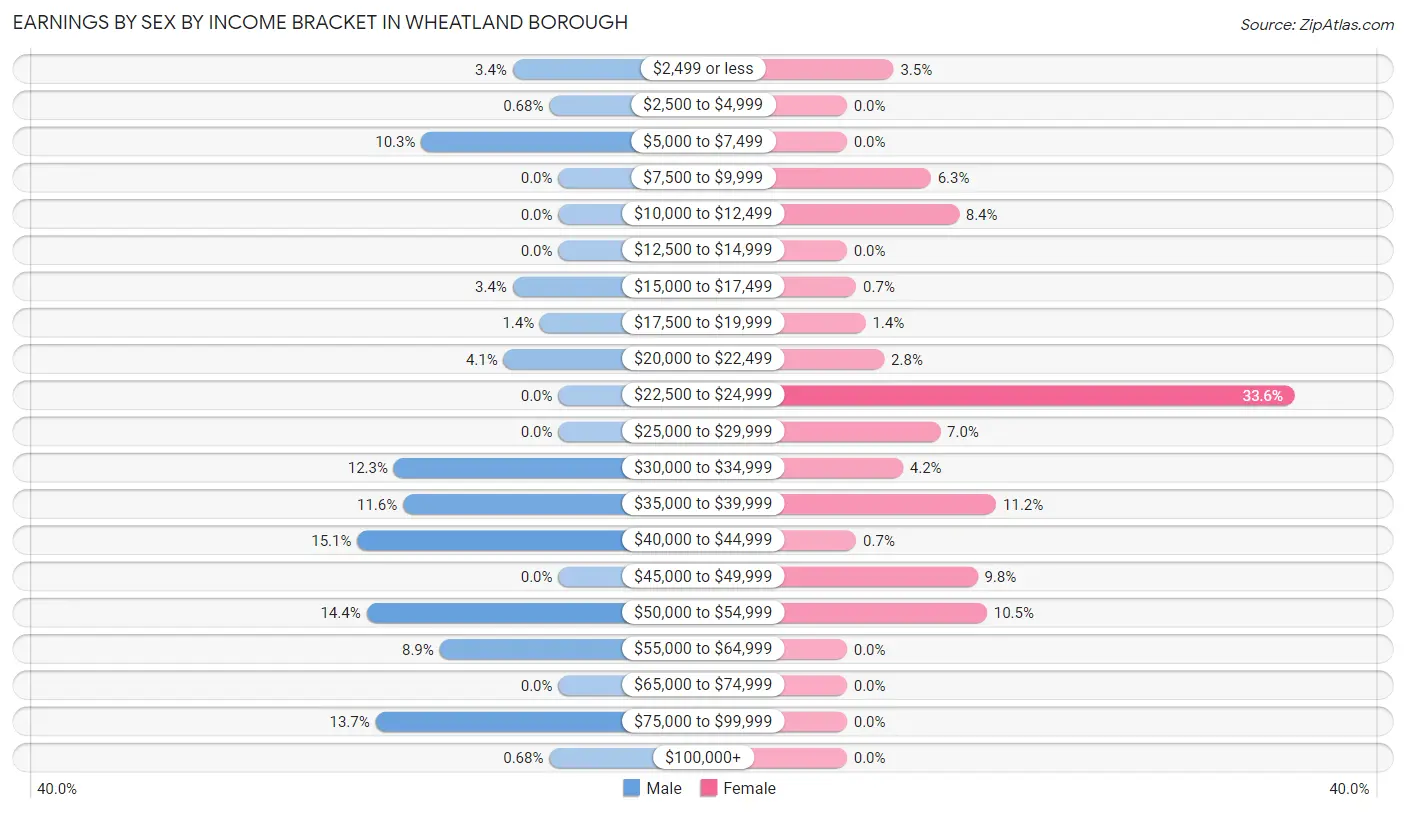
Earnings by Sex by Income Bracket in Wheatland borough
The most common earnings brackets in Wheatland borough are $40,000 to $44,999 for men (22 | 15.1%) and $22,500 to $24,999 for women (48 | 33.6%).
| Income | Male | Female |
| $2,499 or less | 5 (3.4%) | 5 (3.5%) |
| $2,500 to $4,999 | 1 (0.7%) | 0 (0.0%) |
| $5,000 to $7,499 | 15 (10.3%) | 0 (0.0%) |
| $7,500 to $9,999 | 0 (0.0%) | 9 (6.3%) |
| $10,000 to $12,499 | 0 (0.0%) | 12 (8.4%) |
| $12,500 to $14,999 | 0 (0.0%) | 0 (0.0%) |
| $15,000 to $17,499 | 5 (3.4%) | 1 (0.7%) |
| $17,500 to $19,999 | 2 (1.4%) | 2 (1.4%) |
| $20,000 to $22,499 | 6 (4.1%) | 4 (2.8%) |
| $22,500 to $24,999 | 0 (0.0%) | 48 (33.6%) |
| $25,000 to $29,999 | 0 (0.0%) | 10 (7.0%) |
| $30,000 to $34,999 | 18 (12.3%) | 6 (4.2%) |
| $35,000 to $39,999 | 17 (11.6%) | 16 (11.2%) |
| $40,000 to $44,999 | 22 (15.1%) | 1 (0.7%) |
| $45,000 to $49,999 | 0 (0.0%) | 14 (9.8%) |
| $50,000 to $54,999 | 21 (14.4%) | 15 (10.5%) |
| $55,000 to $64,999 | 13 (8.9%) | 0 (0.0%) |
| $65,000 to $74,999 | 0 (0.0%) | 0 (0.0%) |
| $75,000 to $99,999 | 20 (13.7%) | 0 (0.0%) |
| $100,000+ | 1 (0.7%) | 0 (0.0%) |
| Total | 146 (100.0%) | 143 (100.0%) |
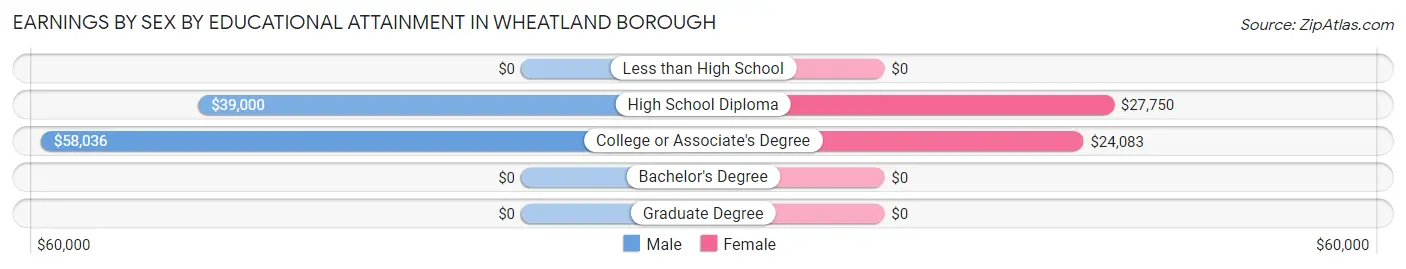
Earnings by Sex by Educational Attainment in Wheatland borough
Average earnings in Wheatland borough are $41,023 for men and $24,349 for women, a difference of 40.6%. Men with an educational attainment of college or associate's degree enjoy the highest average annual earnings of $58,036, while those with high school diploma education earn the least with $39,000. Women with an educational attainment of high school diploma earn the most with the average annual earnings of $27,750, while those with college or associate's degree education have the smallest earnings of $24,083.
| Educational Attainment | Male Income | Female Income |
| Less than High School | - | - |
| High School Diploma | $39,000 | $27,750 |
| College or Associate's Degree | $58,036 | $24,083 |
| Bachelor's Degree | - | - |
| Graduate Degree | - | - |
| Total | $41,023 | $24,349 |
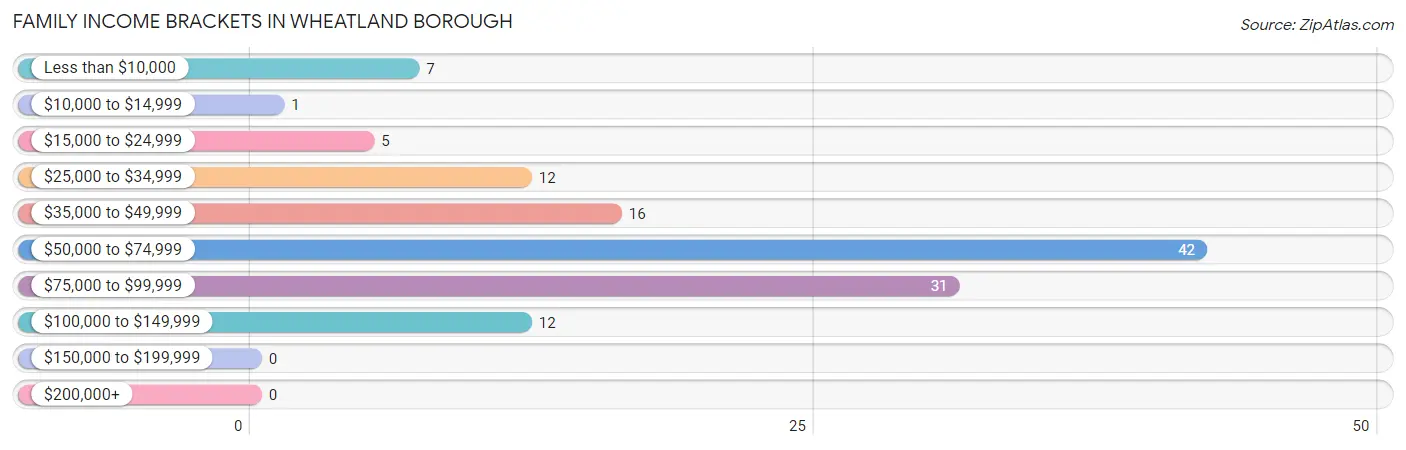
Family Income in Wheatland borough
Family Income Brackets in Wheatland borough
According to the Wheatland borough family income data, there are 42 families falling into the $50,000 to $74,999 income range, which is the most common income bracket and makes up 33.3% of all families.
| Income Bracket | # Families | % Families |
| Less than $10,000 | 7 | 5.6% |
| $10,000 to $14,999 | 1 | 0.8% |
| $15,000 to $24,999 | 5 | 4.0% |
| $25,000 to $34,999 | 12 | 9.5% |
| $35,000 to $49,999 | 16 | 12.7% |
| $50,000 to $74,999 | 42 | 33.3% |
| $75,000 to $99,999 | 31 | 24.6% |
| $100,000 to $149,999 | 12 | 9.5% |
| $150,000 to $199,999 | 0 | 0.0% |
| $200,000+ | 0 | 0.0% |
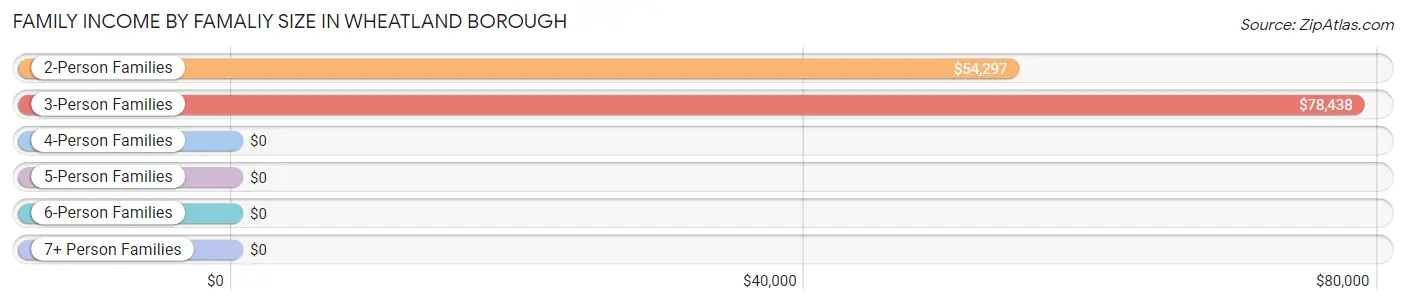
Family Income by Famaliy Size in Wheatland borough
3-person families (25 | 19.8%) account for the highest median family income in Wheatland borough with $78,438 per family, while 2-person families (91 | 72.2%) have the highest median income of $27,148 per family member.
| Income Bracket | # Families | Median Income |
| 2-Person Families | 91 (72.2%) | $54,297 |
| 3-Person Families | 25 (19.8%) | $78,438 |
| 4-Person Families | 1 (0.8%) | $0 |
| 5-Person Families | 9 (7.1%) | $0 |
| 6-Person Families | 0 (0.0%) | $0 |
| 7+ Person Families | 0 (0.0%) | $0 |
| Total | 126 (100.0%) | $55,625 |
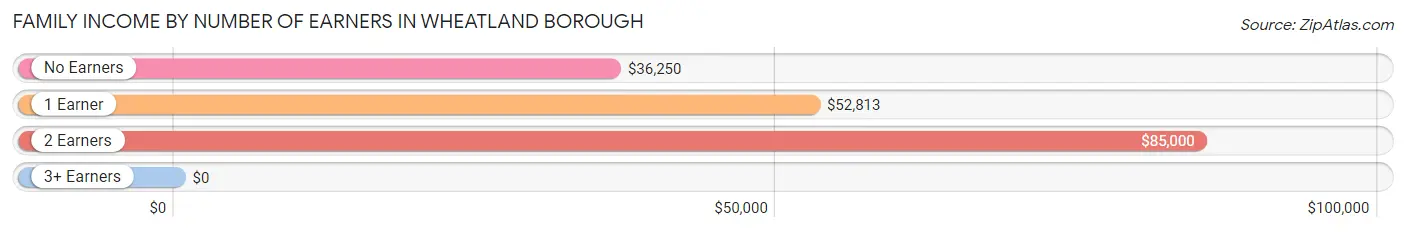
Family Income by Number of Earners in Wheatland borough
| Number of Earners | # Families | Median Income |
| No Earners | 30 (23.8%) | $36,250 |
| 1 Earner | 46 (36.5%) | $52,813 |
| 2 Earners | 38 (30.2%) | $85,000 |
| 3+ Earners | 12 (9.5%) | $0 |
| Total | 126 (100.0%) | $55,625 |
Household Income in Wheatland borough
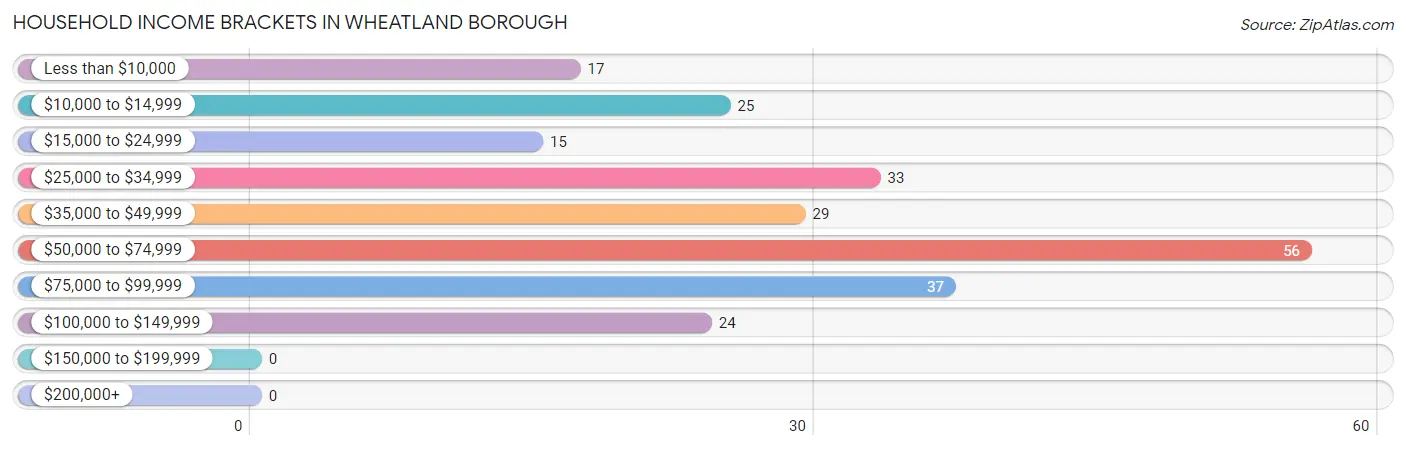
Household Income Brackets in Wheatland borough
With 56 households falling in the category, the $50,000 to $74,999 income range is the most frequent in Wheatland borough, accounting for 23.7% of all households.
| Income Bracket | # Households | % Households |
| Less than $10,000 | 17 | 7.2% |
| $10,000 to $14,999 | 25 | 10.6% |
| $15,000 to $24,999 | 15 | 6.4% |
| $25,000 to $34,999 | 33 | 14.0% |
| $35,000 to $49,999 | 29 | 12.3% |
| $50,000 to $74,999 | 56 | 23.7% |
| $75,000 to $99,999 | 37 | 15.7% |
| $100,000 to $149,999 | 24 | 10.2% |
| $150,000 to $199,999 | 0 | 0.0% |
| $200,000+ | 0 | 0.0% |
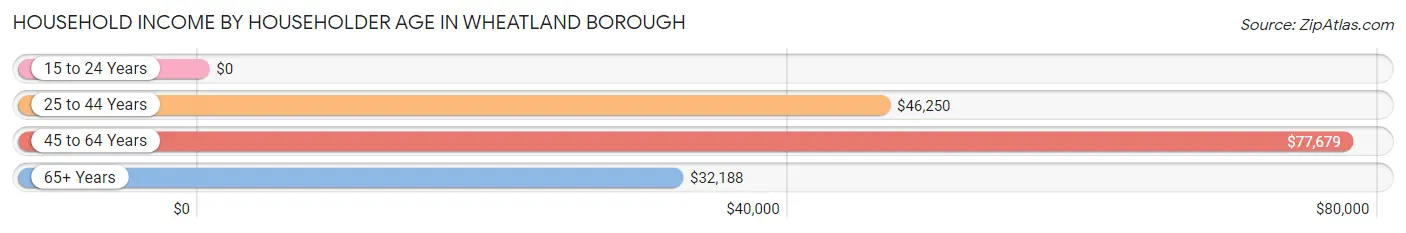
Household Income by Householder Age in Wheatland borough
The median household income in Wheatland borough is $48,750, with the highest median household income of $77,679 found in the 45 to 64 years age bracket for the primary householder. A total of 85 households (36.0%) fall into this category. Meanwhile, the 15 to 24 years age bracket for the primary householder has the lowest median household income of $0, with 5 households (2.1%) in this group.
| Income Bracket | # Households | Median Income |
| 15 to 24 Years | 5 (2.1%) | $0 |
| 25 to 44 Years | 95 (40.3%) | $46,250 |
| 45 to 64 Years | 85 (36.0%) | $77,679 |
| 65+ Years | 51 (21.6%) | $32,188 |
| Total | 236 (100.0%) | $48,750 |
Poverty in Wheatland borough
Income Below Poverty by Sex and Age in Wheatland borough
With 14.7% poverty level for males and 19.5% for females among the residents of Wheatland borough, 5 year old males and 35 to 44 year old females are the most vulnerable to poverty, with 5 males (100.0%) and 12 females (48.0%) in their respective age groups living below the poverty level.
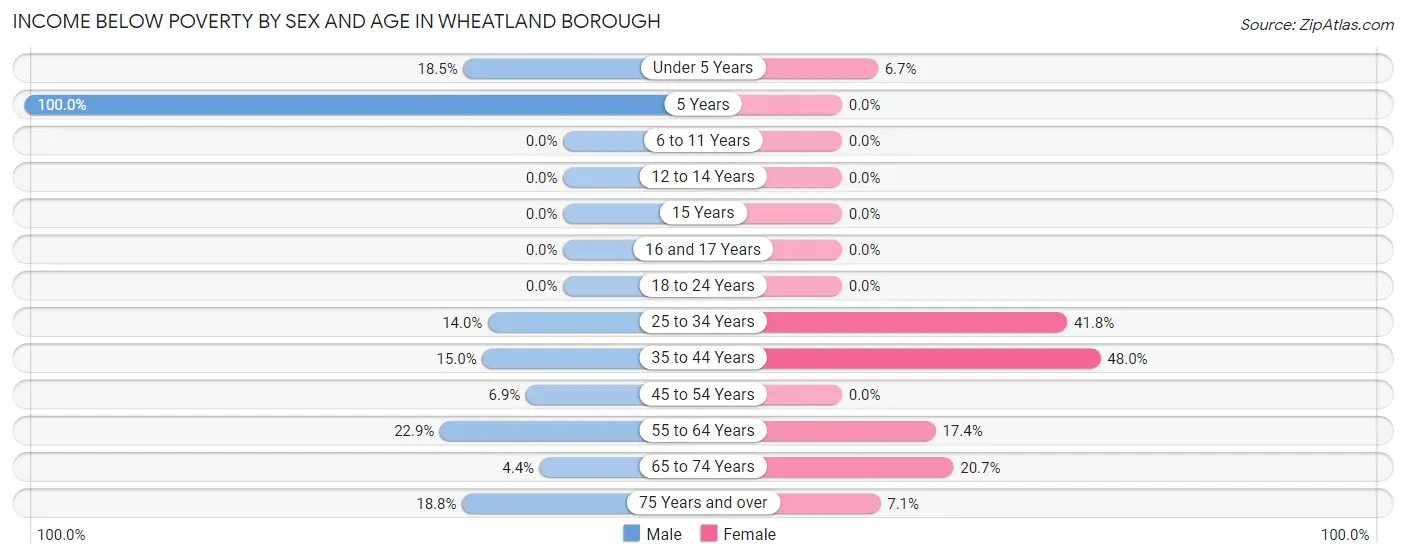
| Age Bracket | Male | Female |
| Under 5 Years | 5 (18.5%) | 1 (6.7%) |
| 5 Years | 5 (100.0%) | 0 (0.0%) |
| 6 to 11 Years | 0 (0.0%) | 0 (0.0%) |
| 12 to 14 Years | 0 (0.0%) | 0 (0.0%) |
| 15 Years | 0 (0.0%) | 0 (0.0%) |
| 16 and 17 Years | 0 (0.0%) | 0 (0.0%) |
| 18 to 24 Years | 0 (0.0%) | 0 (0.0%) |
| 25 to 34 Years | 6 (14.0%) | 23 (41.8%) |
| 35 to 44 Years | 6 (15.0%) | 12 (48.0%) |
| 45 to 54 Years | 2 (6.9%) | 0 (0.0%) |
| 55 to 64 Years | 8 (22.9%) | 8 (17.4%) |
| 65 to 74 Years | 1 (4.3%) | 6 (20.7%) |
| 75 Years and over | 3 (18.8%) | 1 (7.1%) |
| Total | 36 (14.7%) | 51 (19.5%) |
Income Above Poverty by Sex and Age in Wheatland borough
According to the poverty statistics in Wheatland borough, males aged 6 to 11 years and females aged 6 to 11 years are the age groups that are most secure financially, with 100.0% of males and 100.0% of females in these age groups living above the poverty line.
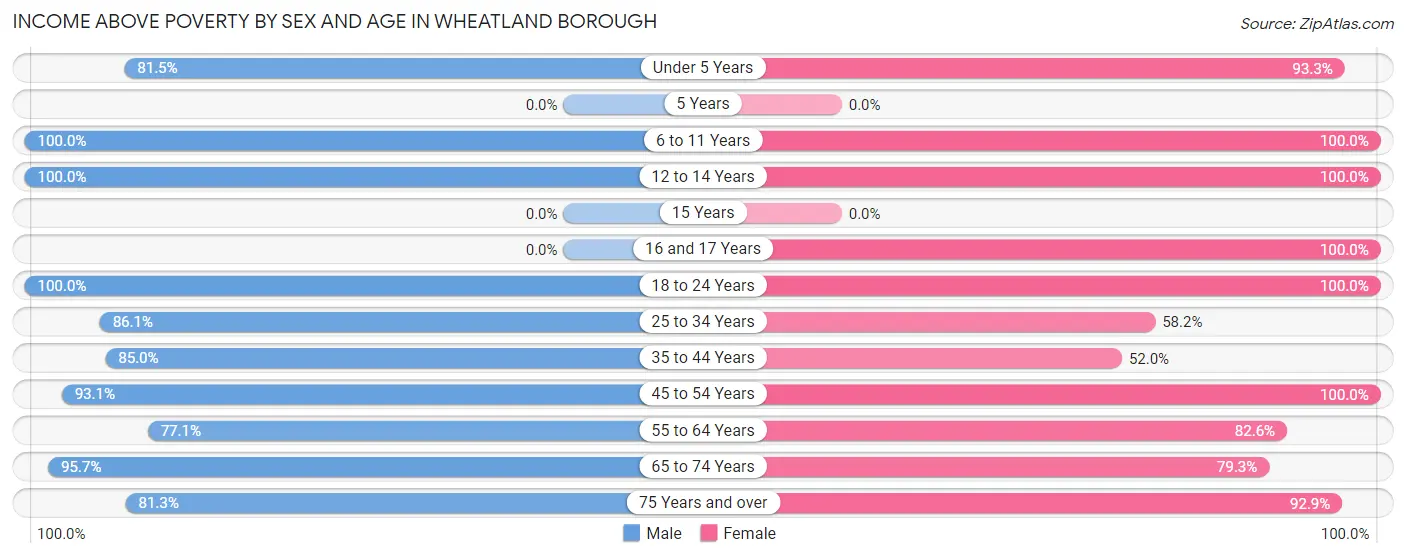
| Age Bracket | Male | Female |
| Under 5 Years | 22 (81.5%) | 14 (93.3%) |
| 5 Years | 0 (0.0%) | 0 (0.0%) |
| 6 to 11 Years | 1 (100.0%) | 8 (100.0%) |
| 12 to 14 Years | 6 (100.0%) | 3 (100.0%) |
| 15 Years | 0 (0.0%) | 0 (0.0%) |
| 16 and 17 Years | 0 (0.0%) | 1 (100.0%) |
| 18 to 24 Years | 20 (100.0%) | 6 (100.0%) |
| 25 to 34 Years | 37 (86.1%) | 32 (58.2%) |
| 35 to 44 Years | 34 (85.0%) | 13 (52.0%) |
| 45 to 54 Years | 27 (93.1%) | 59 (100.0%) |
| 55 to 64 Years | 27 (77.1%) | 38 (82.6%) |
| 65 to 74 Years | 22 (95.7%) | 23 (79.3%) |
| 75 Years and over | 13 (81.2%) | 13 (92.9%) |
| Total | 209 (85.3%) | 210 (80.5%) |
Income Below Poverty Among Married-Couple Families in Wheatland borough
The poverty statistics for married-couple families in Wheatland borough show that 2.6% or 2 of the total 78 families live below the poverty line. Families with no children have the highest poverty rate of 3.2%, comprising of 2 families. On the other hand, families with 1 or 2 children have the lowest poverty rate of 0.0%, which includes 0 families.
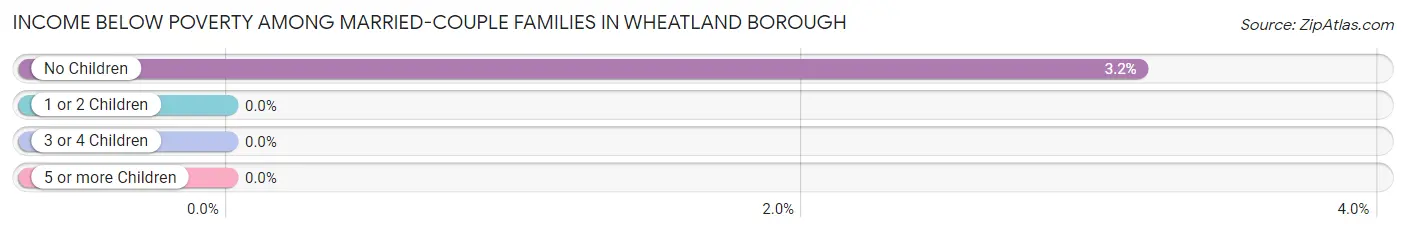
| Children | Above Poverty | Below Poverty |
| No Children | 61 (96.8%) | 2 (3.2%) |
| 1 or 2 Children | 13 (100.0%) | 0 (0.0%) |
| 3 or 4 Children | 2 (100.0%) | 0 (0.0%) |
| 5 or more Children | 0 (0.0%) | 0 (0.0%) |
| Total | 76 (97.4%) | 2 (2.6%) |
Income Below Poverty Among Single-Parent Households in Wheatland borough
According to the poverty data in Wheatland borough, 19.2% or 5 single-father households and 13.6% or 3 single-mother households are living below the poverty line. Among single-father households, those with 1 or 2 children have the highest poverty rate, with 5 households (19.2%) experiencing poverty. Likewise, among single-mother households, those with 1 or 2 children have the highest poverty rate, with 2 households (100.0%) falling below the poverty line.
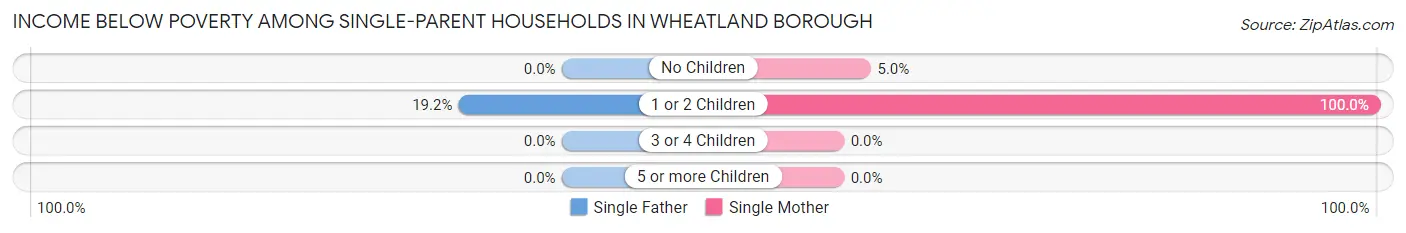
| Children | Single Father | Single Mother |
| No Children | 0 (0.0%) | 1 (5.0%) |
| 1 or 2 Children | 5 (19.2%) | 2 (100.0%) |
| 3 or 4 Children | 0 (0.0%) | 0 (0.0%) |
| 5 or more Children | 0 (0.0%) | 0 (0.0%) |
| Total | 5 (19.2%) | 3 (13.6%) |
Income Below Poverty Among Married-Couple vs Single-Parent Households in Wheatland borough
The poverty data for Wheatland borough shows that 2 of the married-couple family households (2.6%) and 8 of the single-parent households (16.7%) are living below the poverty level. Within the married-couple family households, those with no children have the highest poverty rate, with 2 households (3.2%) falling below the poverty line. Among the single-parent households, those with 1 or 2 children have the highest poverty rate, with 7 household (25.0%) living below poverty.
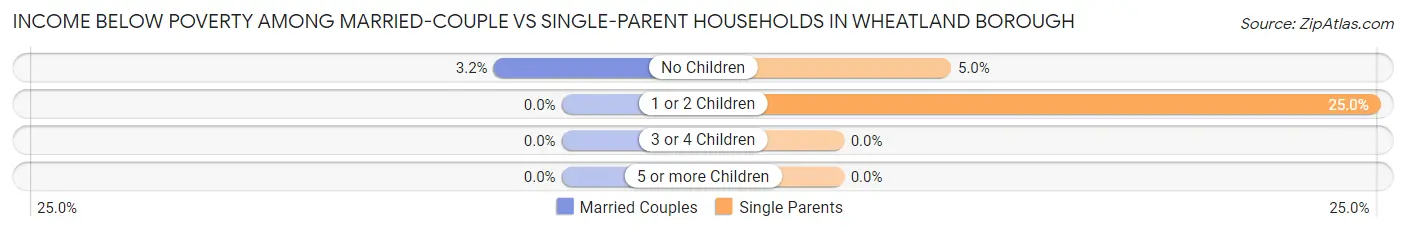
| Children | Married-Couple Families | Single-Parent Households |
| No Children | 2 (3.2%) | 1 (5.0%) |
| 1 or 2 Children | 0 (0.0%) | 7 (25.0%) |
| 3 or 4 Children | 0 (0.0%) | 0 (0.0%) |
| 5 or more Children | 0 (0.0%) | 0 (0.0%) |
| Total | 2 (2.6%) | 8 (16.7%) |
Race in Wheatland borough
The most populous races in Wheatland borough are White / Caucasian (406 | 80.2%), Black / African American (57 | 11.3%), and Two or more Races (43 | 8.5%).
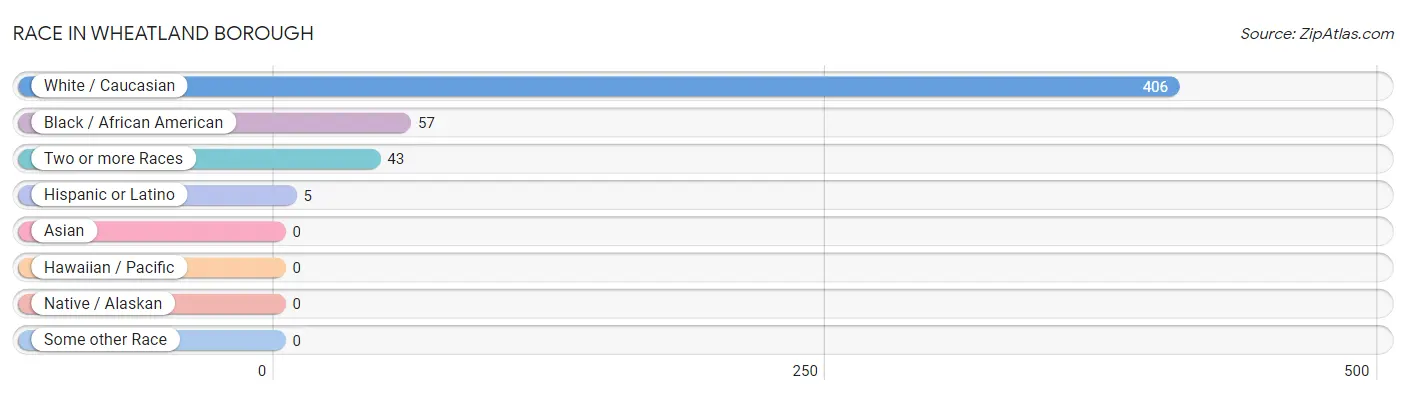
| Race | # Population | % Population |
| Asian | 0 | 0.0% |
| Black / African American | 57 | 11.3% |
| Hawaiian / Pacific | 0 | 0.0% |
| Hispanic or Latino | 5 | 1.0% |
| Native / Alaskan | 0 | 0.0% |
| White / Caucasian | 406 | 80.2% |
| Two or more Races | 43 | 8.5% |
| Some other Race | 0 | 0.0% |
| Total | 506 | 100.0% |
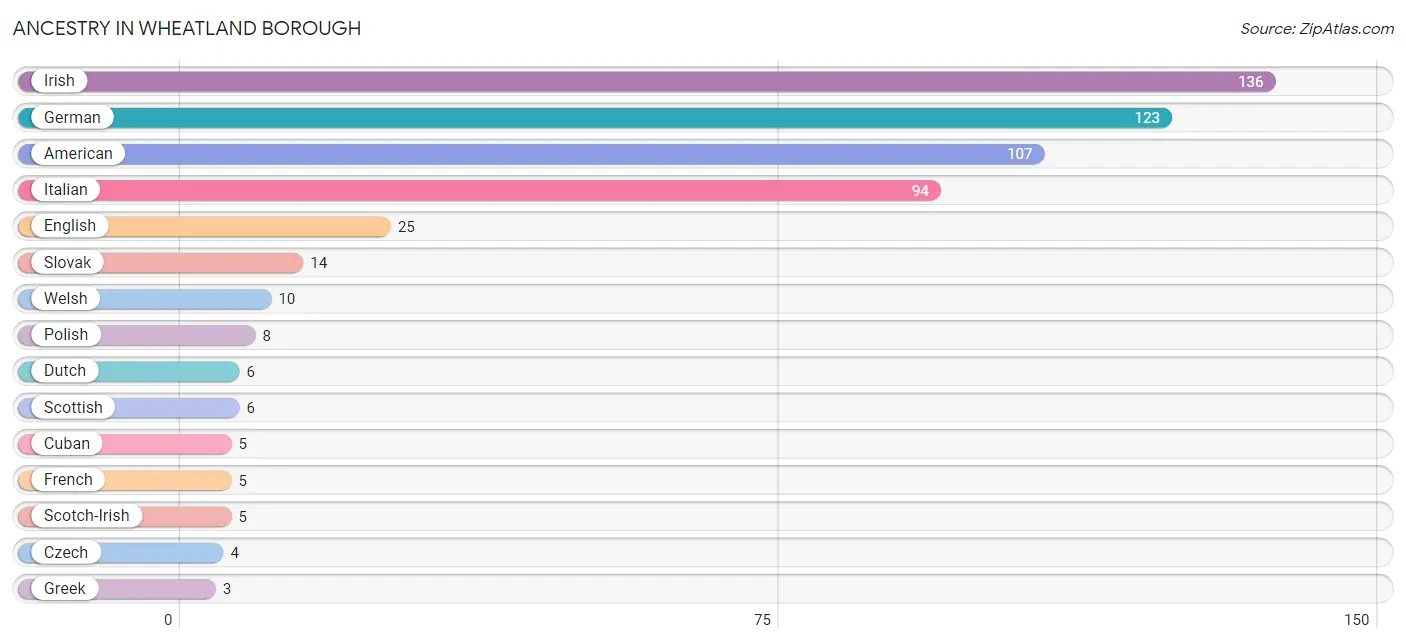
Ancestry in Wheatland borough
The most populous ancestries reported in Wheatland borough are Irish (136 | 26.9%), German (123 | 24.3%), American (107 | 21.1%), Italian (94 | 18.6%), and English (25 | 4.9%), together accounting for 95.9% of all Wheatland borough residents.
| Ancestry | # Population | % Population |
| American | 107 | 21.1% |
| British | 2 | 0.4% |
| Cuban | 5 | 1.0% |
| Czech | 4 | 0.8% |
| Dutch | 6 | 1.2% |
| Eastern European | 1 | 0.2% |
| English | 25 | 4.9% |
| French | 5 | 1.0% |
| French Canadian | 1 | 0.2% |
| German | 123 | 24.3% |
| Greek | 3 | 0.6% |
| Hungarian | 3 | 0.6% |
| Irish | 136 | 26.9% |
| Italian | 94 | 18.6% |
| Lithuanian | 3 | 0.6% |
| Pennsylvania German | 1 | 0.2% |
| Polish | 8 | 1.6% |
| Romanian | 2 | 0.4% |
| Scotch-Irish | 5 | 1.0% |
| Scottish | 6 | 1.2% |
| Slovak | 14 | 2.8% |
| Welsh | 10 | 2.0% | View All 22 Rows |
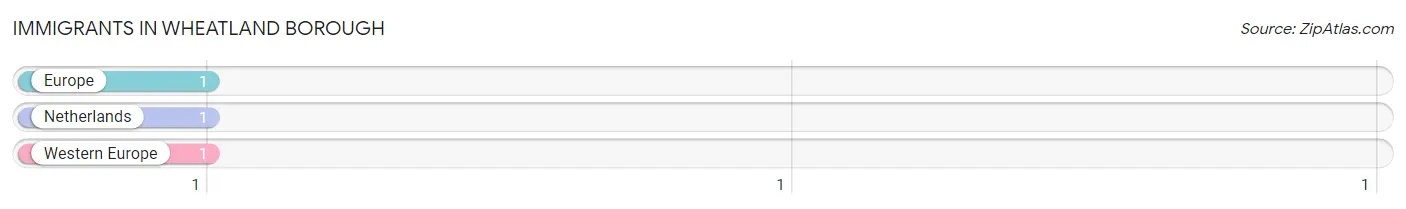
Immigrants in Wheatland borough
The most numerous immigrant groups reported in Wheatland borough came from Europe (1 | 0.2%), Netherlands (1 | 0.2%), and Western Europe (1 | 0.2%), together accounting for 0.6% of all Wheatland borough residents.
| Immigration Origin | # Population | % Population |
| Europe | 1 | 0.2% |
| Netherlands | 1 | 0.2% |
| Western Europe | 1 | 0.2% | View All 3 Rows |
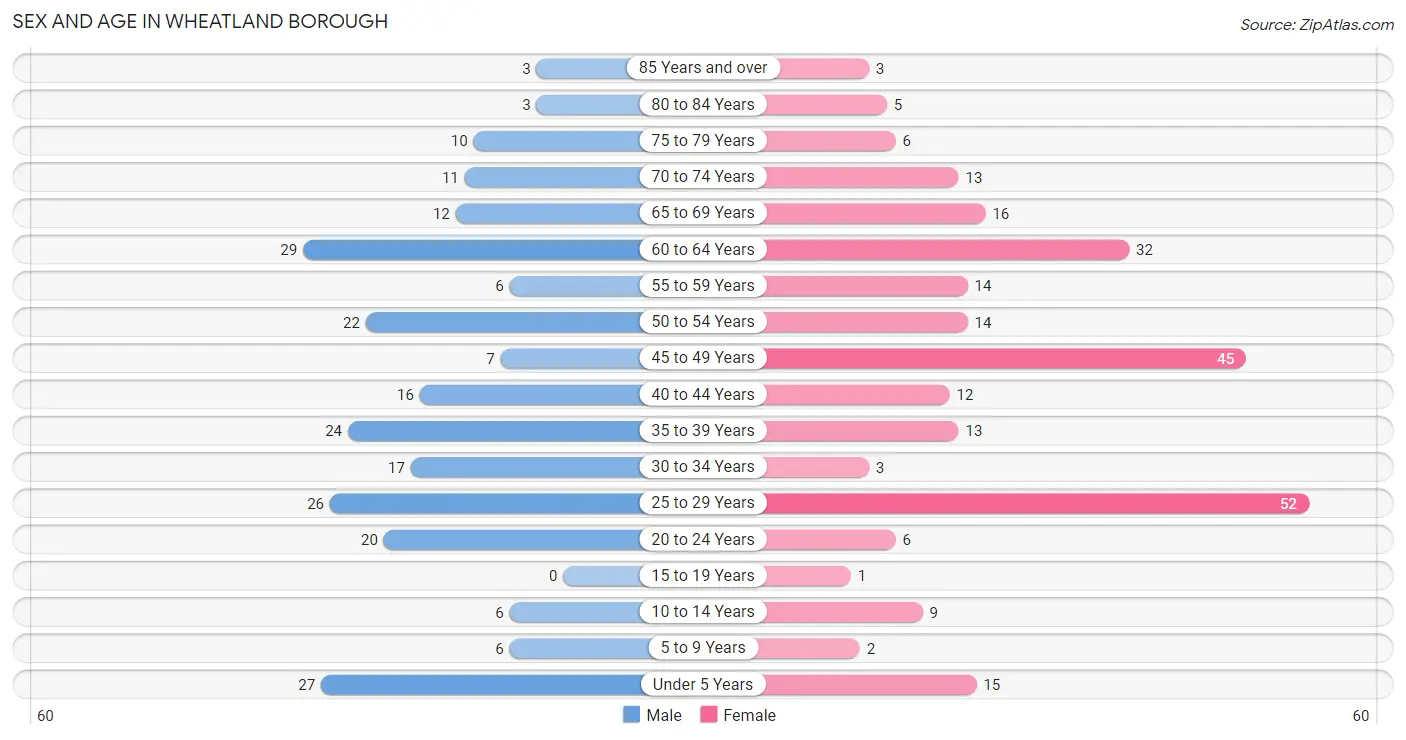
Sex and Age in Wheatland borough
Sex and Age in Wheatland borough
The most populous age groups in Wheatland borough are 60 to 64 Years (29 | 11.8%) for men and 25 to 29 Years (52 | 19.9%) for women.
| Age Bracket | Male | Female |
| Under 5 Years | 27 (11.0%) | 15 (5.8%) |
| 5 to 9 Years | 6 (2.5%) | 2 (0.8%) |
| 10 to 14 Years | 6 (2.5%) | 9 (3.5%) |
| 15 to 19 Years | 0 (0.0%) | 1 (0.4%) |
| 20 to 24 Years | 20 (8.2%) | 6 (2.3%) |
| 25 to 29 Years | 26 (10.6%) | 52 (19.9%) |
| 30 to 34 Years | 17 (6.9%) | 3 (1.1%) |
| 35 to 39 Years | 24 (9.8%) | 13 (5.0%) |
| 40 to 44 Years | 16 (6.5%) | 12 (4.6%) |
| 45 to 49 Years | 7 (2.9%) | 45 (17.2%) |
| 50 to 54 Years | 22 (9.0%) | 14 (5.4%) |
| 55 to 59 Years | 6 (2.5%) | 14 (5.4%) |
| 60 to 64 Years | 29 (11.8%) | 32 (12.3%) |
| 65 to 69 Years | 12 (4.9%) | 16 (6.1%) |
| 70 to 74 Years | 11 (4.5%) | 13 (5.0%) |
| 75 to 79 Years | 10 (4.1%) | 6 (2.3%) |
| 80 to 84 Years | 3 (1.2%) | 5 (1.9%) |
| 85 Years and over | 3 (1.2%) | 3 (1.1%) |
| Total | 245 (100.0%) | 261 (100.0%) |
Families and Households in Wheatland borough
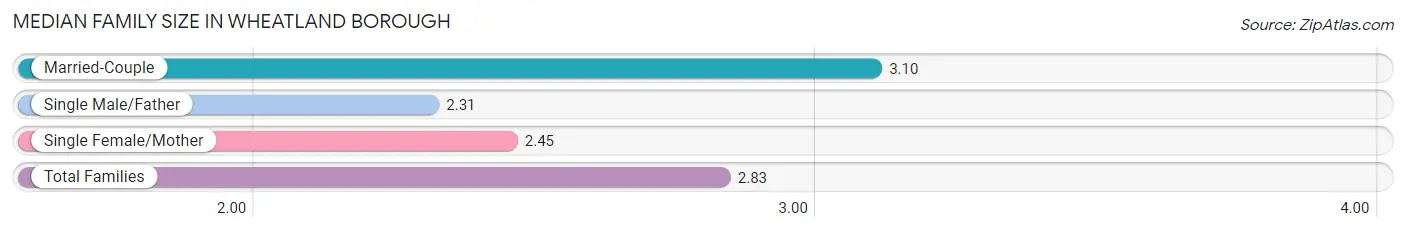
Median Family Size in Wheatland borough
The median family size in Wheatland borough is 2.83 persons per family, with married-couple families (78 | 61.9%) accounting for the largest median family size of 3.1 persons per family. On the other hand, single male/father families (26 | 20.6%) represent the smallest median family size with 2.31 persons per family.
| Family Type | # Families | Family Size |
| Married-Couple | 78 (61.9%) | 3.10 |
| Single Male/Father | 26 (20.6%) | 2.31 |
| Single Female/Mother | 22 (17.5%) | 2.45 |
| Total Families | 126 (100.0%) | 2.83 |
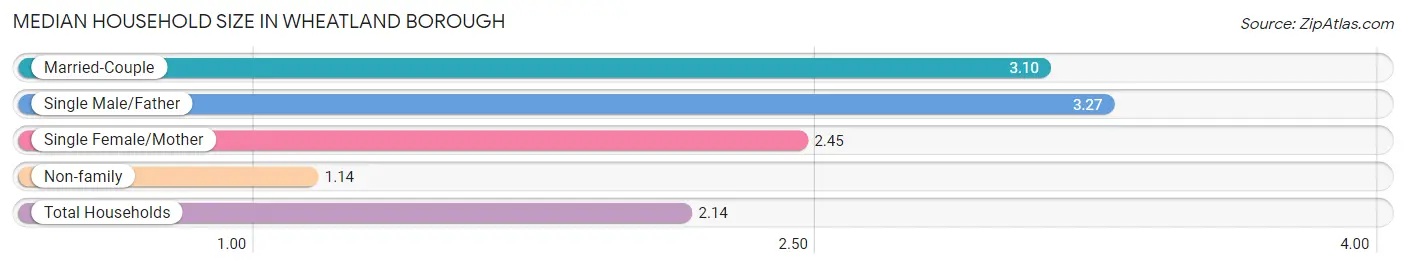
Median Household Size in Wheatland borough
The median household size in Wheatland borough is 2.14 persons per household, with single male/father households (26 | 11.0%) accounting for the largest median household size of 3.27 persons per household. non-family households (110 | 46.6%) represent the smallest median household size with 1.14 persons per household.
| Household Type | # Households | Household Size |
| Married-Couple | 78 (33.1%) | 3.10 |
| Single Male/Father | 26 (11.0%) | 3.27 |
| Single Female/Mother | 22 (9.3%) | 2.45 |
| Non-family | 110 (46.6%) | 1.14 |
| Total Households | 236 (100.0%) | 2.14 |
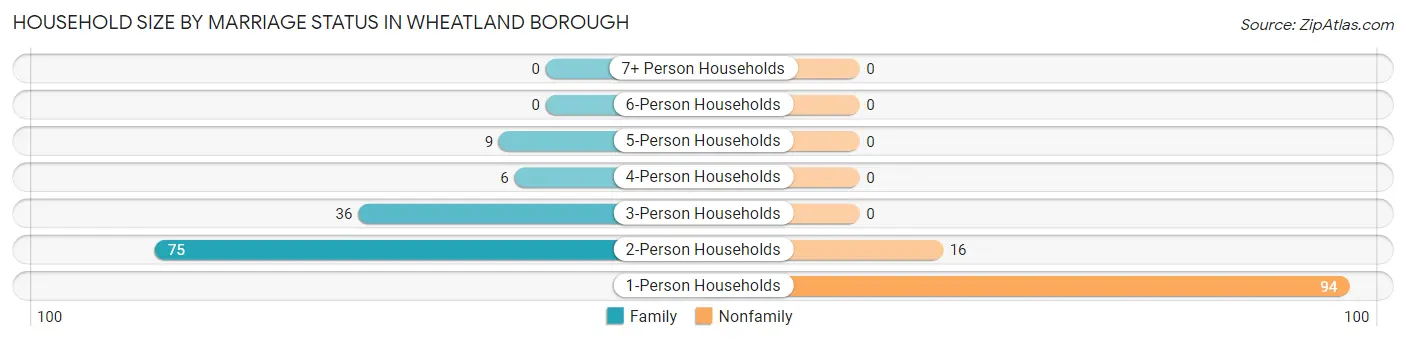
Household Size by Marriage Status in Wheatland borough
Out of a total of 236 households in Wheatland borough, 126 (53.4%) are family households, while 110 (46.6%) are nonfamily households. The most numerous type of family households are 2-person households, comprising 75, and the most common type of nonfamily households are 1-person households, comprising 94.
| Household Size | Family Households | Nonfamily Households |
| 1-Person Households | - | 94 (39.8%) |
| 2-Person Households | 75 (31.8%) | 16 (6.8%) |
| 3-Person Households | 36 (15.2%) | 0 (0.0%) |
| 4-Person Households | 6 (2.5%) | 0 (0.0%) |
| 5-Person Households | 9 (3.8%) | 0 (0.0%) |
| 6-Person Households | 0 (0.0%) | 0 (0.0%) |
| 7+ Person Households | 0 (0.0%) | 0 (0.0%) |
| Total | 126 (53.4%) | 110 (46.6%) |
Female Fertility in Wheatland borough
Fertility by Age in Wheatland borough
| Age Bracket | Women with Births | Births / 1,000 Women |
| 15 to 19 years | 0 (0.0%) | 0.0 |
| 20 to 34 years | 0 (0.0%) | 0.0 |
| 35 to 50 years | 0 (0.0%) | 0.0 |
| Total | 0 (0.0%) | 0.0 |
Fertility by Age by Marriage Status in Wheatland borough
| Age Bracket | Married | Unmarried |
| 15 to 19 years | 0 (0.0%) | 0 (0.0%) |
| 20 to 34 years | 0 (0.0%) | 0 (0.0%) |
| 35 to 50 years | 0 (0.0%) | 0 (0.0%) |
| Total | 0 (0.0%) | 0 (0.0%) |
Fertility by Education in Wheatland borough
| Educational Attainment | Women with Births | Births / 1,000 Women |
| Less than High School | 0 (0.0%) | 0.0 |
| High School Diploma | 0 (0.0%) | 0.0 |
| College or Associate's Degree | 0 (0.0%) | 0.0 |
| Bachelor's Degree | 0 (0.0%) | 0.0 |
| Graduate Degree | 0 (0.0%) | 0.0 |
| Total | 0 (0.0%) | 0.0 |
Fertility by Education by Marriage Status in Wheatland borough
| Educational Attainment | Married | Unmarried |
| Less than High School | 0 (0.0%) | 0 (0.0%) |
| High School Diploma | 0 (0.0%) | 0 (0.0%) |
| College or Associate's Degree | 0 (0.0%) | 0 (0.0%) |
| Bachelor's Degree | 0 (0.0%) | 0 (0.0%) |
| Graduate Degree | 0 (0.0%) | 0 (0.0%) |
| Total | 0 (0.0%) | 0 (0.0%) |
Employment Characteristics in Wheatland borough
Employment by Class of Employer in Wheatland borough
Among the 271 employed individuals in Wheatland borough, private company employees (205 | 75.6%), not-for-profit organizations (40 | 14.8%), and local government employees (14 | 5.2%) make up the most common classes of employment.
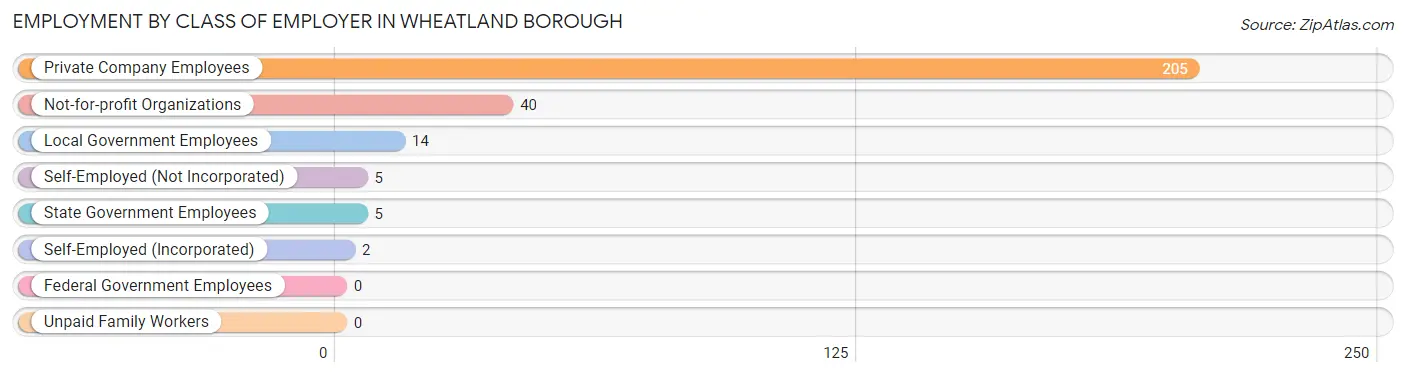
| Employer Class | # Employees | % Employees |
| Private Company Employees | 205 | 75.6% |
| Self-Employed (Incorporated) | 2 | 0.7% |
| Self-Employed (Not Incorporated) | 5 | 1.8% |
| Not-for-profit Organizations | 40 | 14.8% |
| Local Government Employees | 14 | 5.2% |
| State Government Employees | 5 | 1.8% |
| Federal Government Employees | 0 | 0.0% |
| Unpaid Family Workers | 0 | 0.0% |
| Total | 271 | 100.0% |
Employment Status by Age in Wheatland borough
According to the labor force statistics for Wheatland borough, out of the total population over 16 years of age (441), 65.5% or 289 individuals are in the labor force, with 4.2% or 12 of them unemployed. The age group with the highest labor force participation rate is 30 to 34 years, with 100.0% or 20 individuals in the labor force. Within the labor force, the 35 to 44 years age range has the highest percentage of unemployed individuals, with 9.8% or 6 of them being unemployed.
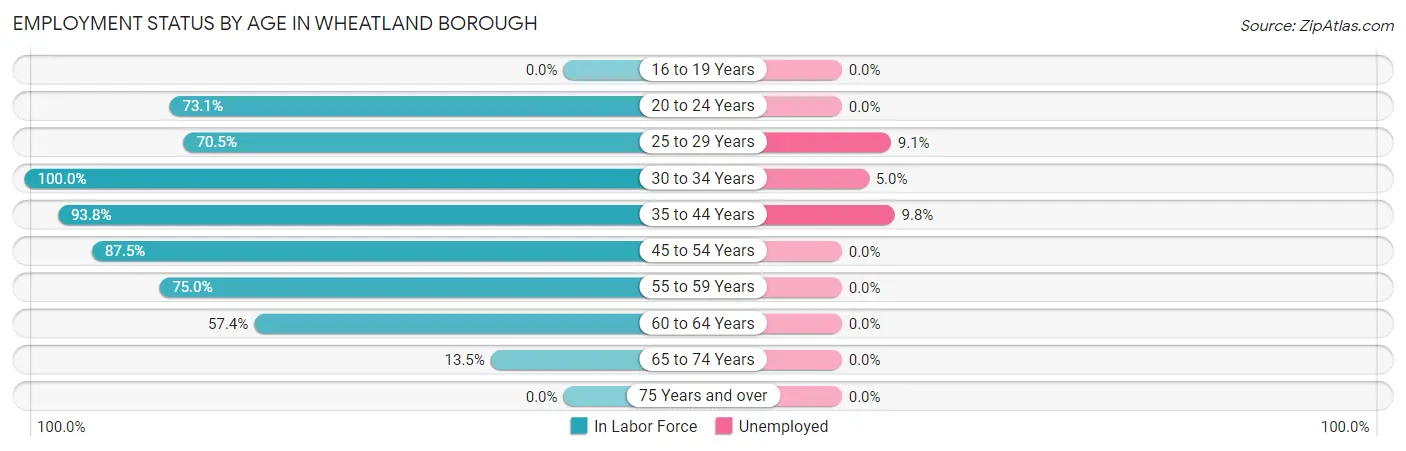
| Age Bracket | In Labor Force | Unemployed |
| 16 to 19 Years | 0 (0.0%) | 0 (0.0%) |
| 20 to 24 Years | 19 (73.1%) | 0 (0.0%) |
| 25 to 29 Years | 55 (70.5%) | 5 (9.1%) |
| 30 to 34 Years | 20 (100.0%) | 1 (5.0%) |
| 35 to 44 Years | 61 (93.8%) | 6 (9.8%) |
| 45 to 54 Years | 77 (87.5%) | 0 (0.0%) |
| 55 to 59 Years | 15 (75.0%) | 0 (0.0%) |
| 60 to 64 Years | 35 (57.4%) | 0 (0.0%) |
| 65 to 74 Years | 7 (13.5%) | 0 (0.0%) |
| 75 Years and over | 0 (0.0%) | 0 (0.0%) |
| Total | 289 (65.5%) | 12 (4.2%) |
Employment Status by Educational Attainment in Wheatland borough
According to labor force statistics for Wheatland borough, 79.2% of individuals (263) out of the total population between 25 and 64 years of age (332) are in the labor force, with 4.6% or 12 of them being unemployed. The group with the highest labor force participation rate are those with the educational attainment of college / associate degree, with 91.7% or 100 individuals in the labor force. Within the labor force, individuals with college / associate degree education have the highest percentage of unemployment, with 11.0% or 11 of them being unemployed.
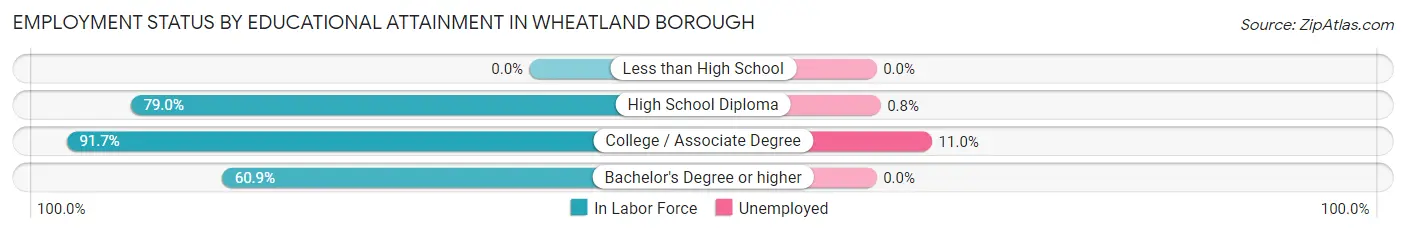
| Educational Attainment | In Labor Force | Unemployed |
| Less than High School | 0 (0.0%) | 0 (0.0%) |
| High School Diploma | 124 (79.0%) | 1 (0.8%) |
| College / Associate Degree | 100 (91.7%) | 12 (11.0%) |
| Bachelor's Degree or higher | 39 (60.9%) | 0 (0.0%) |
| Total | 263 (79.2%) | 15 (4.6%) |
Employment Occupations by Sex in Wheatland borough
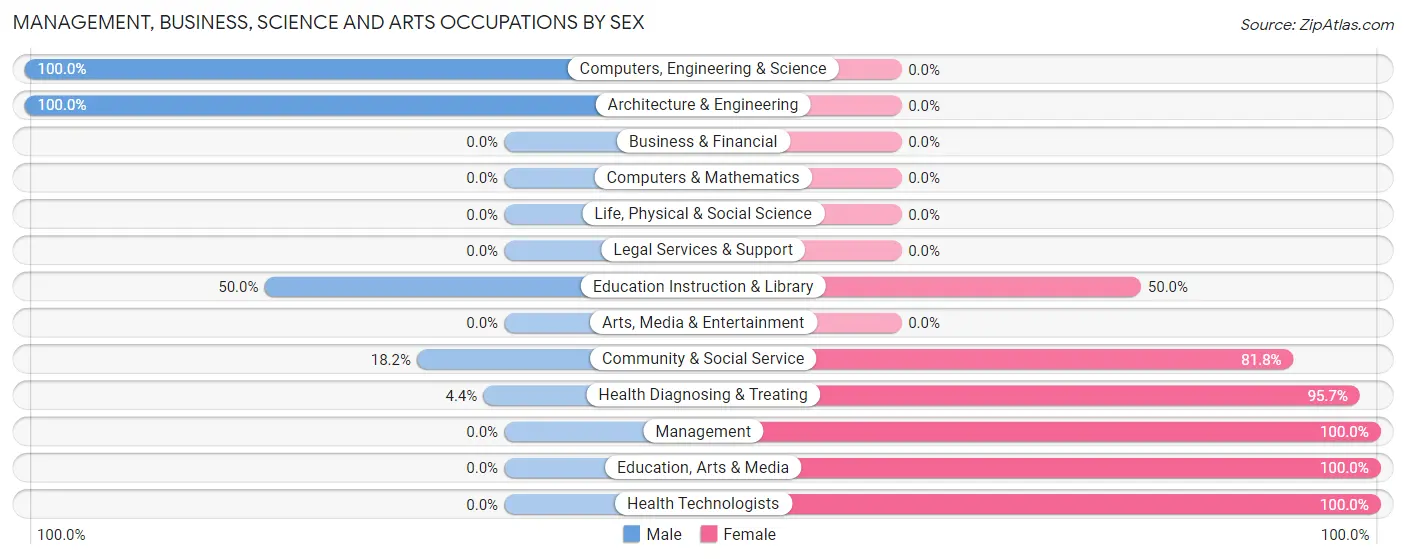
Management, Business, Science and Arts Occupations
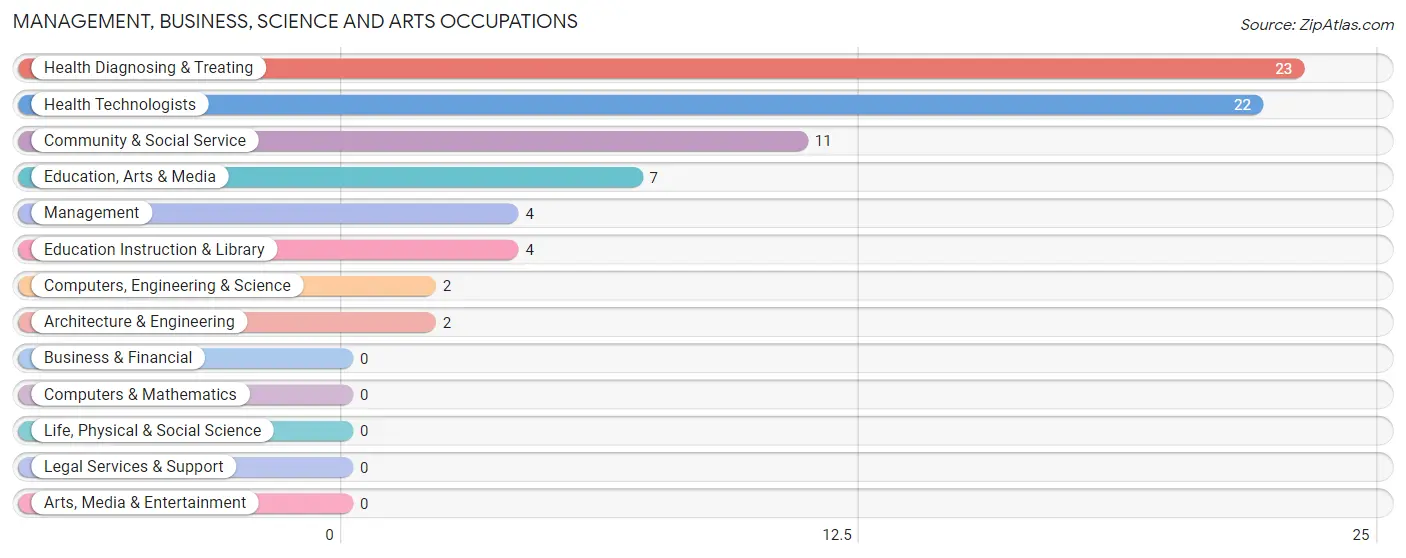
The most common Management, Business, Science and Arts occupations in Wheatland borough are Health Diagnosing & Treating (23 | 8.3%), Health Technologists (22 | 7.9%), Community & Social Service (11 | 4.0%), Education, Arts & Media (7 | 2.5%), and Management (4 | 1.4%).
Management, Business, Science and Arts Occupations by Sex
Within the Management, Business, Science and Arts occupations in Wheatland borough, the most male-oriented occupations are Computers, Engineering & Science (100.0%), Architecture & Engineering (100.0%), and Education Instruction & Library (50.0%), while the most female-oriented occupations are Management (100.0%), Education, Arts & Media (100.0%), and Health Technologists (100.0%).
| Occupation | Male | Female |
| Management | 0 (0.0%) | 4 (100.0%) |
| Business & Financial | 0 (0.0%) | 0 (0.0%) |
| Computers, Engineering & Science | 2 (100.0%) | 0 (0.0%) |
| Computers & Mathematics | 0 (0.0%) | 0 (0.0%) |
| Architecture & Engineering | 2 (100.0%) | 0 (0.0%) |
| Life, Physical & Social Science | 0 (0.0%) | 0 (0.0%) |
| Community & Social Service | 2 (18.2%) | 9 (81.8%) |
| Education, Arts & Media | 0 (0.0%) | 7 (100.0%) |
| Legal Services & Support | 0 (0.0%) | 0 (0.0%) |
| Education Instruction & Library | 2 (50.0%) | 2 (50.0%) |
| Arts, Media & Entertainment | 0 (0.0%) | 0 (0.0%) |
| Health Diagnosing & Treating | 1 (4.3%) | 22 (95.7%) |
| Health Technologists | 0 (0.0%) | 22 (100.0%) |
| Total (Category) | 5 (12.5%) | 35 (87.5%) |
| Total (Overall) | 136 (49.1%) | 141 (50.9%) |
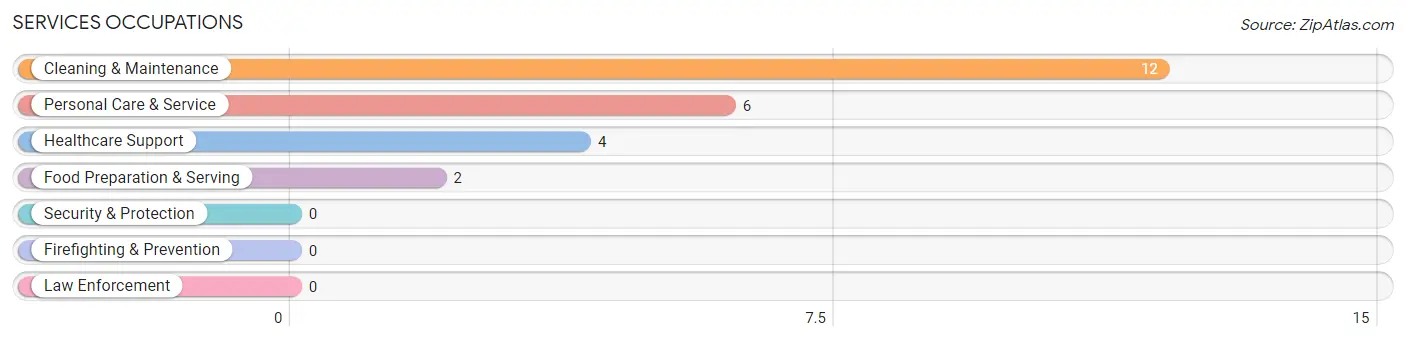
Services Occupations
The most common Services occupations in Wheatland borough are Cleaning & Maintenance (12 | 4.3%), Personal Care & Service (6 | 2.2%), Healthcare Support (4 | 1.4%), and Food Preparation & Serving (2 | 0.7%).
Services Occupations by Sex
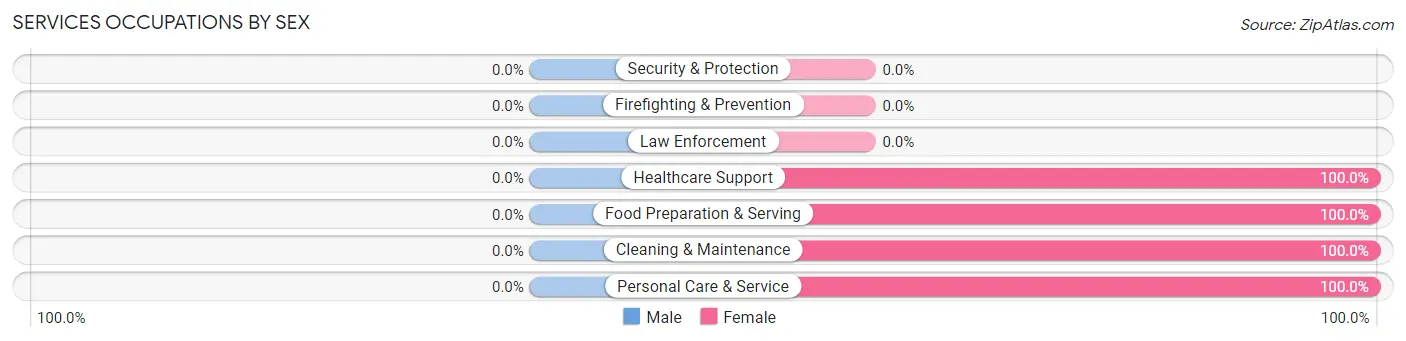
| Occupation | Male | Female |
| Healthcare Support | 0 (0.0%) | 4 (100.0%) |
| Security & Protection | 0 (0.0%) | 0 (0.0%) |
| Firefighting & Prevention | 0 (0.0%) | 0 (0.0%) |
| Law Enforcement | 0 (0.0%) | 0 (0.0%) |
| Food Preparation & Serving | 0 (0.0%) | 2 (100.0%) |
| Cleaning & Maintenance | 0 (0.0%) | 12 (100.0%) |
| Personal Care & Service | 0 (0.0%) | 6 (100.0%) |
| Total (Category) | 0 (0.0%) | 24 (100.0%) |
| Total (Overall) | 136 (49.1%) | 141 (50.9%) |
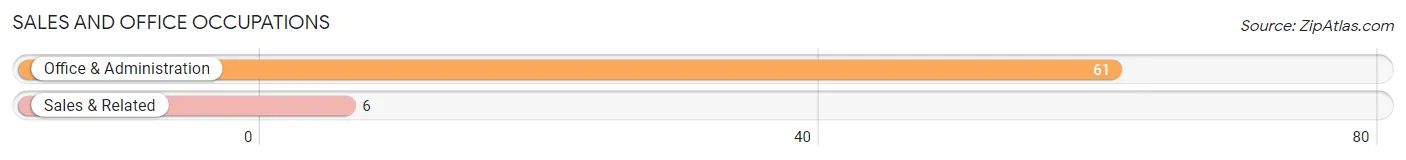
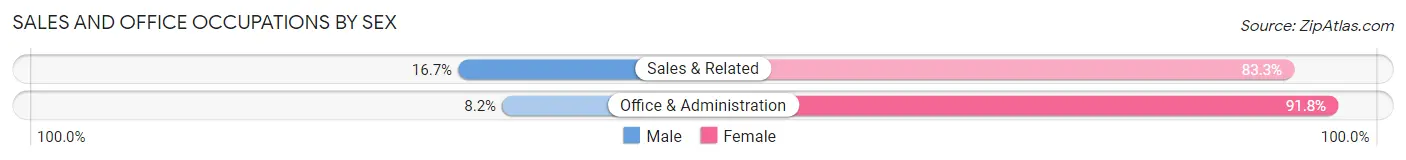
Sales and Office Occupations
The most common Sales and Office occupations in Wheatland borough are Office & Administration (61 | 22.0%), and Sales & Related (6 | 2.2%).
Sales and Office Occupations by Sex
| Occupation | Male | Female |
| Sales & Related | 1 (16.7%) | 5 (83.3%) |
| Office & Administration | 5 (8.2%) | 56 (91.8%) |
| Total (Category) | 6 (9.0%) | 61 (91.0%) |
| Total (Overall) | 136 (49.1%) | 141 (50.9%) |
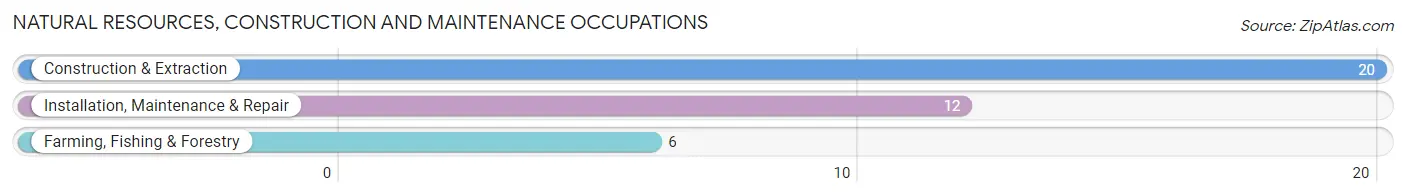
Natural Resources, Construction and Maintenance Occupations
The most common Natural Resources, Construction and Maintenance occupations in Wheatland borough are Construction & Extraction (20 | 7.2%), Installation, Maintenance & Repair (12 | 4.3%), and Farming, Fishing & Forestry (6 | 2.2%).
Natural Resources, Construction and Maintenance Occupations by Sex
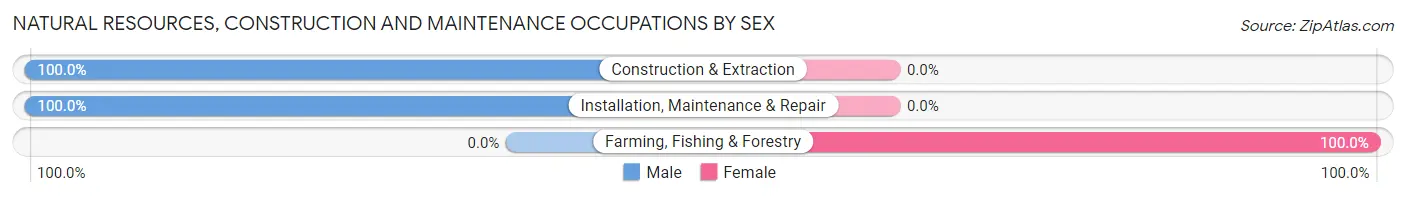
| Occupation | Male | Female |
| Farming, Fishing & Forestry | 0 (0.0%) | 6 (100.0%) |
| Construction & Extraction | 20 (100.0%) | 0 (0.0%) |
| Installation, Maintenance & Repair | 12 (100.0%) | 0 (0.0%) |
| Total (Category) | 32 (84.2%) | 6 (15.8%) |
| Total (Overall) | 136 (49.1%) | 141 (50.9%) |
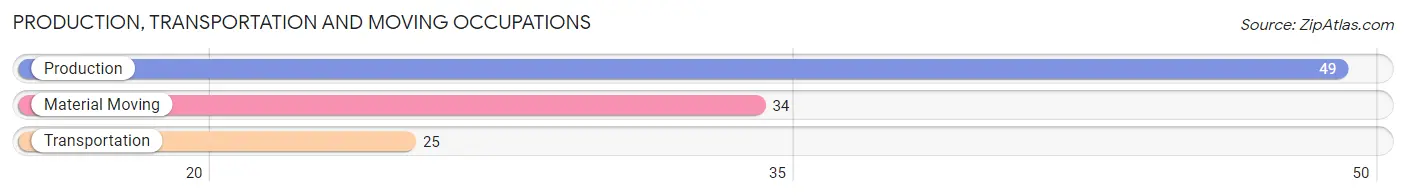
Production, Transportation and Moving Occupations
The most common Production, Transportation and Moving occupations in Wheatland borough are Production (49 | 17.7%), Material Moving (34 | 12.3%), and Transportation (25 | 9.0%).
Production, Transportation and Moving Occupations by Sex
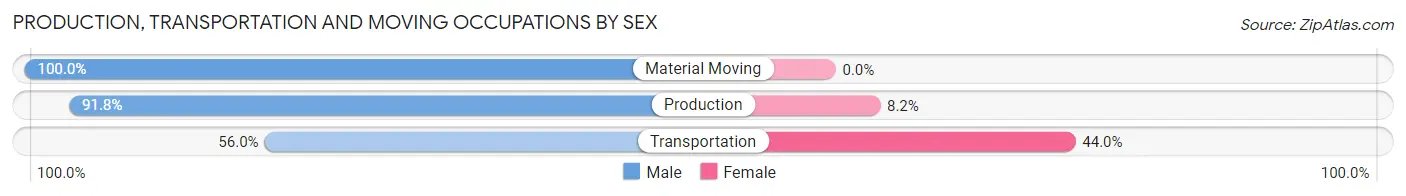
| Occupation | Male | Female |
| Production | 45 (91.8%) | 4 (8.2%) |
| Transportation | 14 (56.0%) | 11 (44.0%) |
| Material Moving | 34 (100.0%) | 0 (0.0%) |
| Total (Category) | 93 (86.1%) | 15 (13.9%) |
| Total (Overall) | 136 (49.1%) | 141 (50.9%) |
Employment Industries by Sex in Wheatland borough
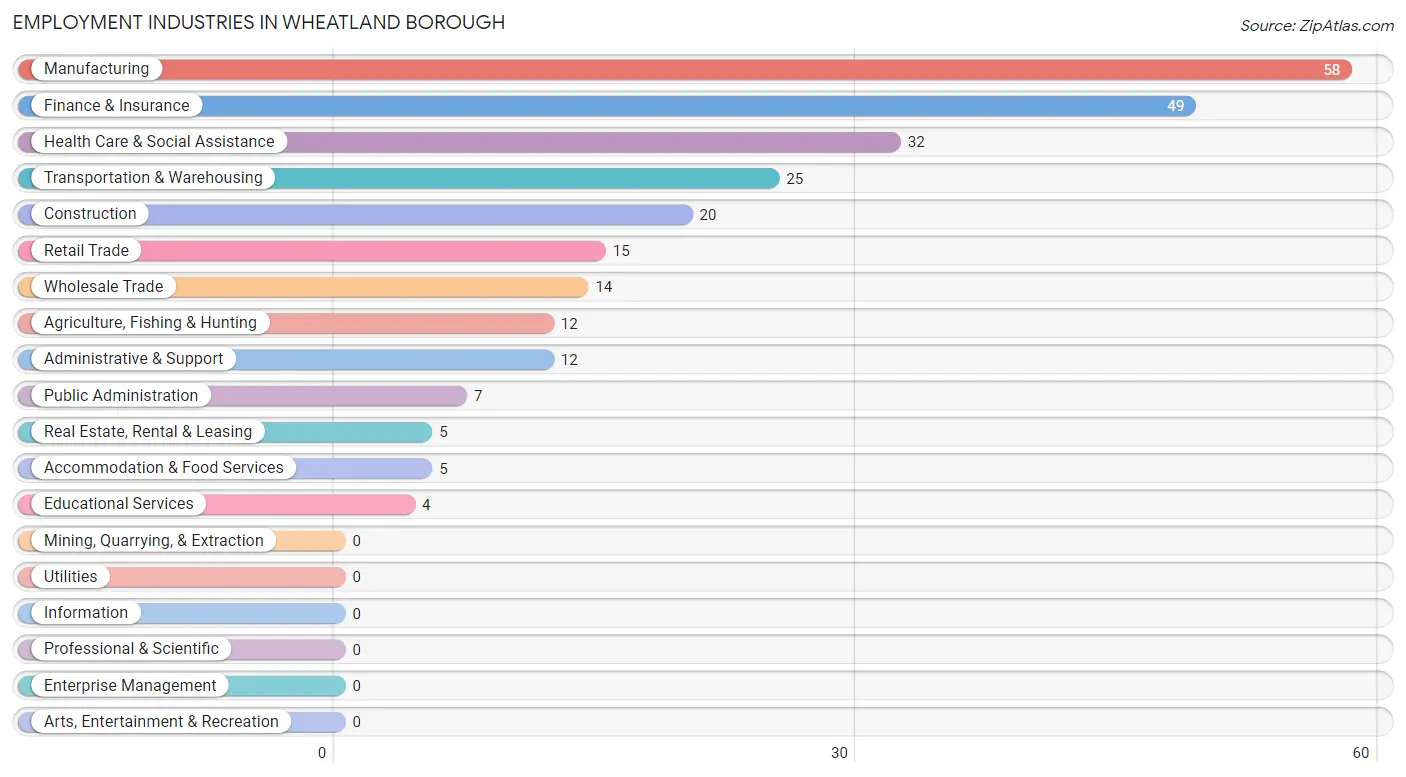
Employment Industries in Wheatland borough
The major employment industries in Wheatland borough include Manufacturing (58 | 20.9%), Finance & Insurance (49 | 17.7%), Health Care & Social Assistance (32 | 11.6%), Transportation & Warehousing (25 | 9.0%), and Construction (20 | 7.2%).
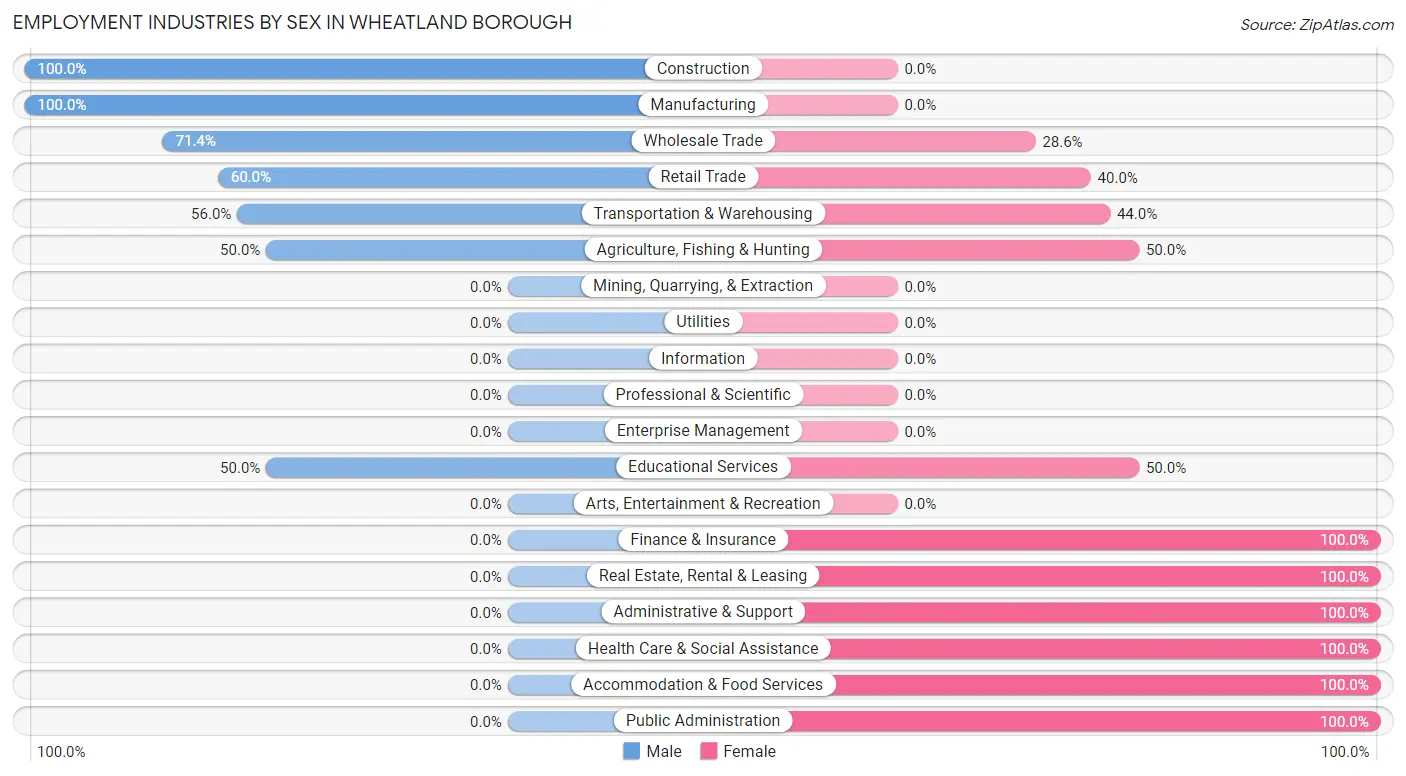
Employment Industries by Sex in Wheatland borough
The Wheatland borough industries that see more men than women are Construction (100.0%), Manufacturing (100.0%), and Wholesale Trade (71.4%), whereas the industries that tend to have a higher number of women are Finance & Insurance (100.0%), Real Estate, Rental & Leasing (100.0%), and Administrative & Support (100.0%).
| Industry | Male | Female |
| Agriculture, Fishing & Hunting | 6 (50.0%) | 6 (50.0%) |
| Mining, Quarrying, & Extraction | 0 (0.0%) | 0 (0.0%) |
| Construction | 20 (100.0%) | 0 (0.0%) |
| Manufacturing | 58 (100.0%) | 0 (0.0%) |
| Wholesale Trade | 10 (71.4%) | 4 (28.6%) |
| Retail Trade | 9 (60.0%) | 6 (40.0%) |
| Transportation & Warehousing | 14 (56.0%) | 11 (44.0%) |
| Utilities | 0 (0.0%) | 0 (0.0%) |
| Information | 0 (0.0%) | 0 (0.0%) |
| Finance & Insurance | 0 (0.0%) | 49 (100.0%) |
| Real Estate, Rental & Leasing | 0 (0.0%) | 5 (100.0%) |
| Professional & Scientific | 0 (0.0%) | 0 (0.0%) |
| Enterprise Management | 0 (0.0%) | 0 (0.0%) |
| Administrative & Support | 0 (0.0%) | 12 (100.0%) |
| Educational Services | 2 (50.0%) | 2 (50.0%) |
| Health Care & Social Assistance | 0 (0.0%) | 32 (100.0%) |
| Arts, Entertainment & Recreation | 0 (0.0%) | 0 (0.0%) |
| Accommodation & Food Services | 0 (0.0%) | 5 (100.0%) |
| Public Administration | 0 (0.0%) | 7 (100.0%) |
| Total | 136 (49.1%) | 141 (50.9%) |
Education in Wheatland borough
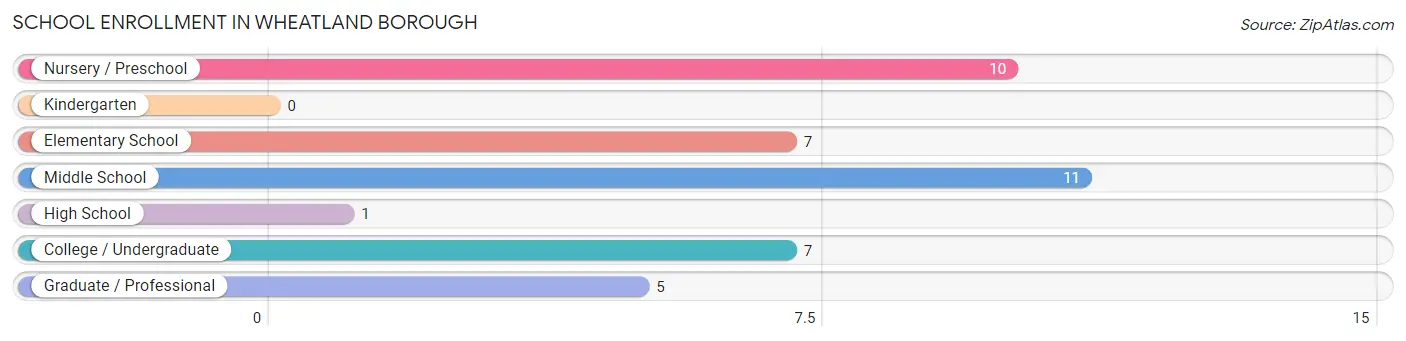
School Enrollment in Wheatland borough
The most common levels of schooling among the 41 students in Wheatland borough are middle school (11 | 26.8%), nursery / preschool (10 | 24.4%), and elementary school (7 | 17.1%).
| School Level | # Students | % Students |
| Nursery / Preschool | 10 | 24.4% |
| Kindergarten | 0 | 0.0% |
| Elementary School | 7 | 17.1% |
| Middle School | 11 | 26.8% |
| High School | 1 | 2.4% |
| College / Undergraduate | 7 | 17.1% |
| Graduate / Professional | 5 | 12.2% |
| Total | 41 | 100.0% |
School Enrollment by Age by Funding Source in Wheatland borough
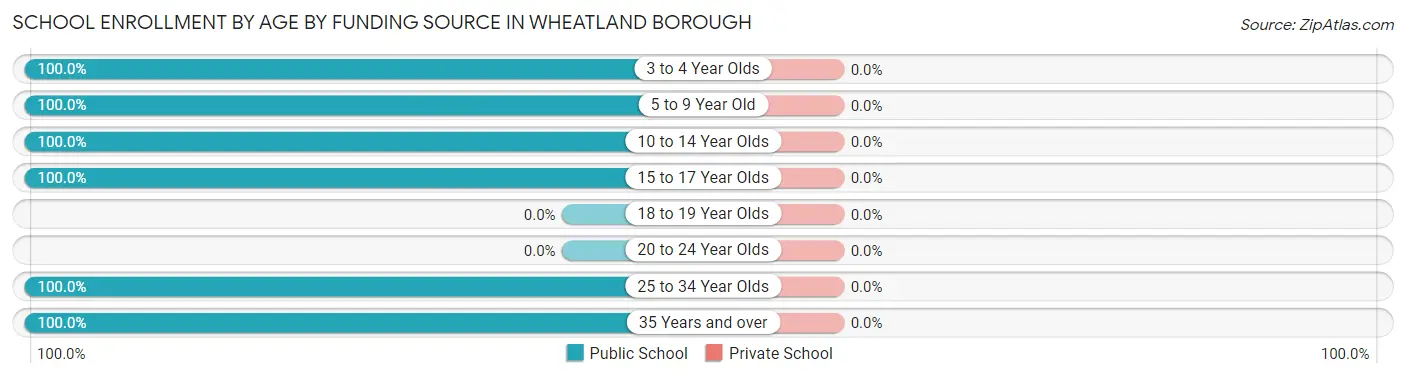
| Age Bracket | Public School | Private School |
| 3 to 4 Year Olds | 5 (100.0%) | 0 (0.0%) |
| 5 to 9 Year Old | 8 (100.0%) | 0 (0.0%) |
| 10 to 14 Year Olds | 15 (100.0%) | 0 (0.0%) |
| 15 to 17 Year Olds | 1 (100.0%) | 0 (0.0%) |
| 18 to 19 Year Olds | 0 (0.0%) | 0 (0.0%) |
| 20 to 24 Year Olds | 0 (0.0%) | 0 (0.0%) |
| 25 to 34 Year Olds | 5 (100.0%) | 0 (0.0%) |
| 35 Years and over | 7 (100.0%) | 0 (0.0%) |
| Total | 41 (100.0%) | 0 (0.0%) |
Educational Attainment by Field of Study in Wheatland borough
Liberal arts & history (24 | 30.4%), business (15 | 19.0%), literature & languages (15 | 19.0%), science & technology (8 | 10.1%), and arts & humanities (6 | 7.6%) are the most common fields of study among 79 individuals in Wheatland borough who have obtained a bachelor's degree or higher.
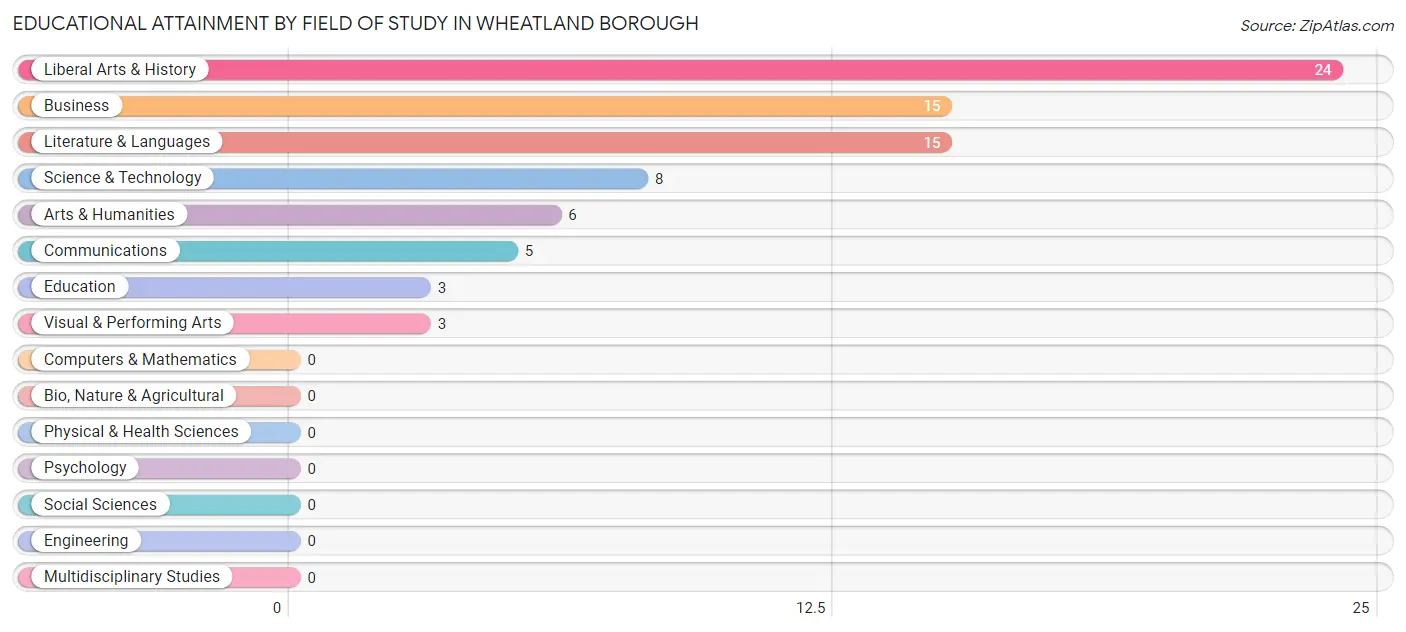
| Field of Study | # Graduates | % Graduates |
| Computers & Mathematics | 0 | 0.0% |
| Bio, Nature & Agricultural | 0 | 0.0% |
| Physical & Health Sciences | 0 | 0.0% |
| Psychology | 0 | 0.0% |
| Social Sciences | 0 | 0.0% |
| Engineering | 0 | 0.0% |
| Multidisciplinary Studies | 0 | 0.0% |
| Science & Technology | 8 | 10.1% |
| Business | 15 | 19.0% |
| Education | 3 | 3.8% |
| Literature & Languages | 15 | 19.0% |
| Liberal Arts & History | 24 | 30.4% |
| Visual & Performing Arts | 3 | 3.8% |
| Communications | 5 | 6.3% |
| Arts & Humanities | 6 | 7.6% |
| Total | 79 | 100.0% |
Transportation & Commute in Wheatland borough
Vehicle Availability by Sex in Wheatland borough
The most prevalent vehicle ownership categories in Wheatland borough are males with 2 vehicles (69, accounting for 53.1%) and females with 2 vehicles (66, making up 48.9%).
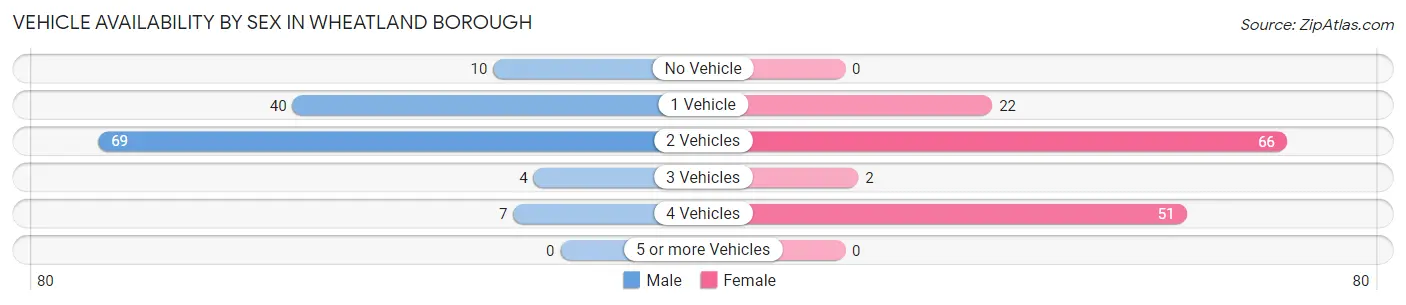
| Vehicles Available | Male | Female |
| No Vehicle | 10 (7.7%) | 0 (0.0%) |
| 1 Vehicle | 40 (30.8%) | 22 (15.6%) |
| 2 Vehicles | 69 (53.1%) | 66 (46.8%) |
| 3 Vehicles | 4 (3.1%) | 2 (1.4%) |
| 4 Vehicles | 7 (5.4%) | 51 (36.2%) |
| 5 or more Vehicles | 0 (0.0%) | 0 (0.0%) |
| Total | 130 (100.0%) | 141 (100.0%) |
Commute Time in Wheatland borough
The most frequently occuring commute durations in Wheatland borough are 10 to 14 minutes (115 commuters, 43.7%), 5 to 9 minutes (44 commuters, 16.7%), and less than 5 minutes (26 commuters, 9.9%).
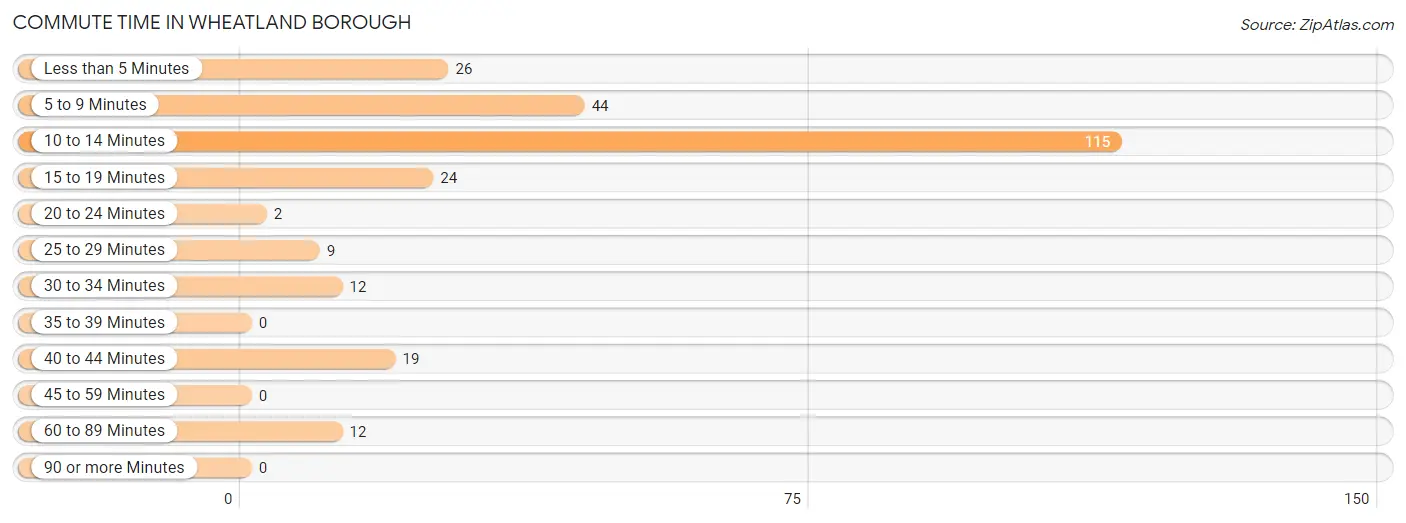
| Commute Time | # Commuters | % Commuters |
| Less than 5 Minutes | 26 | 9.9% |
| 5 to 9 Minutes | 44 | 16.7% |
| 10 to 14 Minutes | 115 | 43.7% |
| 15 to 19 Minutes | 24 | 9.1% |
| 20 to 24 Minutes | 2 | 0.8% |
| 25 to 29 Minutes | 9 | 3.4% |
| 30 to 34 Minutes | 12 | 4.6% |
| 35 to 39 Minutes | 0 | 0.0% |
| 40 to 44 Minutes | 19 | 7.2% |
| 45 to 59 Minutes | 0 | 0.0% |
| 60 to 89 Minutes | 12 | 4.6% |
| 90 or more Minutes | 0 | 0.0% |
Commute Time by Sex in Wheatland borough
The most common commute times in Wheatland borough are 10 to 14 minutes (52 commuters, 41.6%) for males and 10 to 14 minutes (63 commuters, 45.7%) for females.
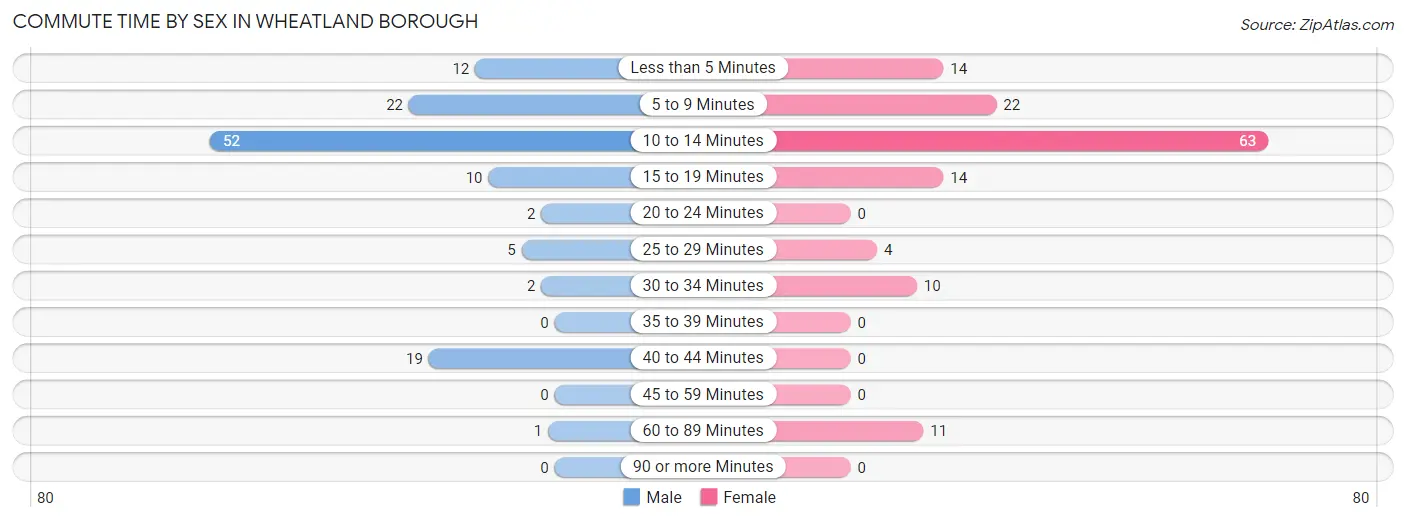
| Commute Time | Male | Female |
| Less than 5 Minutes | 12 (9.6%) | 14 (10.1%) |
| 5 to 9 Minutes | 22 (17.6%) | 22 (15.9%) |
| 10 to 14 Minutes | 52 (41.6%) | 63 (45.7%) |
| 15 to 19 Minutes | 10 (8.0%) | 14 (10.1%) |
| 20 to 24 Minutes | 2 (1.6%) | 0 (0.0%) |
| 25 to 29 Minutes | 5 (4.0%) | 4 (2.9%) |
| 30 to 34 Minutes | 2 (1.6%) | 10 (7.2%) |
| 35 to 39 Minutes | 0 (0.0%) | 0 (0.0%) |
| 40 to 44 Minutes | 19 (15.2%) | 0 (0.0%) |
| 45 to 59 Minutes | 0 (0.0%) | 0 (0.0%) |
| 60 to 89 Minutes | 1 (0.8%) | 11 (8.0%) |
| 90 or more Minutes | 0 (0.0%) | 0 (0.0%) |
Time of Departure to Work by Sex in Wheatland borough
The most frequent times of departure to work in Wheatland borough are 6:30 AM to 6:59 AM (35, 28.0%) for males and 8:00 AM to 8:29 AM (59, 42.7%) for females.
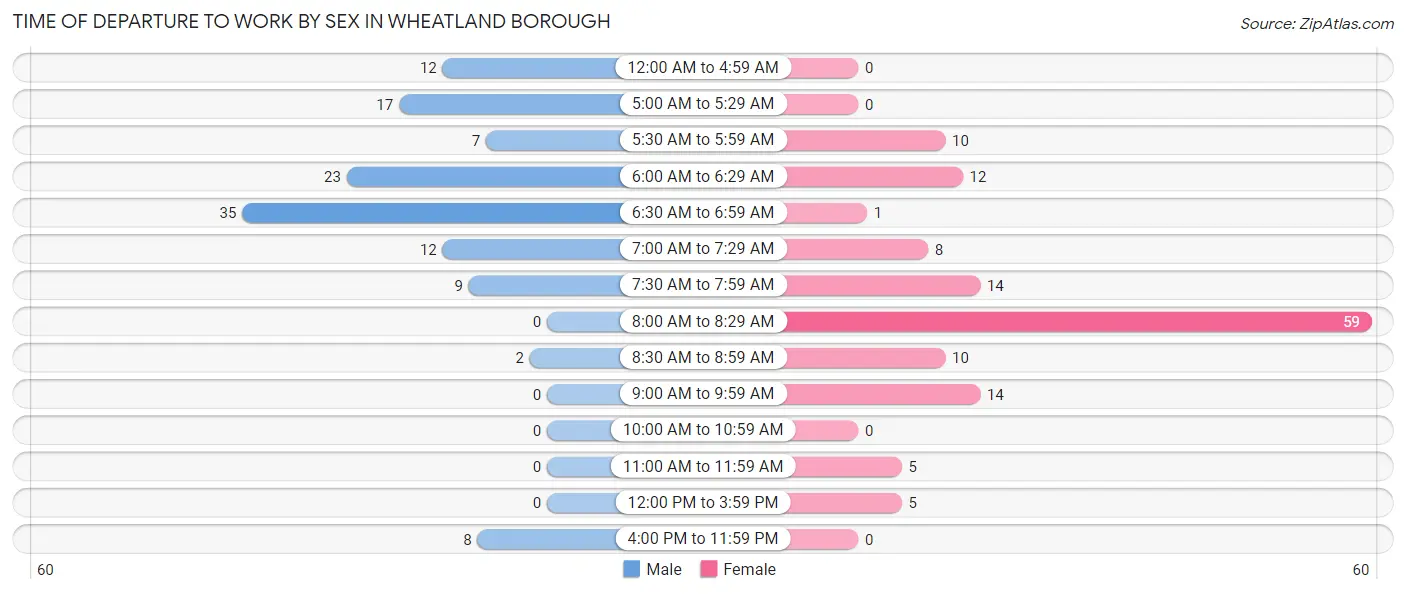
| Time of Departure | Male | Female |
| 12:00 AM to 4:59 AM | 12 (9.6%) | 0 (0.0%) |
| 5:00 AM to 5:29 AM | 17 (13.6%) | 0 (0.0%) |
| 5:30 AM to 5:59 AM | 7 (5.6%) | 10 (7.2%) |
| 6:00 AM to 6:29 AM | 23 (18.4%) | 12 (8.7%) |
| 6:30 AM to 6:59 AM | 35 (28.0%) | 1 (0.7%) |
| 7:00 AM to 7:29 AM | 12 (9.6%) | 8 (5.8%) |
| 7:30 AM to 7:59 AM | 9 (7.2%) | 14 (10.1%) |
| 8:00 AM to 8:29 AM | 0 (0.0%) | 59 (42.7%) |
| 8:30 AM to 8:59 AM | 2 (1.6%) | 10 (7.2%) |
| 9:00 AM to 9:59 AM | 0 (0.0%) | 14 (10.1%) |
| 10:00 AM to 10:59 AM | 0 (0.0%) | 0 (0.0%) |
| 11:00 AM to 11:59 AM | 0 (0.0%) | 5 (3.6%) |
| 12:00 PM to 3:59 PM | 0 (0.0%) | 5 (3.6%) |
| 4:00 PM to 11:59 PM | 8 (6.4%) | 0 (0.0%) |
| Total | 125 (100.0%) | 138 (100.0%) |
Housing Occupancy in Wheatland borough
Occupancy by Ownership in Wheatland borough
Of the total 236 dwellings in Wheatland borough, owner-occupied units account for 129 (54.7%), while renter-occupied units make up 107 (45.3%).
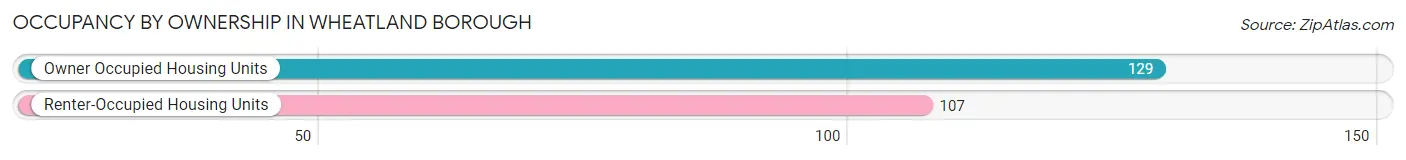
| Occupancy | # Housing Units | % Housing Units |
| Owner Occupied Housing Units | 129 | 54.7% |
| Renter-Occupied Housing Units | 107 | 45.3% |
| Total Occupied Housing Units | 236 | 100.0% |
Occupancy by Household Size in Wheatland borough
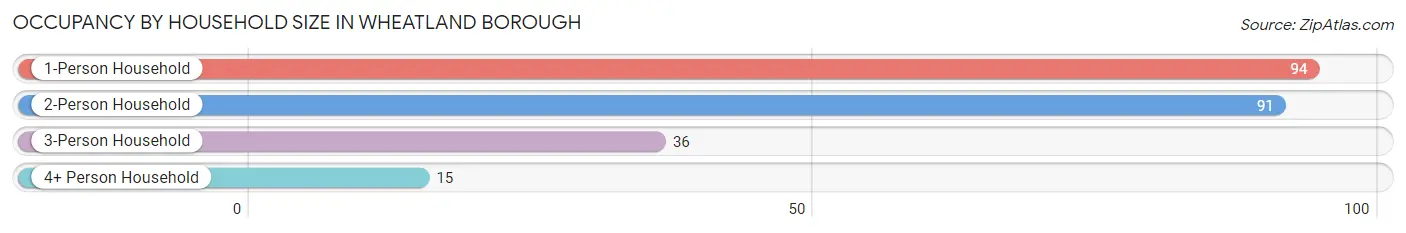
| Household Size | # Housing Units | % Housing Units |
| 1-Person Household | 94 | 39.8% |
| 2-Person Household | 91 | 38.6% |
| 3-Person Household | 36 | 15.2% |
| 4+ Person Household | 15 | 6.4% |
| Total Housing Units | 236 | 100.0% |
Occupancy by Ownership by Household Size in Wheatland borough
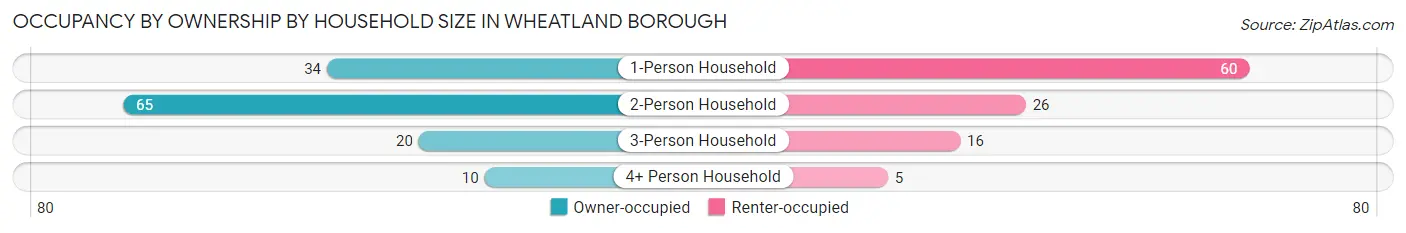
| Household Size | Owner-occupied | Renter-occupied |
| 1-Person Household | 34 (36.2%) | 60 (63.8%) |
| 2-Person Household | 65 (71.4%) | 26 (28.6%) |
| 3-Person Household | 20 (55.6%) | 16 (44.4%) |
| 4+ Person Household | 10 (66.7%) | 5 (33.3%) |
| Total Housing Units | 129 (54.7%) | 107 (45.3%) |
Occupancy by Educational Attainment in Wheatland borough
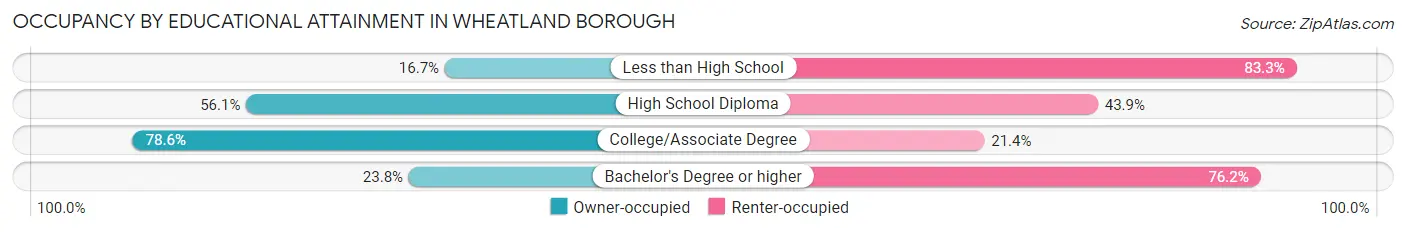
| Household Size | Owner-occupied | Renter-occupied |
| Less than High School | 1 (16.7%) | 5 (83.3%) |
| High School Diploma | 74 (56.1%) | 58 (43.9%) |
| College/Associate Degree | 44 (78.6%) | 12 (21.4%) |
| Bachelor's Degree or higher | 10 (23.8%) | 32 (76.2%) |
Occupancy by Age of Householder in Wheatland borough
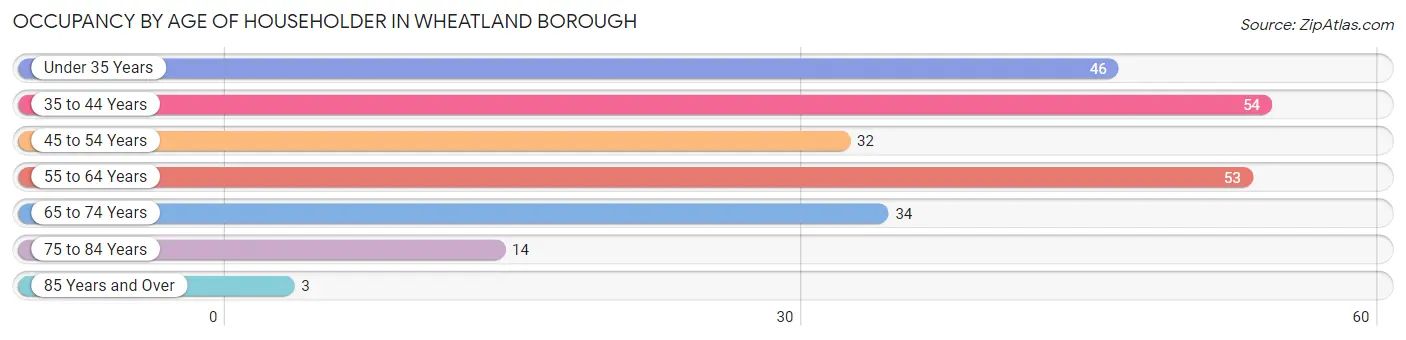
| Age Bracket | # Households | % Households |
| Under 35 Years | 46 | 19.5% |
| 35 to 44 Years | 54 | 22.9% |
| 45 to 54 Years | 32 | 13.6% |
| 55 to 64 Years | 53 | 22.5% |
| 65 to 74 Years | 34 | 14.4% |
| 75 to 84 Years | 14 | 5.9% |
| 85 Years and Over | 3 | 1.3% |
| Total | 236 | 100.0% |
Housing Finances in Wheatland borough
Median Income by Occupancy in Wheatland borough
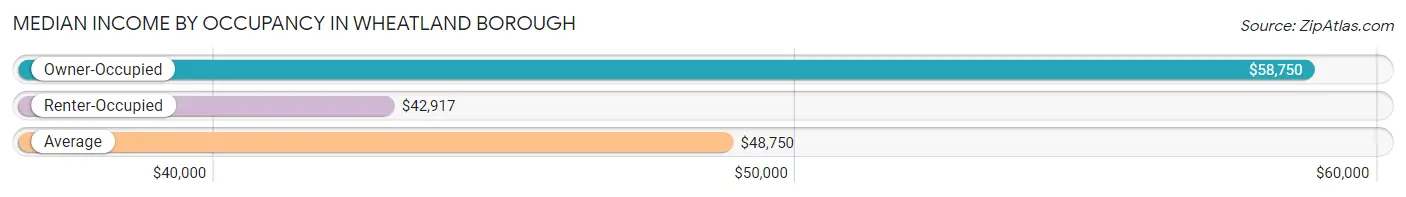
| Occupancy Type | # Households | Median Income |
| Owner-Occupied | 129 (54.7%) | $58,750 |
| Renter-Occupied | 107 (45.3%) | $42,917 |
| Average | 236 (100.0%) | $48,750 |
Occupancy by Householder Income Bracket in Wheatland borough
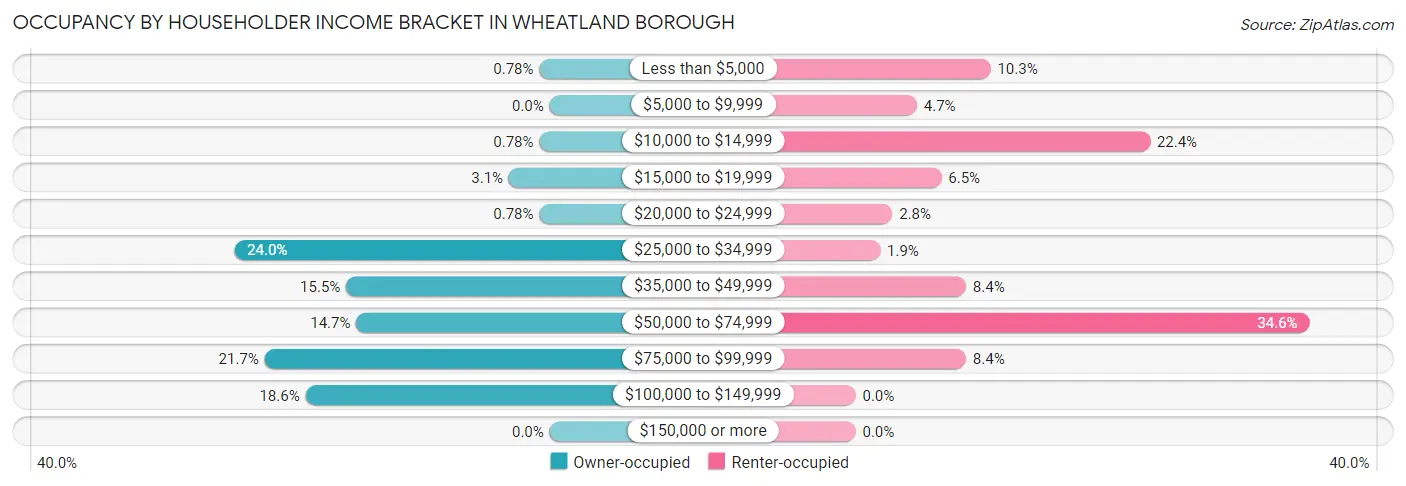
| Income Bracket | Owner-occupied | Renter-occupied |
| Less than $5,000 | 1 (0.8%) | 11 (10.3%) |
| $5,000 to $9,999 | 0 (0.0%) | 5 (4.7%) |
| $10,000 to $14,999 | 1 (0.8%) | 24 (22.4%) |
| $15,000 to $19,999 | 4 (3.1%) | 7 (6.5%) |
| $20,000 to $24,999 | 1 (0.8%) | 3 (2.8%) |
| $25,000 to $34,999 | 31 (24.0%) | 2 (1.9%) |
| $35,000 to $49,999 | 20 (15.5%) | 9 (8.4%) |
| $50,000 to $74,999 | 19 (14.7%) | 37 (34.6%) |
| $75,000 to $99,999 | 28 (21.7%) | 9 (8.4%) |
| $100,000 to $149,999 | 24 (18.6%) | 0 (0.0%) |
| $150,000 or more | 0 (0.0%) | 0 (0.0%) |
| Total | 129 (100.0%) | 107 (100.0%) |
Monthly Housing Cost Tiers in Wheatland borough
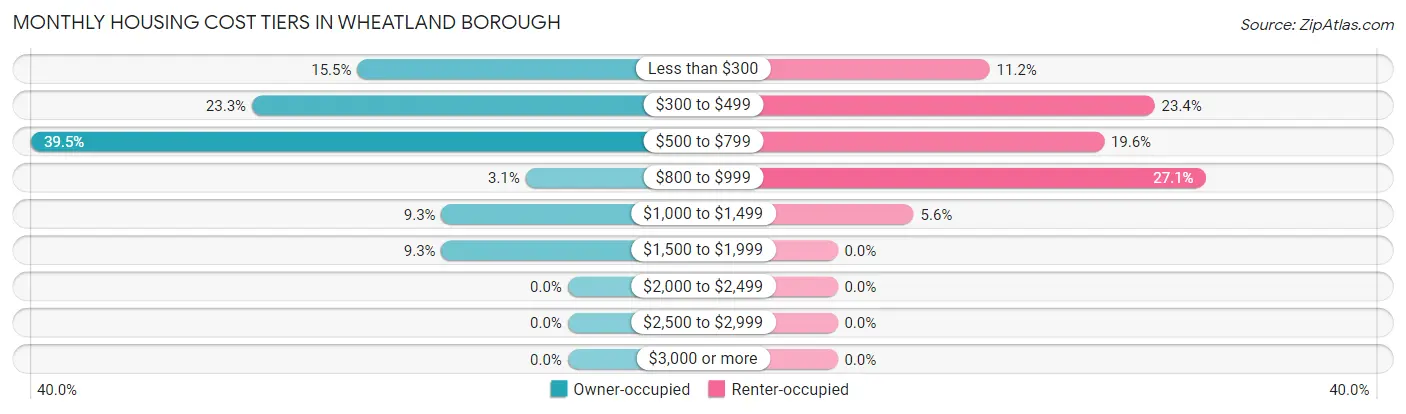
| Monthly Cost | Owner-occupied | Renter-occupied |
| Less than $300 | 20 (15.5%) | 12 (11.2%) |
| $300 to $499 | 30 (23.3%) | 25 (23.4%) |
| $500 to $799 | 51 (39.5%) | 21 (19.6%) |
| $800 to $999 | 4 (3.1%) | 29 (27.1%) |
| $1,000 to $1,499 | 12 (9.3%) | 6 (5.6%) |
| $1,500 to $1,999 | 12 (9.3%) | 0 (0.0%) |
| $2,000 to $2,499 | 0 (0.0%) | 0 (0.0%) |
| $2,500 to $2,999 | 0 (0.0%) | 0 (0.0%) |
| $3,000 or more | 0 (0.0%) | 0 (0.0%) |
| Total | 129 (100.0%) | 107 (100.0%) |
Physical Housing Characteristics in Wheatland borough
Housing Structures in Wheatland borough
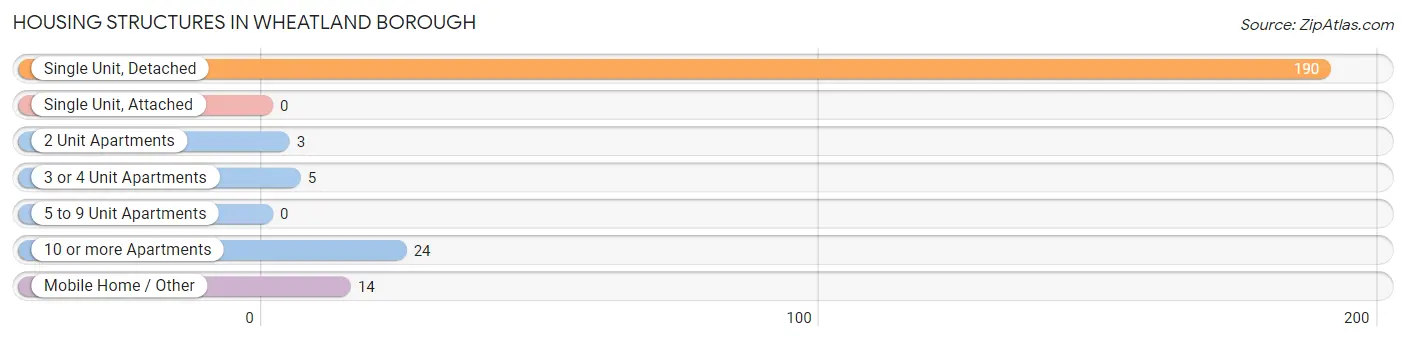
| Structure Type | # Housing Units | % Housing Units |
| Single Unit, Detached | 190 | 80.5% |
| Single Unit, Attached | 0 | 0.0% |
| 2 Unit Apartments | 3 | 1.3% |
| 3 or 4 Unit Apartments | 5 | 2.1% |
| 5 to 9 Unit Apartments | 0 | 0.0% |
| 10 or more Apartments | 24 | 10.2% |
| Mobile Home / Other | 14 | 5.9% |
| Total | 236 | 100.0% |
Housing Structures by Occupancy in Wheatland borough
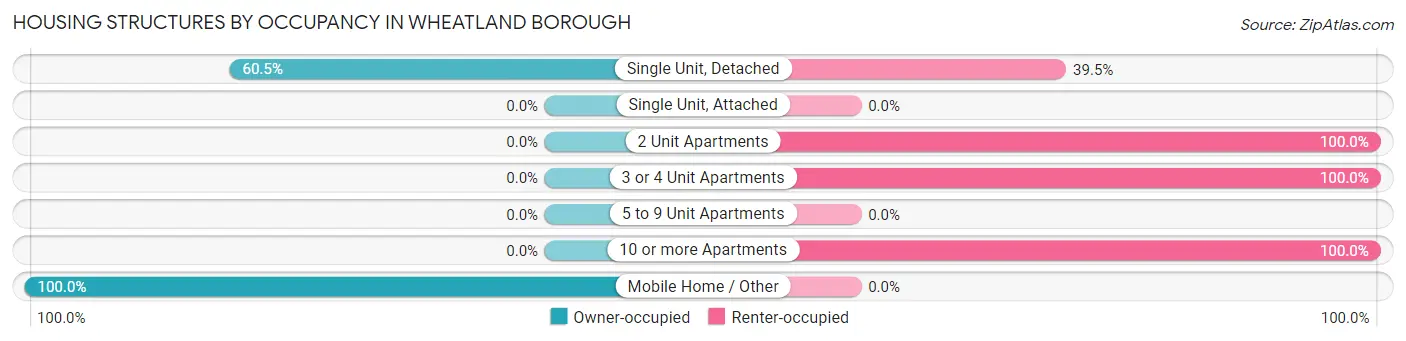
| Structure Type | Owner-occupied | Renter-occupied |
| Single Unit, Detached | 115 (60.5%) | 75 (39.5%) |
| Single Unit, Attached | 0 (0.0%) | 0 (0.0%) |
| 2 Unit Apartments | 0 (0.0%) | 3 (100.0%) |
| 3 or 4 Unit Apartments | 0 (0.0%) | 5 (100.0%) |
| 5 to 9 Unit Apartments | 0 (0.0%) | 0 (0.0%) |
| 10 or more Apartments | 0 (0.0%) | 24 (100.0%) |
| Mobile Home / Other | 14 (100.0%) | 0 (0.0%) |
| Total | 129 (54.7%) | 107 (45.3%) |
Housing Structures by Number of Rooms in Wheatland borough
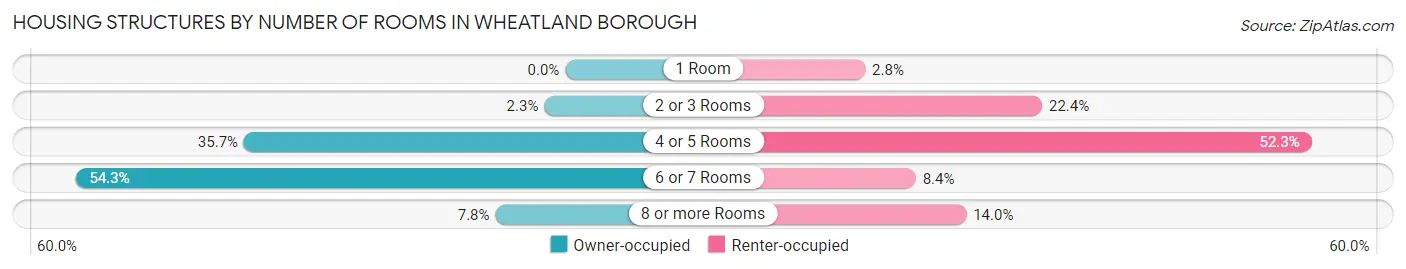
| Number of Rooms | Owner-occupied | Renter-occupied |
| 1 Room | 0 (0.0%) | 3 (2.8%) |
| 2 or 3 Rooms | 3 (2.3%) | 24 (22.4%) |
| 4 or 5 Rooms | 46 (35.7%) | 56 (52.3%) |
| 6 or 7 Rooms | 70 (54.3%) | 9 (8.4%) |
| 8 or more Rooms | 10 (7.7%) | 15 (14.0%) |
| Total | 129 (100.0%) | 107 (100.0%) |
Housing Structure by Heating Type in Wheatland borough
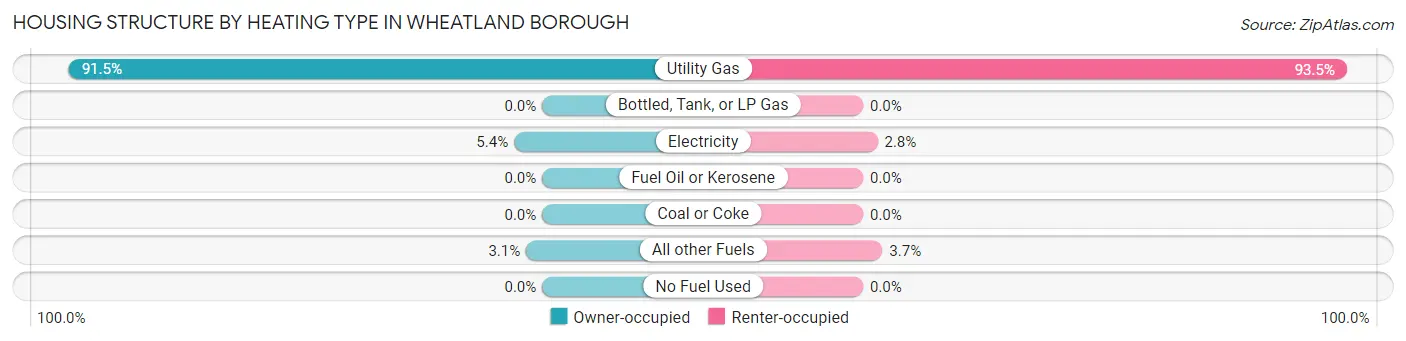
| Heating Type | Owner-occupied | Renter-occupied |
| Utility Gas | 118 (91.5%) | 100 (93.5%) |
| Bottled, Tank, or LP Gas | 0 (0.0%) | 0 (0.0%) |
| Electricity | 7 (5.4%) | 3 (2.8%) |
| Fuel Oil or Kerosene | 0 (0.0%) | 0 (0.0%) |
| Coal or Coke | 0 (0.0%) | 0 (0.0%) |
| All other Fuels | 4 (3.1%) | 4 (3.7%) |
| No Fuel Used | 0 (0.0%) | 0 (0.0%) |
| Total | 129 (100.0%) | 107 (100.0%) |
Household Vehicle Usage in Wheatland borough
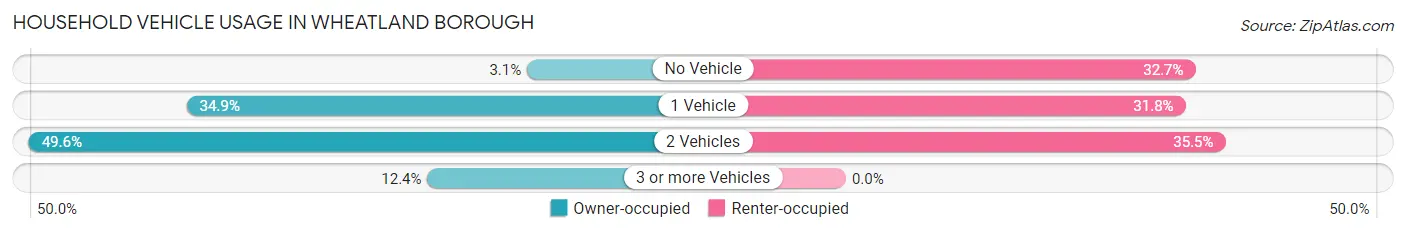
| Vehicles per Household | Owner-occupied | Renter-occupied |
| No Vehicle | 4 (3.1%) | 35 (32.7%) |
| 1 Vehicle | 45 (34.9%) | 34 (31.8%) |
| 2 Vehicles | 64 (49.6%) | 38 (35.5%) |
| 3 or more Vehicles | 16 (12.4%) | 0 (0.0%) |
| Total | 129 (100.0%) | 107 (100.0%) |
Real Estate & Mortgages in Wheatland borough
Real Estate and Mortgage Overview in Wheatland borough
| Characteristic | Without Mortgage | With Mortgage |
| Housing Units | 71 | 58 |
| Median Property Value | $49,100 | $76,000 |
| Median Household Income | $40,893 | $0 |
| Monthly Housing Costs | $356 | $0 |
| Real Estate Taxes | $1,295 | $0 |
Property Value by Mortgage Status in Wheatland borough
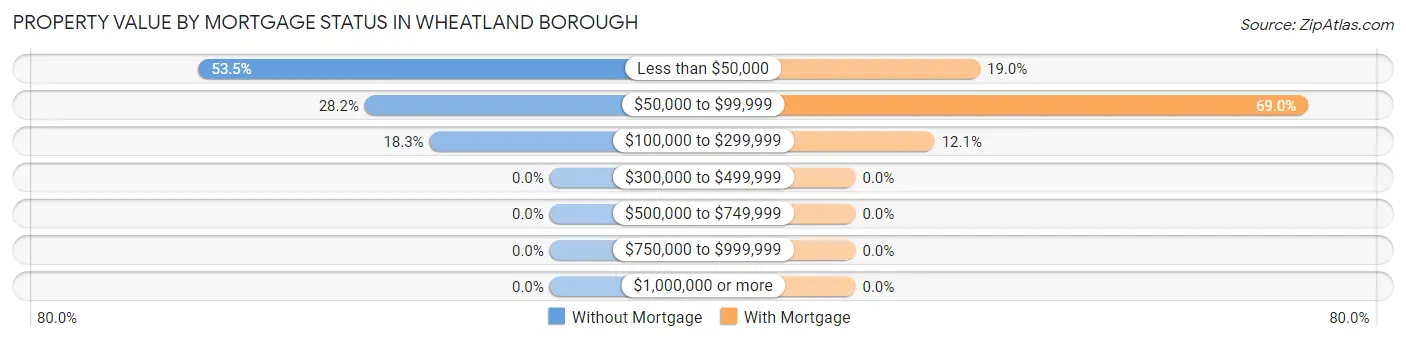
| Property Value | Without Mortgage | With Mortgage |
| Less than $50,000 | 38 (53.5%) | 11 (19.0%) |
| $50,000 to $99,999 | 20 (28.2%) | 40 (69.0%) |
| $100,000 to $299,999 | 13 (18.3%) | 7 (12.1%) |
| $300,000 to $499,999 | 0 (0.0%) | 0 (0.0%) |
| $500,000 to $749,999 | 0 (0.0%) | 0 (0.0%) |
| $750,000 to $999,999 | 0 (0.0%) | 0 (0.0%) |
| $1,000,000 or more | 0 (0.0%) | 0 (0.0%) |
| Total | 71 (100.0%) | 58 (100.0%) |
Household Income by Mortgage Status in Wheatland borough
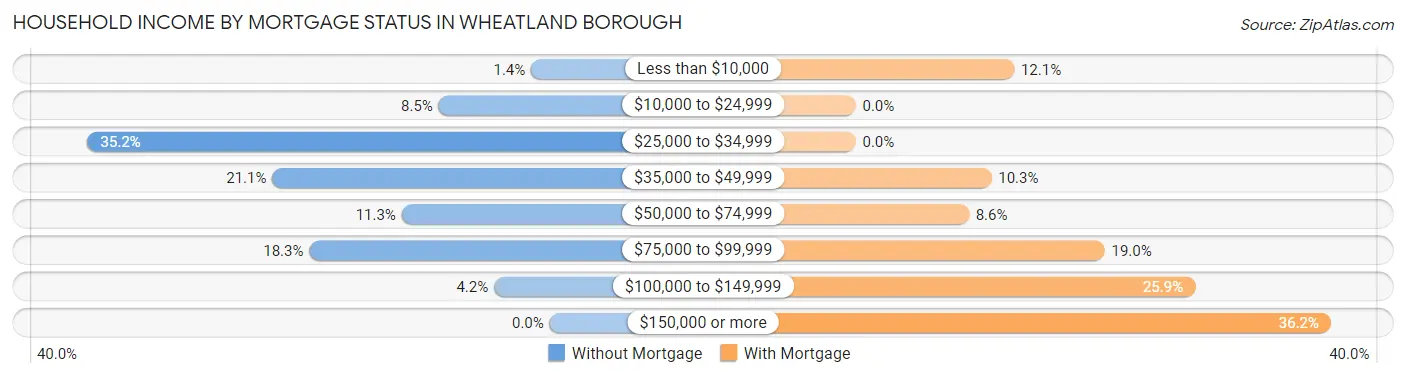
| Household Income | Without Mortgage | With Mortgage |
| Less than $10,000 | 1 (1.4%) | 7 (12.1%) |
| $10,000 to $24,999 | 6 (8.5%) | 0 (0.0%) |
| $25,000 to $34,999 | 25 (35.2%) | 0 (0.0%) |
| $35,000 to $49,999 | 15 (21.1%) | 6 (10.3%) |
| $50,000 to $74,999 | 8 (11.3%) | 5 (8.6%) |
| $75,000 to $99,999 | 13 (18.3%) | 11 (19.0%) |
| $100,000 to $149,999 | 3 (4.2%) | 15 (25.9%) |
| $150,000 or more | 0 (0.0%) | 21 (36.2%) |
| Total | 71 (100.0%) | 58 (100.0%) |
Property Value to Household Income Ratio in Wheatland borough
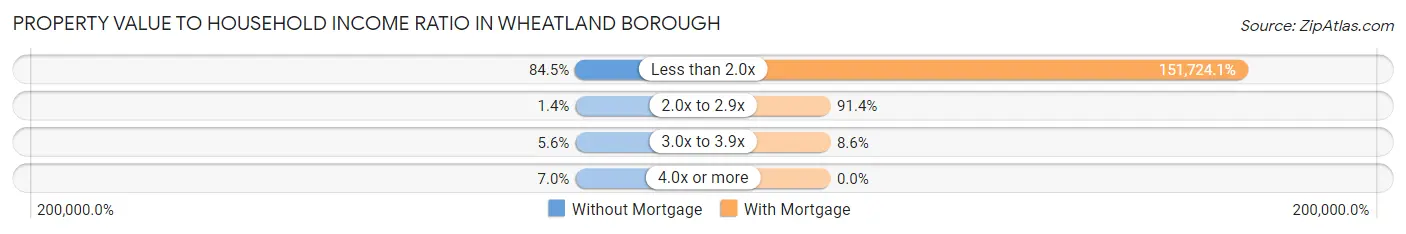
| Value-to-Income Ratio | Without Mortgage | With Mortgage |
| Less than 2.0x | 60 (84.5%) | 88,000 (151,724.1%) |
| 2.0x to 2.9x | 1 (1.4%) | 53 (91.4%) |
| 3.0x to 3.9x | 4 (5.6%) | 5 (8.6%) |
| 4.0x or more | 5 (7.0%) | 0 (0.0%) |
| Total | 71 (100.0%) | 58 (100.0%) |
Real Estate Taxes by Mortgage Status in Wheatland borough
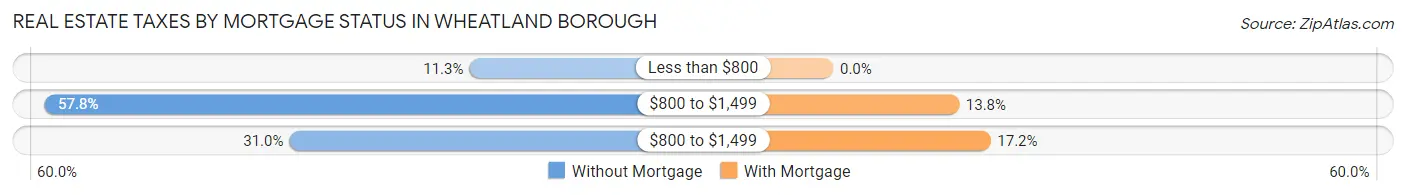
| Property Taxes | Without Mortgage | With Mortgage |
| Less than $800 | 8 (11.3%) | 0 (0.0%) |
| $800 to $1,499 | 41 (57.8%) | 8 (13.8%) |
| $800 to $1,499 | 22 (31.0%) | 10 (17.2%) |
| Total | 71 (100.0%) | 58 (100.0%) |
Health & Disability in Wheatland borough
Health Insurance Coverage by Age in Wheatland borough
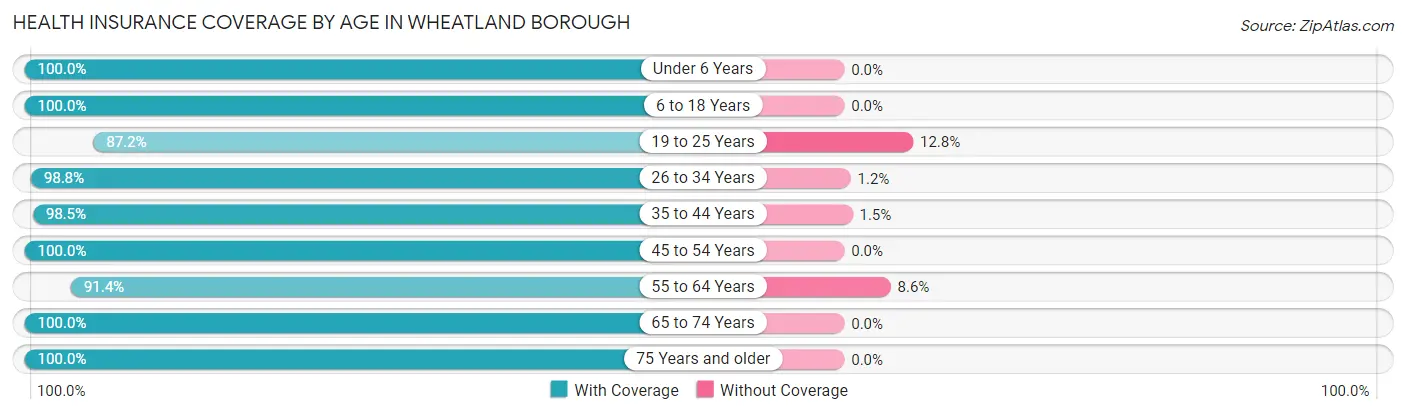
| Age Bracket | With Coverage | Without Coverage |
| Under 6 Years | 47 (100.0%) | 0 (0.0%) |
| 6 to 18 Years | 19 (100.0%) | 0 (0.0%) |
| 19 to 25 Years | 34 (87.2%) | 5 (12.8%) |
| 26 to 34 Years | 84 (98.8%) | 1 (1.2%) |
| 35 to 44 Years | 64 (98.5%) | 1 (1.5%) |
| 45 to 54 Years | 88 (100.0%) | 0 (0.0%) |
| 55 to 64 Years | 74 (91.4%) | 7 (8.6%) |
| 65 to 74 Years | 52 (100.0%) | 0 (0.0%) |
| 75 Years and older | 30 (100.0%) | 0 (0.0%) |
| Total | 492 (97.2%) | 14 (2.8%) |
Health Insurance Coverage by Citizenship Status in Wheatland borough
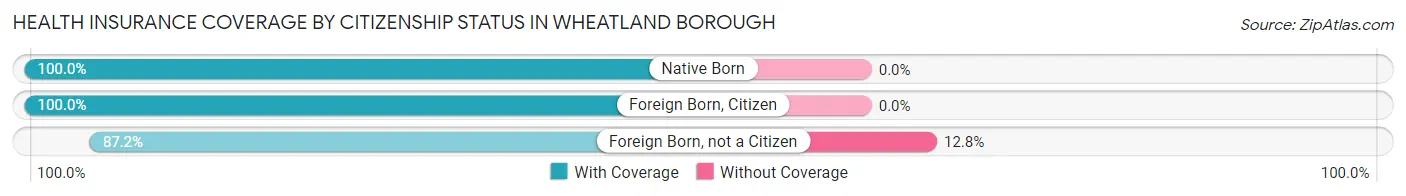
| Citizenship Status | With Coverage | Without Coverage |
| Native Born | 47 (100.0%) | 0 (0.0%) |
| Foreign Born, Citizen | 19 (100.0%) | 0 (0.0%) |
| Foreign Born, not a Citizen | 34 (87.2%) | 5 (12.8%) |
Health Insurance Coverage by Household Income in Wheatland borough
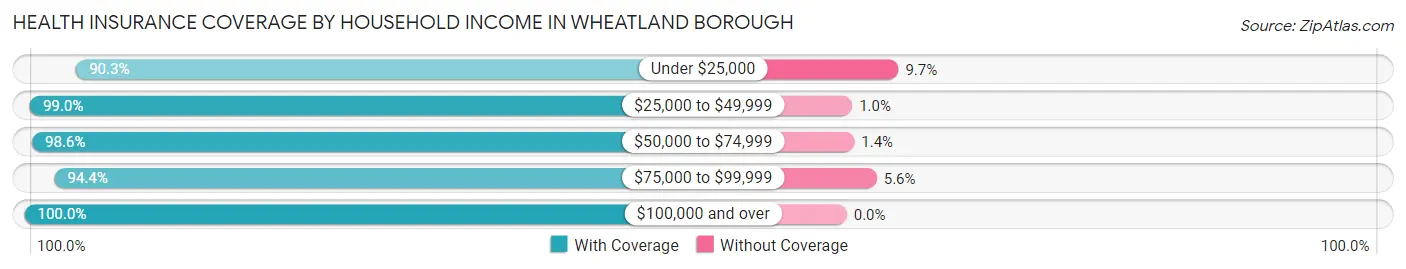
| Household Income | With Coverage | Without Coverage |
| Under $25,000 | 56 (90.3%) | 6 (9.7%) |
| $25,000 to $49,999 | 98 (99.0%) | 1 (1.0%) |
| $50,000 to $74,999 | 140 (98.6%) | 2 (1.4%) |
| $75,000 to $99,999 | 84 (94.4%) | 5 (5.6%) |
| $100,000 and over | 114 (100.0%) | 0 (0.0%) |
Public vs Private Health Insurance Coverage by Age in Wheatland borough
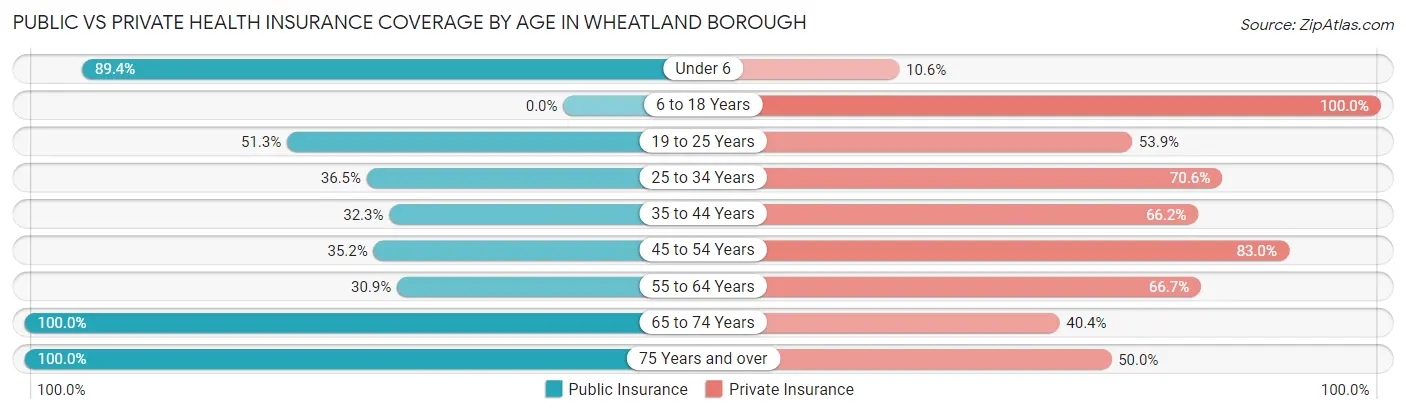
| Age Bracket | Public Insurance | Private Insurance |
| Under 6 | 42 (89.4%) | 5 (10.6%) |
| 6 to 18 Years | 0 (0.0%) | 19 (100.0%) |
| 19 to 25 Years | 20 (51.3%) | 21 (53.8%) |
| 25 to 34 Years | 31 (36.5%) | 60 (70.6%) |
| 35 to 44 Years | 21 (32.3%) | 43 (66.1%) |
| 45 to 54 Years | 31 (35.2%) | 73 (83.0%) |
| 55 to 64 Years | 25 (30.9%) | 54 (66.7%) |
| 65 to 74 Years | 52 (100.0%) | 21 (40.4%) |
| 75 Years and over | 30 (100.0%) | 15 (50.0%) |
| Total | 252 (49.8%) | 311 (61.5%) |
Disability Status by Sex by Age in Wheatland borough
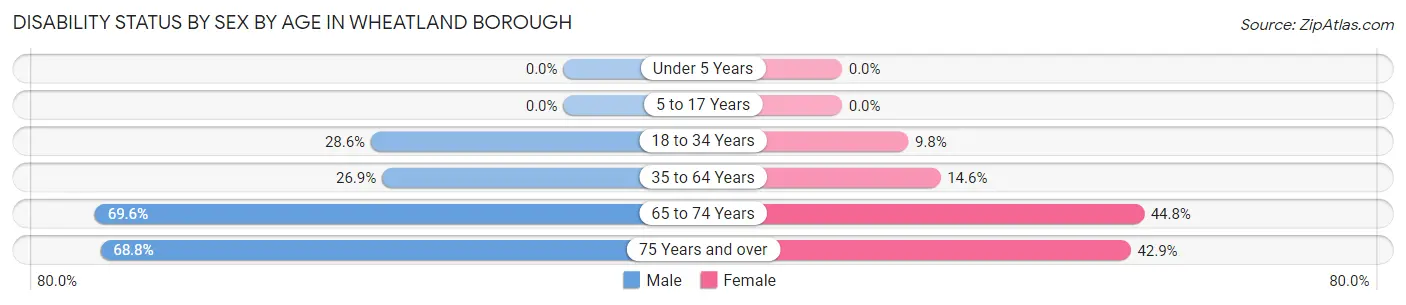
| Age Bracket | Male | Female |
| Under 5 Years | 0 (0.0%) | 0 (0.0%) |
| 5 to 17 Years | 0 (0.0%) | 0 (0.0%) |
| 18 to 34 Years | 18 (28.6%) | 6 (9.8%) |
| 35 to 64 Years | 28 (26.9%) | 19 (14.6%) |
| 65 to 74 Years | 16 (69.6%) | 13 (44.8%) |
| 75 Years and over | 11 (68.8%) | 6 (42.9%) |
Disability Class by Sex by Age in Wheatland borough
Disability Class: Hearing Difficulty
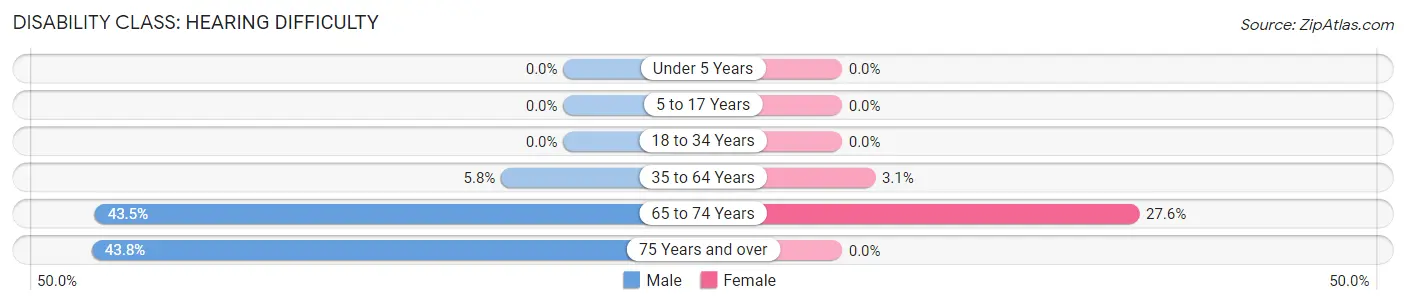
| Age Bracket | Male | Female |
| Under 5 Years | 0 (0.0%) | 0 (0.0%) |
| 5 to 17 Years | 0 (0.0%) | 0 (0.0%) |
| 18 to 34 Years | 0 (0.0%) | 0 (0.0%) |
| 35 to 64 Years | 6 (5.8%) | 4 (3.1%) |
| 65 to 74 Years | 10 (43.5%) | 8 (27.6%) |
| 75 Years and over | 7 (43.8%) | 0 (0.0%) |
Disability Class: Vision Difficulty
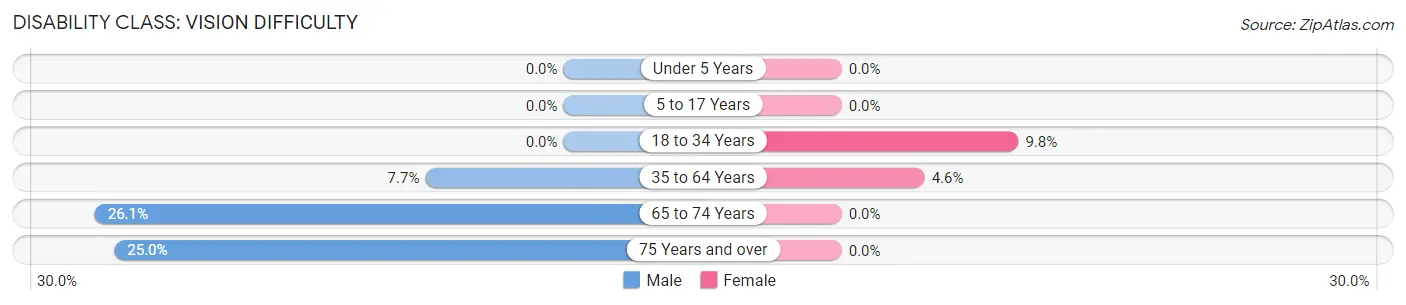
| Age Bracket | Male | Female |
| Under 5 Years | 0 (0.0%) | 0 (0.0%) |
| 5 to 17 Years | 0 (0.0%) | 0 (0.0%) |
| 18 to 34 Years | 0 (0.0%) | 6 (9.8%) |
| 35 to 64 Years | 8 (7.7%) | 6 (4.6%) |
| 65 to 74 Years | 6 (26.1%) | 0 (0.0%) |
| 75 Years and over | 4 (25.0%) | 0 (0.0%) |
Disability Class: Cognitive Difficulty
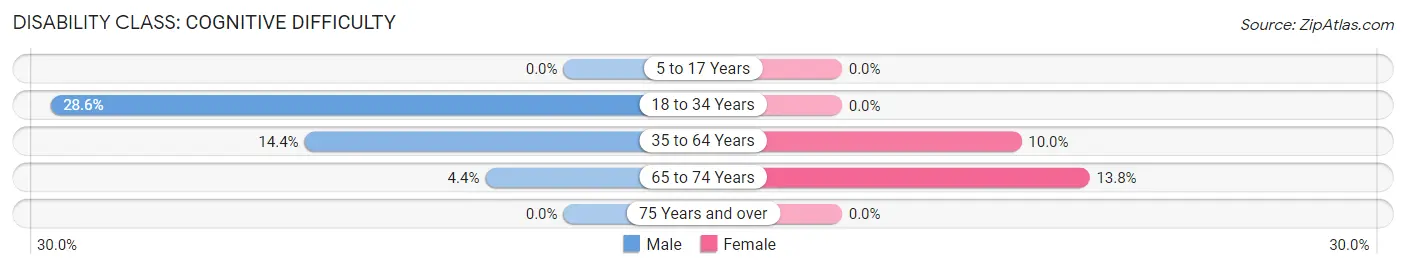
| Age Bracket | Male | Female |
| 5 to 17 Years | 0 (0.0%) | 0 (0.0%) |
| 18 to 34 Years | 18 (28.6%) | 0 (0.0%) |
| 35 to 64 Years | 15 (14.4%) | 13 (10.0%) |
| 65 to 74 Years | 1 (4.3%) | 4 (13.8%) |
| 75 Years and over | 0 (0.0%) | 0 (0.0%) |
Disability Class: Ambulatory Difficulty
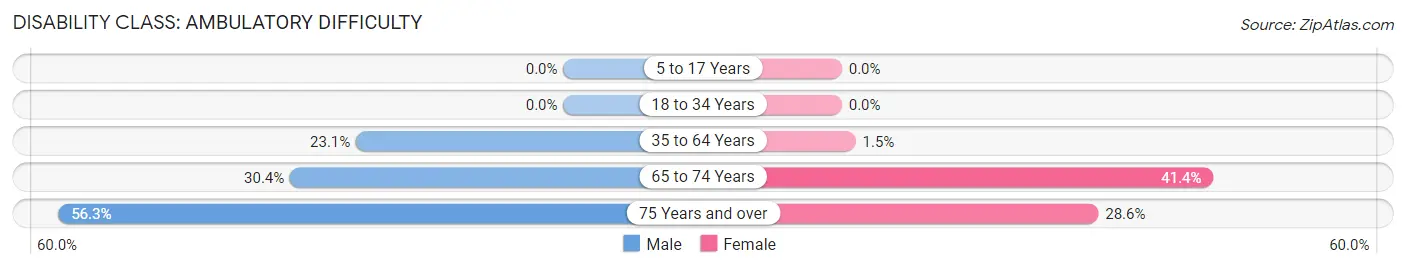
| Age Bracket | Male | Female |
| 5 to 17 Years | 0 (0.0%) | 0 (0.0%) |
| 18 to 34 Years | 0 (0.0%) | 0 (0.0%) |
| 35 to 64 Years | 24 (23.1%) | 2 (1.5%) |
| 65 to 74 Years | 7 (30.4%) | 12 (41.4%) |
| 75 Years and over | 9 (56.2%) | 4 (28.6%) |
Disability Class: Self-Care Difficulty
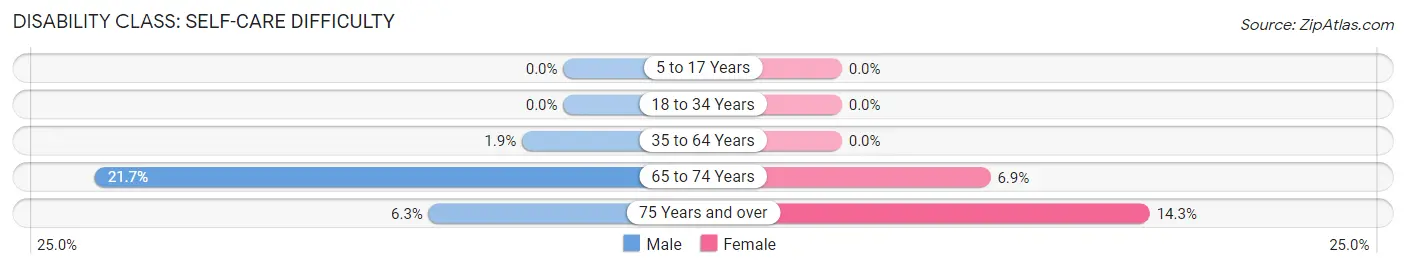
| Age Bracket | Male | Female |
| 5 to 17 Years | 0 (0.0%) | 0 (0.0%) |
| 18 to 34 Years | 0 (0.0%) | 0 (0.0%) |
| 35 to 64 Years | 2 (1.9%) | 0 (0.0%) |
| 65 to 74 Years | 5 (21.7%) | 2 (6.9%) |
| 75 Years and over | 1 (6.2%) | 2 (14.3%) |
Technology Access in Wheatland borough
Computing Device Access in Wheatland borough
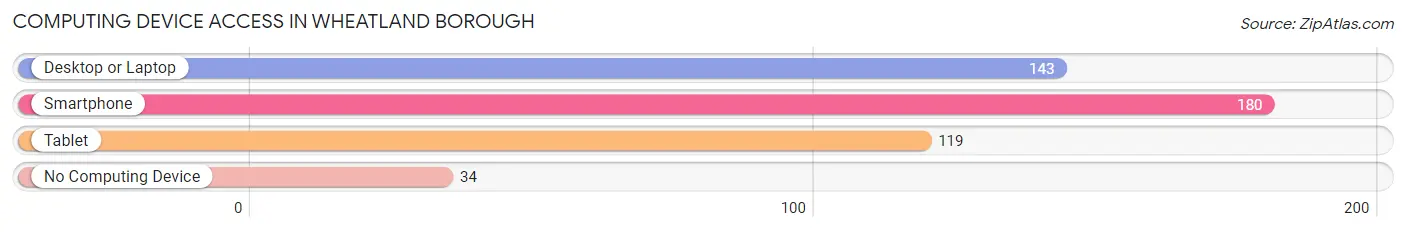
| Device Type | # Households | % Households |
| Desktop or Laptop | 143 | 60.6% |
| Smartphone | 180 | 76.3% |
| Tablet | 119 | 50.4% |
| No Computing Device | 34 | 14.4% |
| Total | 236 | 100.0% |
Internet Access in Wheatland borough
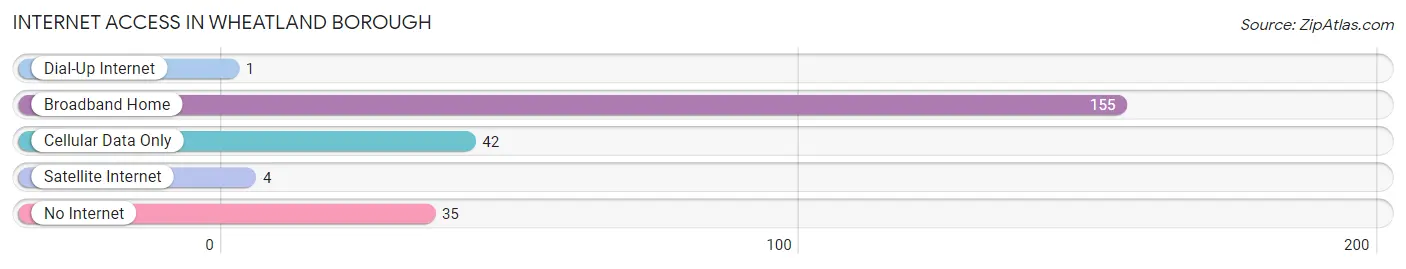
| Internet Type | # Households | % Households |
| Dial-Up Internet | 1 | 0.4% |
| Broadband Home | 155 | 65.7% |
| Cellular Data Only | 42 | 17.8% |
| Satellite Internet | 4 | 1.7% |
| No Internet | 35 | 14.8% |
| Total | 236 | 100.0% |
Wheatland borough Summary
Wheatland Borough is a small borough located in Mercer County, Pennsylvania. It is situated in the Shenango Valley, approximately 10 miles south of the city of Sharon. The borough was incorporated in 1876 and has a population of approximately 1,000 people.
History
Wheatland Borough was originally part of Wheatland Township, which was established in 1844. The area was first settled in the early 1800s by a group of German immigrants who were attracted to the area by its fertile soil and abundant natural resources. The first settlers were primarily farmers, and the area quickly became known for its production of wheat, corn, and other grains.
In 1876, the residents of the area petitioned the state of Pennsylvania to incorporate the borough of Wheatland. The petition was granted, and the borough was officially incorporated on April 11, 1876.
Geography
Wheatland Borough is located in the Shenango Valley, approximately 10 miles south of the city of Sharon. The borough is situated on the banks of the Shenango River, which flows through the borough and provides a source of recreation for the residents. The borough is surrounded by rolling hills and farmland, and is home to several small lakes and ponds.
The borough covers an area of 0.7 square miles and has a population of approximately 1,000 people. The borough is served by two major highways, Interstate 80 and Pennsylvania Route 18.
Economy
The economy of Wheatland Borough is largely based on agriculture. The area is known for its production of wheat, corn, and other grains, and the borough is home to several small farms. In addition, the borough is home to several small businesses, including a grocery store, a hardware store, and a few restaurants.
The borough is also home to several manufacturing companies, including a plastics manufacturer and a metal fabrication company. The borough is also home to a number of small retail stores, including a few antique shops.
Demographics
As of the 2010 census, the population of Wheatland Borough was 1,000 people. The racial makeup of the borough was 97.2% White, 0.7% African American, 0.2% Native American, 0.2% Asian, 0.2% from other races, and 1.7% from two or more races. Hispanic or Latino of any race were 0.7% of the population.
The median household income in Wheatland Borough was $37,500, and the median family income was $45,000. The per capita income for the borough was $17,000. About 11.2% of families and 14.2% of the population were below the poverty line, including 18.2% of those under age 18 and 8.2% of those age 65 or over.
The population of Wheatland Borough is largely made up of families, with the majority of households consisting of married couples with children. The borough is also home to a large number of retirees, with approximately 20% of the population over the age of 65.
Common Questions
What is Per Capita Income in Wheatland borough?
Per Capita income in Wheatland borough is $26,189.
What is the Median Family Income in Wheatland borough?
Median Family Income in Wheatland borough is $55,625.
What is the Median Household income in Wheatland borough?
Median Household Income in Wheatland borough is $48,750.
What is Income or Wage Gap in Wheatland borough?
Income or Wage Gap in Wheatland borough is 40.1%.
Women in Wheatland borough earn 59.9 cents for every dollar earned by a man.
What is Inequality or Gini Index in Wheatland borough?
Inequality or Gini Index in Wheatland borough is 0.36.
What is the Total Population of Wheatland borough?
Total Population of Wheatland borough is 506.
What is the Total Male Population of Wheatland borough?
Total Male Population of Wheatland borough is 245.
What is the Total Female Population of Wheatland borough?
Total Female Population of Wheatland borough is 261.
What is the Ratio of Males per 100 Females in Wheatland borough?
There are 93.87 Males per 100 Females in Wheatland borough.
What is the Ratio of Females per 100 Males in Wheatland borough?
There are 106.53 Females per 100 Males in Wheatland borough.
What is the Median Population Age in Wheatland borough?
Median Population Age in Wheatland borough is 44.3 Years.
What is the Average Family Size in Wheatland borough
Average Family Size in Wheatland borough is 2.8 People.
What is the Average Household Size in Wheatland borough
Average Household Size in Wheatland borough is 2.1 People.
How Large is the Labor Force in Wheatland borough?
There are 289 People in the Labor Forcein in Wheatland borough.
What is the Percentage of People in the Labor Force in Wheatland borough?
65.5% of People are in the Labor Force in Wheatland borough.
What is the Unemployment Rate in Wheatland borough?
Unemployment Rate in Wheatland borough is 4.2%.