Waynesburg borough, PA Map & Demographics
Waynesburg borough Overview
$23,594
PER CAPITA INCOME
$78,125
AVG FAMILY INCOME
$60,536
AVG HOUSEHOLD INCOME
69.9%
WAGE / INCOME GAP [ % ]
30.1¢/ $1
WAGE / INCOME GAP [ $ ]
0.39
INEQUALITY / GINI INDEX
3,954
TOTAL POPULATION
1,823
MALE POPULATION
2,131
FEMALE POPULATION
85.55
MALES / 100 FEMALES
116.90
FEMALES / 100 MALES
24.2
MEDIAN AGE
2.9
AVG FAMILY SIZE
2.2
AVG HOUSEHOLD SIZE
1,834
LABOR FORCE [ PEOPLE ]
56.7%
PERCENT IN LABOR FORCE
6.2%
UNEMPLOYMENT RATE
Income in Waynesburg borough
Income Overview in Waynesburg borough
Per Capita Income in Waynesburg borough is $23,594, while median incomes of families and households are $78,125 and $60,536 respectively.
| Characteristic | Number | Measure |
| Per Capita Income | 3,954 | $23,594 |
| Median Family Income | 793 | $78,125 |
| Mean Family Income | 793 | $79,032 |
| Median Household Income | 1,353 | $60,536 |
| Mean Household Income | 1,353 | $66,175 |
| Income Deficit | 793 | $0 |
| Wage / Income Gap (%) | 3,954 | 69.89% |
| Wage / Income Gap ($) | 3,954 | 30.11¢ per $1 |
| Gini / Inequality Index | 3,954 | 0.39 |
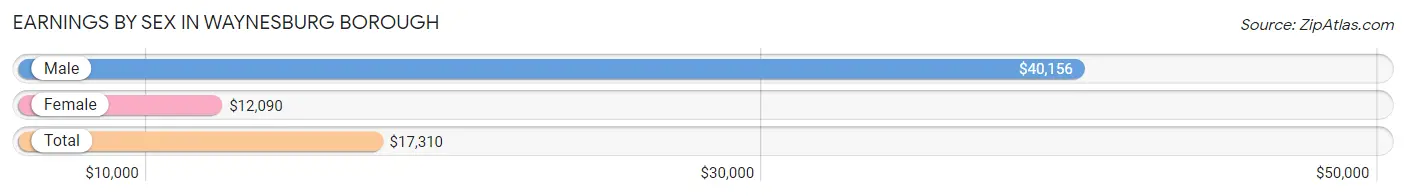
Earnings by Sex in Waynesburg borough
Average Earnings in Waynesburg borough are $17,310, $40,156 for men and $12,090 for women, a difference of 69.9%.
| Sex | Number | Average Earnings |
| Male | 1,044 (43.7%) | $40,156 |
| Female | 1,343 (56.3%) | $12,090 |
| Total | 2,387 (100.0%) | $17,310 |
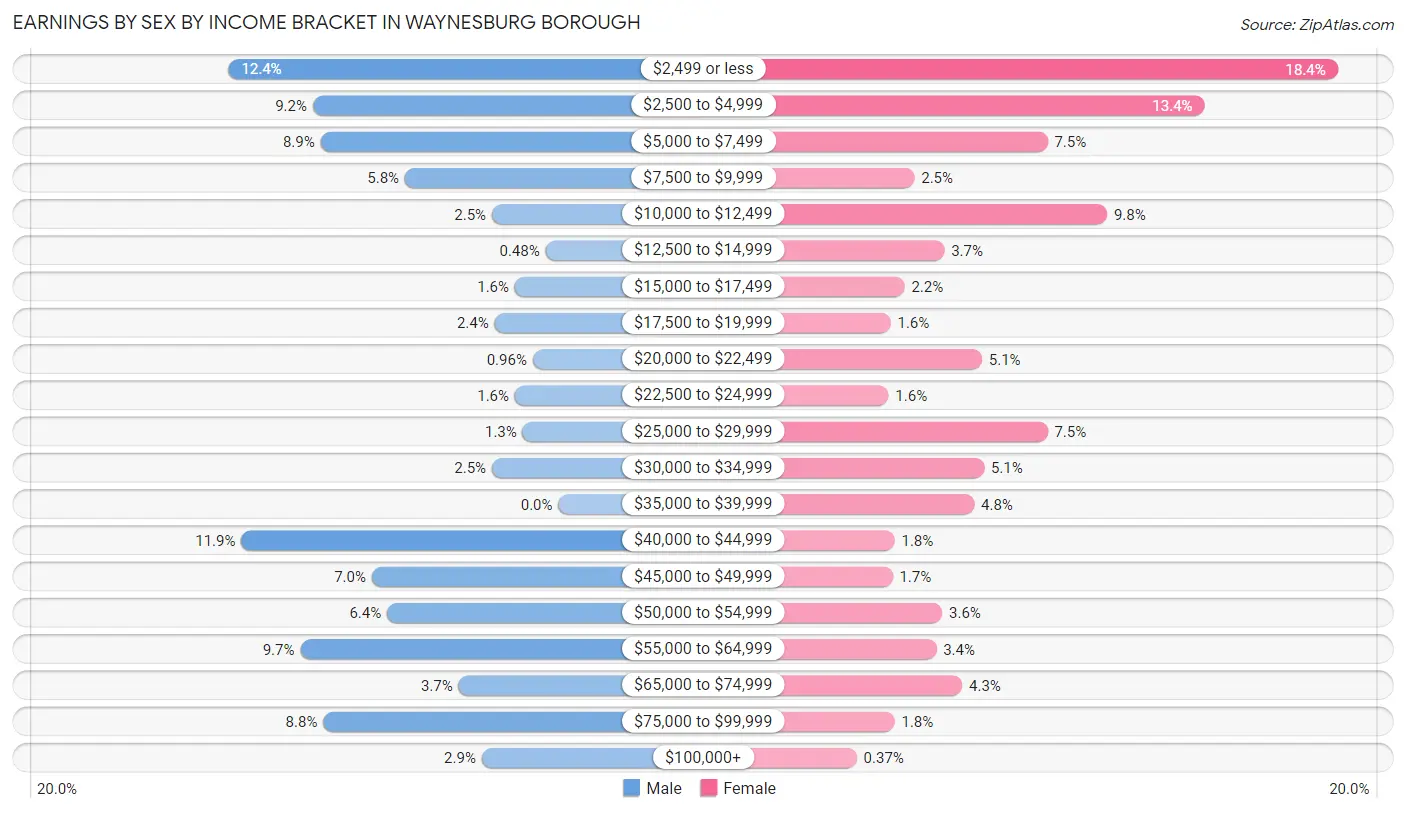
Earnings by Sex by Income Bracket in Waynesburg borough
The most common earnings brackets in Waynesburg borough are $2,499 or less for men (129 | 12.4%) and $2,499 or less for women (247 | 18.4%).
| Income | Male | Female |
| $2,499 or less | 129 (12.4%) | 247 (18.4%) |
| $2,500 to $4,999 | 96 (9.2%) | 180 (13.4%) |
| $5,000 to $7,499 | 93 (8.9%) | 101 (7.5%) |
| $7,500 to $9,999 | 60 (5.8%) | 34 (2.5%) |
| $10,000 to $12,499 | 26 (2.5%) | 131 (9.8%) |
| $12,500 to $14,999 | 5 (0.5%) | 49 (3.6%) |
| $15,000 to $17,499 | 17 (1.6%) | 29 (2.2%) |
| $17,500 to $19,999 | 25 (2.4%) | 22 (1.6%) |
| $20,000 to $22,499 | 10 (1.0%) | 68 (5.1%) |
| $22,500 to $24,999 | 17 (1.6%) | 21 (1.6%) |
| $25,000 to $29,999 | 14 (1.3%) | 101 (7.5%) |
| $30,000 to $34,999 | 26 (2.5%) | 69 (5.1%) |
| $35,000 to $39,999 | 0 (0.0%) | 64 (4.8%) |
| $40,000 to $44,999 | 124 (11.9%) | 24 (1.8%) |
| $45,000 to $49,999 | 73 (7.0%) | 23 (1.7%) |
| $50,000 to $54,999 | 67 (6.4%) | 48 (3.6%) |
| $55,000 to $64,999 | 101 (9.7%) | 45 (3.4%) |
| $65,000 to $74,999 | 39 (3.7%) | 58 (4.3%) |
| $75,000 to $99,999 | 92 (8.8%) | 24 (1.8%) |
| $100,000+ | 30 (2.9%) | 5 (0.4%) |
| Total | 1,044 (100.0%) | 1,343 (100.0%) |
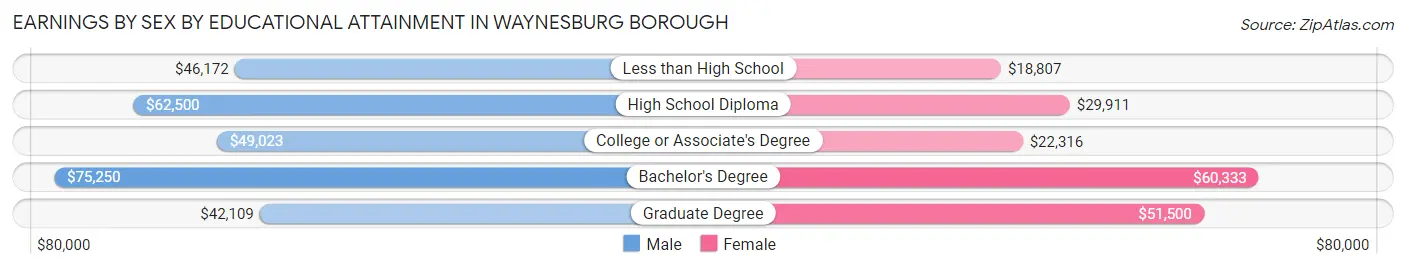
Earnings by Sex by Educational Attainment in Waynesburg borough
Average earnings in Waynesburg borough are $53,833 for men and $30,964 for women, a difference of 42.5%. Men with an educational attainment of bachelor's degree enjoy the highest average annual earnings of $75,250, while those with graduate degree education earn the least with $42,109. Women with an educational attainment of bachelor's degree earn the most with the average annual earnings of $60,333, while those with less than high school education have the smallest earnings of $18,807.
| Educational Attainment | Male Income | Female Income |
| Less than High School | $46,172 | $18,807 |
| High School Diploma | $62,500 | $29,911 |
| College or Associate's Degree | $49,023 | $22,316 |
| Bachelor's Degree | $75,250 | $60,333 |
| Graduate Degree | $42,109 | $51,500 |
| Total | $53,833 | $30,964 |
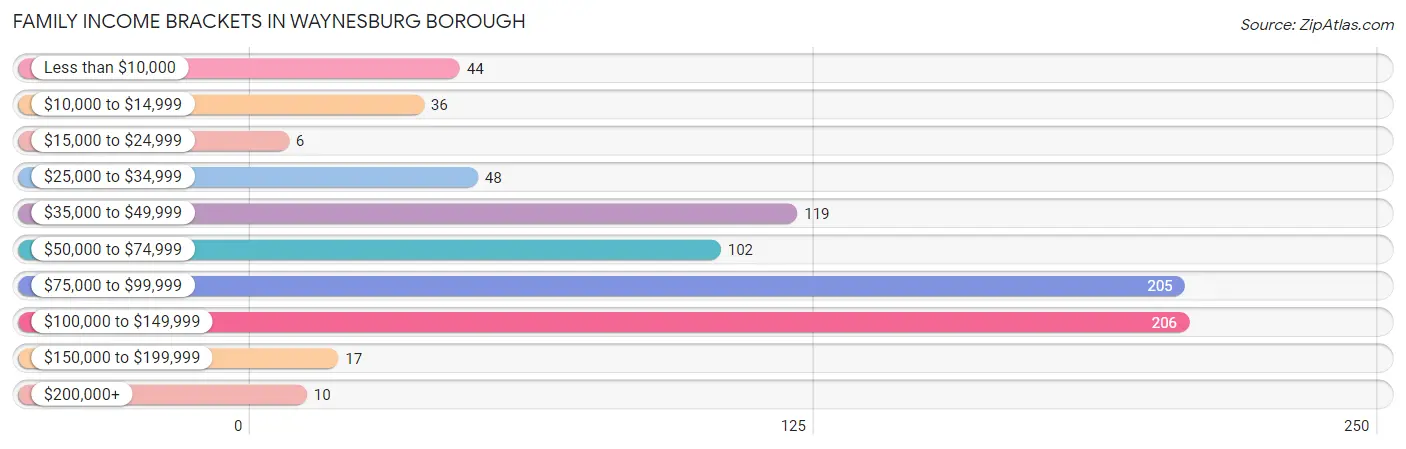
Family Income in Waynesburg borough
Family Income Brackets in Waynesburg borough
According to the Waynesburg borough family income data, there are 206 families falling into the $100,000 to $149,999 income range, which is the most common income bracket and makes up 26.0% of all families. Conversely, the $15,000 to $24,999 income bracket is the least frequent group with only 6 families (0.8%) belonging to this category.
| Income Bracket | # Families | % Families |
| Less than $10,000 | 44 | 5.5% |
| $10,000 to $14,999 | 36 | 4.5% |
| $15,000 to $24,999 | 6 | 0.8% |
| $25,000 to $34,999 | 48 | 6.1% |
| $35,000 to $49,999 | 119 | 15.0% |
| $50,000 to $74,999 | 102 | 12.9% |
| $75,000 to $99,999 | 205 | 25.9% |
| $100,000 to $149,999 | 206 | 26.0% |
| $150,000 to $199,999 | 17 | 2.1% |
| $200,000+ | 10 | 1.3% |
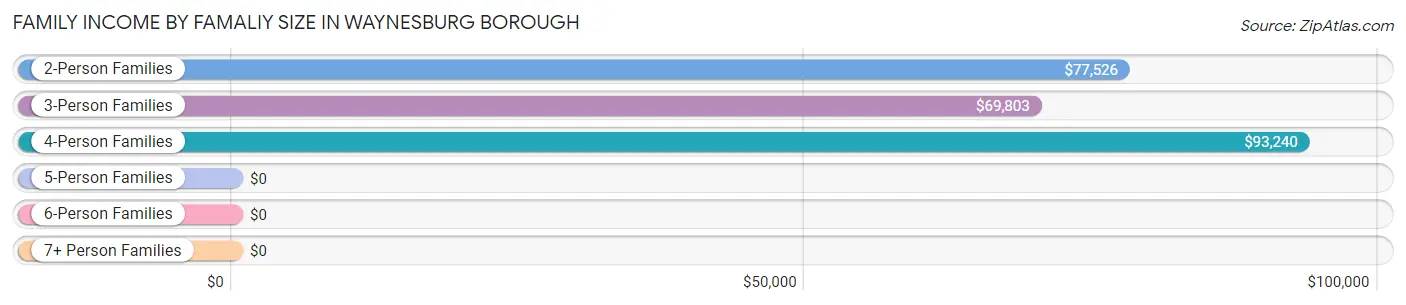
Family Income by Famaliy Size in Waynesburg borough
4-person families (311 | 39.2%) account for the highest median family income in Waynesburg borough with $93,240 per family, while 2-person families (347 | 43.8%) have the highest median income of $38,763 per family member.
| Income Bracket | # Families | Median Income |
| 2-Person Families | 347 (43.8%) | $77,526 |
| 3-Person Families | 135 (17.0%) | $69,803 |
| 4-Person Families | 311 (39.2%) | $93,240 |
| 5-Person Families | 0 (0.0%) | $0 |
| 6-Person Families | 0 (0.0%) | $0 |
| 7+ Person Families | 0 (0.0%) | $0 |
| Total | 793 (100.0%) | $78,125 |
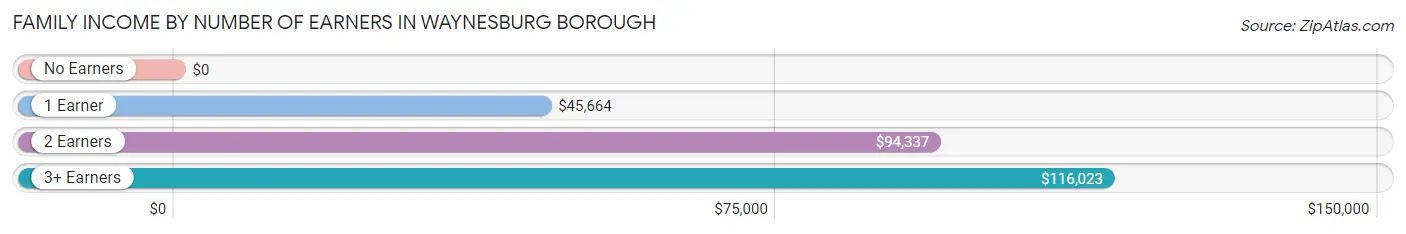
Family Income by Number of Earners in Waynesburg borough
| Number of Earners | # Families | Median Income |
| No Earners | 131 (16.5%) | $0 |
| 1 Earner | 231 (29.1%) | $45,664 |
| 2 Earners | 404 (50.9%) | $94,337 |
| 3+ Earners | 27 (3.4%) | $116,023 |
| Total | 793 (100.0%) | $78,125 |
Household Income in Waynesburg borough
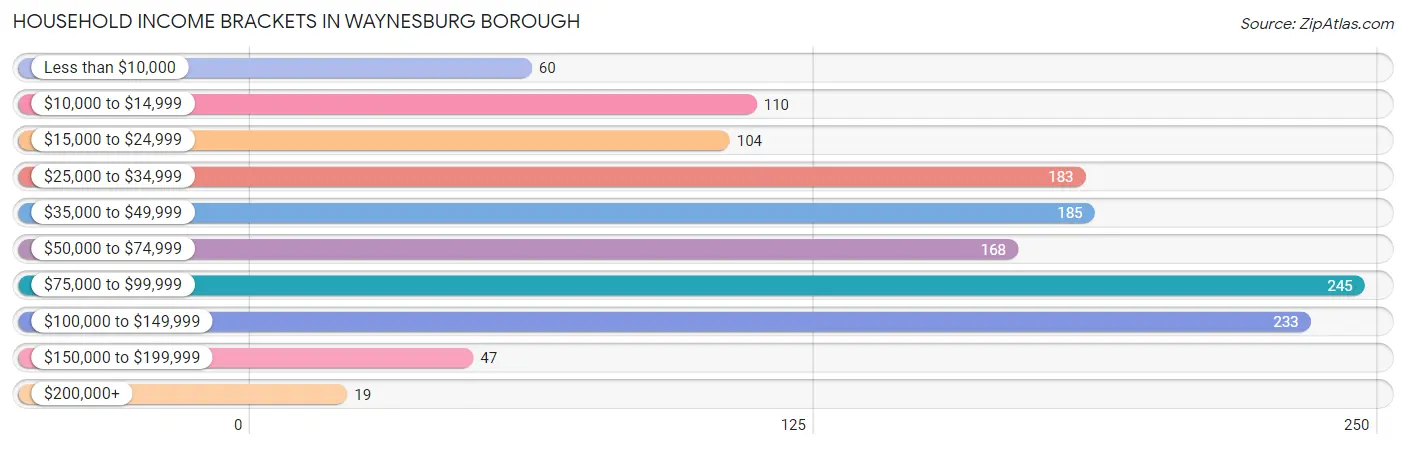
Household Income Brackets in Waynesburg borough
With 245 households falling in the category, the $75,000 to $99,999 income range is the most frequent in Waynesburg borough, accounting for 18.1% of all households. In contrast, only 19 households (1.4%) fall into the $200,000+ income bracket, making it the least populous group.
| Income Bracket | # Households | % Households |
| Less than $10,000 | 60 | 4.4% |
| $10,000 to $14,999 | 110 | 8.1% |
| $15,000 to $24,999 | 104 | 7.7% |
| $25,000 to $34,999 | 183 | 13.5% |
| $35,000 to $49,999 | 185 | 13.7% |
| $50,000 to $74,999 | 168 | 12.4% |
| $75,000 to $99,999 | 245 | 18.1% |
| $100,000 to $149,999 | 233 | 17.2% |
| $150,000 to $199,999 | 47 | 3.5% |
| $200,000+ | 19 | 1.4% |
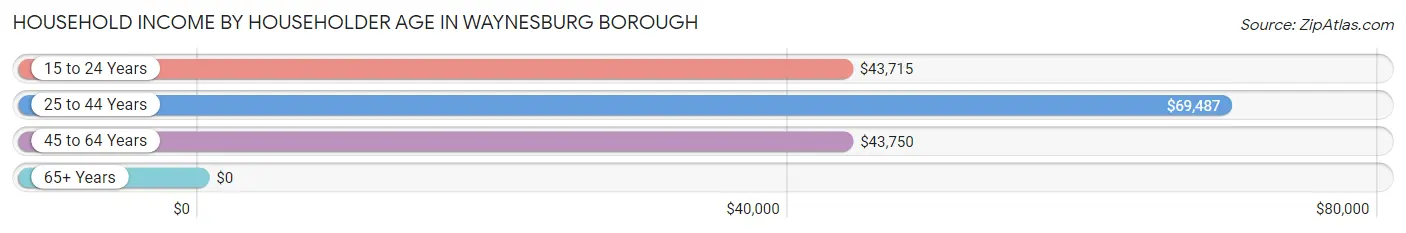
Household Income by Householder Age in Waynesburg borough
The median household income in Waynesburg borough is $60,536, with the highest median household income of $69,487 found in the 25 to 44 years age bracket for the primary householder. A total of 388 households (28.7%) fall into this category. Meanwhile, the 65+ years age bracket for the primary householder has the lowest median household income of $0, with 419 households (31.0%) in this group.
| Income Bracket | # Households | Median Income |
| 15 to 24 Years | 131 (9.7%) | $43,715 |
| 25 to 44 Years | 388 (28.7%) | $69,487 |
| 45 to 64 Years | 415 (30.7%) | $43,750 |
| 65+ Years | 419 (31.0%) | $0 |
| Total | 1,353 (100.0%) | $60,536 |
Poverty in Waynesburg borough
Income Below Poverty by Sex and Age in Waynesburg borough
With 11.5% poverty level for males and 17.8% for females among the residents of Waynesburg borough, 6 to 11 year old males and 18 to 24 year old females are the most vulnerable to poverty, with 50 males (30.3%) and 79 females (39.9%) in their respective age groups living below the poverty level.
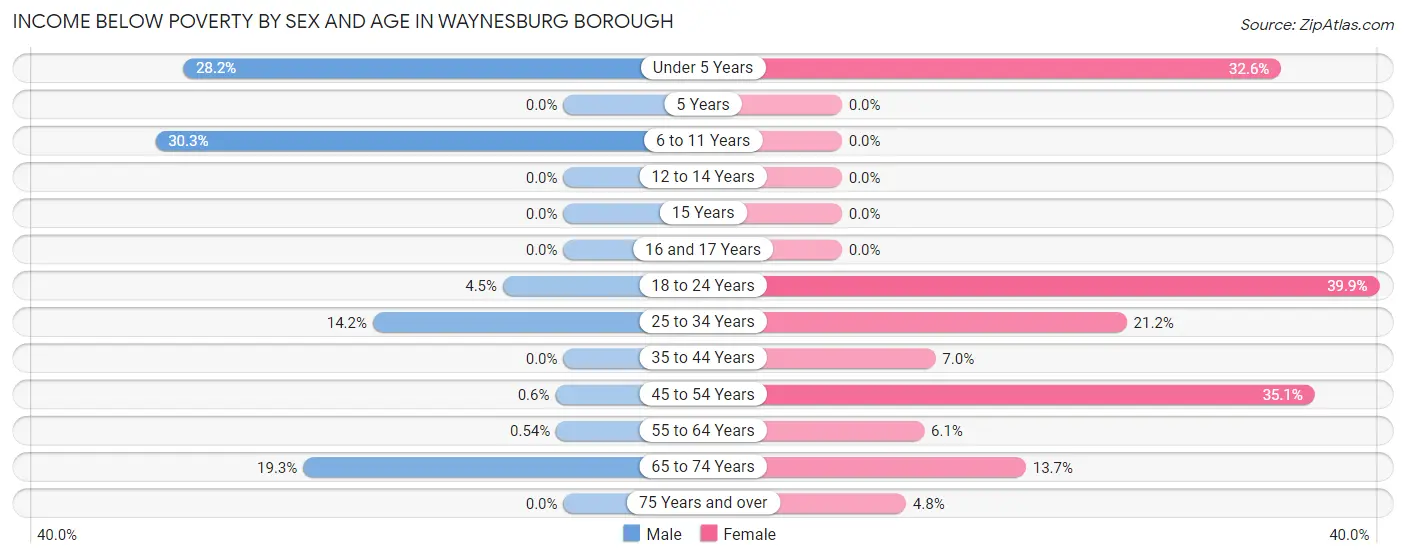
| Age Bracket | Male | Female |
| Under 5 Years | 37 (28.2%) | 61 (32.6%) |
| 5 Years | 0 (0.0%) | 0 (0.0%) |
| 6 to 11 Years | 50 (30.3%) | 0 (0.0%) |
| 12 to 14 Years | 0 (0.0%) | 0 (0.0%) |
| 15 Years | 0 (0.0%) | 0 (0.0%) |
| 16 and 17 Years | 0 (0.0%) | 0 (0.0%) |
| 18 to 24 Years | 4 (4.5%) | 79 (39.9%) |
| 25 to 34 Years | 30 (14.1%) | 44 (21.1%) |
| 35 to 44 Years | 0 (0.0%) | 13 (7.0%) |
| 45 to 54 Years | 1 (0.6%) | 46 (35.1%) |
| 55 to 64 Years | 1 (0.5%) | 8 (6.1%) |
| 65 to 74 Years | 34 (19.3%) | 25 (13.7%) |
| 75 Years and over | 0 (0.0%) | 7 (4.8%) |
| Total | 157 (11.5%) | 283 (17.8%) |
Income Above Poverty by Sex and Age in Waynesburg borough
According to the poverty statistics in Waynesburg borough, males aged 5 years and females aged 6 to 11 years are the age groups that are most secure financially, with 100.0% of males and 100.0% of females in these age groups living above the poverty line.
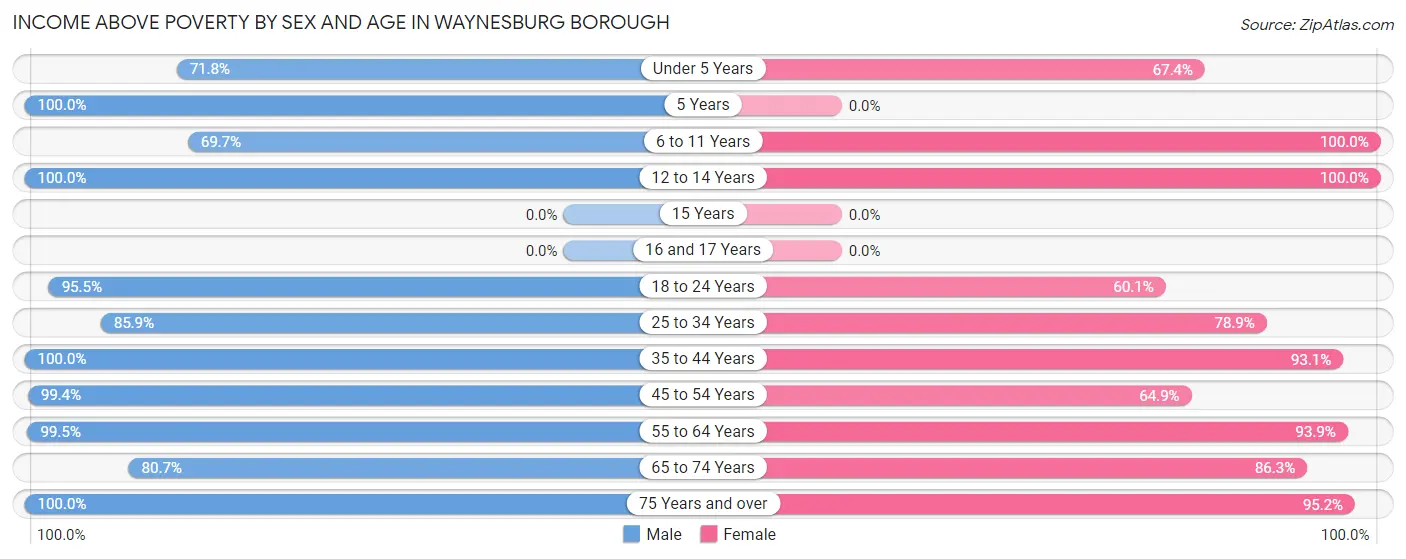
| Age Bracket | Male | Female |
| Under 5 Years | 94 (71.8%) | 126 (67.4%) |
| 5 Years | 17 (100.0%) | 0 (0.0%) |
| 6 to 11 Years | 115 (69.7%) | 169 (100.0%) |
| 12 to 14 Years | 6 (100.0%) | 44 (100.0%) |
| 15 Years | 0 (0.0%) | 0 (0.0%) |
| 16 and 17 Years | 0 (0.0%) | 0 (0.0%) |
| 18 to 24 Years | 85 (95.5%) | 119 (60.1%) |
| 25 to 34 Years | 182 (85.9%) | 164 (78.8%) |
| 35 to 44 Years | 154 (100.0%) | 174 (93.0%) |
| 45 to 54 Years | 166 (99.4%) | 85 (64.9%) |
| 55 to 64 Years | 184 (99.5%) | 123 (93.9%) |
| 65 to 74 Years | 142 (80.7%) | 158 (86.3%) |
| 75 Years and over | 62 (100.0%) | 140 (95.2%) |
| Total | 1,207 (88.5%) | 1,302 (82.2%) |
Income Below Poverty Among Married-Couple Families in Waynesburg borough
The poverty statistics for married-couple families in Waynesburg borough show that 1.6% or 8 of the total 504 families live below the poverty line. Families with no children have the highest poverty rate of 2.6%, comprising of 8 families. On the other hand, families with 1 or 2 children have the lowest poverty rate of 0.0%, which includes 0 families.
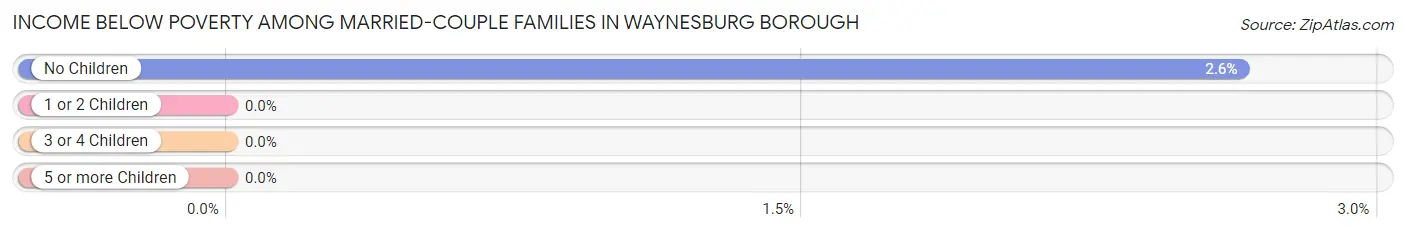
| Children | Above Poverty | Below Poverty |
| No Children | 295 (97.4%) | 8 (2.6%) |
| 1 or 2 Children | 201 (100.0%) | 0 (0.0%) |
| 3 or 4 Children | 0 (0.0%) | 0 (0.0%) |
| 5 or more Children | 0 (0.0%) | 0 (0.0%) |
| Total | 496 (98.4%) | 8 (1.6%) |
Income Below Poverty Among Single-Parent Households in Waynesburg borough
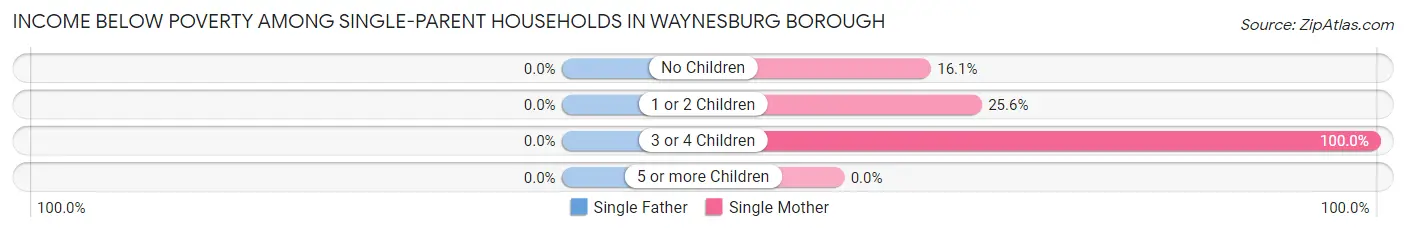
| Children | Single Father | Single Mother |
| No Children | 0 (0.0%) | 5 (16.1%) |
| 1 or 2 Children | 0 (0.0%) | 31 (25.6%) |
| 3 or 4 Children | 0 (0.0%) | 36 (100.0%) |
| 5 or more Children | 0 (0.0%) | 0 (0.0%) |
| Total | 0 (0.0%) | 72 (38.3%) |
Income Below Poverty Among Married-Couple vs Single-Parent Households in Waynesburg borough
The poverty data for Waynesburg borough shows that 8 of the married-couple family households (1.6%) and 72 of the single-parent households (24.9%) are living below the poverty level. Within the married-couple family households, those with no children have the highest poverty rate, with 8 households (2.6%) falling below the poverty line. Among the single-parent households, those with 3 or 4 children have the highest poverty rate, with 36 household (52.9%) living below poverty.
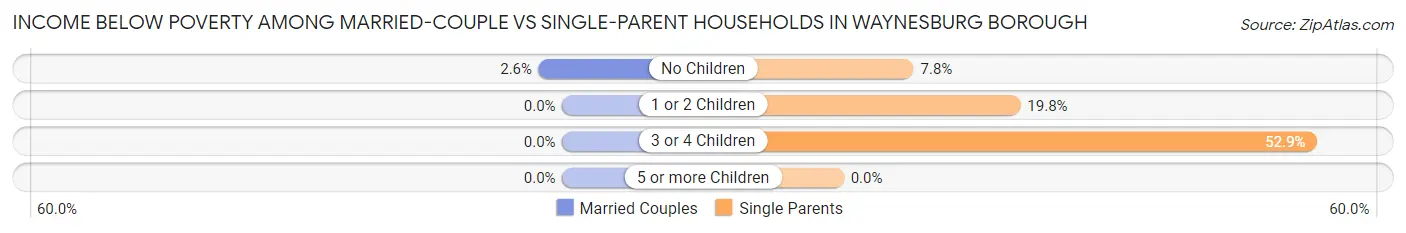
| Children | Married-Couple Families | Single-Parent Households |
| No Children | 8 (2.6%) | 5 (7.8%) |
| 1 or 2 Children | 0 (0.0%) | 31 (19.8%) |
| 3 or 4 Children | 0 (0.0%) | 36 (52.9%) |
| 5 or more Children | 0 (0.0%) | 0 (0.0%) |
| Total | 8 (1.6%) | 72 (24.9%) |
Race in Waynesburg borough
The most populous races in Waynesburg borough are White / Caucasian (3,720 | 94.1%), Two or more Races (103 | 2.6%), and Black / African American (73 | 1.8%).
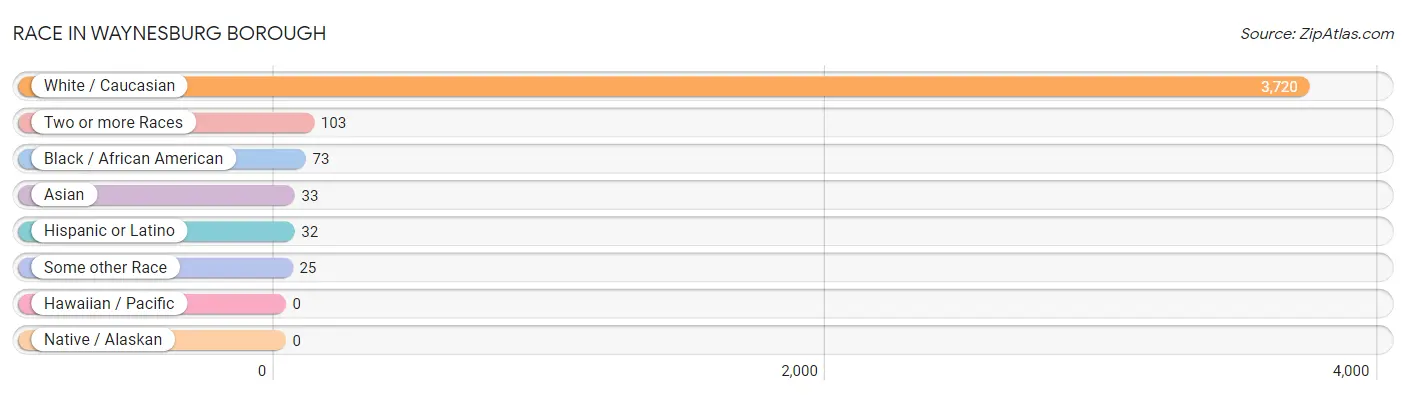
| Race | # Population | % Population |
| Asian | 33 | 0.8% |
| Black / African American | 73 | 1.8% |
| Hawaiian / Pacific | 0 | 0.0% |
| Hispanic or Latino | 32 | 0.8% |
| Native / Alaskan | 0 | 0.0% |
| White / Caucasian | 3,720 | 94.1% |
| Two or more Races | 103 | 2.6% |
| Some other Race | 25 | 0.6% |
| Total | 3,954 | 100.0% |
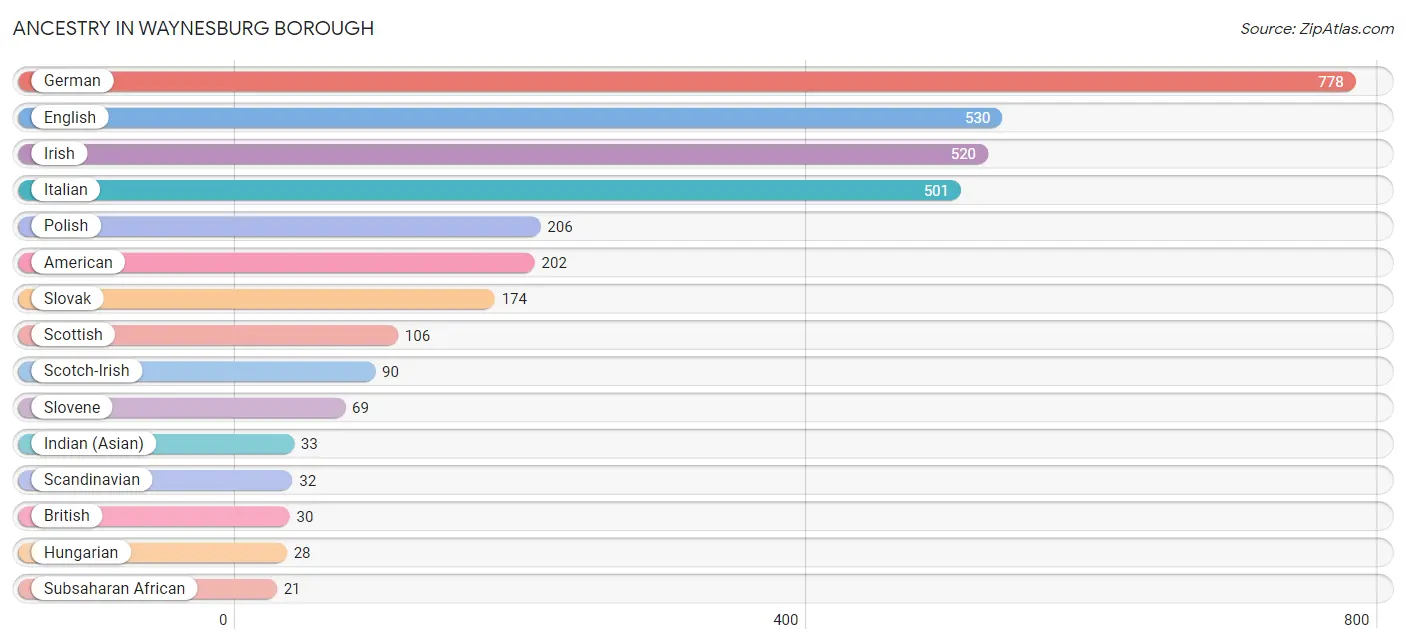
Ancestry in Waynesburg borough
The most populous ancestries reported in Waynesburg borough are German (778 | 19.7%), English (530 | 13.4%), Irish (520 | 13.2%), Italian (501 | 12.7%), and Polish (206 | 5.2%), together accounting for 64.1% of all Waynesburg borough residents.
| Ancestry | # Population | % Population |
| African | 11 | 0.3% |
| American | 202 | 5.1% |
| Arab | 6 | 0.2% |
| Austrian | 15 | 0.4% |
| British | 30 | 0.8% |
| Cherokee | 3 | 0.1% |
| Colombian | 20 | 0.5% |
| Croatian | 8 | 0.2% |
| Czech | 14 | 0.4% |
| Czechoslovakian | 14 | 0.4% |
| Dutch | 18 | 0.5% |
| English | 530 | 13.4% |
| European | 10 | 0.3% |
| French | 15 | 0.4% |
| German | 778 | 19.7% |
| Greek | 15 | 0.4% |
| Hungarian | 28 | 0.7% |
| Indian (Asian) | 33 | 0.8% |
| Irish | 520 | 13.2% |
| Italian | 501 | 12.7% |
| Lebanese | 6 | 0.2% |
| Polish | 206 | 5.2% |
| Russian | 20 | 0.5% |
| Scandinavian | 32 | 0.8% |
| Scotch-Irish | 90 | 2.3% |
| Scottish | 106 | 2.7% |
| Serbian | 12 | 0.3% |
| Slovak | 174 | 4.4% |
| Slovene | 69 | 1.8% |
| South American | 20 | 0.5% |
| Spanish | 12 | 0.3% |
| Subsaharan African | 21 | 0.5% |
| Ukrainian | 10 | 0.3% |
| Welsh | 17 | 0.4% | View All 34 Rows |
Immigrants in Waynesburg borough
The most numerous immigrant groups reported in Waynesburg borough came from Africa (34 | 0.9%), Cameroon (34 | 0.9%), Middle Africa (34 | 0.9%), Asia (33 | 0.8%), and China (33 | 0.8%), together accounting for 4.2% of all Waynesburg borough residents.
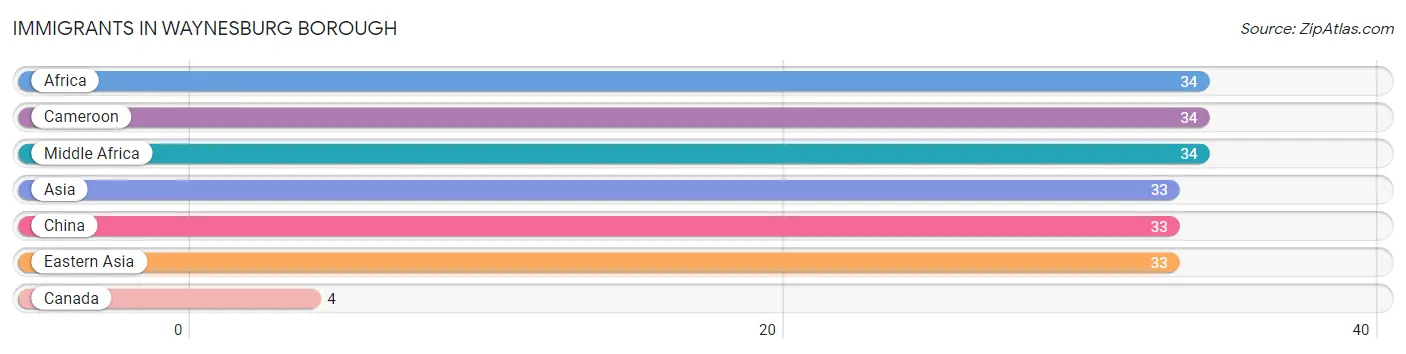
| Immigration Origin | # Population | % Population |
| Africa | 34 | 0.9% |
| Asia | 33 | 0.8% |
| Cameroon | 34 | 0.9% |
| Canada | 4 | 0.1% |
| China | 33 | 0.8% |
| Eastern Asia | 33 | 0.8% |
| Middle Africa | 34 | 0.9% | View All 7 Rows |
Sex and Age in Waynesburg borough
Sex and Age in Waynesburg borough
The most populous age groups in Waynesburg borough are 20 to 24 Years (293 | 16.1%) for men and 15 to 19 Years (406 | 19.1%) for women.
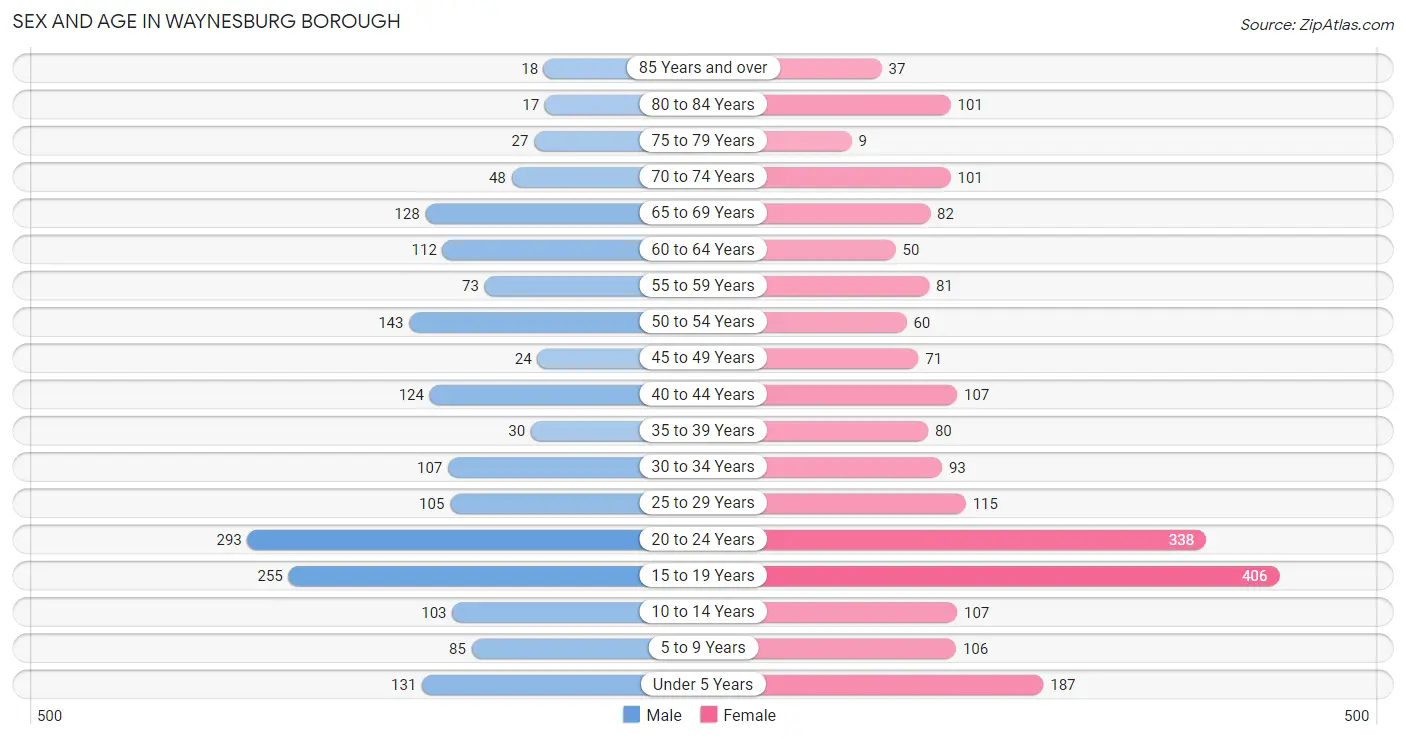
| Age Bracket | Male | Female |
| Under 5 Years | 131 (7.2%) | 187 (8.8%) |
| 5 to 9 Years | 85 (4.7%) | 106 (5.0%) |
| 10 to 14 Years | 103 (5.7%) | 107 (5.0%) |
| 15 to 19 Years | 255 (14.0%) | 406 (19.1%) |
| 20 to 24 Years | 293 (16.1%) | 338 (15.9%) |
| 25 to 29 Years | 105 (5.8%) | 115 (5.4%) |
| 30 to 34 Years | 107 (5.9%) | 93 (4.4%) |
| 35 to 39 Years | 30 (1.7%) | 80 (3.7%) |
| 40 to 44 Years | 124 (6.8%) | 107 (5.0%) |
| 45 to 49 Years | 24 (1.3%) | 71 (3.3%) |
| 50 to 54 Years | 143 (7.8%) | 60 (2.8%) |
| 55 to 59 Years | 73 (4.0%) | 81 (3.8%) |
| 60 to 64 Years | 112 (6.1%) | 50 (2.4%) |
| 65 to 69 Years | 128 (7.0%) | 82 (3.8%) |
| 70 to 74 Years | 48 (2.6%) | 101 (4.7%) |
| 75 to 79 Years | 27 (1.5%) | 9 (0.4%) |
| 80 to 84 Years | 17 (0.9%) | 101 (4.7%) |
| 85 Years and over | 18 (1.0%) | 37 (1.7%) |
| Total | 1,823 (100.0%) | 2,131 (100.0%) |
Families and Households in Waynesburg borough
Median Family Size in Waynesburg borough
The median family size in Waynesburg borough is 2.90 persons per family, with single female/mother families (188 | 23.7%) accounting for the largest median family size of 3.51 persons per family. On the other hand, single male/father families (101 | 12.7%) represent the smallest median family size with 2.40 persons per family.
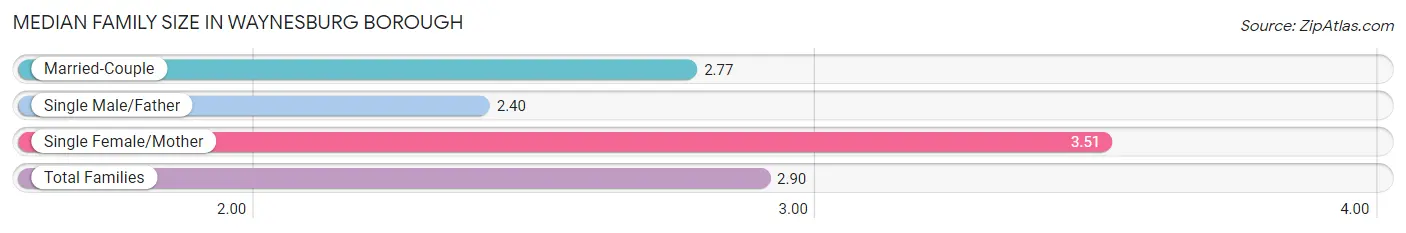
| Family Type | # Families | Family Size |
| Married-Couple | 504 (63.6%) | 2.77 |
| Single Male/Father | 101 (12.7%) | 2.40 |
| Single Female/Mother | 188 (23.7%) | 3.51 |
| Total Families | 793 (100.0%) | 2.90 |
Median Household Size in Waynesburg borough
The median household size in Waynesburg borough is 2.17 persons per household, with single female/mother households (188 | 13.9%) accounting for the largest median household size of 3.66 persons per household. non-family households (560 | 41.4%) represent the smallest median household size with 1.09 persons per household.
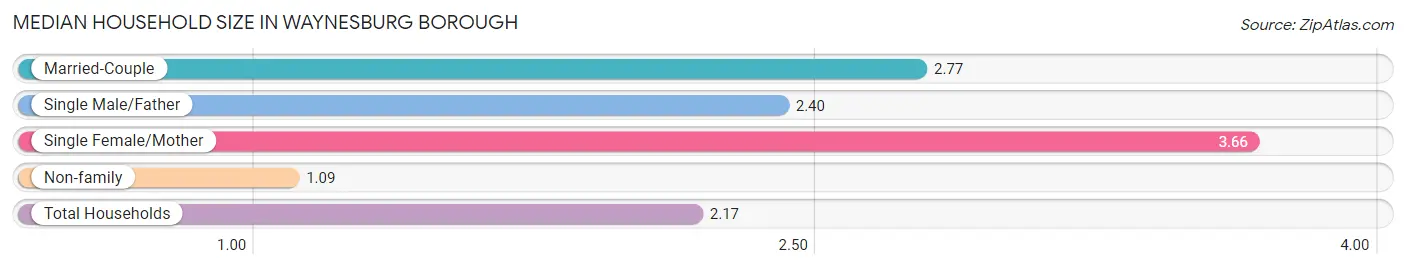
| Household Type | # Households | Household Size |
| Married-Couple | 504 (37.2%) | 2.77 |
| Single Male/Father | 101 (7.5%) | 2.40 |
| Single Female/Mother | 188 (13.9%) | 3.66 |
| Non-family | 560 (41.4%) | 1.09 |
| Total Households | 1,353 (100.0%) | 2.17 |
Household Size by Marriage Status in Waynesburg borough
Out of a total of 1,353 households in Waynesburg borough, 793 (58.6%) are family households, while 560 (41.4%) are nonfamily households. The most numerous type of family households are 2-person households, comprising 347, and the most common type of nonfamily households are 1-person households, comprising 490.
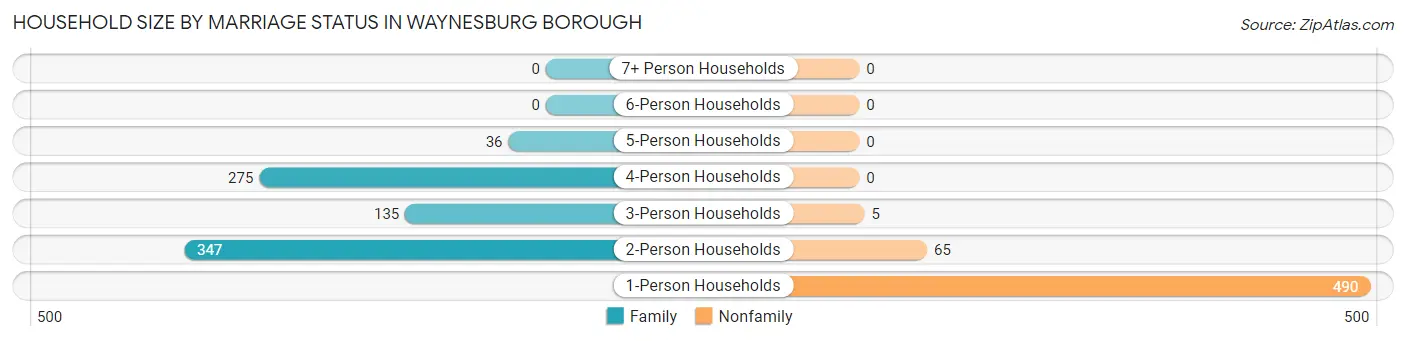
| Household Size | Family Households | Nonfamily Households |
| 1-Person Households | - | 490 (36.2%) |
| 2-Person Households | 347 (25.7%) | 65 (4.8%) |
| 3-Person Households | 135 (10.0%) | 5 (0.4%) |
| 4-Person Households | 275 (20.3%) | 0 (0.0%) |
| 5-Person Households | 36 (2.7%) | 0 (0.0%) |
| 6-Person Households | 0 (0.0%) | 0 (0.0%) |
| 7+ Person Households | 0 (0.0%) | 0 (0.0%) |
| Total | 793 (58.6%) | 560 (41.4%) |
Female Fertility in Waynesburg borough
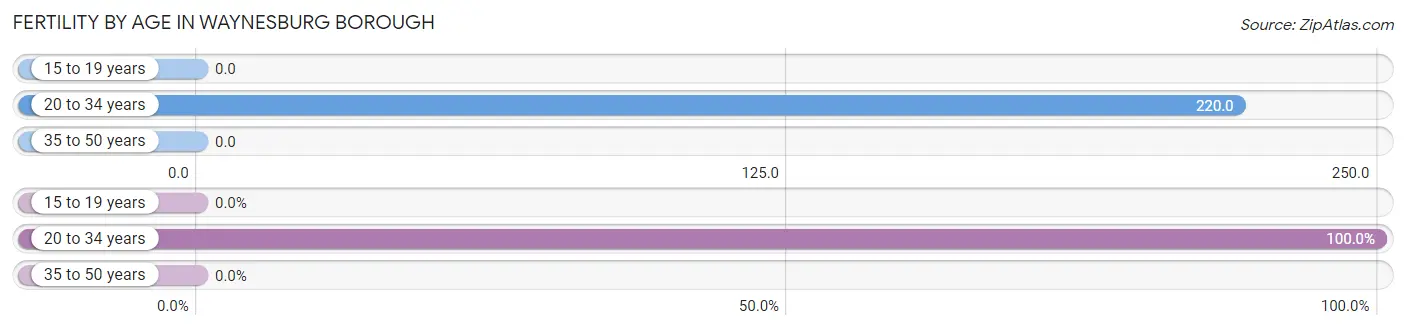
Fertility by Age in Waynesburg borough
Average fertility rate in Waynesburg borough is 97.0 births per 1,000 women. Women in the age bracket of 20 to 34 years have the highest fertility rate with 220.0 births per 1,000 women. Women in the age bracket of 20 to 34 years acount for 100.0% of all women with births.
| Age Bracket | Women with Births | Births / 1,000 Women |
| 15 to 19 years | 0 (0.0%) | 0.0 |
| 20 to 34 years | 120 (100.0%) | 220.0 |
| 35 to 50 years | 0 (0.0%) | 0.0 |
| Total | 120 (100.0%) | 97.0 |
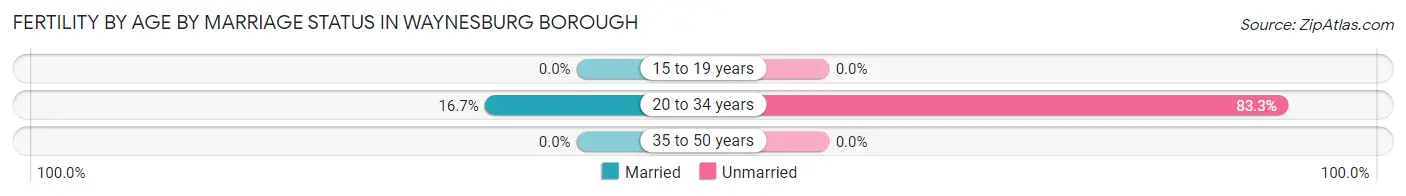
Fertility by Age by Marriage Status in Waynesburg borough
16.7% of women with births (120) in Waynesburg borough are married. The highest percentage of unmarried women with births falls into 20 to 34 years age bracket with 83.3% of them unmarried at the time of birth, while the lowest percentage of unmarried women with births belong to 20 to 34 years age bracket with 83.3% of them unmarried.
| Age Bracket | Married | Unmarried |
| 15 to 19 years | 0 (0.0%) | 0 (0.0%) |
| 20 to 34 years | 20 (16.7%) | 100 (83.3%) |
| 35 to 50 years | 0 (0.0%) | 0 (0.0%) |
| Total | 20 (16.7%) | 100 (83.3%) |
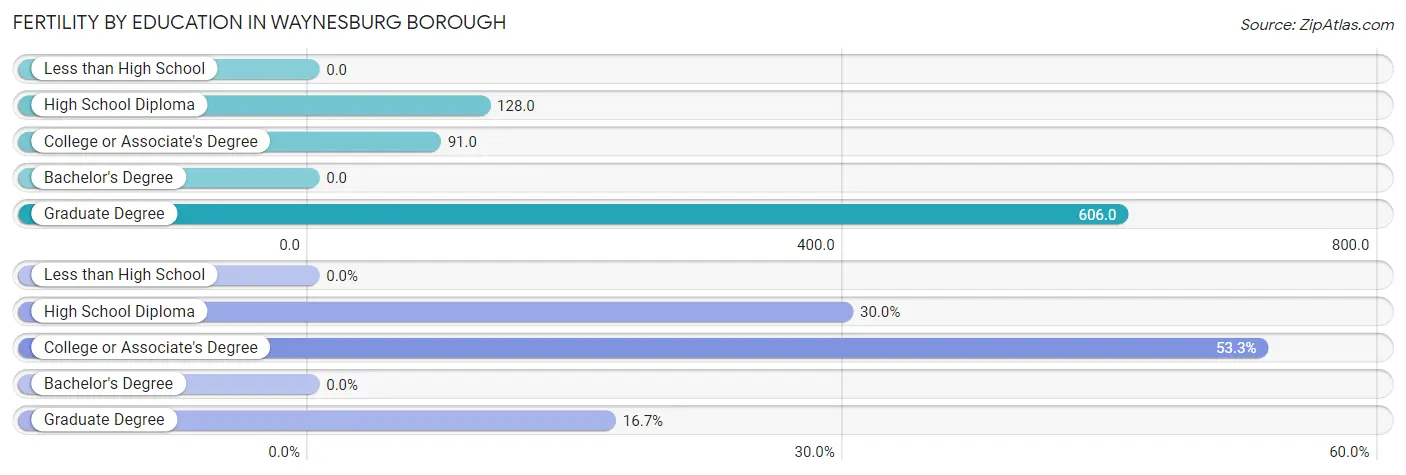
Fertility by Education in Waynesburg borough
| Educational Attainment | Women with Births | Births / 1,000 Women |
| Less than High School | 0 (0.0%) | 0.0 |
| High School Diploma | 36 (30.0%) | 128.0 |
| College or Associate's Degree | 64 (53.3%) | 91.0 |
| Bachelor's Degree | 0 (0.0%) | 0.0 |
| Graduate Degree | 20 (16.7%) | 606.0 |
| Total | 120 (100.0%) | 97.0 |
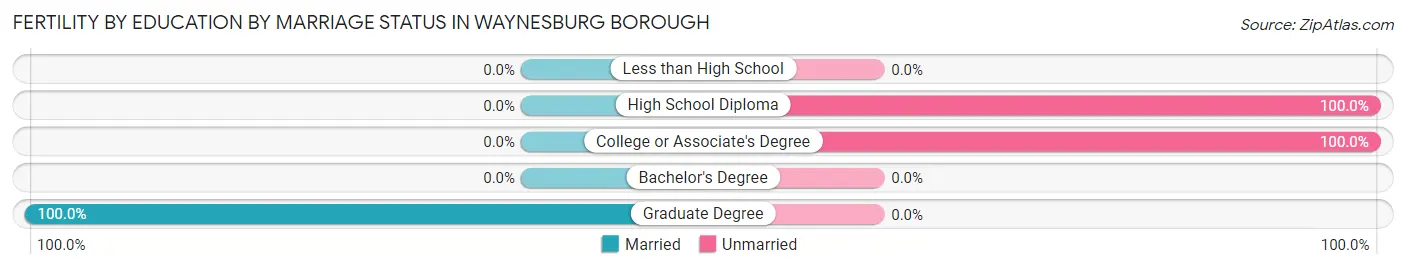
Fertility by Education by Marriage Status in Waynesburg borough
83.3% of women with births in Waynesburg borough are unmarried. Women with the educational attainment of graduate degree are most likely to be married with 100.0% of them married at childbirth, while women with the educational attainment of high school diploma are least likely to be married with 100.0% of them unmarried at childbirth.
| Educational Attainment | Married | Unmarried |
| Less than High School | 0 (0.0%) | 0 (0.0%) |
| High School Diploma | 0 (0.0%) | 36 (100.0%) |
| College or Associate's Degree | 0 (0.0%) | 64 (100.0%) |
| Bachelor's Degree | 0 (0.0%) | 0 (0.0%) |
| Graduate Degree | 20 (100.0%) | 0 (0.0%) |
| Total | 20 (16.7%) | 100 (83.3%) |
Employment Characteristics in Waynesburg borough
Employment by Class of Employer in Waynesburg borough
Among the 1,610 employed individuals in Waynesburg borough, private company employees (900 | 55.9%), state government employees (286 | 17.8%), and not-for-profit organizations (201 | 12.5%) make up the most common classes of employment.
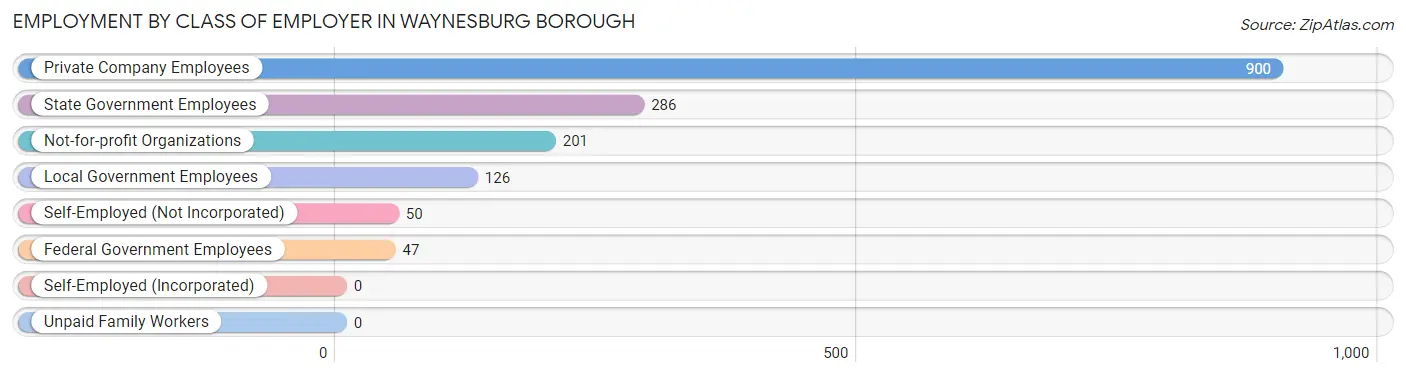
| Employer Class | # Employees | % Employees |
| Private Company Employees | 900 | 55.9% |
| Self-Employed (Incorporated) | 0 | 0.0% |
| Self-Employed (Not Incorporated) | 50 | 3.1% |
| Not-for-profit Organizations | 201 | 12.5% |
| Local Government Employees | 126 | 7.8% |
| State Government Employees | 286 | 17.8% |
| Federal Government Employees | 47 | 2.9% |
| Unpaid Family Workers | 0 | 0.0% |
| Total | 1,610 | 100.0% |
Employment Status by Age in Waynesburg borough
According to the labor force statistics for Waynesburg borough, out of the total population over 16 years of age (3,235), 56.7% or 1,834 individuals are in the labor force, with 6.2% or 114 of them unemployed. The age group with the highest labor force participation rate is 35 to 44 years, with 97.9% or 334 individuals in the labor force. Within the labor force, the 30 to 34 years age range has the highest percentage of unemployed individuals, with 14.9% or 22 of them being unemployed.
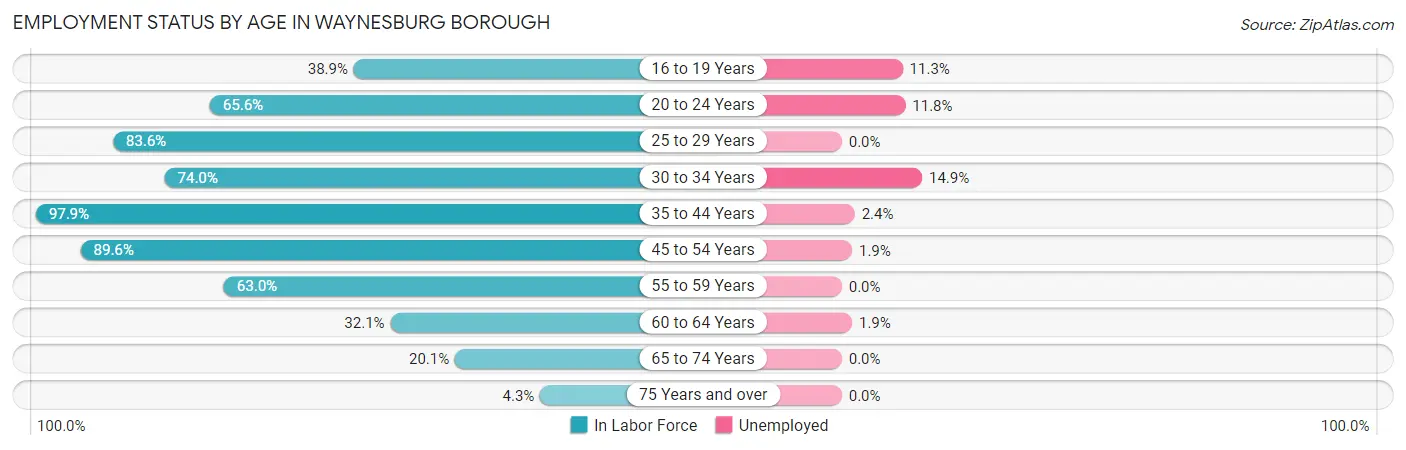
| Age Bracket | In Labor Force | Unemployed |
| 16 to 19 Years | 257 (38.9%) | 29 (11.3%) |
| 20 to 24 Years | 414 (65.6%) | 49 (11.8%) |
| 25 to 29 Years | 184 (83.6%) | 0 (0.0%) |
| 30 to 34 Years | 148 (74.0%) | 22 (14.9%) |
| 35 to 44 Years | 334 (97.9%) | 8 (2.4%) |
| 45 to 54 Years | 267 (89.6%) | 5 (1.9%) |
| 55 to 59 Years | 97 (63.0%) | 0 (0.0%) |
| 60 to 64 Years | 52 (32.1%) | 1 (1.9%) |
| 65 to 74 Years | 72 (20.1%) | 0 (0.0%) |
| 75 Years and over | 9 (4.3%) | 0 (0.0%) |
| Total | 1,834 (56.7%) | 114 (6.2%) |
Employment Status by Educational Attainment in Waynesburg borough
According to labor force statistics for Waynesburg borough, 78.7% of individuals (1,082) out of the total population between 25 and 64 years of age (1,375) are in the labor force, with 3.3% or 36 of them being unemployed. The group with the highest labor force participation rate are those with the educational attainment of bachelor's degree or higher, with 97.0% or 519 individuals in the labor force. Within the labor force, individuals with high school diploma education have the highest percentage of unemployment, with 13.3% or 30 of them being unemployed.
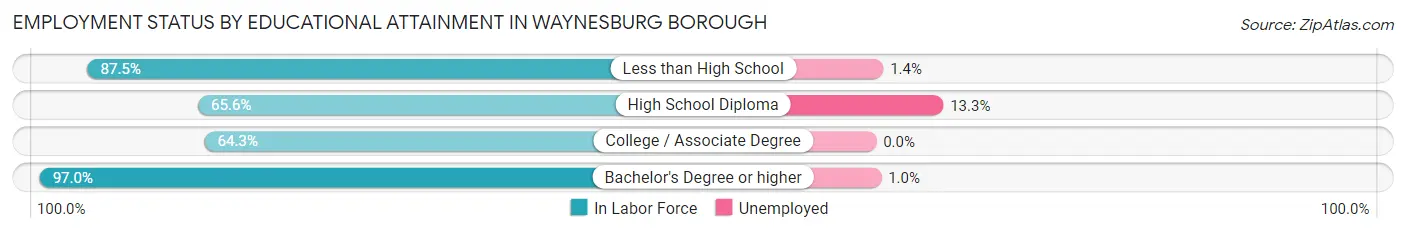
| Educational Attainment | In Labor Force | Unemployed |
| Less than High School | 70 (87.5%) | 1 (1.4%) |
| High School Diploma | 225 (65.6%) | 46 (13.3%) |
| College / Associate Degree | 268 (64.3%) | 0 (0.0%) |
| Bachelor's Degree or higher | 519 (97.0%) | 5 (1.0%) |
| Total | 1,082 (78.7%) | 45 (3.3%) |
Employment Occupations by Sex in Waynesburg borough
Management, Business, Science and Arts Occupations
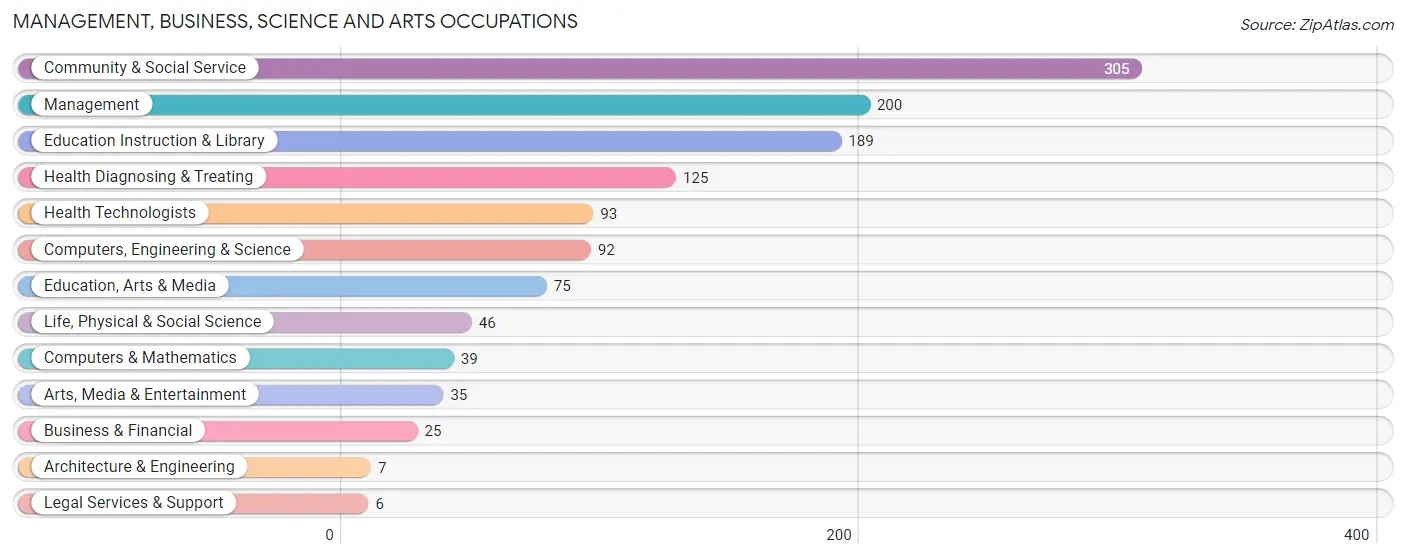
The most common Management, Business, Science and Arts occupations in Waynesburg borough are Community & Social Service (305 | 17.7%), Management (200 | 11.6%), Education Instruction & Library (189 | 11.0%), Health Diagnosing & Treating (125 | 7.3%), and Health Technologists (93 | 5.4%).
Management, Business, Science and Arts Occupations by Sex
Within the Management, Business, Science and Arts occupations in Waynesburg borough, the most male-oriented occupations are Computers, Engineering & Science (100.0%), Computers & Mathematics (100.0%), and Architecture & Engineering (100.0%), while the most female-oriented occupations are Health Technologists (77.4%), Education Instruction & Library (72.5%), and Health Diagnosing & Treating (70.4%).
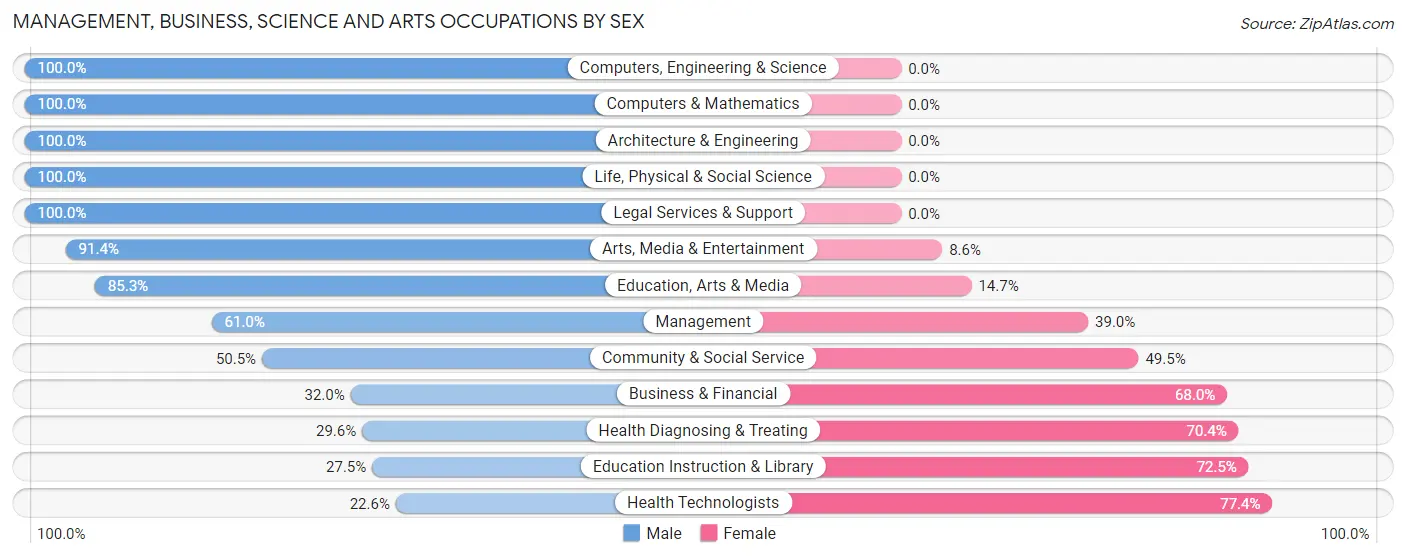
| Occupation | Male | Female |
| Management | 122 (61.0%) | 78 (39.0%) |
| Business & Financial | 8 (32.0%) | 17 (68.0%) |
| Computers, Engineering & Science | 92 (100.0%) | 0 (0.0%) |
| Computers & Mathematics | 39 (100.0%) | 0 (0.0%) |
| Architecture & Engineering | 7 (100.0%) | 0 (0.0%) |
| Life, Physical & Social Science | 46 (100.0%) | 0 (0.0%) |
| Community & Social Service | 154 (50.5%) | 151 (49.5%) |
| Education, Arts & Media | 64 (85.3%) | 11 (14.7%) |
| Legal Services & Support | 6 (100.0%) | 0 (0.0%) |
| Education Instruction & Library | 52 (27.5%) | 137 (72.5%) |
| Arts, Media & Entertainment | 32 (91.4%) | 3 (8.6%) |
| Health Diagnosing & Treating | 37 (29.6%) | 88 (70.4%) |
| Health Technologists | 21 (22.6%) | 72 (77.4%) |
| Total (Category) | 413 (55.3%) | 334 (44.7%) |
| Total (Overall) | 797 (46.3%) | 923 (53.7%) |
Services Occupations
The most common Services occupations in Waynesburg borough are Food Preparation & Serving (214 | 12.4%), Personal Care & Service (145 | 8.4%), Cleaning & Maintenance (45 | 2.6%), Healthcare Support (38 | 2.2%), and Security & Protection (36 | 2.1%).

Services Occupations by Sex
Within the Services occupations in Waynesburg borough, the most male-oriented occupations are Security & Protection (69.4%), Law Enforcement (69.4%), and Food Preparation & Serving (52.3%), while the most female-oriented occupations are Healthcare Support (100.0%), Personal Care & Service (60.7%), and Cleaning & Maintenance (48.9%).
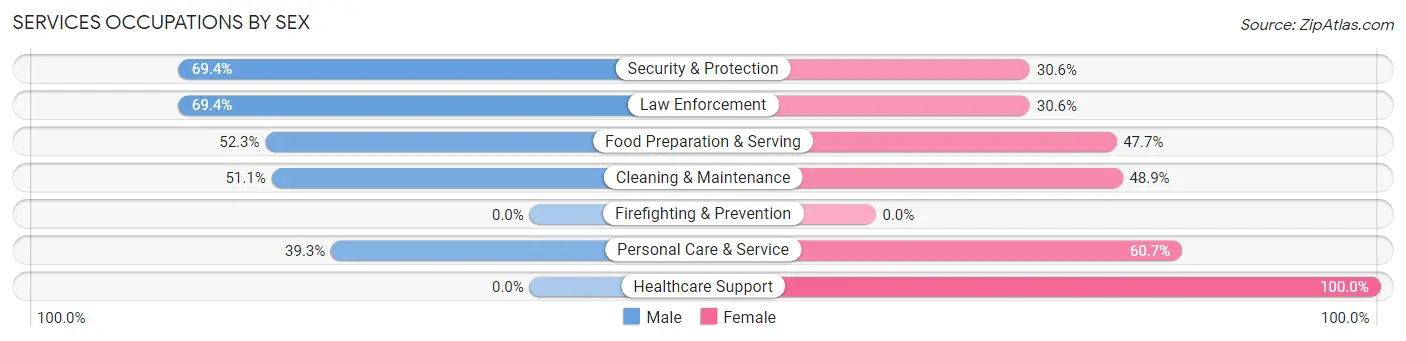
| Occupation | Male | Female |
| Healthcare Support | 0 (0.0%) | 38 (100.0%) |
| Security & Protection | 25 (69.4%) | 11 (30.6%) |
| Firefighting & Prevention | 0 (0.0%) | 0 (0.0%) |
| Law Enforcement | 25 (69.4%) | 11 (30.6%) |
| Food Preparation & Serving | 112 (52.3%) | 102 (47.7%) |
| Cleaning & Maintenance | 23 (51.1%) | 22 (48.9%) |
| Personal Care & Service | 57 (39.3%) | 88 (60.7%) |
| Total (Category) | 217 (45.4%) | 261 (54.6%) |
| Total (Overall) | 797 (46.3%) | 923 (53.7%) |
Sales and Office Occupations
The most common Sales and Office occupations in Waynesburg borough are Sales & Related (170 | 9.9%), and Office & Administration (145 | 8.4%).
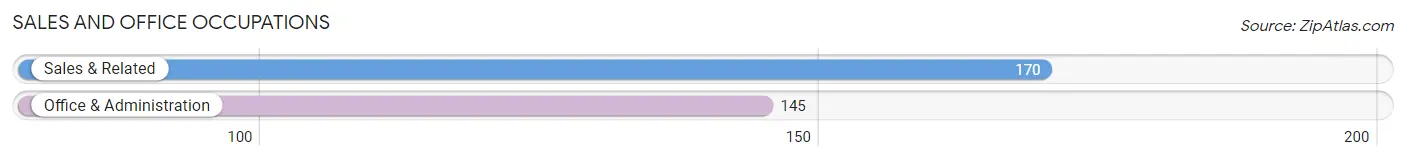
Sales and Office Occupations by Sex
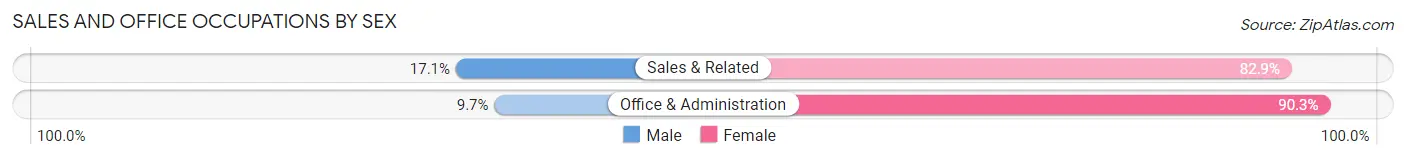
| Occupation | Male | Female |
| Sales & Related | 29 (17.1%) | 141 (82.9%) |
| Office & Administration | 14 (9.7%) | 131 (90.3%) |
| Total (Category) | 43 (13.7%) | 272 (86.4%) |
| Total (Overall) | 797 (46.3%) | 923 (53.7%) |
Natural Resources, Construction and Maintenance Occupations
The most common Natural Resources, Construction and Maintenance occupations in Waynesburg borough are Installation, Maintenance & Repair (41 | 2.4%), and Construction & Extraction (9 | 0.5%).
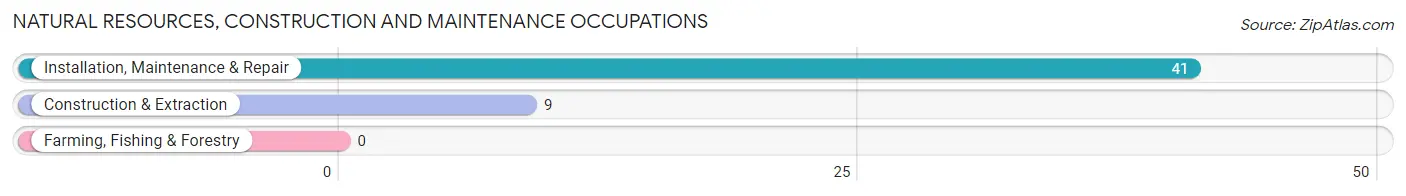
Natural Resources, Construction and Maintenance Occupations by Sex
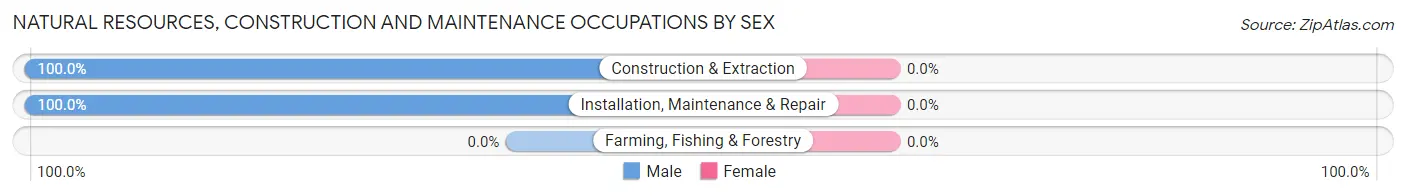
| Occupation | Male | Female |
| Farming, Fishing & Forestry | 0 (0.0%) | 0 (0.0%) |
| Construction & Extraction | 9 (100.0%) | 0 (0.0%) |
| Installation, Maintenance & Repair | 41 (100.0%) | 0 (0.0%) |
| Total (Category) | 50 (100.0%) | 0 (0.0%) |
| Total (Overall) | 797 (46.3%) | 923 (53.7%) |
Production, Transportation and Moving Occupations
The most common Production, Transportation and Moving occupations in Waynesburg borough are Material Moving (82 | 4.8%), Production (37 | 2.1%), and Transportation (11 | 0.6%).
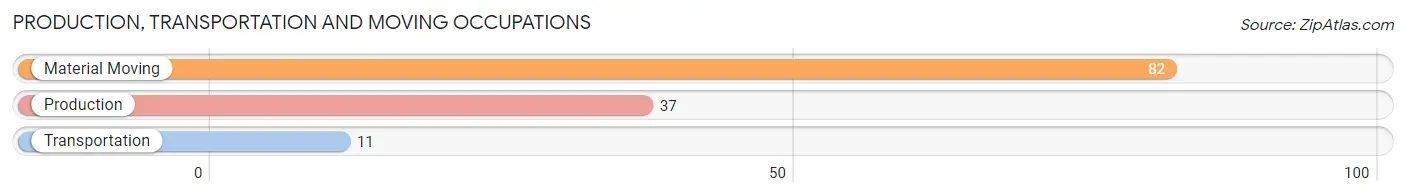
Production, Transportation and Moving Occupations by Sex
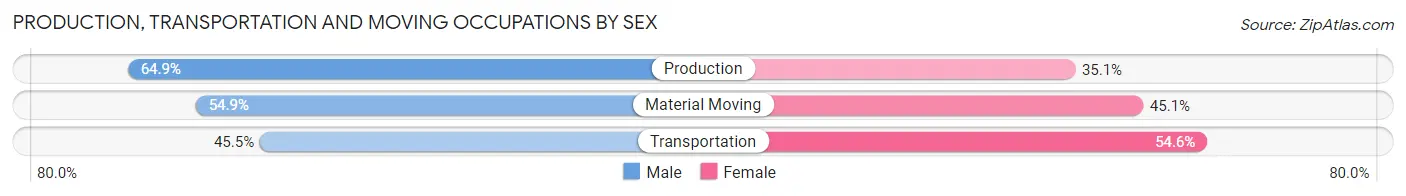
| Occupation | Male | Female |
| Production | 24 (64.9%) | 13 (35.1%) |
| Transportation | 5 (45.5%) | 6 (54.5%) |
| Material Moving | 45 (54.9%) | 37 (45.1%) |
| Total (Category) | 74 (56.9%) | 56 (43.1%) |
| Total (Overall) | 797 (46.3%) | 923 (53.7%) |
Employment Industries by Sex in Waynesburg borough
Employment Industries in Waynesburg borough
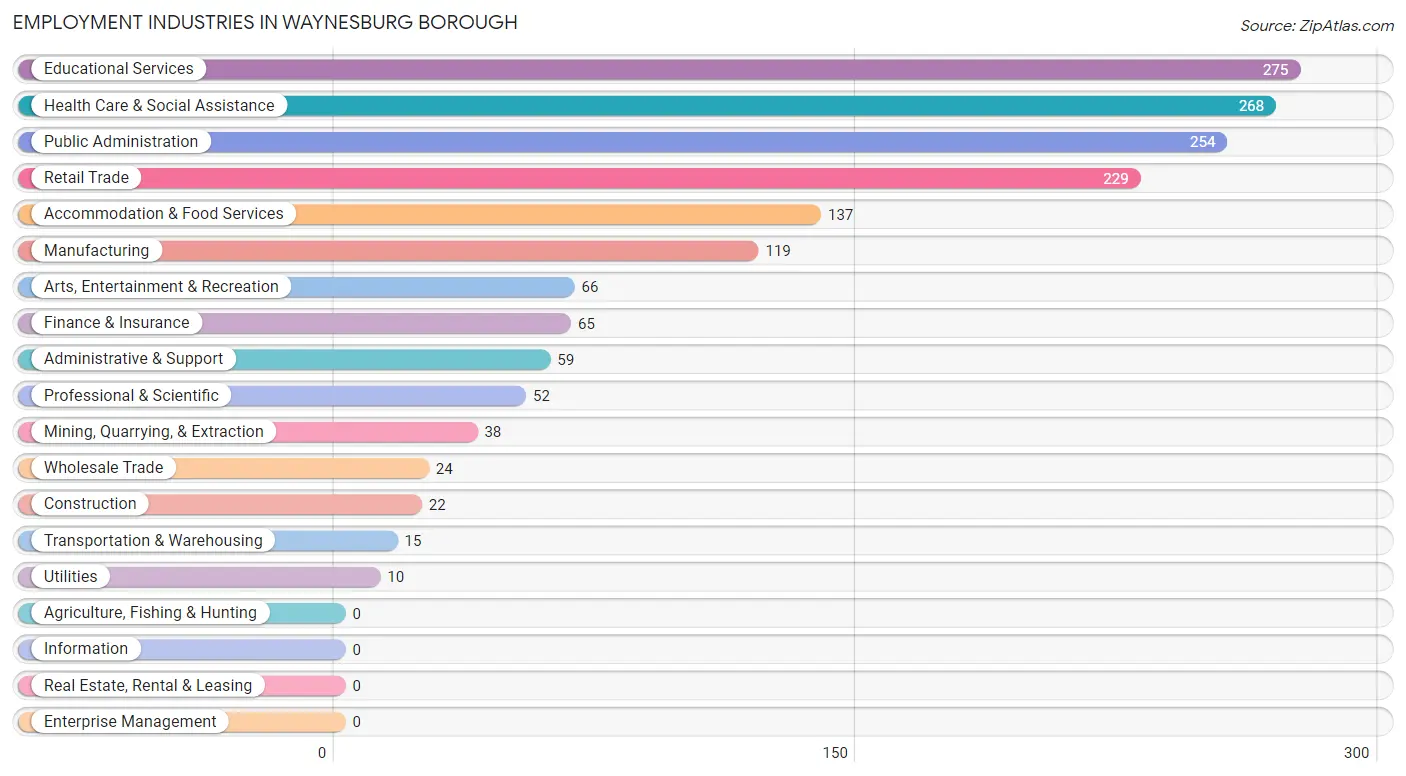
The major employment industries in Waynesburg borough include Educational Services (275 | 16.0%), Health Care & Social Assistance (268 | 15.6%), Public Administration (254 | 14.8%), Retail Trade (229 | 13.3%), and Accommodation & Food Services (137 | 8.0%).
Employment Industries by Sex in Waynesburg borough
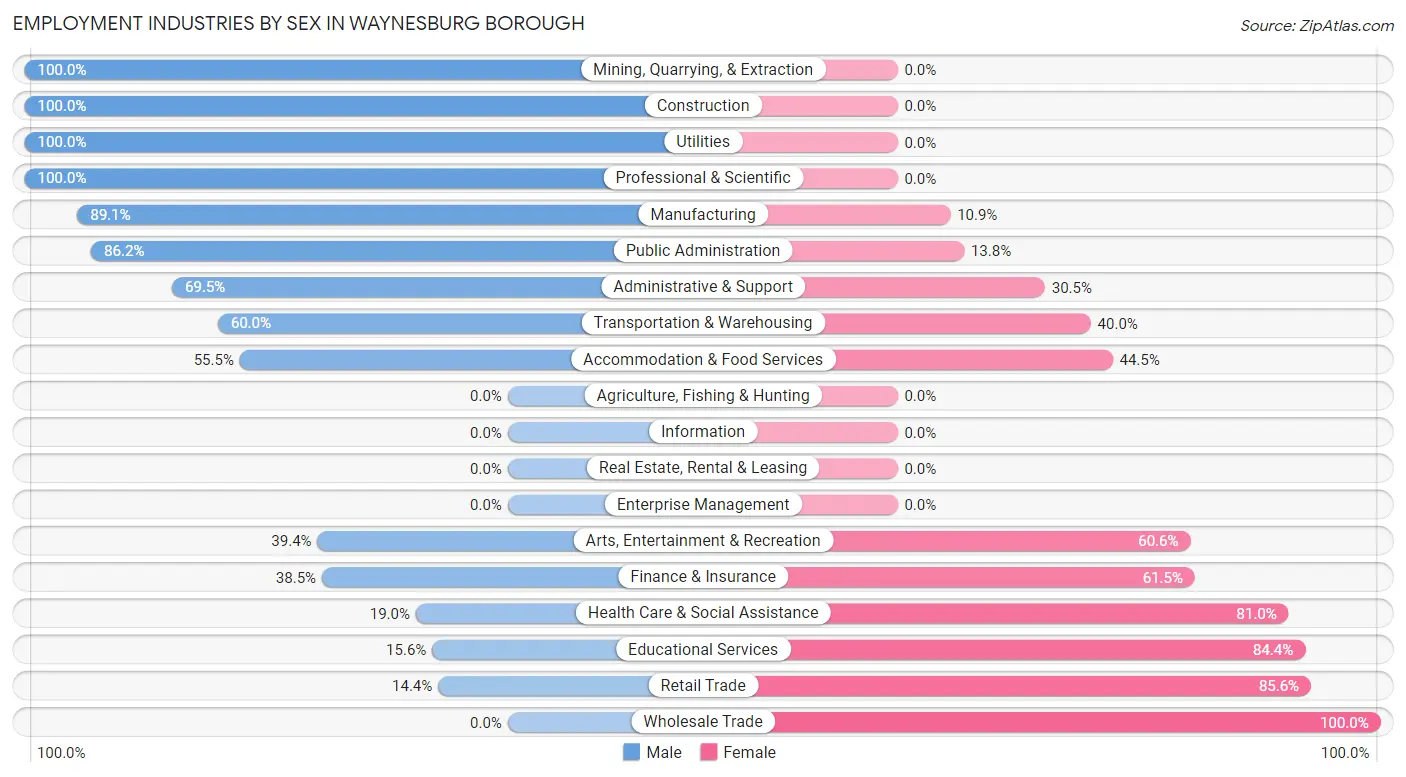
The Waynesburg borough industries that see more men than women are Mining, Quarrying, & Extraction (100.0%), Construction (100.0%), and Utilities (100.0%), whereas the industries that tend to have a higher number of women are Wholesale Trade (100.0%), Retail Trade (85.6%), and Educational Services (84.4%).
| Industry | Male | Female |
| Agriculture, Fishing & Hunting | 0 (0.0%) | 0 (0.0%) |
| Mining, Quarrying, & Extraction | 38 (100.0%) | 0 (0.0%) |
| Construction | 22 (100.0%) | 0 (0.0%) |
| Manufacturing | 106 (89.1%) | 13 (10.9%) |
| Wholesale Trade | 0 (0.0%) | 24 (100.0%) |
| Retail Trade | 33 (14.4%) | 196 (85.6%) |
| Transportation & Warehousing | 9 (60.0%) | 6 (40.0%) |
| Utilities | 10 (100.0%) | 0 (0.0%) |
| Information | 0 (0.0%) | 0 (0.0%) |
| Finance & Insurance | 25 (38.5%) | 40 (61.5%) |
| Real Estate, Rental & Leasing | 0 (0.0%) | 0 (0.0%) |
| Professional & Scientific | 52 (100.0%) | 0 (0.0%) |
| Enterprise Management | 0 (0.0%) | 0 (0.0%) |
| Administrative & Support | 41 (69.5%) | 18 (30.5%) |
| Educational Services | 43 (15.6%) | 232 (84.4%) |
| Health Care & Social Assistance | 51 (19.0%) | 217 (81.0%) |
| Arts, Entertainment & Recreation | 26 (39.4%) | 40 (60.6%) |
| Accommodation & Food Services | 76 (55.5%) | 61 (44.5%) |
| Public Administration | 219 (86.2%) | 35 (13.8%) |
| Total | 797 (46.3%) | 923 (53.7%) |
Education in Waynesburg borough
School Enrollment in Waynesburg borough
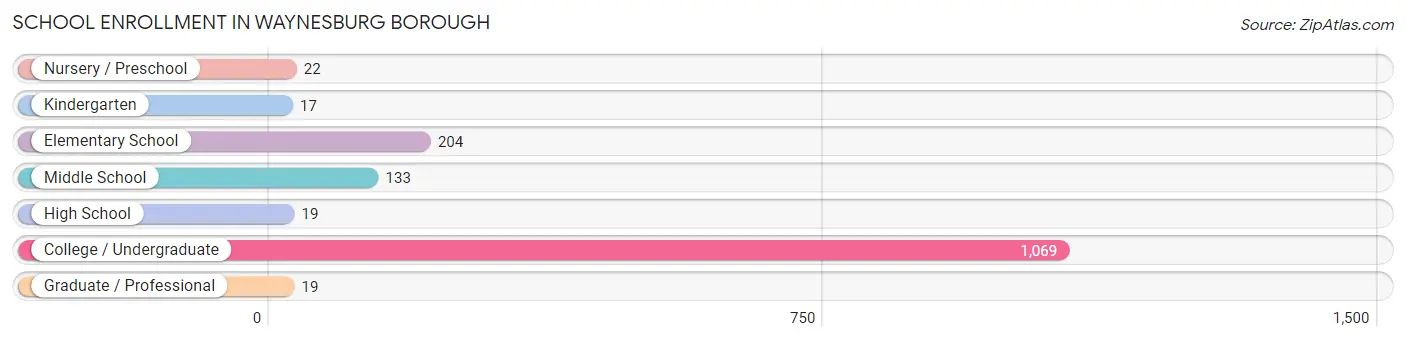
The most common levels of schooling among the 1,483 students in Waynesburg borough are college / undergraduate (1,069 | 72.1%), elementary school (204 | 13.8%), and middle school (133 | 9.0%).
| School Level | # Students | % Students |
| Nursery / Preschool | 22 | 1.5% |
| Kindergarten | 17 | 1.1% |
| Elementary School | 204 | 13.8% |
| Middle School | 133 | 9.0% |
| High School | 19 | 1.3% |
| College / Undergraduate | 1,069 | 72.1% |
| Graduate / Professional | 19 | 1.3% |
| Total | 1,483 | 100.0% |
School Enrollment by Age by Funding Source in Waynesburg borough
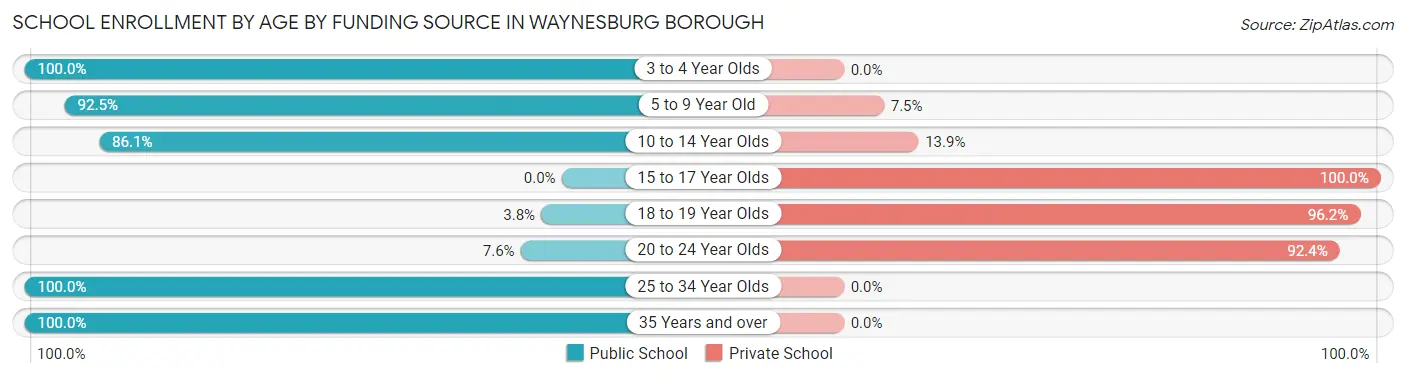
Out of a total of 1,483 students who are enrolled in schools in Waynesburg borough, 1,057 (71.3%) attend a private institution, while the remaining 426 (28.7%) are enrolled in public schools. The age group of 15 to 17 year olds has the highest likelihood of being enrolled in private schools, with 4 (100.0% in the age bracket) enrolled. Conversely, the age group of 3 to 4 year olds has the lowest likelihood of being enrolled in a private school, with 22 (100.0% in the age bracket) attending a public institution.
| Age Bracket | Public School | Private School |
| 3 to 4 Year Olds | 22 (100.0%) | 0 (0.0%) |
| 5 to 9 Year Old | 161 (92.5%) | 13 (7.5%) |
| 10 to 14 Year Olds | 155 (86.1%) | 25 (13.9%) |
| 15 to 17 Year Olds | 0 (0.0%) | 4 (100.0%) |
| 18 to 19 Year Olds | 25 (3.8%) | 629 (96.2%) |
| 20 to 24 Year Olds | 32 (7.6%) | 387 (92.4%) |
| 25 to 34 Year Olds | 19 (100.0%) | 0 (0.0%) |
| 35 Years and over | 11 (100.0%) | 0 (0.0%) |
| Total | 426 (28.7%) | 1,057 (71.3%) |
Educational Attainment by Field of Study in Waynesburg borough
Education (148 | 21.0%), science & technology (145 | 20.6%), arts & humanities (122 | 17.3%), bio, nature & agricultural (55 | 7.8%), and business (44 | 6.3%) are the most common fields of study among 703 individuals in Waynesburg borough who have obtained a bachelor's degree or higher.
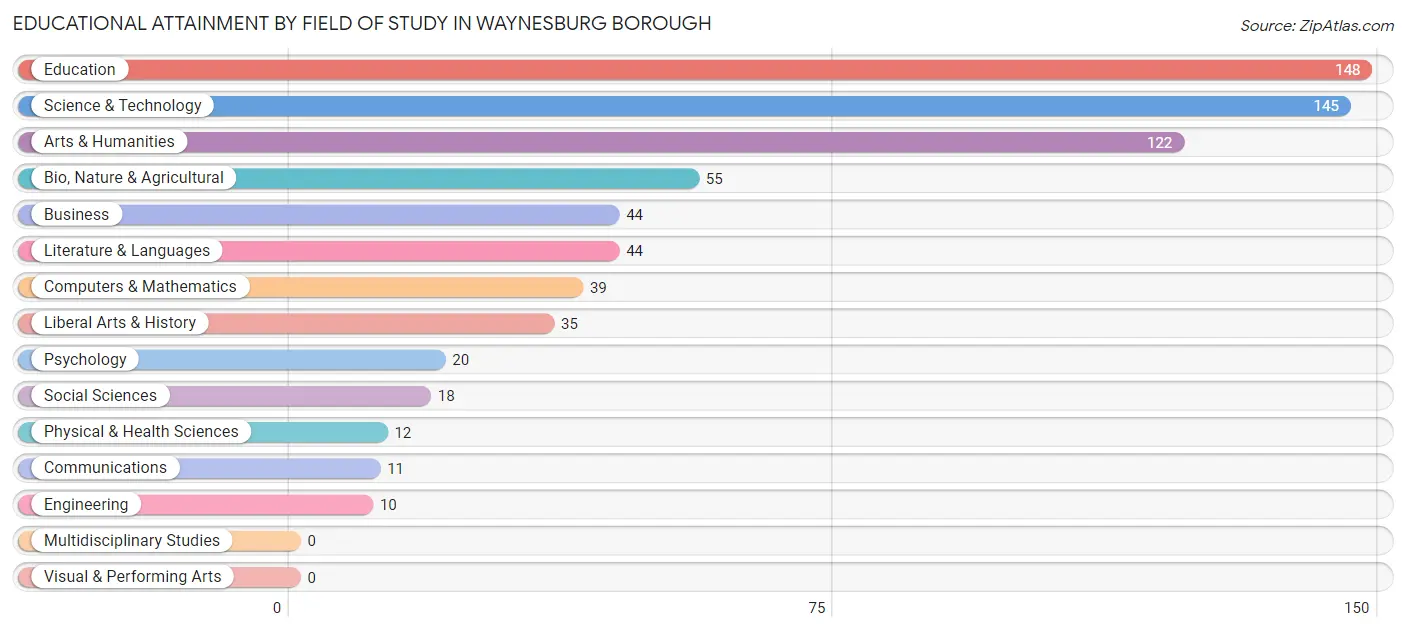
| Field of Study | # Graduates | % Graduates |
| Computers & Mathematics | 39 | 5.6% |
| Bio, Nature & Agricultural | 55 | 7.8% |
| Physical & Health Sciences | 12 | 1.7% |
| Psychology | 20 | 2.8% |
| Social Sciences | 18 | 2.6% |
| Engineering | 10 | 1.4% |
| Multidisciplinary Studies | 0 | 0.0% |
| Science & Technology | 145 | 20.6% |
| Business | 44 | 6.3% |
| Education | 148 | 21.0% |
| Literature & Languages | 44 | 6.3% |
| Liberal Arts & History | 35 | 5.0% |
| Visual & Performing Arts | 0 | 0.0% |
| Communications | 11 | 1.6% |
| Arts & Humanities | 122 | 17.3% |
| Total | 703 | 100.0% |
Transportation & Commute in Waynesburg borough
Vehicle Availability by Sex in Waynesburg borough
The most prevalent vehicle ownership categories in Waynesburg borough are males with 2 vehicles (326, accounting for 52.3%) and females with 2 vehicles (274, making up 49.5%).
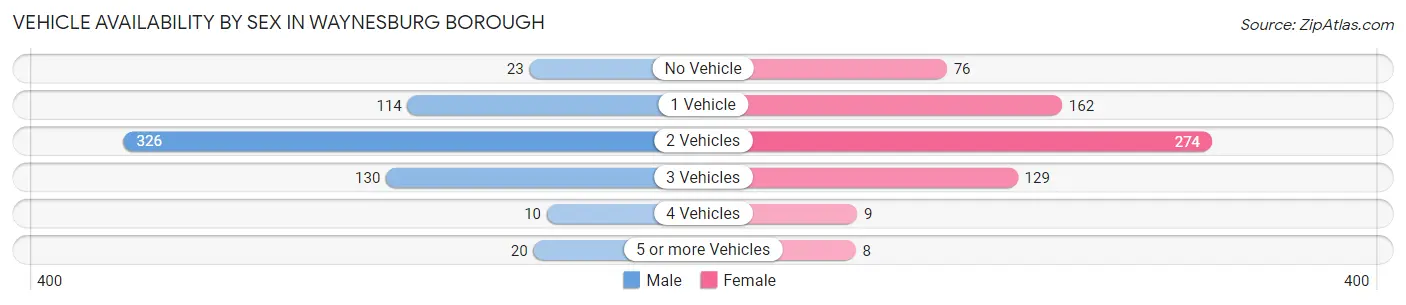
| Vehicles Available | Male | Female |
| No Vehicle | 23 (3.7%) | 76 (11.6%) |
| 1 Vehicle | 114 (18.3%) | 162 (24.6%) |
| 2 Vehicles | 326 (52.3%) | 274 (41.6%) |
| 3 Vehicles | 130 (20.9%) | 129 (19.6%) |
| 4 Vehicles | 10 (1.6%) | 9 (1.4%) |
| 5 or more Vehicles | 20 (3.2%) | 8 (1.2%) |
| Total | 623 (100.0%) | 658 (100.0%) |
Commute Time in Waynesburg borough
The most frequently occuring commute durations in Waynesburg borough are 5 to 9 minutes (276 commuters, 18.2%), 10 to 14 minutes (233 commuters, 15.4%), and 30 to 34 minutes (186 commuters, 12.3%).
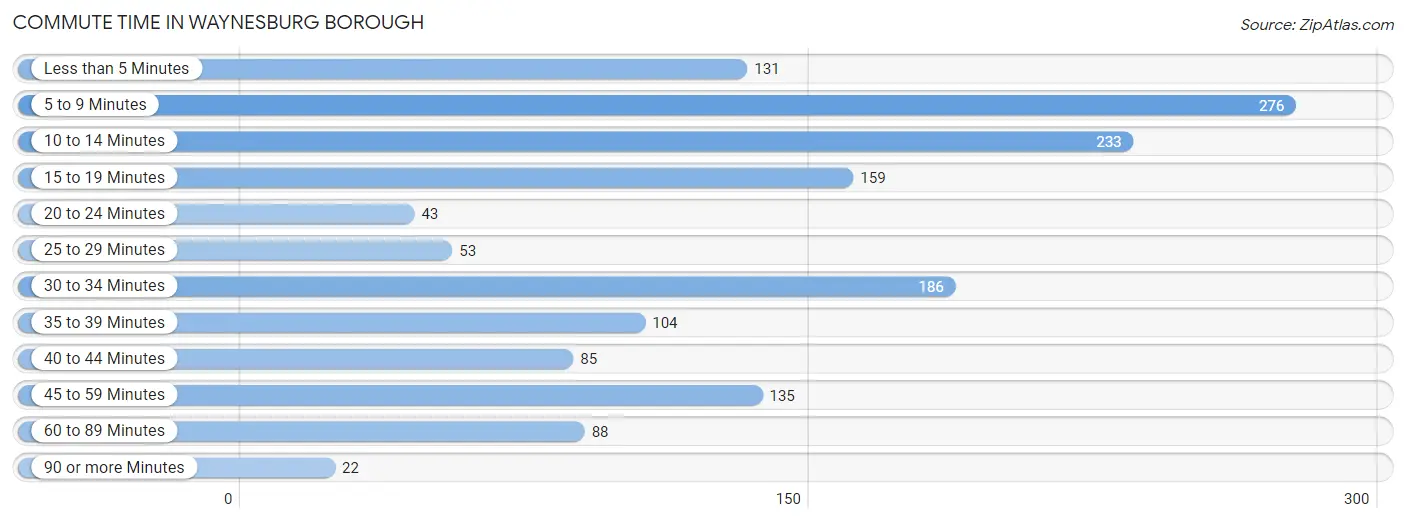
| Commute Time | # Commuters | % Commuters |
| Less than 5 Minutes | 131 | 8.6% |
| 5 to 9 Minutes | 276 | 18.2% |
| 10 to 14 Minutes | 233 | 15.4% |
| 15 to 19 Minutes | 159 | 10.5% |
| 20 to 24 Minutes | 43 | 2.8% |
| 25 to 29 Minutes | 53 | 3.5% |
| 30 to 34 Minutes | 186 | 12.3% |
| 35 to 39 Minutes | 104 | 6.9% |
| 40 to 44 Minutes | 85 | 5.6% |
| 45 to 59 Minutes | 135 | 8.9% |
| 60 to 89 Minutes | 88 | 5.8% |
| 90 or more Minutes | 22 | 1.5% |
Commute Time by Sex in Waynesburg borough
The most common commute times in Waynesburg borough are 10 to 14 minutes (167 commuters, 23.3%) for males and 5 to 9 minutes (159 commuters, 19.9%) for females.
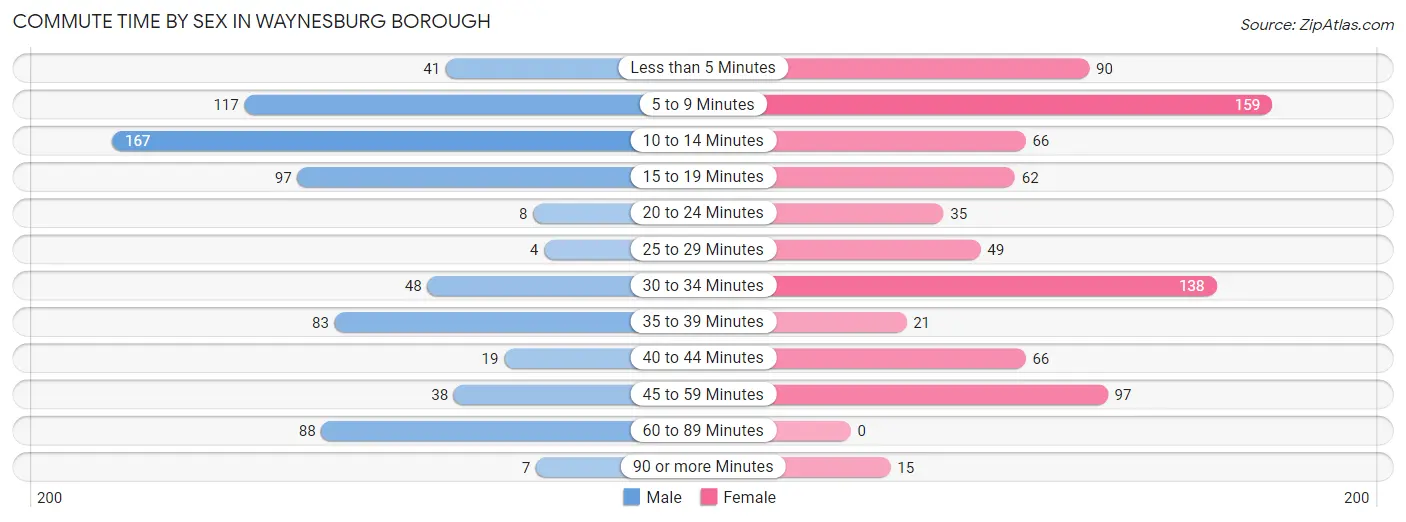
| Commute Time | Male | Female |
| Less than 5 Minutes | 41 (5.7%) | 90 (11.3%) |
| 5 to 9 Minutes | 117 (16.3%) | 159 (19.9%) |
| 10 to 14 Minutes | 167 (23.3%) | 66 (8.3%) |
| 15 to 19 Minutes | 97 (13.5%) | 62 (7.8%) |
| 20 to 24 Minutes | 8 (1.1%) | 35 (4.4%) |
| 25 to 29 Minutes | 4 (0.6%) | 49 (6.1%) |
| 30 to 34 Minutes | 48 (6.7%) | 138 (17.3%) |
| 35 to 39 Minutes | 83 (11.6%) | 21 (2.6%) |
| 40 to 44 Minutes | 19 (2.6%) | 66 (8.3%) |
| 45 to 59 Minutes | 38 (5.3%) | 97 (12.2%) |
| 60 to 89 Minutes | 88 (12.3%) | 0 (0.0%) |
| 90 or more Minutes | 7 (1.0%) | 15 (1.9%) |
Time of Departure to Work by Sex in Waynesburg borough
The most frequent times of departure to work in Waynesburg borough are 4:00 PM to 11:59 PM (120, 16.7%) for males and 6:30 AM to 6:59 AM (119, 14.9%) for females.
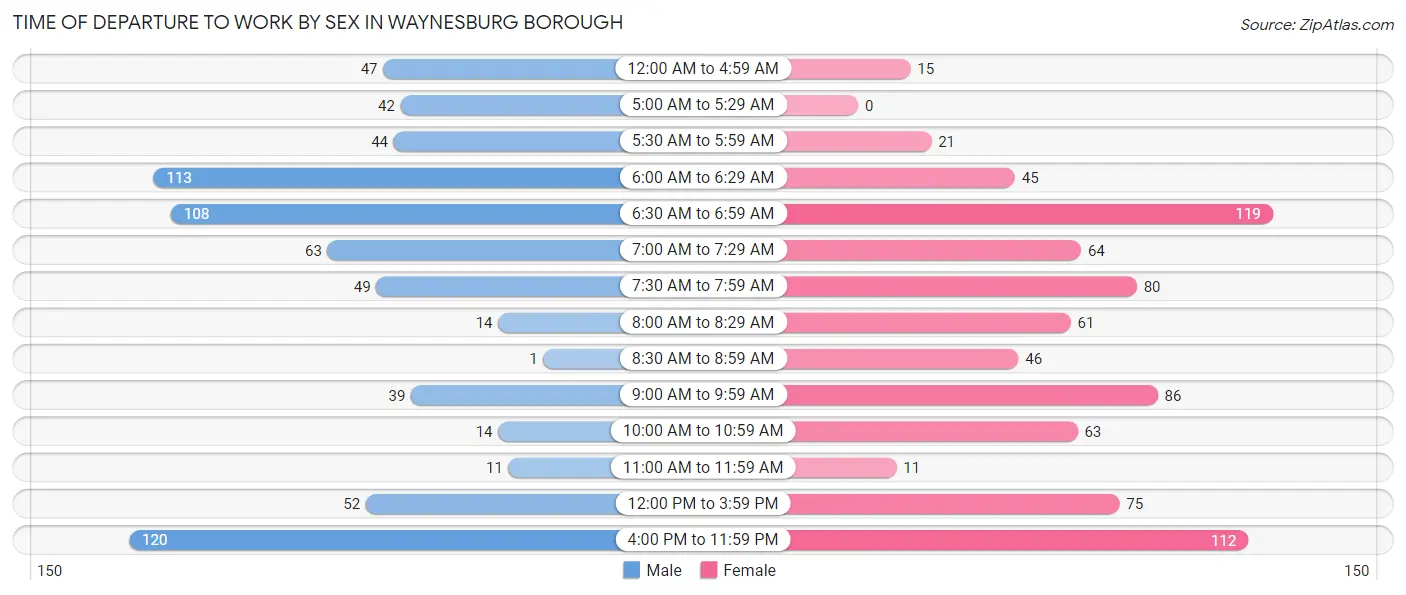
| Time of Departure | Male | Female |
| 12:00 AM to 4:59 AM | 47 (6.6%) | 15 (1.9%) |
| 5:00 AM to 5:29 AM | 42 (5.9%) | 0 (0.0%) |
| 5:30 AM to 5:59 AM | 44 (6.1%) | 21 (2.6%) |
| 6:00 AM to 6:29 AM | 113 (15.8%) | 45 (5.6%) |
| 6:30 AM to 6:59 AM | 108 (15.1%) | 119 (14.9%) |
| 7:00 AM to 7:29 AM | 63 (8.8%) | 64 (8.0%) |
| 7:30 AM to 7:59 AM | 49 (6.8%) | 80 (10.0%) |
| 8:00 AM to 8:29 AM | 14 (1.9%) | 61 (7.6%) |
| 8:30 AM to 8:59 AM | 1 (0.1%) | 46 (5.8%) |
| 9:00 AM to 9:59 AM | 39 (5.4%) | 86 (10.8%) |
| 10:00 AM to 10:59 AM | 14 (1.9%) | 63 (7.9%) |
| 11:00 AM to 11:59 AM | 11 (1.5%) | 11 (1.4%) |
| 12:00 PM to 3:59 PM | 52 (7.2%) | 75 (9.4%) |
| 4:00 PM to 11:59 PM | 120 (16.7%) | 112 (14.0%) |
| Total | 717 (100.0%) | 798 (100.0%) |
Housing Occupancy in Waynesburg borough
Occupancy by Ownership in Waynesburg borough
Of the total 1,353 dwellings in Waynesburg borough, owner-occupied units account for 777 (57.4%), while renter-occupied units make up 576 (42.6%).
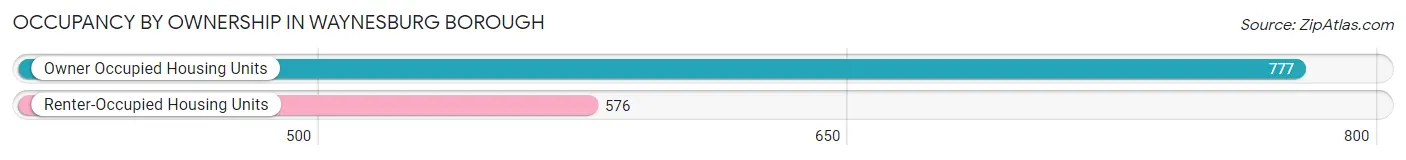
| Occupancy | # Housing Units | % Housing Units |
| Owner Occupied Housing Units | 777 | 57.4% |
| Renter-Occupied Housing Units | 576 | 42.6% |
| Total Occupied Housing Units | 1,353 | 100.0% |
Occupancy by Household Size in Waynesburg borough
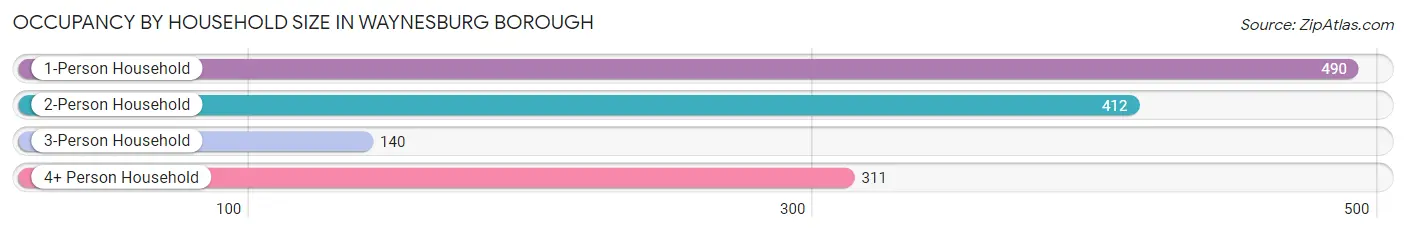
| Household Size | # Housing Units | % Housing Units |
| 1-Person Household | 490 | 36.2% |
| 2-Person Household | 412 | 30.4% |
| 3-Person Household | 140 | 10.3% |
| 4+ Person Household | 311 | 23.0% |
| Total Housing Units | 1,353 | 100.0% |
Occupancy by Ownership by Household Size in Waynesburg borough
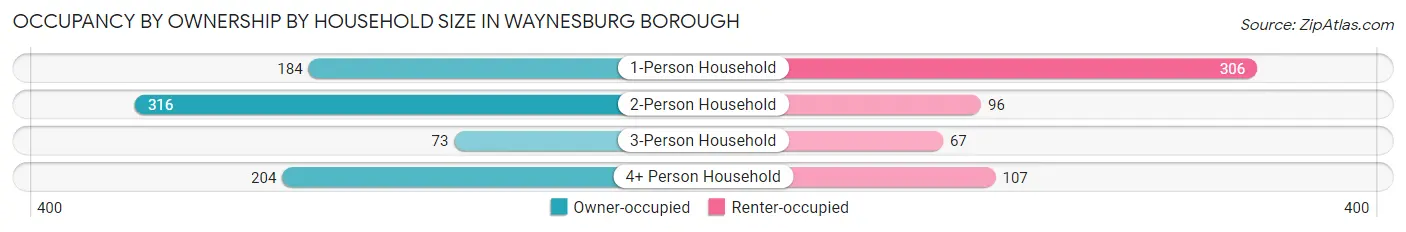
| Household Size | Owner-occupied | Renter-occupied |
| 1-Person Household | 184 (37.6%) | 306 (62.5%) |
| 2-Person Household | 316 (76.7%) | 96 (23.3%) |
| 3-Person Household | 73 (52.1%) | 67 (47.9%) |
| 4+ Person Household | 204 (65.6%) | 107 (34.4%) |
| Total Housing Units | 777 (57.4%) | 576 (42.6%) |
Occupancy by Educational Attainment in Waynesburg borough
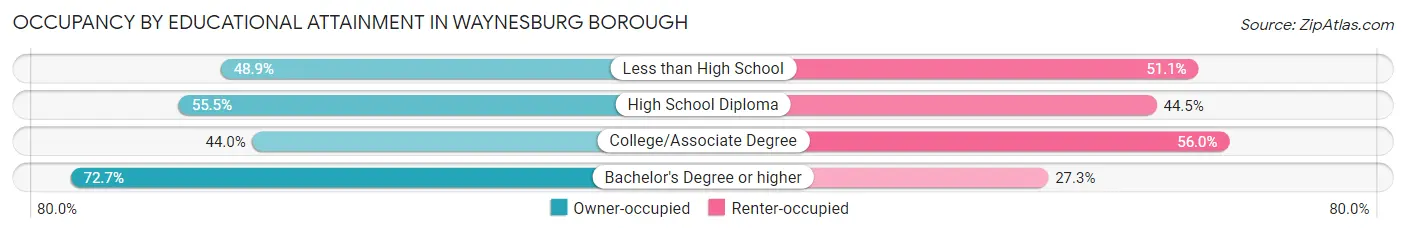
| Household Size | Owner-occupied | Renter-occupied |
| Less than High School | 44 (48.9%) | 46 (51.1%) |
| High School Diploma | 251 (55.5%) | 201 (44.5%) |
| College/Associate Degree | 165 (44.0%) | 210 (56.0%) |
| Bachelor's Degree or higher | 317 (72.7%) | 119 (27.3%) |
Occupancy by Age of Householder in Waynesburg borough
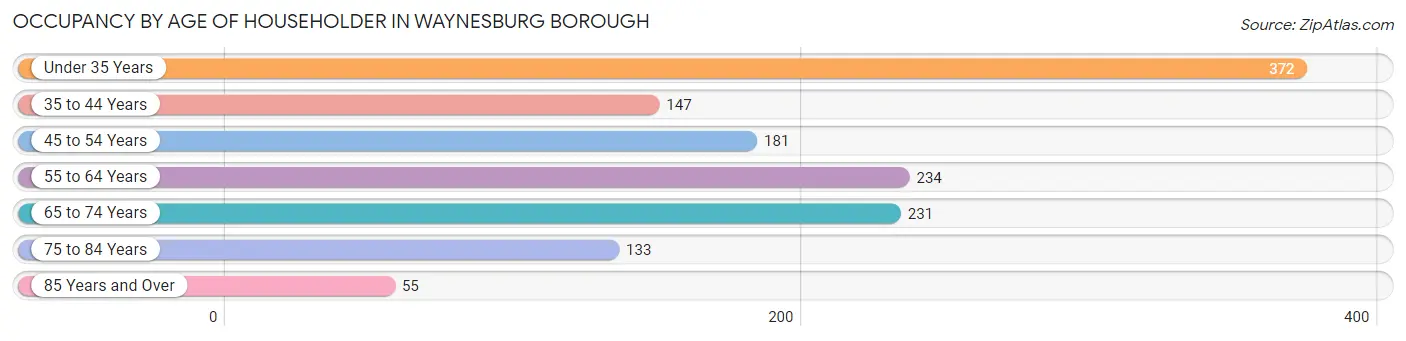
| Age Bracket | # Households | % Households |
| Under 35 Years | 372 | 27.5% |
| 35 to 44 Years | 147 | 10.9% |
| 45 to 54 Years | 181 | 13.4% |
| 55 to 64 Years | 234 | 17.3% |
| 65 to 74 Years | 231 | 17.1% |
| 75 to 84 Years | 133 | 9.8% |
| 85 Years and Over | 55 | 4.1% |
| Total | 1,353 | 100.0% |
Housing Finances in Waynesburg borough
Median Income by Occupancy in Waynesburg borough
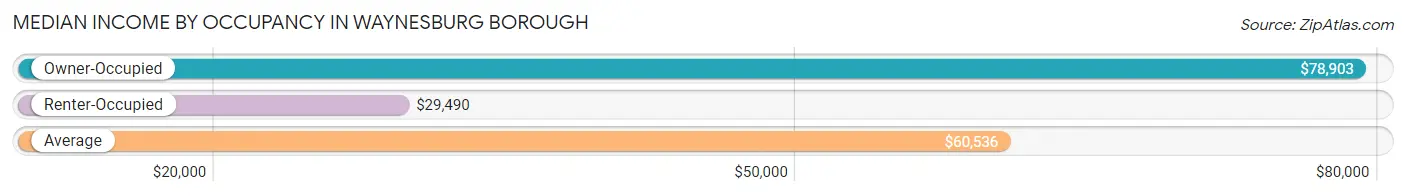
| Occupancy Type | # Households | Median Income |
| Owner-Occupied | 777 (57.4%) | $78,903 |
| Renter-Occupied | 576 (42.6%) | $29,490 |
| Average | 1,353 (100.0%) | $60,536 |
Occupancy by Householder Income Bracket in Waynesburg borough
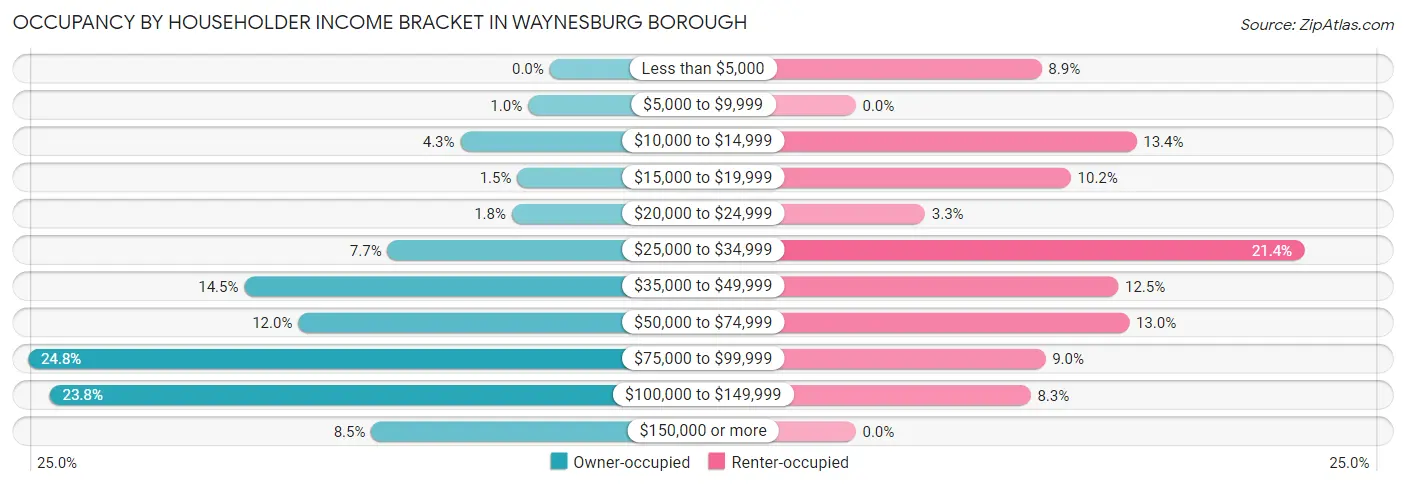
| Income Bracket | Owner-occupied | Renter-occupied |
| Less than $5,000 | 0 (0.0%) | 51 (8.8%) |
| $5,000 to $9,999 | 8 (1.0%) | 0 (0.0%) |
| $10,000 to $14,999 | 33 (4.3%) | 77 (13.4%) |
| $15,000 to $19,999 | 12 (1.5%) | 59 (10.2%) |
| $20,000 to $24,999 | 14 (1.8%) | 19 (3.3%) |
| $25,000 to $34,999 | 60 (7.7%) | 123 (21.3%) |
| $35,000 to $49,999 | 113 (14.5%) | 72 (12.5%) |
| $50,000 to $74,999 | 93 (12.0%) | 75 (13.0%) |
| $75,000 to $99,999 | 193 (24.8%) | 52 (9.0%) |
| $100,000 to $149,999 | 185 (23.8%) | 48 (8.3%) |
| $150,000 or more | 66 (8.5%) | 0 (0.0%) |
| Total | 777 (100.0%) | 576 (100.0%) |
Monthly Housing Cost Tiers in Waynesburg borough
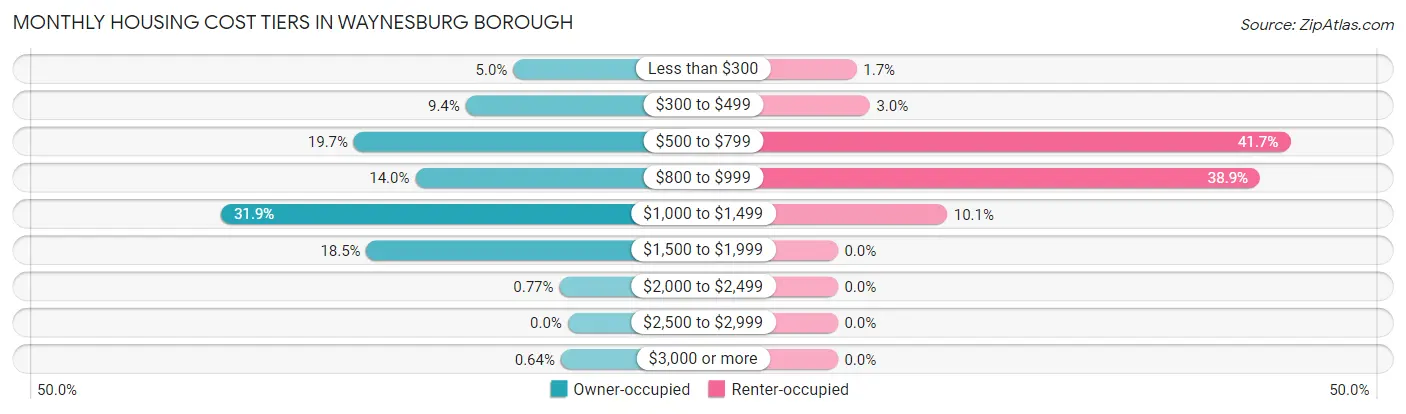
| Monthly Cost | Owner-occupied | Renter-occupied |
| Less than $300 | 39 (5.0%) | 10 (1.7%) |
| $300 to $499 | 73 (9.4%) | 17 (2.9%) |
| $500 to $799 | 153 (19.7%) | 240 (41.7%) |
| $800 to $999 | 109 (14.0%) | 224 (38.9%) |
| $1,000 to $1,499 | 248 (31.9%) | 58 (10.1%) |
| $1,500 to $1,999 | 144 (18.5%) | 0 (0.0%) |
| $2,000 to $2,499 | 6 (0.8%) | 0 (0.0%) |
| $2,500 to $2,999 | 0 (0.0%) | 0 (0.0%) |
| $3,000 or more | 5 (0.6%) | 0 (0.0%) |
| Total | 777 (100.0%) | 576 (100.0%) |
Physical Housing Characteristics in Waynesburg borough
Housing Structures in Waynesburg borough
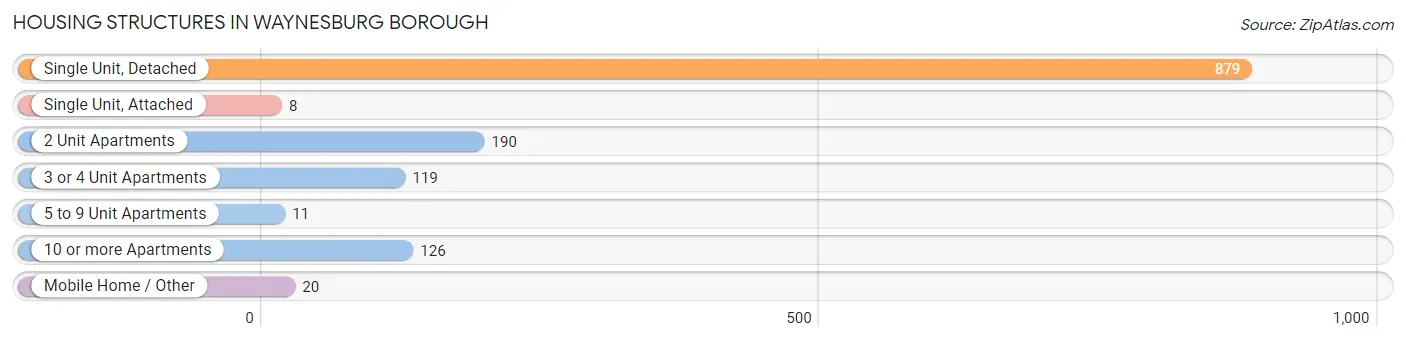
| Structure Type | # Housing Units | % Housing Units |
| Single Unit, Detached | 879 | 65.0% |
| Single Unit, Attached | 8 | 0.6% |
| 2 Unit Apartments | 190 | 14.0% |
| 3 or 4 Unit Apartments | 119 | 8.8% |
| 5 to 9 Unit Apartments | 11 | 0.8% |
| 10 or more Apartments | 126 | 9.3% |
| Mobile Home / Other | 20 | 1.5% |
| Total | 1,353 | 100.0% |
Housing Structures by Occupancy in Waynesburg borough
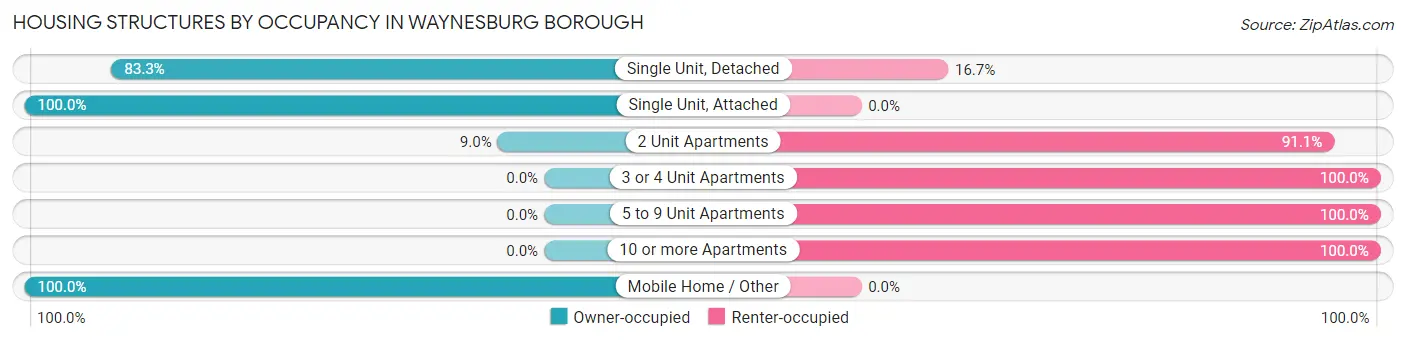
| Structure Type | Owner-occupied | Renter-occupied |
| Single Unit, Detached | 732 (83.3%) | 147 (16.7%) |
| Single Unit, Attached | 8 (100.0%) | 0 (0.0%) |
| 2 Unit Apartments | 17 (8.9%) | 173 (91.0%) |
| 3 or 4 Unit Apartments | 0 (0.0%) | 119 (100.0%) |
| 5 to 9 Unit Apartments | 0 (0.0%) | 11 (100.0%) |
| 10 or more Apartments | 0 (0.0%) | 126 (100.0%) |
| Mobile Home / Other | 20 (100.0%) | 0 (0.0%) |
| Total | 777 (57.4%) | 576 (42.6%) |
Housing Structures by Number of Rooms in Waynesburg borough
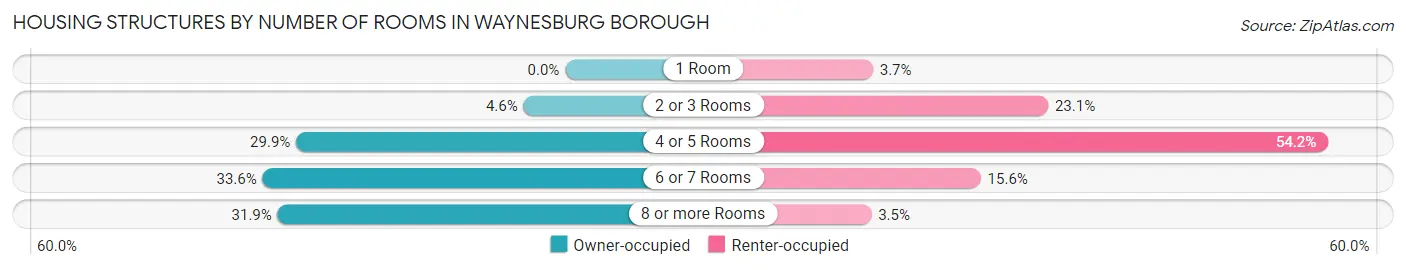
| Number of Rooms | Owner-occupied | Renter-occupied |
| 1 Room | 0 (0.0%) | 21 (3.6%) |
| 2 or 3 Rooms | 36 (4.6%) | 133 (23.1%) |
| 4 or 5 Rooms | 232 (29.9%) | 312 (54.2%) |
| 6 or 7 Rooms | 261 (33.6%) | 90 (15.6%) |
| 8 or more Rooms | 248 (31.9%) | 20 (3.5%) |
| Total | 777 (100.0%) | 576 (100.0%) |
Housing Structure by Heating Type in Waynesburg borough
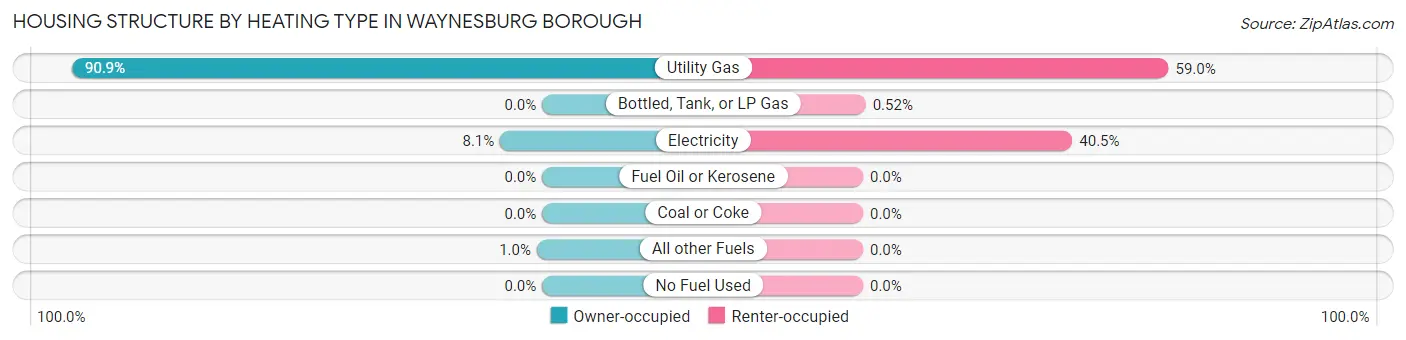
| Heating Type | Owner-occupied | Renter-occupied |
| Utility Gas | 706 (90.9%) | 340 (59.0%) |
| Bottled, Tank, or LP Gas | 0 (0.0%) | 3 (0.5%) |
| Electricity | 63 (8.1%) | 233 (40.5%) |
| Fuel Oil or Kerosene | 0 (0.0%) | 0 (0.0%) |
| Coal or Coke | 0 (0.0%) | 0 (0.0%) |
| All other Fuels | 8 (1.0%) | 0 (0.0%) |
| No Fuel Used | 0 (0.0%) | 0 (0.0%) |
| Total | 777 (100.0%) | 576 (100.0%) |
Household Vehicle Usage in Waynesburg borough
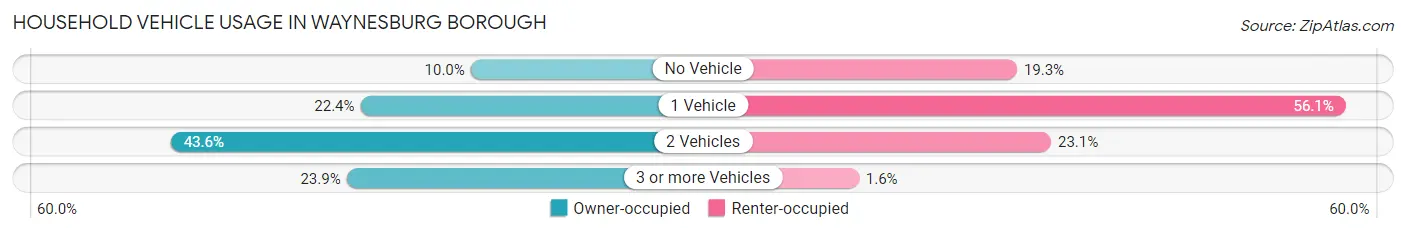
| Vehicles per Household | Owner-occupied | Renter-occupied |
| No Vehicle | 78 (10.0%) | 111 (19.3%) |
| 1 Vehicle | 174 (22.4%) | 323 (56.1%) |
| 2 Vehicles | 339 (43.6%) | 133 (23.1%) |
| 3 or more Vehicles | 186 (23.9%) | 9 (1.6%) |
| Total | 777 (100.0%) | 576 (100.0%) |
Real Estate & Mortgages in Waynesburg borough
Real Estate and Mortgage Overview in Waynesburg borough
| Characteristic | Without Mortgage | With Mortgage |
| Housing Units | 258 | 519 |
| Median Property Value | $114,400 | $150,500 |
| Median Household Income | $78,125 | $27 |
| Monthly Housing Costs | $546 | $5 |
| Real Estate Taxes | $2,558 | $0 |
Property Value by Mortgage Status in Waynesburg borough
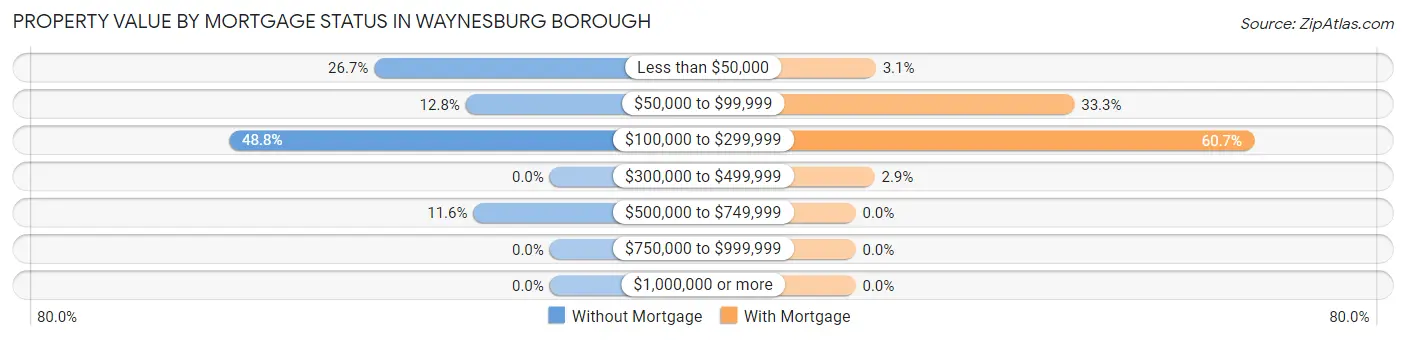
| Property Value | Without Mortgage | With Mortgage |
| Less than $50,000 | 69 (26.7%) | 16 (3.1%) |
| $50,000 to $99,999 | 33 (12.8%) | 173 (33.3%) |
| $100,000 to $299,999 | 126 (48.8%) | 315 (60.7%) |
| $300,000 to $499,999 | 0 (0.0%) | 15 (2.9%) |
| $500,000 to $749,999 | 30 (11.6%) | 0 (0.0%) |
| $750,000 to $999,999 | 0 (0.0%) | 0 (0.0%) |
| $1,000,000 or more | 0 (0.0%) | 0 (0.0%) |
| Total | 258 (100.0%) | 519 (100.0%) |
Household Income by Mortgage Status in Waynesburg borough
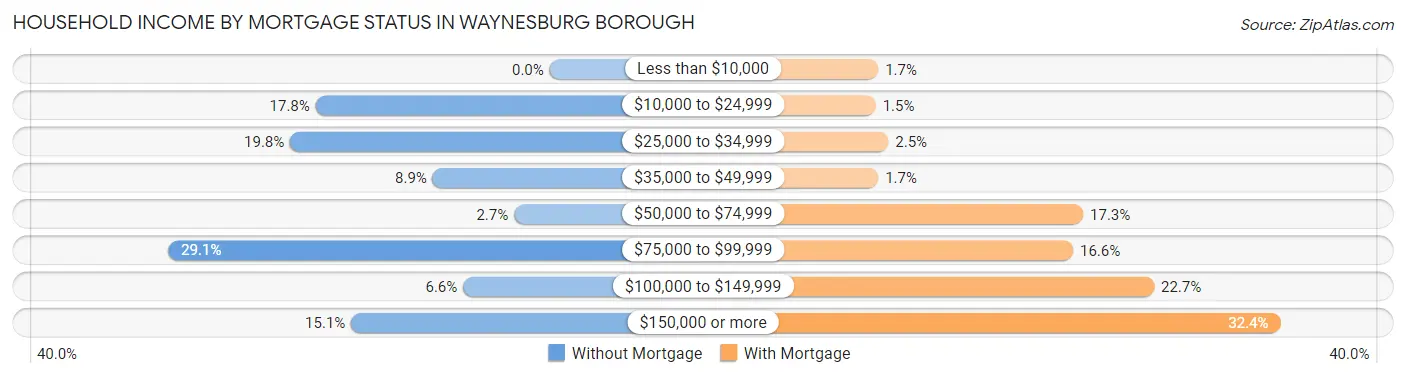
| Household Income | Without Mortgage | With Mortgage |
| Less than $10,000 | 0 (0.0%) | 9 (1.7%) |
| $10,000 to $24,999 | 46 (17.8%) | 8 (1.5%) |
| $25,000 to $34,999 | 51 (19.8%) | 13 (2.5%) |
| $35,000 to $49,999 | 23 (8.9%) | 9 (1.7%) |
| $50,000 to $74,999 | 7 (2.7%) | 90 (17.3%) |
| $75,000 to $99,999 | 75 (29.1%) | 86 (16.6%) |
| $100,000 to $149,999 | 17 (6.6%) | 118 (22.7%) |
| $150,000 or more | 39 (15.1%) | 168 (32.4%) |
| Total | 258 (100.0%) | 519 (100.0%) |
Property Value to Household Income Ratio in Waynesburg borough
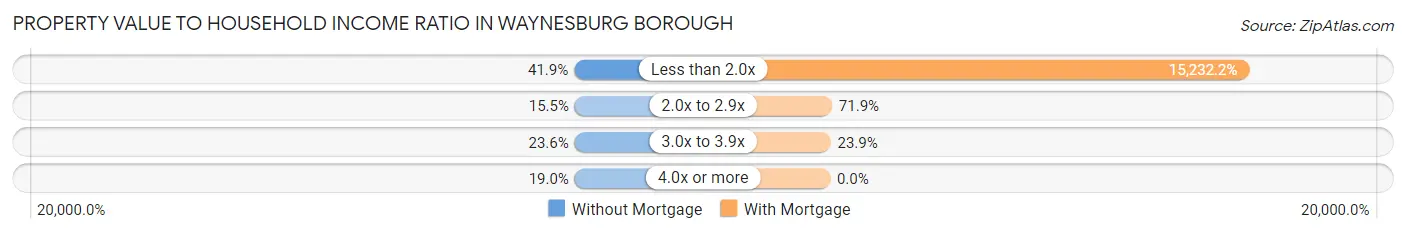
| Value-to-Income Ratio | Without Mortgage | With Mortgage |
| Less than 2.0x | 108 (41.9%) | 79,055 (15,232.2%) |
| 2.0x to 2.9x | 40 (15.5%) | 373 (71.9%) |
| 3.0x to 3.9x | 61 (23.6%) | 124 (23.9%) |
| 4.0x or more | 49 (19.0%) | 0 (0.0%) |
| Total | 258 (100.0%) | 519 (100.0%) |
Real Estate Taxes by Mortgage Status in Waynesburg borough
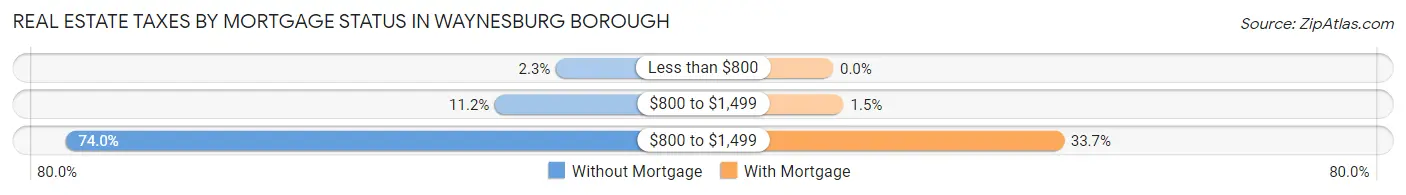
| Property Taxes | Without Mortgage | With Mortgage |
| Less than $800 | 6 (2.3%) | 0 (0.0%) |
| $800 to $1,499 | 29 (11.2%) | 8 (1.5%) |
| $800 to $1,499 | 191 (74.0%) | 175 (33.7%) |
| Total | 258 (100.0%) | 519 (100.0%) |
Health & Disability in Waynesburg borough
Health Insurance Coverage by Age in Waynesburg borough
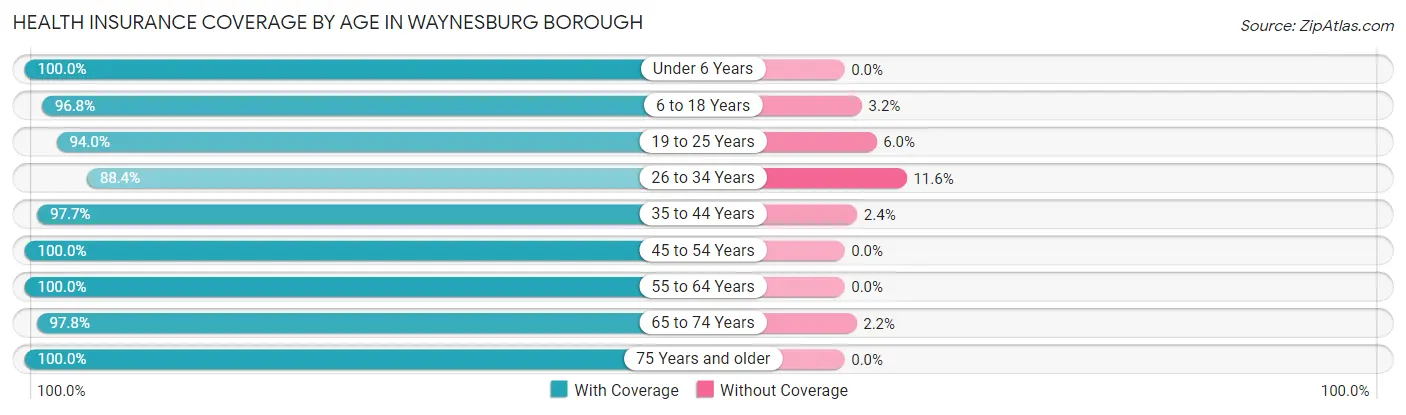
| Age Bracket | With Coverage | Without Coverage |
| Under 6 Years | 335 (100.0%) | 0 (0.0%) |
| 6 to 18 Years | 688 (96.8%) | 23 (3.2%) |
| 19 to 25 Years | 962 (94.0%) | 61 (6.0%) |
| 26 to 34 Years | 320 (88.4%) | 42 (11.6%) |
| 35 to 44 Years | 333 (97.7%) | 8 (2.4%) |
| 45 to 54 Years | 298 (100.0%) | 0 (0.0%) |
| 55 to 64 Years | 316 (100.0%) | 0 (0.0%) |
| 65 to 74 Years | 351 (97.8%) | 8 (2.2%) |
| 75 Years and older | 209 (100.0%) | 0 (0.0%) |
| Total | 3,812 (96.4%) | 142 (3.6%) |
Health Insurance Coverage by Citizenship Status in Waynesburg borough
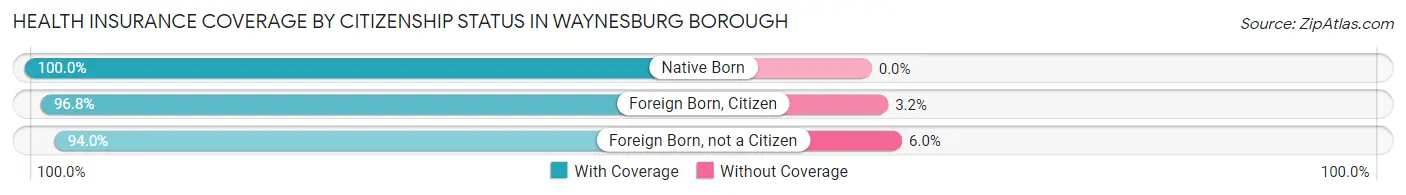
| Citizenship Status | With Coverage | Without Coverage |
| Native Born | 335 (100.0%) | 0 (0.0%) |
| Foreign Born, Citizen | 688 (96.8%) | 23 (3.2%) |
| Foreign Born, not a Citizen | 962 (94.0%) | 61 (6.0%) |
Health Insurance Coverage by Household Income in Waynesburg borough
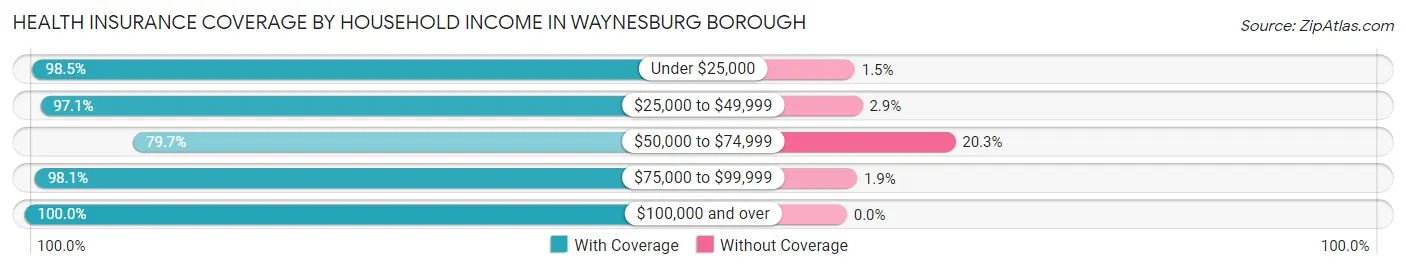
| Household Income | With Coverage | Without Coverage |
| Under $25,000 | 524 (98.5%) | 8 (1.5%) |
| $25,000 to $49,999 | 629 (97.1%) | 19 (2.9%) |
| $50,000 to $74,999 | 294 (79.7%) | 75 (20.3%) |
| $75,000 to $99,999 | 568 (98.1%) | 11 (1.9%) |
| $100,000 and over | 809 (100.0%) | 0 (0.0%) |
Public vs Private Health Insurance Coverage by Age in Waynesburg borough
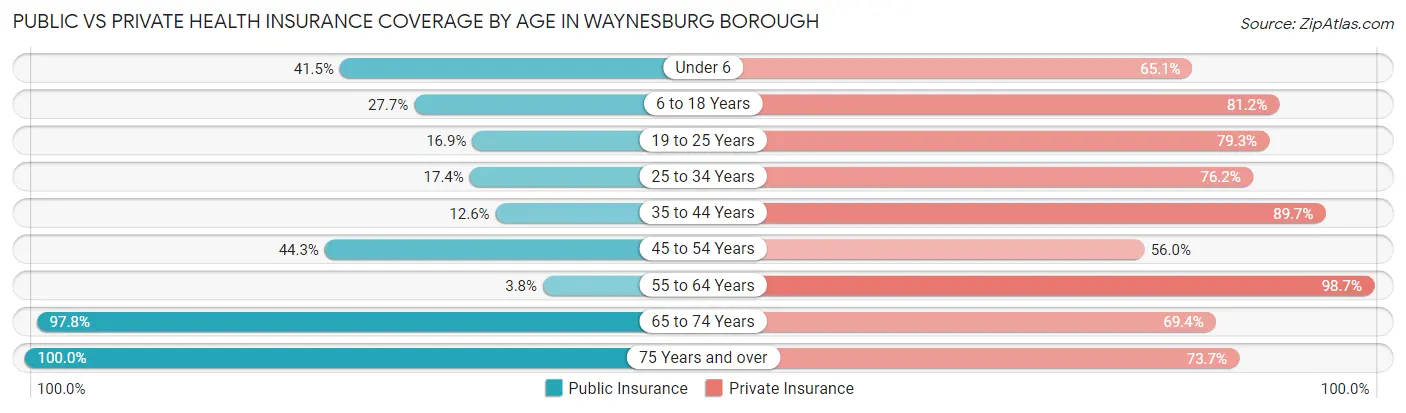
| Age Bracket | Public Insurance | Private Insurance |
| Under 6 | 139 (41.5%) | 218 (65.1%) |
| 6 to 18 Years | 197 (27.7%) | 577 (81.1%) |
| 19 to 25 Years | 173 (16.9%) | 811 (79.3%) |
| 25 to 34 Years | 63 (17.4%) | 276 (76.2%) |
| 35 to 44 Years | 43 (12.6%) | 306 (89.7%) |
| 45 to 54 Years | 132 (44.3%) | 167 (56.0%) |
| 55 to 64 Years | 12 (3.8%) | 312 (98.7%) |
| 65 to 74 Years | 351 (97.8%) | 249 (69.4%) |
| 75 Years and over | 209 (100.0%) | 154 (73.7%) |
| Total | 1,319 (33.4%) | 3,070 (77.6%) |
Disability Status by Sex by Age in Waynesburg borough
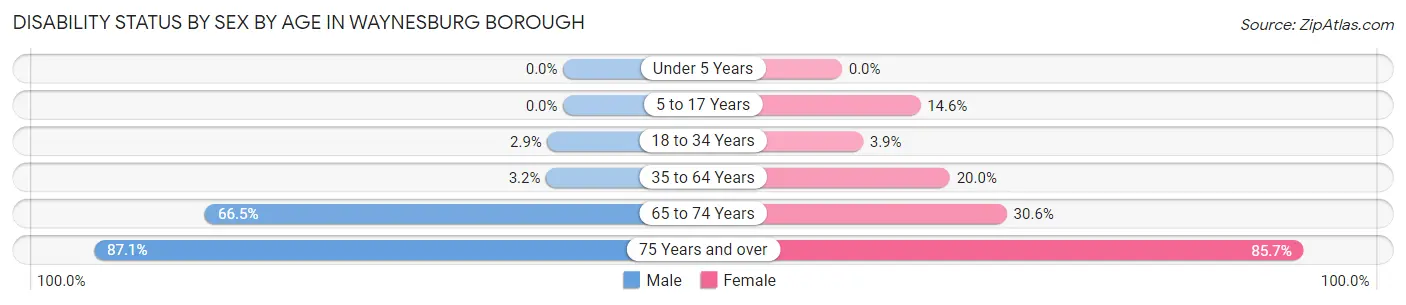
| Age Bracket | Male | Female |
| Under 5 Years | 0 (0.0%) | 0 (0.0%) |
| 5 to 17 Years | 0 (0.0%) | 31 (14.5%) |
| 18 to 34 Years | 22 (2.9%) | 37 (3.9%) |
| 35 to 64 Years | 16 (3.2%) | 90 (20.0%) |
| 65 to 74 Years | 117 (66.5%) | 56 (30.6%) |
| 75 Years and over | 54 (87.1%) | 126 (85.7%) |
Disability Class by Sex by Age in Waynesburg borough
Disability Class: Hearing Difficulty
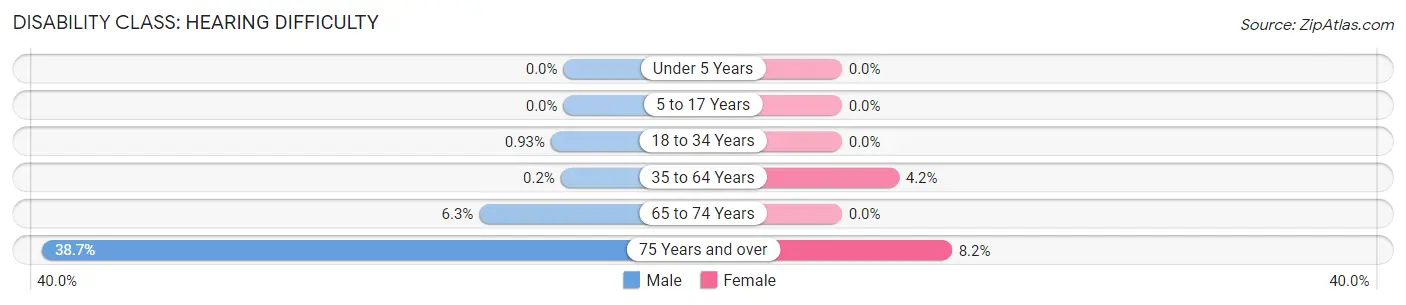
| Age Bracket | Male | Female |
| Under 5 Years | 0 (0.0%) | 0 (0.0%) |
| 5 to 17 Years | 0 (0.0%) | 0 (0.0%) |
| 18 to 34 Years | 7 (0.9%) | 0 (0.0%) |
| 35 to 64 Years | 1 (0.2%) | 19 (4.2%) |
| 65 to 74 Years | 11 (6.2%) | 0 (0.0%) |
| 75 Years and over | 24 (38.7%) | 12 (8.2%) |
Disability Class: Vision Difficulty
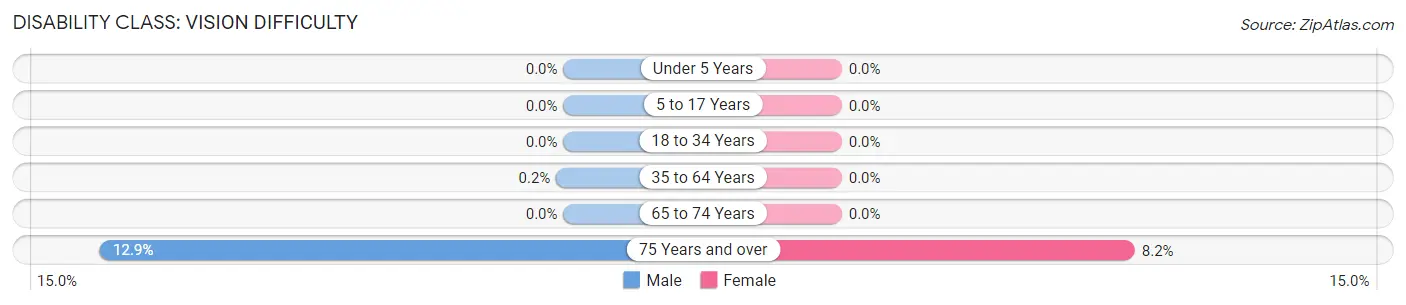
| Age Bracket | Male | Female |
| Under 5 Years | 0 (0.0%) | 0 (0.0%) |
| 5 to 17 Years | 0 (0.0%) | 0 (0.0%) |
| 18 to 34 Years | 0 (0.0%) | 0 (0.0%) |
| 35 to 64 Years | 1 (0.2%) | 0 (0.0%) |
| 65 to 74 Years | 0 (0.0%) | 0 (0.0%) |
| 75 Years and over | 8 (12.9%) | 12 (8.2%) |
Disability Class: Cognitive Difficulty
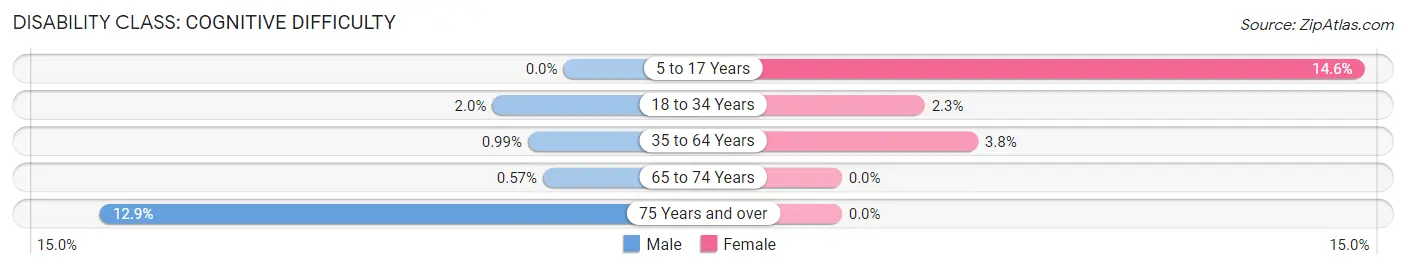
| Age Bracket | Male | Female |
| 5 to 17 Years | 0 (0.0%) | 31 (14.5%) |
| 18 to 34 Years | 15 (2.0%) | 22 (2.3%) |
| 35 to 64 Years | 5 (1.0%) | 17 (3.8%) |
| 65 to 74 Years | 1 (0.6%) | 0 (0.0%) |
| 75 Years and over | 8 (12.9%) | 0 (0.0%) |
Disability Class: Ambulatory Difficulty
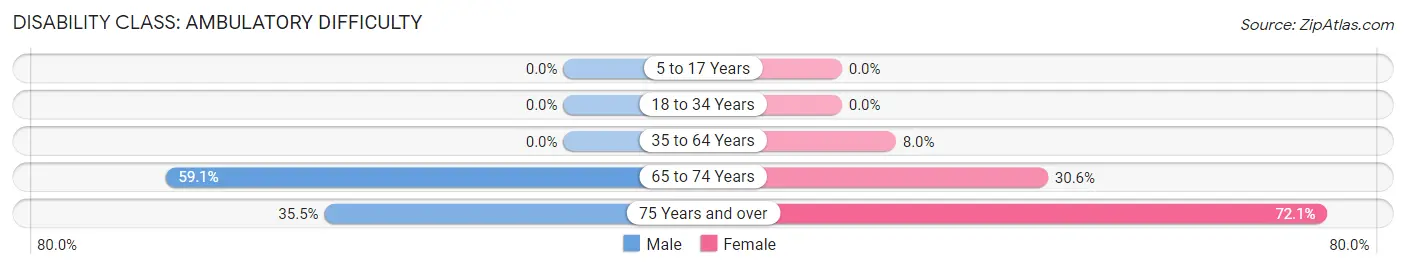
| Age Bracket | Male | Female |
| 5 to 17 Years | 0 (0.0%) | 0 (0.0%) |
| 18 to 34 Years | 0 (0.0%) | 0 (0.0%) |
| 35 to 64 Years | 0 (0.0%) | 36 (8.0%) |
| 65 to 74 Years | 104 (59.1%) | 56 (30.6%) |
| 75 Years and over | 22 (35.5%) | 106 (72.1%) |
Disability Class: Self-Care Difficulty
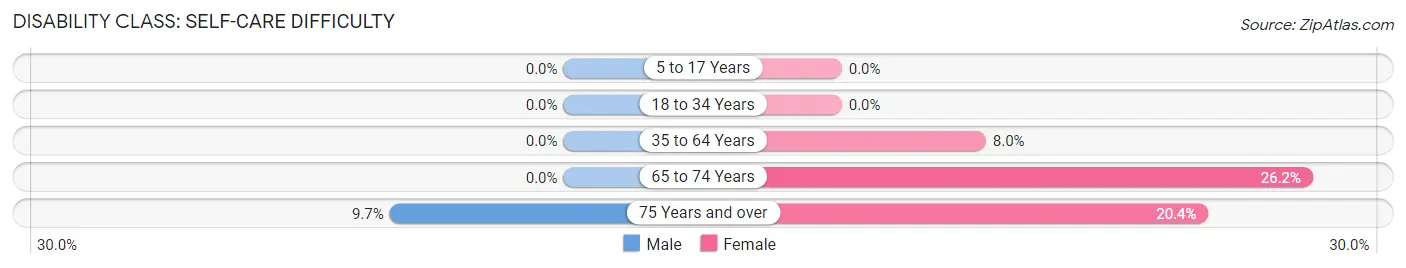
| Age Bracket | Male | Female |
| 5 to 17 Years | 0 (0.0%) | 0 (0.0%) |
| 18 to 34 Years | 0 (0.0%) | 0 (0.0%) |
| 35 to 64 Years | 0 (0.0%) | 36 (8.0%) |
| 65 to 74 Years | 0 (0.0%) | 48 (26.2%) |
| 75 Years and over | 6 (9.7%) | 30 (20.4%) |
Technology Access in Waynesburg borough
Computing Device Access in Waynesburg borough
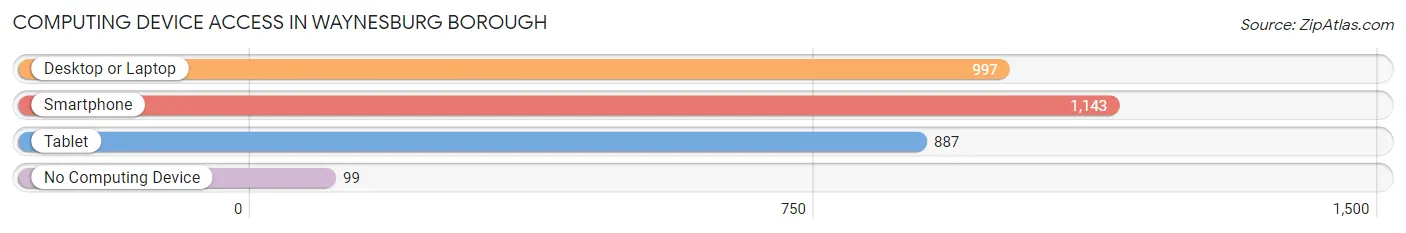
| Device Type | # Households | % Households |
| Desktop or Laptop | 997 | 73.7% |
| Smartphone | 1,143 | 84.5% |
| Tablet | 887 | 65.6% |
| No Computing Device | 99 | 7.3% |
| Total | 1,353 | 100.0% |
Internet Access in Waynesburg borough
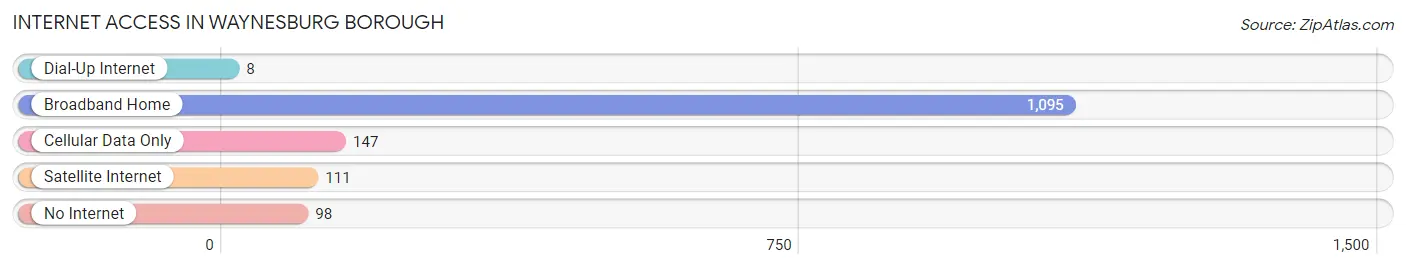
| Internet Type | # Households | % Households |
| Dial-Up Internet | 8 | 0.6% |
| Broadband Home | 1,095 | 80.9% |
| Cellular Data Only | 147 | 10.9% |
| Satellite Internet | 111 | 8.2% |
| No Internet | 98 | 7.2% |
| Total | 1,353 | 100.0% |
Waynesburg borough Summary
Waynesburg Borough is a small borough located in Greene County, Pennsylvania. It is situated in the southwestern corner of the state, approximately 50 miles south of Pittsburgh. The borough is home to a population of approximately 4,000 people, and is the county seat of Greene County.
History
Waynesburg Borough was founded in 1796 by William Crawford, a Revolutionary War veteran. The town was named after General Anthony Wayne, who was a hero of the Revolutionary War. The town was originally a farming community, but soon developed into a center of commerce and industry. The first industry in the area was a tannery, which was established in 1802. This was followed by a gristmill, a sawmill, and a distillery.
In 1820, the first post office was established in Waynesburg. The town was incorporated as a borough in 1832. During the 19th century, the town grew rapidly, and by the end of the century, it had become a major center of commerce and industry. The town was home to several factories, including a glassworks, a brickyard, and a foundry.
Geography
Waynesburg Borough is located in the southwestern corner of Pennsylvania, approximately 50 miles south of Pittsburgh. The borough is situated in the Appalachian Plateau region of the state, and is surrounded by rolling hills and forests. The borough is located at the confluence of the Monongahela and Cheat Rivers. The borough covers an area of 1.3 square miles, and has a population density of 3,000 people per square mile.
Economy
The economy of Waynesburg Borough is largely based on agriculture and manufacturing. The borough is home to several farms, which produce a variety of crops, including corn, soybeans, and hay. The borough is also home to several factories, which produce a variety of products, including glass, bricks, and metal products.
The borough is also home to several businesses, including restaurants, retail stores, and professional services. The borough is home to several educational institutions, including Waynesburg University and Waynesburg Central High School.
Demographics
As of the 2010 census, the population of Waynesburg Borough was 4,176. The racial makeup of the borough was 97.3% White, 0.9% African American, 0.2% Native American, 0.4% Asian, and 0.9% from other races. Hispanic or Latino of any race were 1.2% of the population.
The median household income in the borough was $37,917, and the median family income was $45,938. The per capita income in the borough was $19,945. Approximately 16.2% of the population was below the poverty line.
Conclusion
Waynesburg Borough is a small borough located in Greene County, Pennsylvania. It is situated in the southwestern corner of the state, approximately 50 miles south of Pittsburgh. The borough is home to a population of approximately 4,000 people, and is the county seat of Greene County. The economy of Waynesburg Borough is largely based on agriculture and manufacturing, and the borough is home to several businesses, including restaurants, retail stores, and professional services. The racial makeup of the borough is predominantly White, with a small percentage of African American, Native American, Asian, and other races. The median household income in the borough is $37,917, and the per capita income is $19,945.
Common Questions
What is Per Capita Income in Waynesburg borough?
Per Capita income in Waynesburg borough is $23,594.
What is the Median Family Income in Waynesburg borough?
Median Family Income in Waynesburg borough is $78,125.
What is the Median Household income in Waynesburg borough?
Median Household Income in Waynesburg borough is $60,536.
What is Income or Wage Gap in Waynesburg borough?
Income or Wage Gap in Waynesburg borough is 69.9%.
Women in Waynesburg borough earn 30.1 cents for every dollar earned by a man.
What is Inequality or Gini Index in Waynesburg borough?
Inequality or Gini Index in Waynesburg borough is 0.39.
What is the Total Population of Waynesburg borough?
Total Population of Waynesburg borough is 3,954.
What is the Total Male Population of Waynesburg borough?
Total Male Population of Waynesburg borough is 1,823.
What is the Total Female Population of Waynesburg borough?
Total Female Population of Waynesburg borough is 2,131.
What is the Ratio of Males per 100 Females in Waynesburg borough?
There are 85.55 Males per 100 Females in Waynesburg borough.
What is the Ratio of Females per 100 Males in Waynesburg borough?
There are 116.90 Females per 100 Males in Waynesburg borough.
What is the Median Population Age in Waynesburg borough?
Median Population Age in Waynesburg borough is 24.2 Years.
What is the Average Family Size in Waynesburg borough
Average Family Size in Waynesburg borough is 2.9 People.
What is the Average Household Size in Waynesburg borough
Average Household Size in Waynesburg borough is 2.2 People.
How Large is the Labor Force in Waynesburg borough?
There are 1,834 People in the Labor Forcein in Waynesburg borough.
What is the Percentage of People in the Labor Force in Waynesburg borough?
56.7% of People are in the Labor Force in Waynesburg borough.
What is the Unemployment Rate in Waynesburg borough?
Unemployment Rate in Waynesburg borough is 6.2%.