Union Deposit, PA Map & Demographics
Union Deposit Map
Union Deposit Overview
$32,540
PER CAPITA INCOME
$130,662
AVG FAMILY INCOME
30.6%
WAGE / INCOME GAP [ % ]
69.4¢/ $1
WAGE / INCOME GAP [ $ ]
0.30
INEQUALITY / GINI INDEX
440
TOTAL POPULATION
218
MALE POPULATION
222
FEMALE POPULATION
98.20
MALES / 100 FEMALES
101.83
FEMALES / 100 MALES
37.3
MEDIAN AGE
3.5
AVG FAMILY SIZE
2.6
AVG HOUSEHOLD SIZE
255
LABOR FORCE [ PEOPLE ]
78.0%
PERCENT IN LABOR FORCE
Income in Union Deposit
Income Overview in Union Deposit
| Characteristic | Number | Measure |
| Per Capita Income | 440 | $32,540 |
| Median Family Income | 105 | $130,662 |
| Mean Family Income | 105 | $107,864 |
| Median Household Income | 168 | $0 |
| Mean Household Income | 168 | $86,288 |
| Income Deficit | 105 | $0 |
| Wage / Income Gap (%) | 440 | 30.57% |
| Wage / Income Gap ($) | 440 | 69.43¢ per $1 |
| Gini / Inequality Index | 440 | 0.30 |
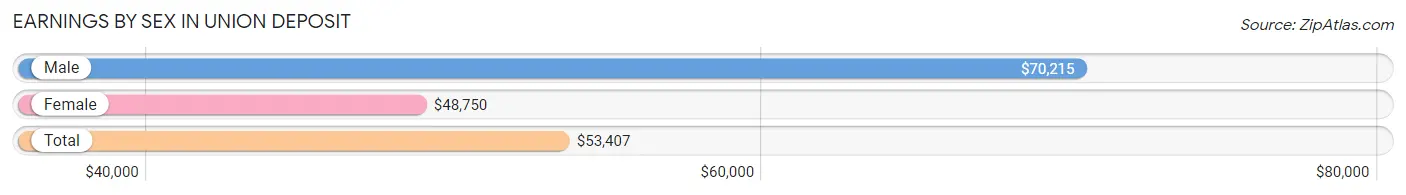
Earnings by Sex in Union Deposit
Average Earnings in Union Deposit are $53,407, $70,215 for men and $48,750 for women, a difference of 30.6%.
| Sex | Number | Average Earnings |
| Male | 117 (45.9%) | $70,215 |
| Female | 138 (54.1%) | $48,750 |
| Total | 255 (100.0%) | $53,407 |
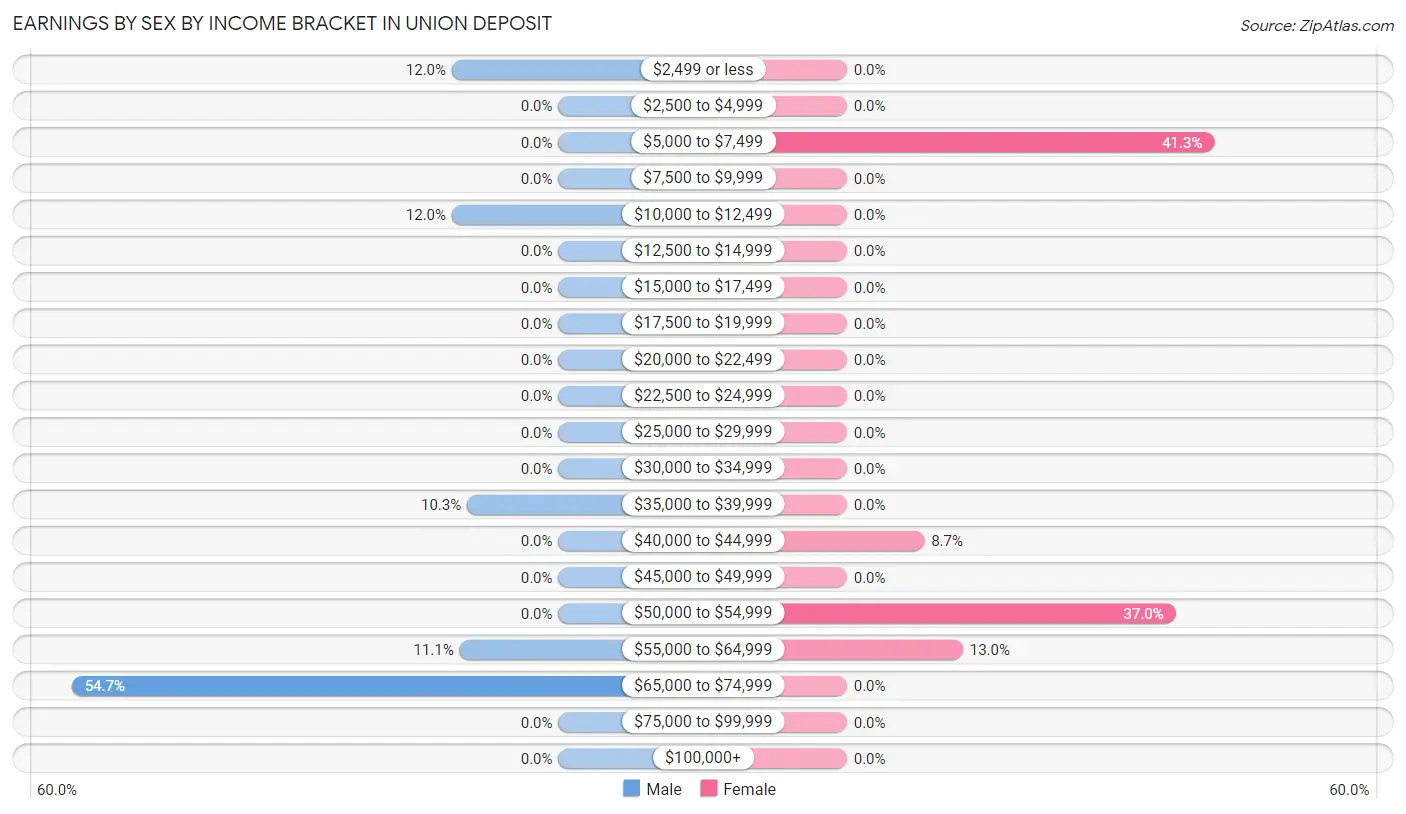
Earnings by Sex by Income Bracket in Union Deposit
The most common earnings brackets in Union Deposit are $65,000 to $74,999 for men (64 | 54.7%) and $5,000 to $7,499 for women (57 | 41.3%).
| Income | Male | Female |
| $2,499 or less | 14 (12.0%) | 0 (0.0%) |
| $2,500 to $4,999 | 0 (0.0%) | 0 (0.0%) |
| $5,000 to $7,499 | 0 (0.0%) | 57 (41.3%) |
| $7,500 to $9,999 | 0 (0.0%) | 0 (0.0%) |
| $10,000 to $12,499 | 14 (12.0%) | 0 (0.0%) |
| $12,500 to $14,999 | 0 (0.0%) | 0 (0.0%) |
| $15,000 to $17,499 | 0 (0.0%) | 0 (0.0%) |
| $17,500 to $19,999 | 0 (0.0%) | 0 (0.0%) |
| $20,000 to $22,499 | 0 (0.0%) | 0 (0.0%) |
| $22,500 to $24,999 | 0 (0.0%) | 0 (0.0%) |
| $25,000 to $29,999 | 0 (0.0%) | 0 (0.0%) |
| $30,000 to $34,999 | 0 (0.0%) | 0 (0.0%) |
| $35,000 to $39,999 | 12 (10.3%) | 0 (0.0%) |
| $40,000 to $44,999 | 0 (0.0%) | 12 (8.7%) |
| $45,000 to $49,999 | 0 (0.0%) | 0 (0.0%) |
| $50,000 to $54,999 | 0 (0.0%) | 51 (37.0%) |
| $55,000 to $64,999 | 13 (11.1%) | 18 (13.0%) |
| $65,000 to $74,999 | 64 (54.7%) | 0 (0.0%) |
| $75,000 to $99,999 | 0 (0.0%) | 0 (0.0%) |
| $100,000+ | 0 (0.0%) | 0 (0.0%) |
| Total | 117 (100.0%) | 138 (100.0%) |
Earnings by Sex by Educational Attainment in Union Deposit
| Educational Attainment | Male Income | Female Income |
| Less than High School | - | - |
| High School Diploma | - | - |
| College or Associate's Degree | - | - |
| Bachelor's Degree | - | - |
| Graduate Degree | - | - |
| Total | $70,215 | $53,897 |
Family Income in Union Deposit
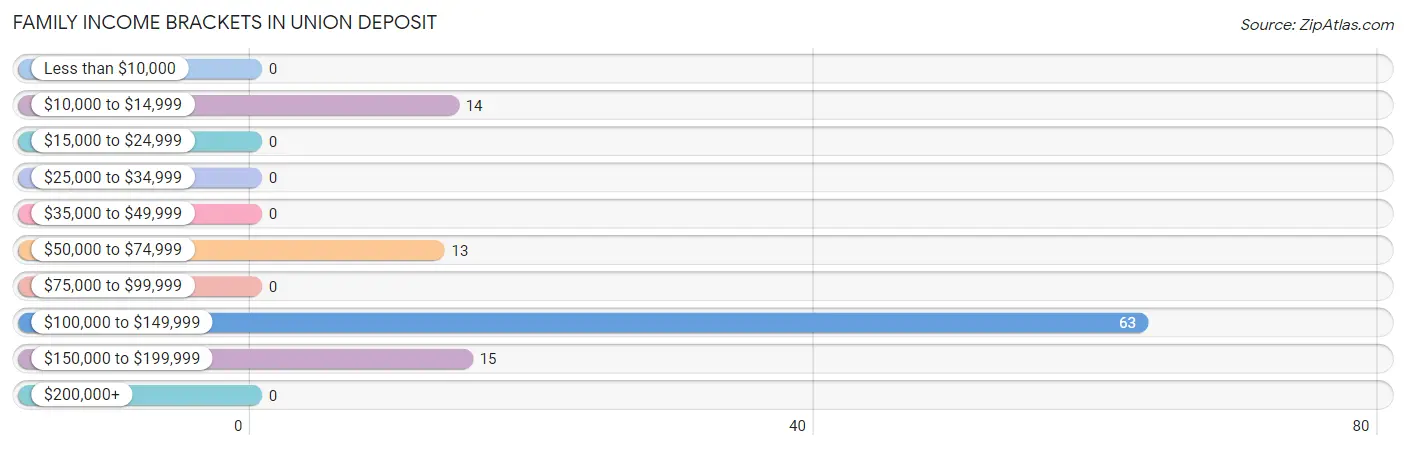
Family Income Brackets in Union Deposit
According to the Union Deposit family income data, there are 63 families falling into the $100,000 to $149,999 income range, which is the most common income bracket and makes up 60.0% of all families.
| Income Bracket | # Families | % Families |
| Less than $10,000 | 0 | 0.0% |
| $10,000 to $14,999 | 14 | 13.3% |
| $15,000 to $24,999 | 0 | 0.0% |
| $25,000 to $34,999 | 0 | 0.0% |
| $35,000 to $49,999 | 0 | 0.0% |
| $50,000 to $74,999 | 13 | 12.4% |
| $75,000 to $99,999 | 0 | 0.0% |
| $100,000 to $149,999 | 63 | 60.0% |
| $150,000 to $199,999 | 15 | 14.3% |
| $200,000+ | 0 | 0.0% |
Family Income by Famaliy Size in Union Deposit
| Income Bracket | # Families | Median Income |
| 2-Person Families | 28 (26.7%) | $0 |
| 3-Person Families | 14 (13.3%) | $0 |
| 4-Person Families | 51 (48.6%) | $0 |
| 5-Person Families | 12 (11.4%) | $0 |
| 6-Person Families | 0 (0.0%) | $0 |
| 7+ Person Families | 0 (0.0%) | $0 |
| Total | 105 (100.0%) | $130,662 |
Family Income by Number of Earners in Union Deposit
| Number of Earners | # Families | Median Income |
| No Earners | 15 (14.3%) | $0 |
| 1 Earner | 27 (25.7%) | $0 |
| 2 Earners | 12 (11.4%) | $0 |
| 3+ Earners | 51 (48.6%) | $0 |
| Total | 105 (100.0%) | $130,662 |
Household Income in Union Deposit
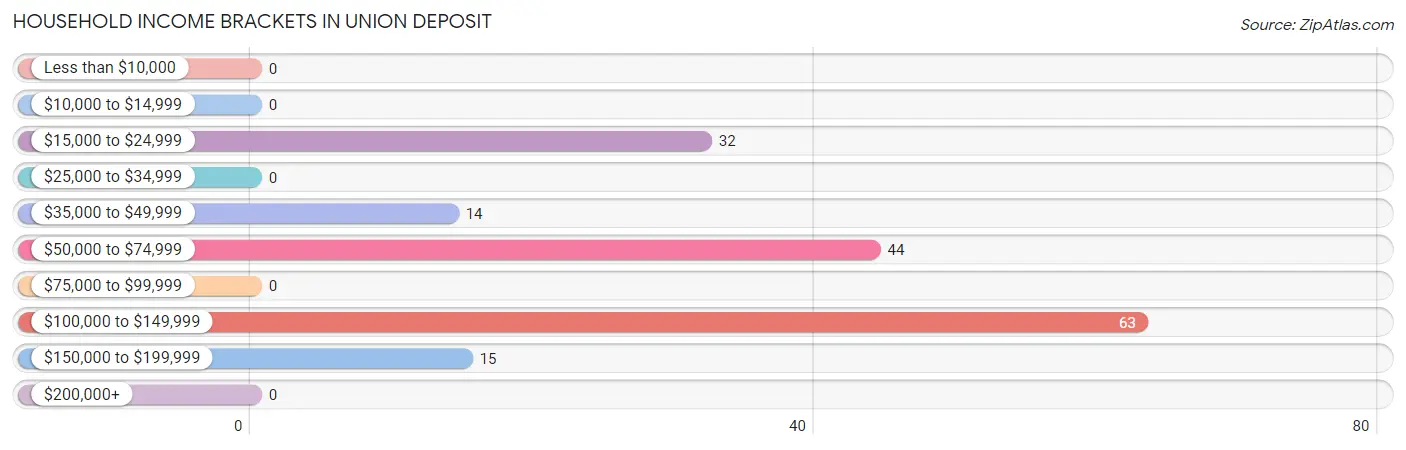
Household Income Brackets in Union Deposit
With 63 households falling in the category, the $100,000 to $149,999 income range is the most frequent in Union Deposit, accounting for 37.5% of all households.
| Income Bracket | # Households | % Households |
| Less than $10,000 | 0 | 0.0% |
| $10,000 to $14,999 | 0 | 0.0% |
| $15,000 to $24,999 | 32 | 19.0% |
| $25,000 to $34,999 | 0 | 0.0% |
| $35,000 to $49,999 | 14 | 8.3% |
| $50,000 to $74,999 | 44 | 26.2% |
| $75,000 to $99,999 | 0 | 0.0% |
| $100,000 to $149,999 | 63 | 37.5% |
| $150,000 to $199,999 | 15 | 8.9% |
| $200,000+ | 0 | 0.0% |
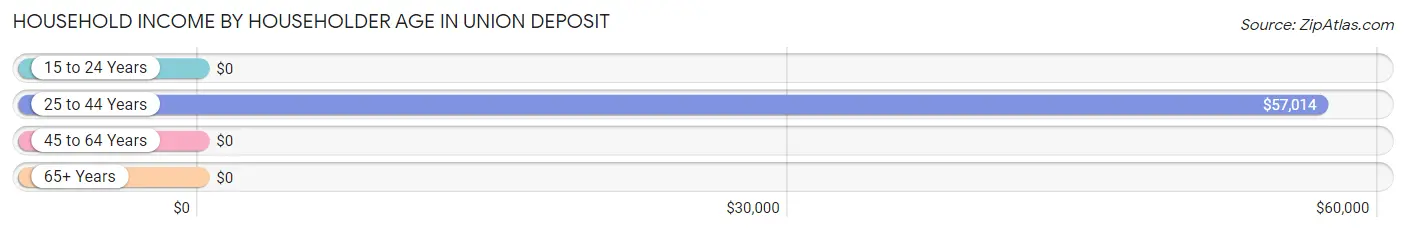
Household Income by Householder Age in Union Deposit
The median household income in Union Deposit is $0, with the highest median household income of $57,014 found in the 25 to 44 years age bracket for the primary householder. A total of 57 households (33.9%) fall into this category.
| Income Bracket | # Households | Median Income |
| 15 to 24 Years | 0 (0.0%) | $0 |
| 25 to 44 Years | 57 (33.9%) | $57,014 |
| 45 to 64 Years | 51 (30.4%) | $0 |
| 65+ Years | 60 (35.7%) | $0 |
| Total | 168 (100.0%) | $0 |
Poverty in Union Deposit
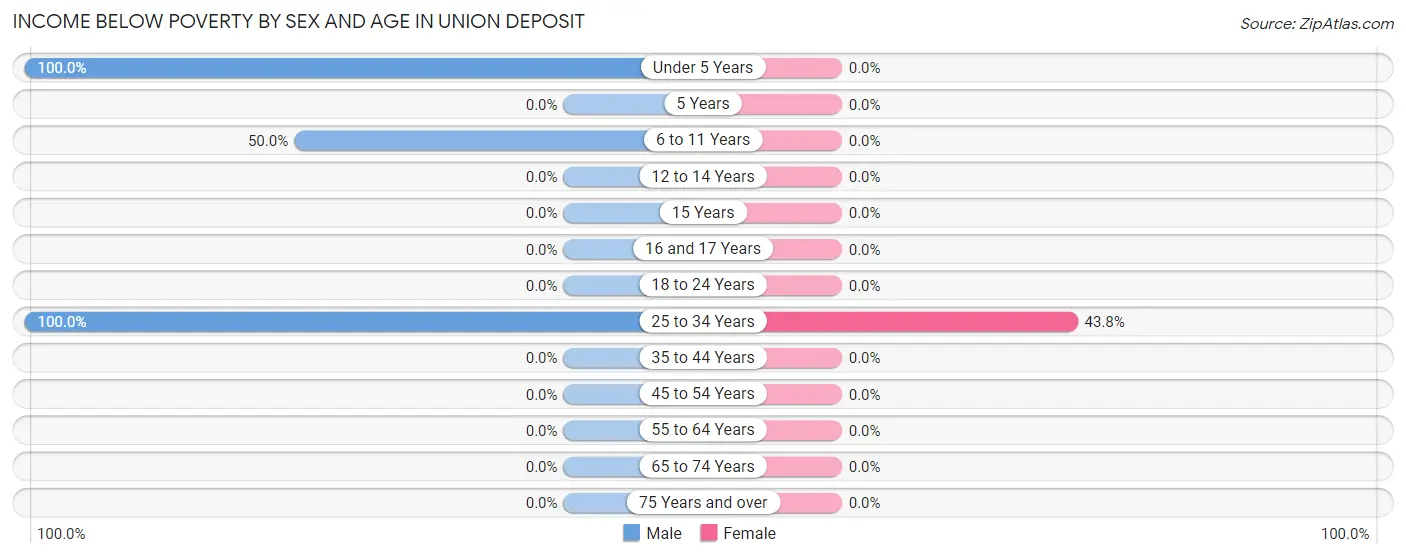
Income Below Poverty by Sex and Age in Union Deposit
With 18.8% poverty level for males and 6.3% for females among the residents of Union Deposit, under 5 year old males and 25 to 34 year old females are the most vulnerable to poverty, with 15 males (100.0%) and 14 females (43.8%) in their respective age groups living below the poverty level.
| Age Bracket | Male | Female |
| Under 5 Years | 15 (100.0%) | 0 (0.0%) |
| 5 Years | 0 (0.0%) | 0 (0.0%) |
| 6 to 11 Years | 12 (50.0%) | 0 (0.0%) |
| 12 to 14 Years | 0 (0.0%) | 0 (0.0%) |
| 15 Years | 0 (0.0%) | 0 (0.0%) |
| 16 and 17 Years | 0 (0.0%) | 0 (0.0%) |
| 18 to 24 Years | 0 (0.0%) | 0 (0.0%) |
| 25 to 34 Years | 14 (100.0%) | 14 (43.8%) |
| 35 to 44 Years | 0 (0.0%) | 0 (0.0%) |
| 45 to 54 Years | 0 (0.0%) | 0 (0.0%) |
| 55 to 64 Years | 0 (0.0%) | 0 (0.0%) |
| 65 to 74 Years | 0 (0.0%) | 0 (0.0%) |
| 75 Years and over | 0 (0.0%) | 0 (0.0%) |
| Total | 41 (18.8%) | 14 (6.3%) |
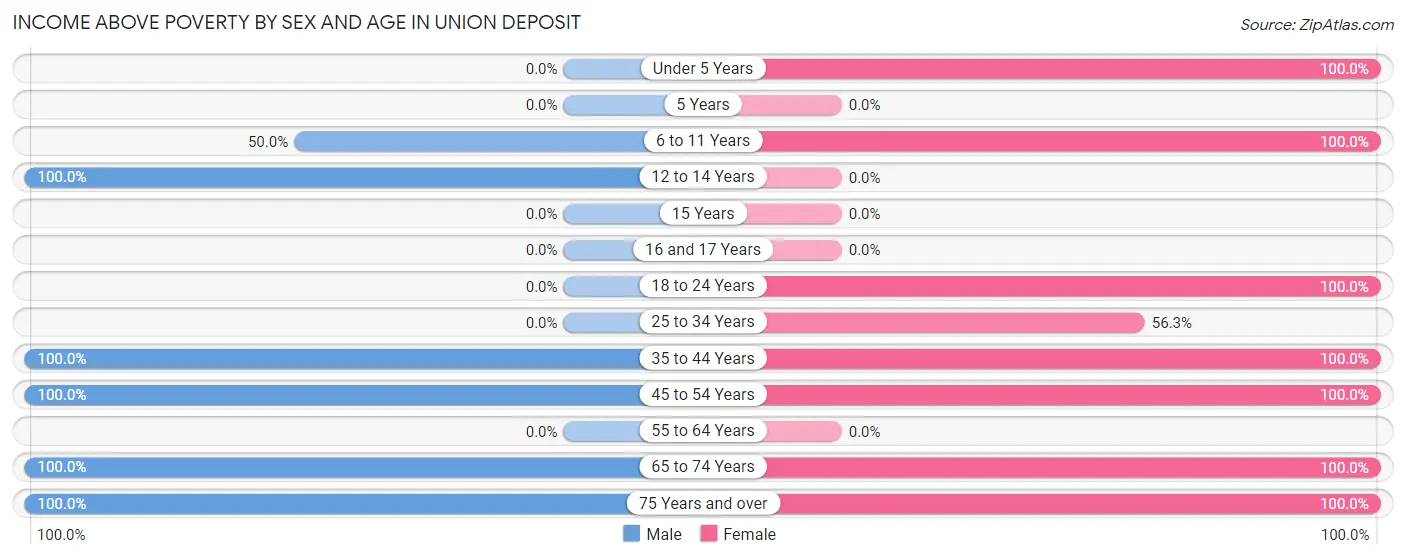
Income Above Poverty by Sex and Age in Union Deposit
According to the poverty statistics in Union Deposit, males aged 12 to 14 years and females aged under 5 years are the age groups that are most secure financially, with 100.0% of males and 100.0% of females in these age groups living above the poverty line.
| Age Bracket | Male | Female |
| Under 5 Years | 0 (0.0%) | 13 (100.0%) |
| 5 Years | 0 (0.0%) | 0 (0.0%) |
| 6 to 11 Years | 12 (50.0%) | 11 (100.0%) |
| 12 to 14 Years | 50 (100.0%) | 0 (0.0%) |
| 15 Years | 0 (0.0%) | 0 (0.0%) |
| 16 and 17 Years | 0 (0.0%) | 0 (0.0%) |
| 18 to 24 Years | 0 (0.0%) | 57 (100.0%) |
| 25 to 34 Years | 0 (0.0%) | 18 (56.2%) |
| 35 to 44 Years | 26 (100.0%) | 12 (100.0%) |
| 45 to 54 Years | 51 (100.0%) | 51 (100.0%) |
| 55 to 64 Years | 0 (0.0%) | 0 (0.0%) |
| 65 to 74 Years | 26 (100.0%) | 13 (100.0%) |
| 75 Years and over | 12 (100.0%) | 33 (100.0%) |
| Total | 177 (81.2%) | 208 (93.7%) |
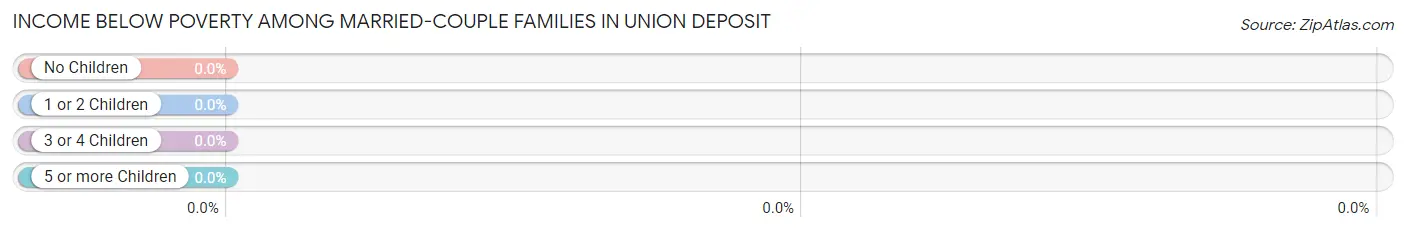
Income Below Poverty Among Married-Couple Families in Union Deposit
| Children | Above Poverty | Below Poverty |
| No Children | 28 (100.0%) | 0 (0.0%) |
| 1 or 2 Children | 51 (100.0%) | 0 (0.0%) |
| 3 or 4 Children | 12 (100.0%) | 0 (0.0%) |
| 5 or more Children | 0 (0.0%) | 0 (0.0%) |
| Total | 91 (100.0%) | 0 (0.0%) |
Income Below Poverty Among Single-Parent Households in Union Deposit
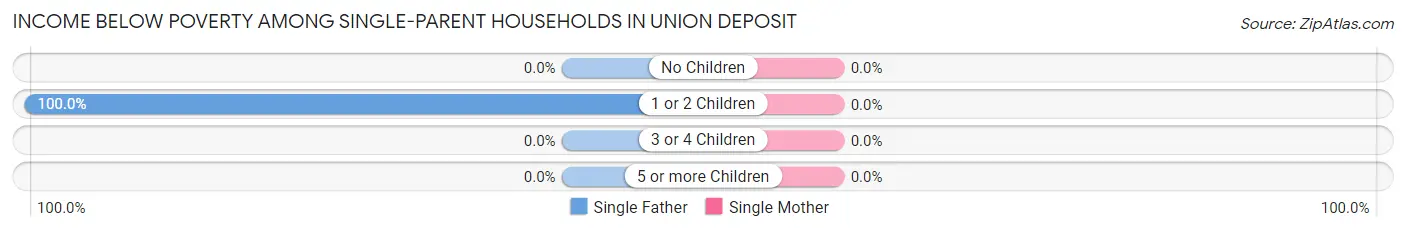
| Children | Single Father | Single Mother |
| No Children | 0 (0.0%) | 0 (0.0%) |
| 1 or 2 Children | 14 (100.0%) | 0 (0.0%) |
| 3 or 4 Children | 0 (0.0%) | 0 (0.0%) |
| 5 or more Children | 0 (0.0%) | 0 (0.0%) |
| Total | 14 (100.0%) | 0 (0.0%) |
Income Below Poverty Among Married-Couple vs Single-Parent Households in Union Deposit
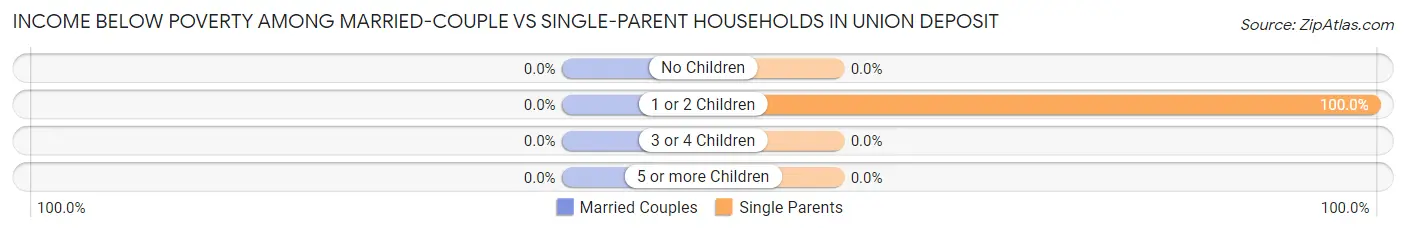
| Children | Married-Couple Families | Single-Parent Households |
| No Children | 0 (0.0%) | 0 (0.0%) |
| 1 or 2 Children | 0 (0.0%) | 14 (100.0%) |
| 3 or 4 Children | 0 (0.0%) | 0 (0.0%) |
| 5 or more Children | 0 (0.0%) | 0 (0.0%) |
| Total | 0 (0.0%) | 14 (100.0%) |
Race in Union Deposit
The most populous races in Union Deposit are , and White / Caucasian (440 | 100.0%).
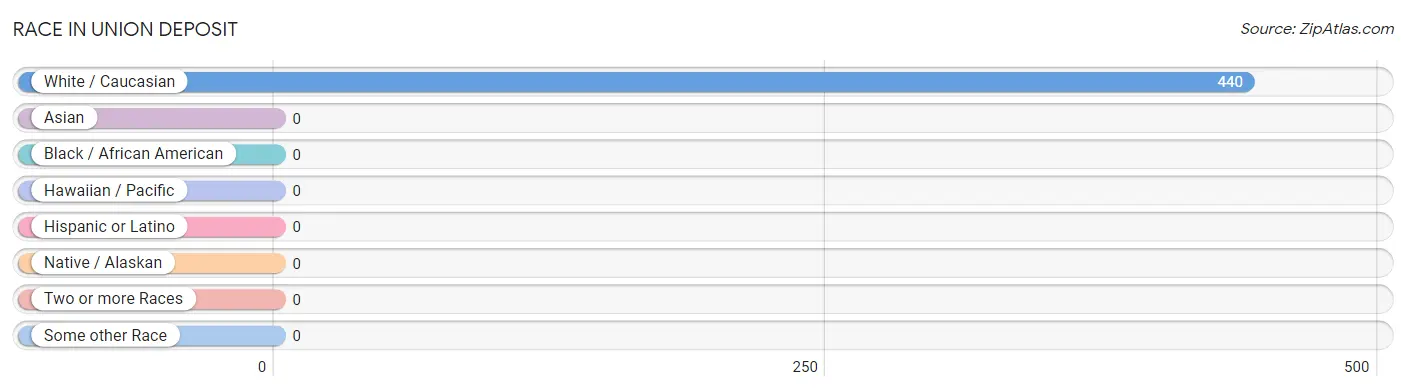
| Race | # Population | % Population |
| Asian | 0 | 0.0% |
| Black / African American | 0 | 0.0% |
| Hawaiian / Pacific | 0 | 0.0% |
| Hispanic or Latino | 0 | 0.0% |
| Native / Alaskan | 0 | 0.0% |
| White / Caucasian | 440 | 100.0% |
| Two or more Races | 0 | 0.0% |
| Some other Race | 0 | 0.0% |
| Total | 440 | 100.0% |
Ancestry in Union Deposit
The most populous ancestries reported in Union Deposit are German (123 | 28.0%), American (61 | 13.9%), English (44 | 10.0%), French (41 | 9.3%), and Italian (41 | 9.3%), together accounting for 70.4% of all Union Deposit residents.
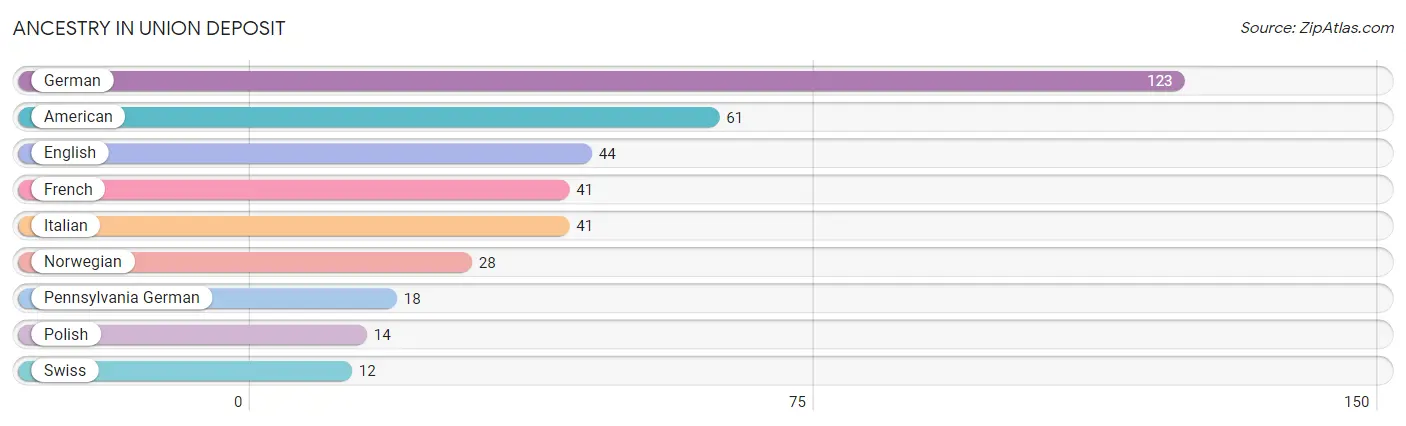
| Ancestry | # Population | % Population |
| American | 61 | 13.9% |
| English | 44 | 10.0% |
| French | 41 | 9.3% |
| German | 123 | 28.0% |
| Italian | 41 | 9.3% |
| Norwegian | 28 | 6.4% |
| Pennsylvania German | 18 | 4.1% |
| Polish | 14 | 3.2% |
| Swiss | 12 | 2.7% | View All 9 Rows |
Immigrants in Union Deposit

| Immigration Origin | # Population | % Population | View All 0 Rows |
Sex and Age in Union Deposit
Sex and Age in Union Deposit
The most populous age groups in Union Deposit are 10 to 14 Years (62 | 28.4%) for men and 20 to 24 Years (57 | 25.7%) for women.
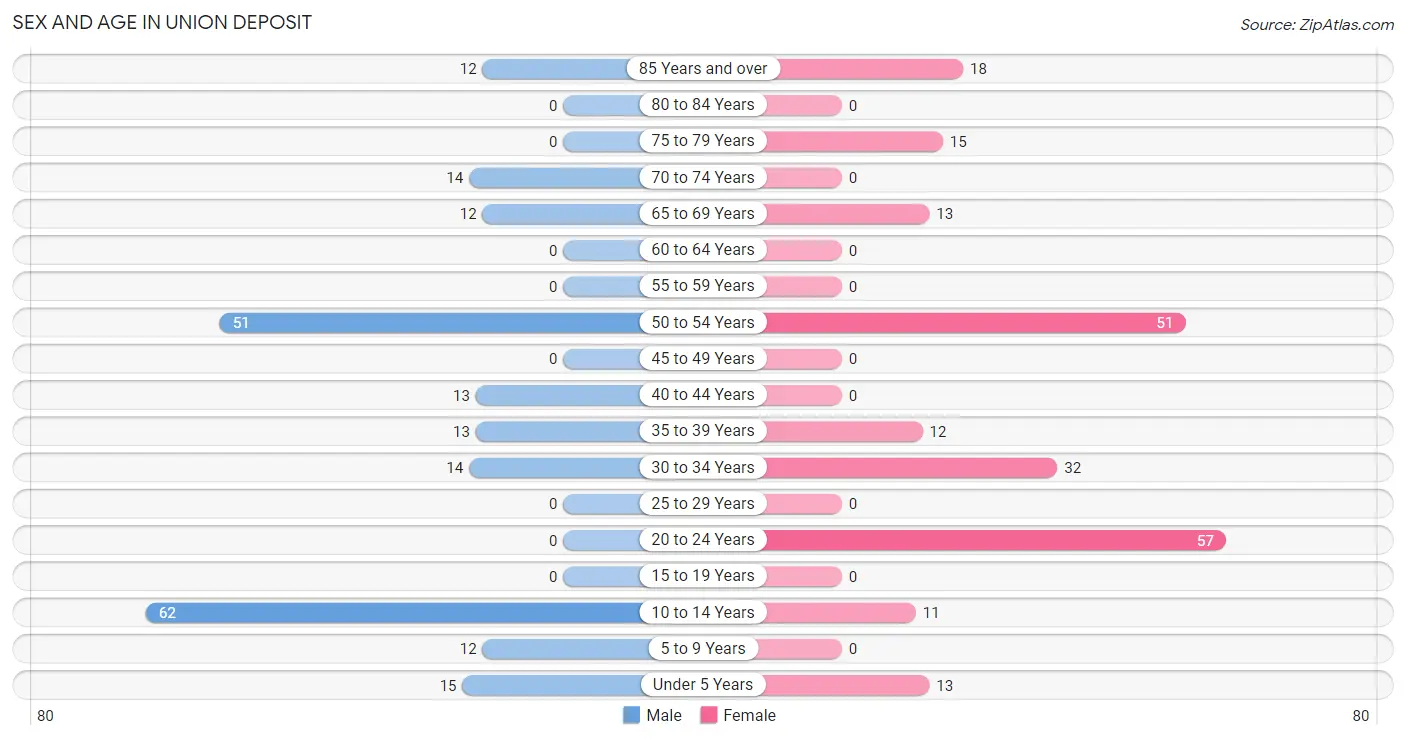
| Age Bracket | Male | Female |
| Under 5 Years | 15 (6.9%) | 13 (5.9%) |
| 5 to 9 Years | 12 (5.5%) | 0 (0.0%) |
| 10 to 14 Years | 62 (28.4%) | 11 (5.0%) |
| 15 to 19 Years | 0 (0.0%) | 0 (0.0%) |
| 20 to 24 Years | 0 (0.0%) | 57 (25.7%) |
| 25 to 29 Years | 0 (0.0%) | 0 (0.0%) |
| 30 to 34 Years | 14 (6.4%) | 32 (14.4%) |
| 35 to 39 Years | 13 (6.0%) | 12 (5.4%) |
| 40 to 44 Years | 13 (6.0%) | 0 (0.0%) |
| 45 to 49 Years | 0 (0.0%) | 0 (0.0%) |
| 50 to 54 Years | 51 (23.4%) | 51 (23.0%) |
| 55 to 59 Years | 0 (0.0%) | 0 (0.0%) |
| 60 to 64 Years | 0 (0.0%) | 0 (0.0%) |
| 65 to 69 Years | 12 (5.5%) | 13 (5.9%) |
| 70 to 74 Years | 14 (6.4%) | 0 (0.0%) |
| 75 to 79 Years | 0 (0.0%) | 15 (6.8%) |
| 80 to 84 Years | 0 (0.0%) | 0 (0.0%) |
| 85 Years and over | 12 (5.5%) | 18 (8.1%) |
| Total | 218 (100.0%) | 222 (100.0%) |
Families and Households in Union Deposit
Median Family Size in Union Deposit
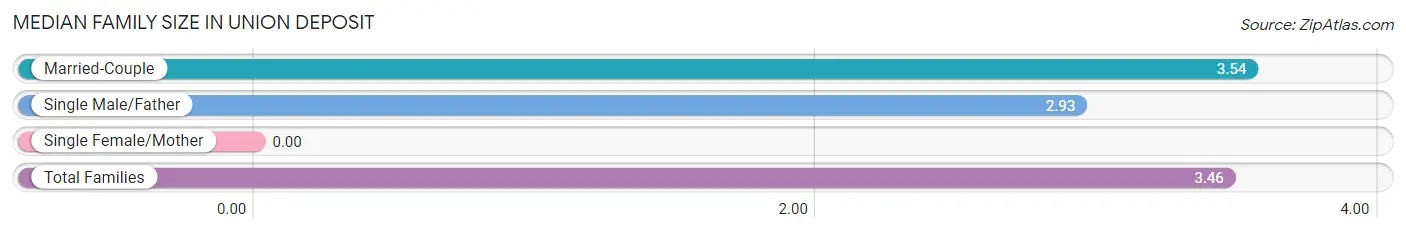
| Family Type | # Families | Family Size |
| Married-Couple | 91 (86.7%) | 3.54 |
| Single Male/Father | 14 (13.3%) | 2.93 |
| Single Female/Mother | 0 (0.0%) | - |
| Total Families | 105 (100.0%) | 3.46 |
Median Household Size in Union Deposit
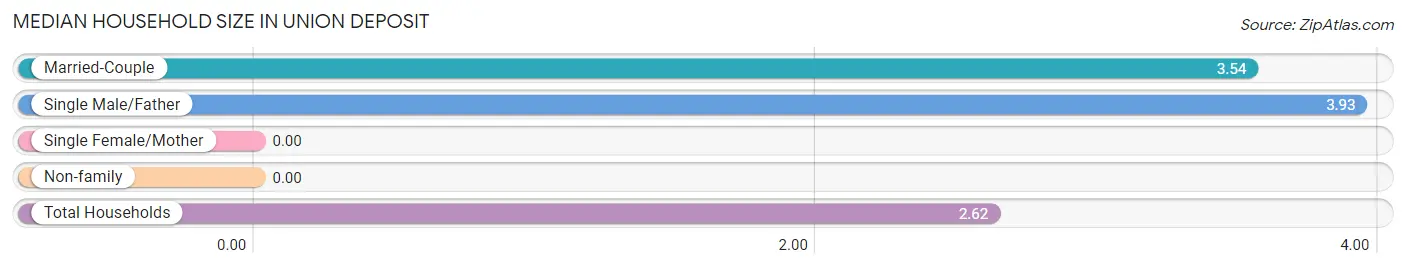
| Household Type | # Households | Household Size |
| Married-Couple | 91 (54.2%) | 3.54 |
| Single Male/Father | 14 (8.3%) | 3.93 |
| Single Female/Mother | 0 (0.0%) | - |
| Non-family | 63 (37.5%) | - |
| Total Households | 168 (100.0%) | 2.62 |
Household Size by Marriage Status in Union Deposit
Out of a total of 168 households in Union Deposit, 105 (62.5%) are family households, while 63 (37.5%) are nonfamily households. The most numerous type of family households are 4-person households, comprising 65, and the most common type of nonfamily households are 1-person households, comprising 63.
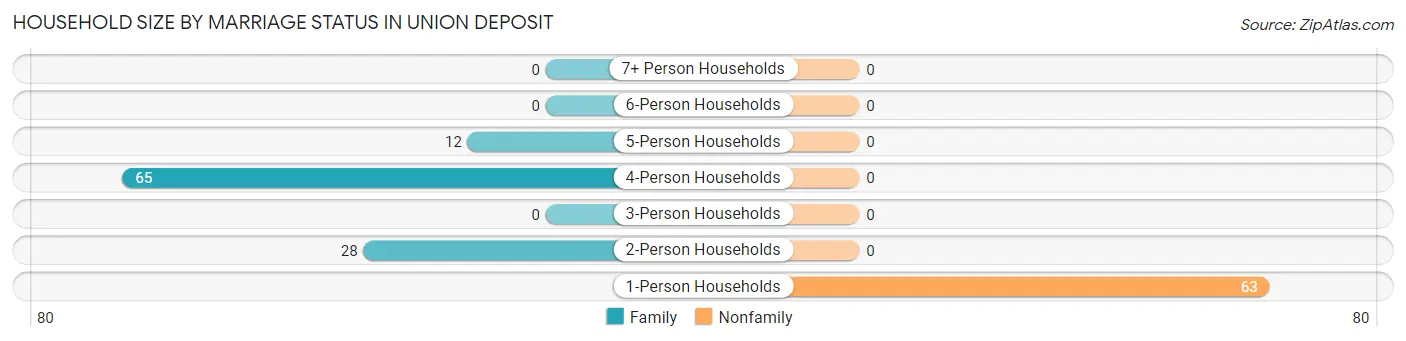
| Household Size | Family Households | Nonfamily Households |
| 1-Person Households | - | 63 (37.5%) |
| 2-Person Households | 28 (16.7%) | 0 (0.0%) |
| 3-Person Households | 0 (0.0%) | 0 (0.0%) |
| 4-Person Households | 65 (38.7%) | 0 (0.0%) |
| 5-Person Households | 12 (7.1%) | 0 (0.0%) |
| 6-Person Households | 0 (0.0%) | 0 (0.0%) |
| 7+ Person Households | 0 (0.0%) | 0 (0.0%) |
| Total | 105 (62.5%) | 63 (37.5%) |
Female Fertility in Union Deposit
Fertility by Age in Union Deposit
| Age Bracket | Women with Births | Births / 1,000 Women |
| 15 to 19 years | 0 (0.0%) | 0.0 |
| 20 to 34 years | 0 (0.0%) | 0.0 |
| 35 to 50 years | 0 (0.0%) | 0.0 |
| Total | 0 (0.0%) | 0.0 |
Fertility by Age by Marriage Status in Union Deposit
| Age Bracket | Married | Unmarried |
| 15 to 19 years | 0 (0.0%) | 0 (0.0%) |
| 20 to 34 years | 0 (0.0%) | 0 (0.0%) |
| 35 to 50 years | 0 (0.0%) | 0 (0.0%) |
| Total | 0 (0.0%) | 0 (0.0%) |
Fertility by Education in Union Deposit
| Educational Attainment | Women with Births | Births / 1,000 Women |
| Less than High School | 0 (0.0%) | 0.0 |
| High School Diploma | 0 (0.0%) | 0.0 |
| College or Associate's Degree | 0 (0.0%) | 0.0 |
| Bachelor's Degree | 0 (0.0%) | 0.0 |
| Graduate Degree | 0 (0.0%) | 0.0 |
| Total | 0 (0.0%) | 0.0 |
Fertility by Education by Marriage Status in Union Deposit
| Educational Attainment | Married | Unmarried |
| Less than High School | 0 (0.0%) | 0 (0.0%) |
| High School Diploma | 0 (0.0%) | 0 (0.0%) |
| College or Associate's Degree | 0 (0.0%) | 0 (0.0%) |
| Bachelor's Degree | 0 (0.0%) | 0 (0.0%) |
| Graduate Degree | 0 (0.0%) | 0 (0.0%) |
| Total | 0 (0.0%) | 0 (0.0%) |
Employment Characteristics in Union Deposit
Employment by Class of Employer in Union Deposit
Among the 204 employed individuals in Union Deposit, private company employees (191 | 93.6%), and not-for-profit organizations (13 | 6.4%) make up the most common classes of employment.
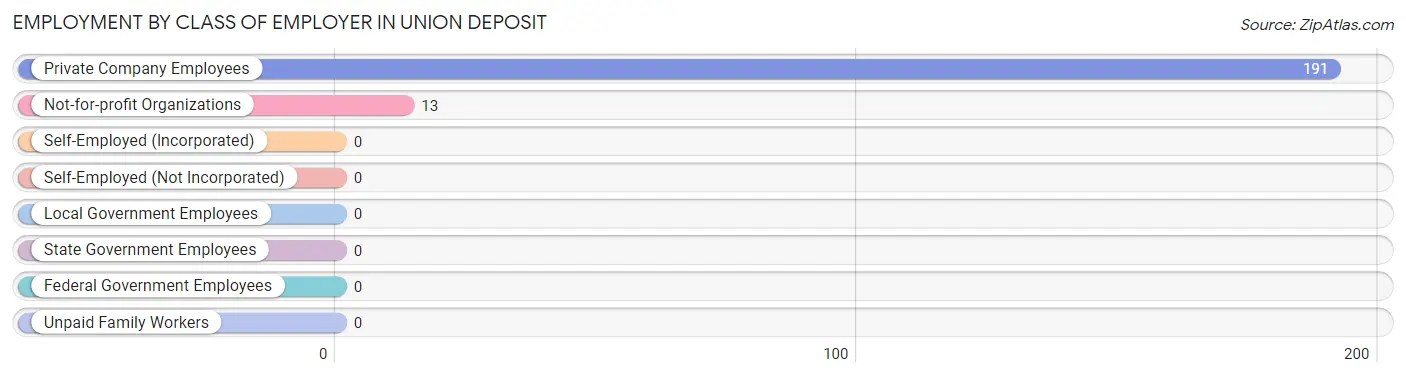
| Employer Class | # Employees | % Employees |
| Private Company Employees | 191 | 93.6% |
| Self-Employed (Incorporated) | 0 | 0.0% |
| Self-Employed (Not Incorporated) | 0 | 0.0% |
| Not-for-profit Organizations | 13 | 6.4% |
| Local Government Employees | 0 | 0.0% |
| State Government Employees | 0 | 0.0% |
| Federal Government Employees | 0 | 0.0% |
| Unpaid Family Workers | 0 | 0.0% |
| Total | 204 | 100.0% |
Employment Status by Age in Union Deposit
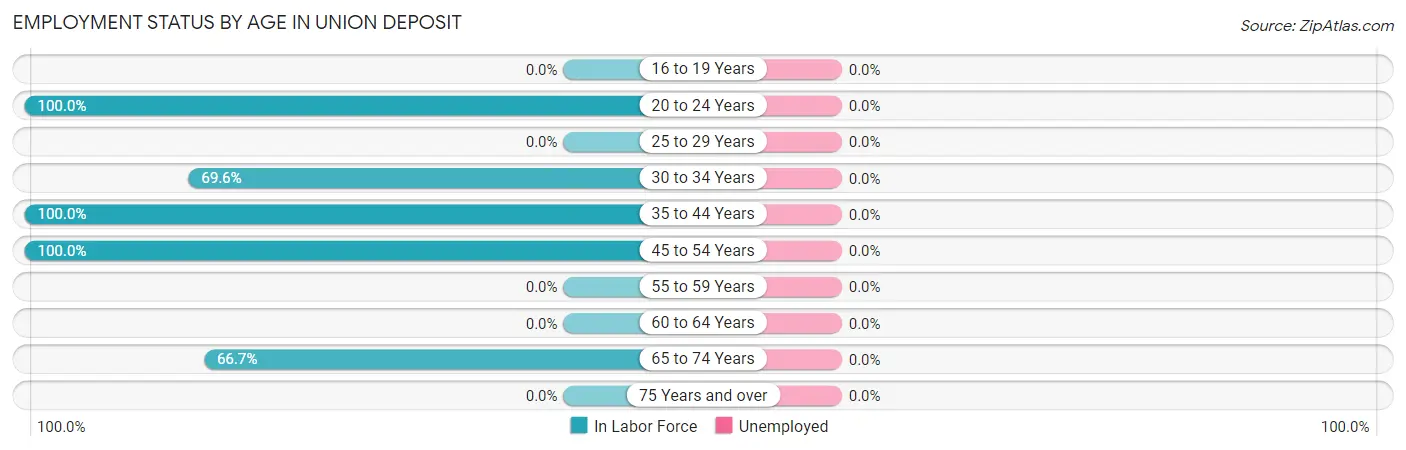
| Age Bracket | In Labor Force | Unemployed |
| 16 to 19 Years | 0 (0.0%) | 0 (0.0%) |
| 20 to 24 Years | 57 (100.0%) | 0 (0.0%) |
| 25 to 29 Years | 0 (0.0%) | 0 (0.0%) |
| 30 to 34 Years | 32 (69.6%) | 0 (0.0%) |
| 35 to 44 Years | 38 (100.0%) | 0 (0.0%) |
| 45 to 54 Years | 102 (100.0%) | 0 (0.0%) |
| 55 to 59 Years | 0 (0.0%) | 0 (0.0%) |
| 60 to 64 Years | 0 (0.0%) | 0 (0.0%) |
| 65 to 74 Years | 26 (66.7%) | 0 (0.0%) |
| 75 Years and over | 0 (0.0%) | 0 (0.0%) |
| Total | 255 (78.0%) | 0 (0.0%) |
Employment Status by Educational Attainment in Union Deposit
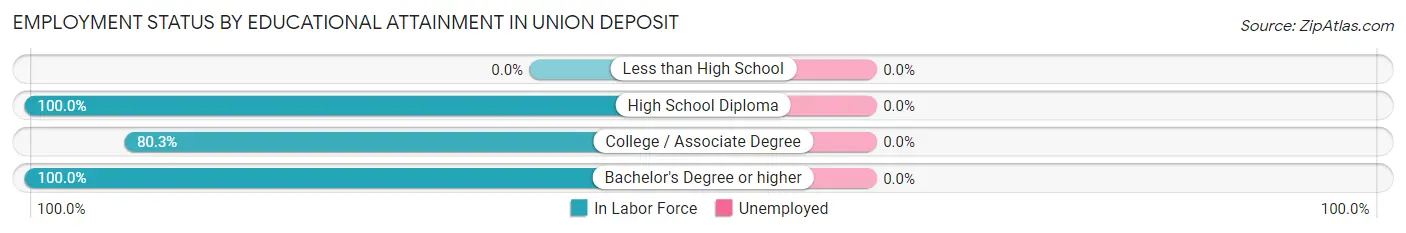
| Educational Attainment | In Labor Force | Unemployed |
| Less than High School | 0 (0.0%) | 0 (0.0%) |
| High School Diploma | 102 (100.0%) | 0 (0.0%) |
| College / Associate Degree | 57 (80.3%) | 0 (0.0%) |
| Bachelor's Degree or higher | 13 (100.0%) | 0 (0.0%) |
| Total | 172 (92.5%) | 0 (0.0%) |
Employment Occupations by Sex in Union Deposit
Management, Business, Science and Arts Occupations
The most common Management, Business, Science and Arts occupations in Union Deposit are Community & Social Service (64 | 25.1%), Education Instruction & Library (64 | 25.1%), Business & Financial (18 | 7.1%), Computers, Engineering & Science (12 | 4.7%), and Architecture & Engineering (12 | 4.7%).
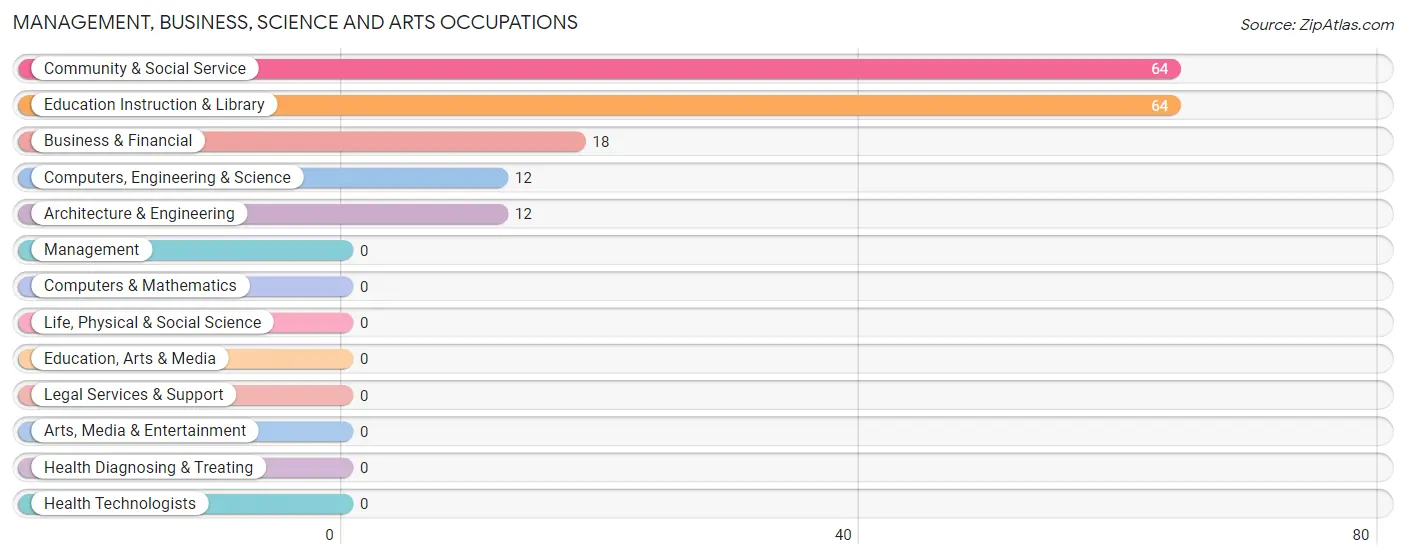
Management, Business, Science and Arts Occupations by Sex
Within the Management, Business, Science and Arts occupations in Union Deposit, the most male-oriented occupations are Computers, Engineering & Science (100.0%), Architecture & Engineering (100.0%), and Community & Social Service (20.3%), while the most female-oriented occupations are Business & Financial (100.0%), Community & Social Service (79.7%), and Education Instruction & Library (79.7%).
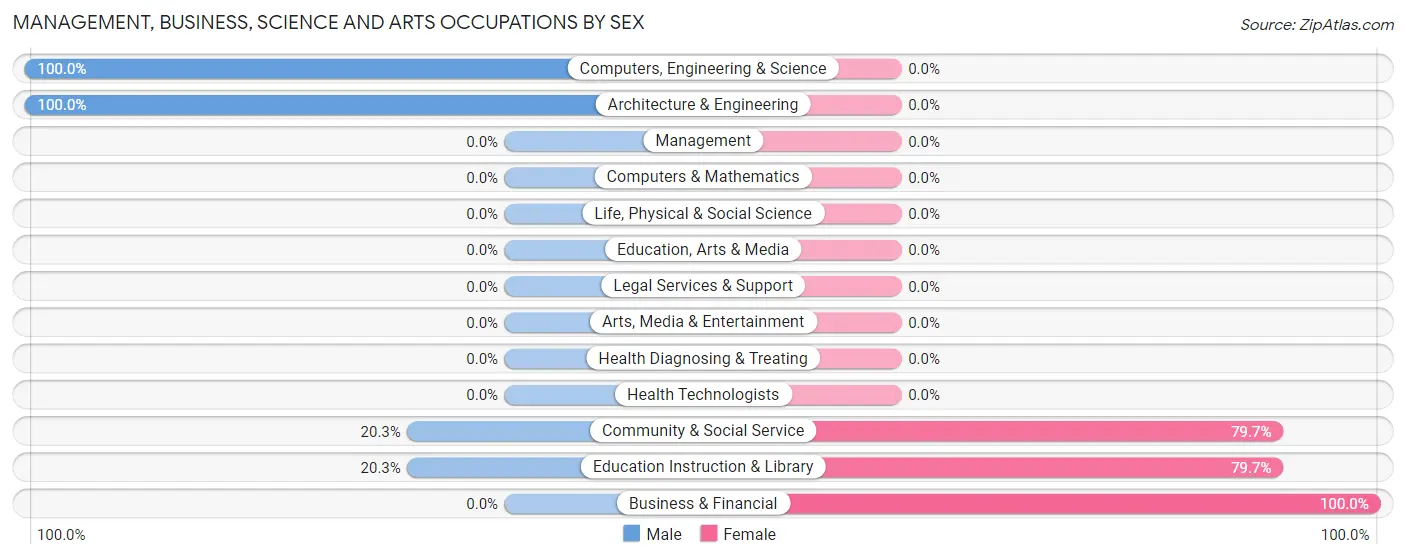
| Occupation | Male | Female |
| Management | 0 (0.0%) | 0 (0.0%) |
| Business & Financial | 0 (0.0%) | 18 (100.0%) |
| Computers, Engineering & Science | 12 (100.0%) | 0 (0.0%) |
| Computers & Mathematics | 0 (0.0%) | 0 (0.0%) |
| Architecture & Engineering | 12 (100.0%) | 0 (0.0%) |
| Life, Physical & Social Science | 0 (0.0%) | 0 (0.0%) |
| Community & Social Service | 13 (20.3%) | 51 (79.7%) |
| Education, Arts & Media | 0 (0.0%) | 0 (0.0%) |
| Legal Services & Support | 0 (0.0%) | 0 (0.0%) |
| Education Instruction & Library | 13 (20.3%) | 51 (79.7%) |
| Arts, Media & Entertainment | 0 (0.0%) | 0 (0.0%) |
| Health Diagnosing & Treating | 0 (0.0%) | 0 (0.0%) |
| Health Technologists | 0 (0.0%) | 0 (0.0%) |
| Total (Category) | 25 (26.6%) | 69 (73.4%) |
| Total (Overall) | 117 (45.9%) | 138 (54.1%) |
Services Occupations
Services Occupations by Sex
| Occupation | Male | Female |
| Healthcare Support | 0 (0.0%) | 0 (0.0%) |
| Security & Protection | 0 (0.0%) | 0 (0.0%) |
| Firefighting & Prevention | 0 (0.0%) | 0 (0.0%) |
| Law Enforcement | 0 (0.0%) | 0 (0.0%) |
| Food Preparation & Serving | 0 (0.0%) | 0 (0.0%) |
| Cleaning & Maintenance | 0 (0.0%) | 0 (0.0%) |
| Personal Care & Service | 0 (0.0%) | 0 (0.0%) |
| Total (Category) | 0 (0.0%) | 0 (0.0%) |
| Total (Overall) | 117 (45.9%) | 138 (54.1%) |
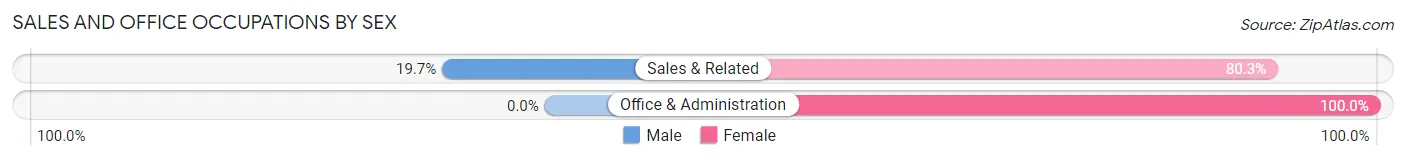
Sales and Office Occupations
The most common Sales and Office occupations in Union Deposit are Sales & Related (71 | 27.8%), and Office & Administration (12 | 4.7%).
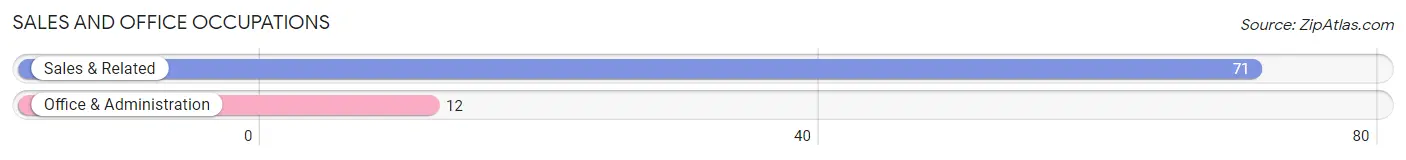
Sales and Office Occupations by Sex
| Occupation | Male | Female |
| Sales & Related | 14 (19.7%) | 57 (80.3%) |
| Office & Administration | 0 (0.0%) | 12 (100.0%) |
| Total (Category) | 14 (16.9%) | 69 (83.1%) |
| Total (Overall) | 117 (45.9%) | 138 (54.1%) |
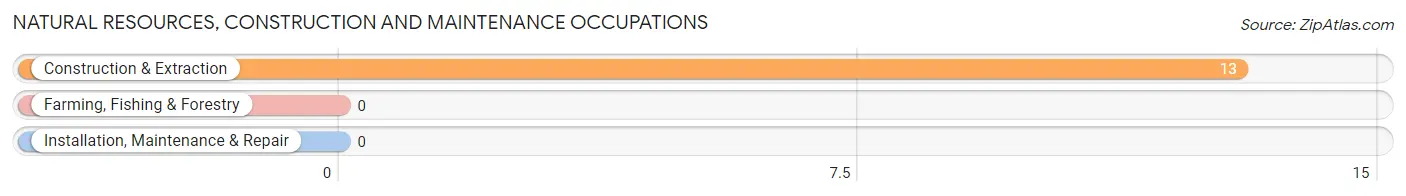
Natural Resources, Construction and Maintenance Occupations
The most common Natural Resources, Construction and Maintenance occupations in Union Deposit are , and Construction & Extraction (13 | 5.1%).
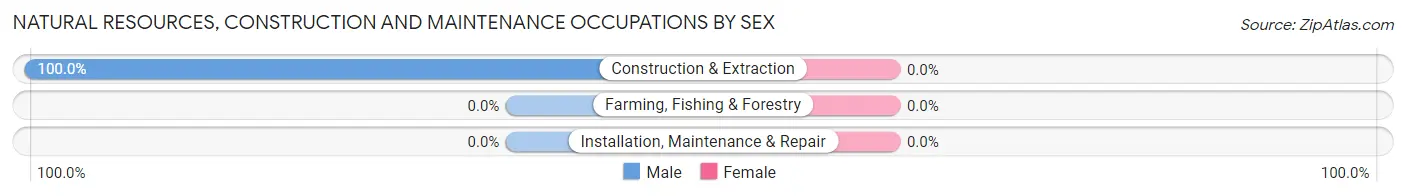
Natural Resources, Construction and Maintenance Occupations by Sex
| Occupation | Male | Female |
| Farming, Fishing & Forestry | 0 (0.0%) | 0 (0.0%) |
| Construction & Extraction | 13 (100.0%) | 0 (0.0%) |
| Installation, Maintenance & Repair | 0 (0.0%) | 0 (0.0%) |
| Total (Category) | 13 (100.0%) | 0 (0.0%) |
| Total (Overall) | 117 (45.9%) | 138 (54.1%) |
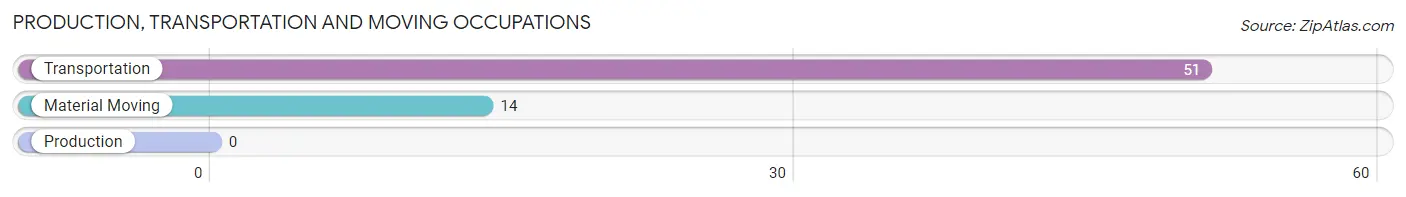
Production, Transportation and Moving Occupations
The most common Production, Transportation and Moving occupations in Union Deposit are Transportation (51 | 20.0%), and Material Moving (14 | 5.5%).
Production, Transportation and Moving Occupations by Sex
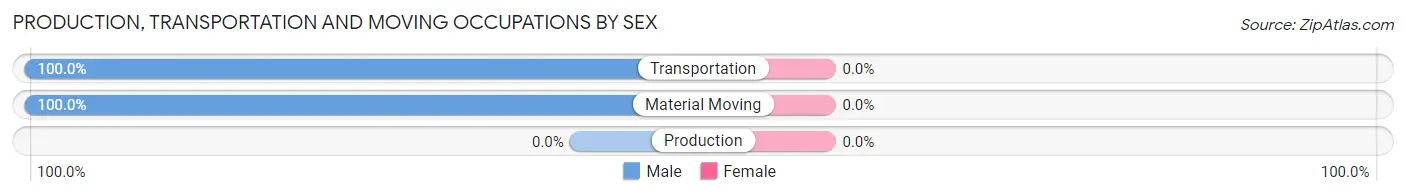
| Occupation | Male | Female |
| Production | 0 (0.0%) | 0 (0.0%) |
| Transportation | 51 (100.0%) | 0 (0.0%) |
| Material Moving | 14 (100.0%) | 0 (0.0%) |
| Total (Category) | 65 (100.0%) | 0 (0.0%) |
| Total (Overall) | 117 (45.9%) | 138 (54.1%) |
Employment Industries by Sex in Union Deposit
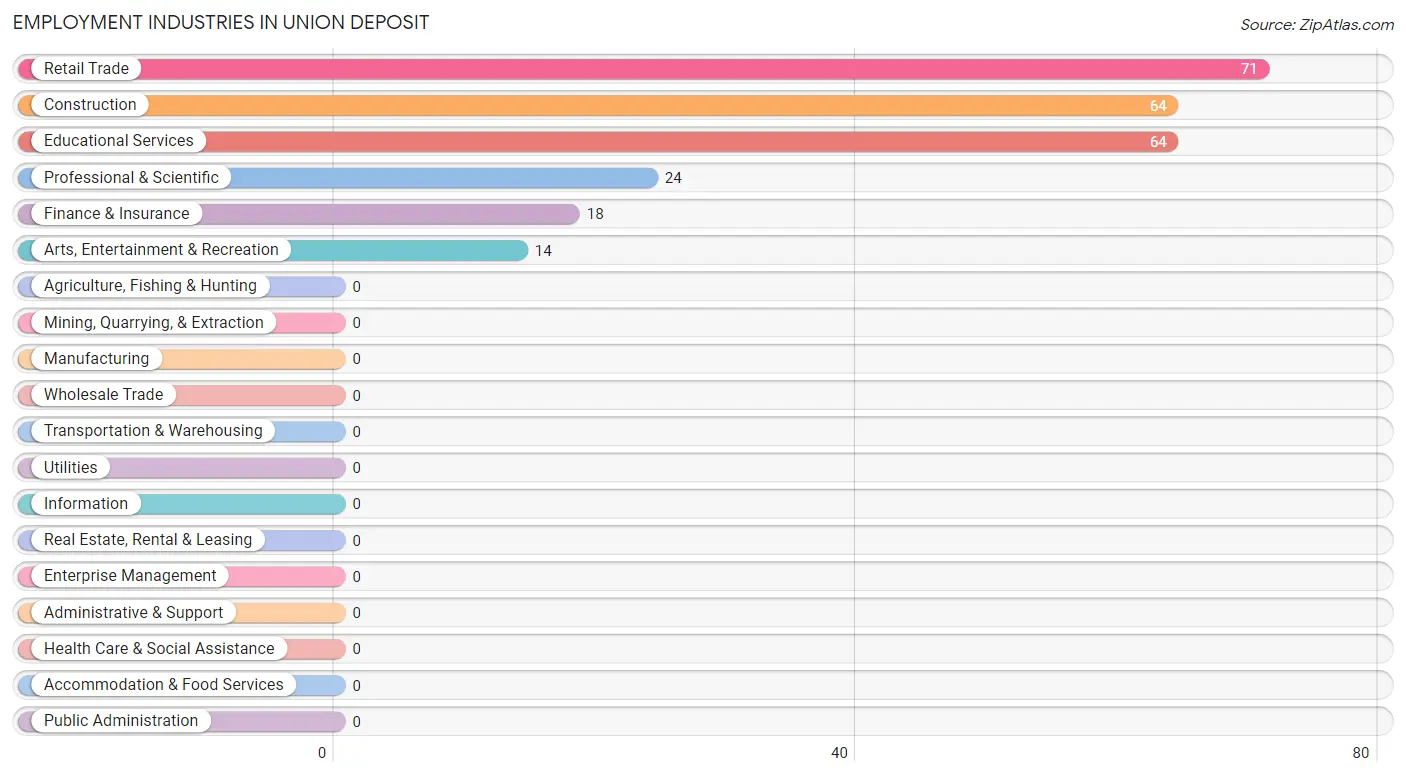
Employment Industries in Union Deposit
The major employment industries in Union Deposit include Retail Trade (71 | 27.8%), Construction (64 | 25.1%), Educational Services (64 | 25.1%), Professional & Scientific (24 | 9.4%), and Finance & Insurance (18 | 7.1%).
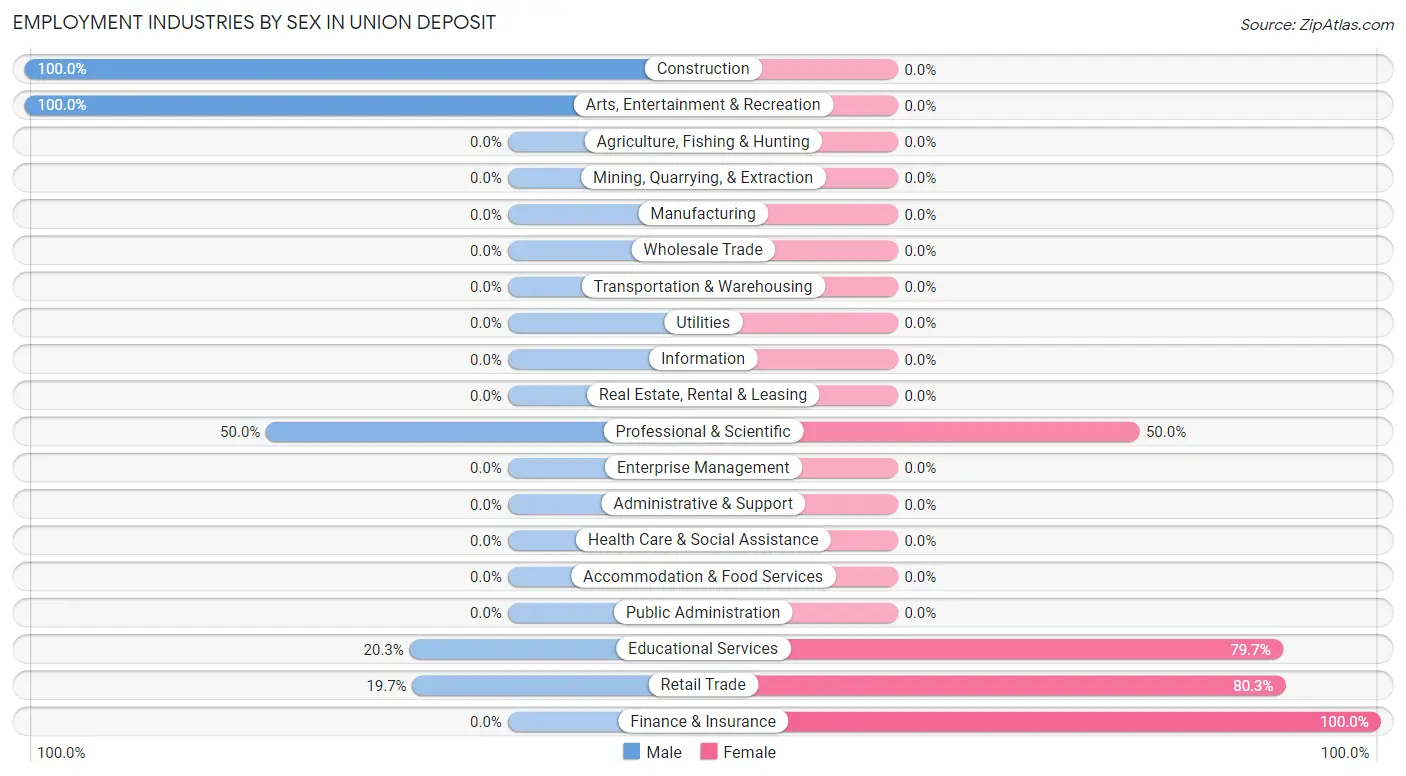
Employment Industries by Sex in Union Deposit
The Union Deposit industries that see more men than women are Construction (100.0%), Arts, Entertainment & Recreation (100.0%), and Professional & Scientific (50.0%), whereas the industries that tend to have a higher number of women are Finance & Insurance (100.0%), Retail Trade (80.3%), and Educational Services (79.7%).
| Industry | Male | Female |
| Agriculture, Fishing & Hunting | 0 (0.0%) | 0 (0.0%) |
| Mining, Quarrying, & Extraction | 0 (0.0%) | 0 (0.0%) |
| Construction | 64 (100.0%) | 0 (0.0%) |
| Manufacturing | 0 (0.0%) | 0 (0.0%) |
| Wholesale Trade | 0 (0.0%) | 0 (0.0%) |
| Retail Trade | 14 (19.7%) | 57 (80.3%) |
| Transportation & Warehousing | 0 (0.0%) | 0 (0.0%) |
| Utilities | 0 (0.0%) | 0 (0.0%) |
| Information | 0 (0.0%) | 0 (0.0%) |
| Finance & Insurance | 0 (0.0%) | 18 (100.0%) |
| Real Estate, Rental & Leasing | 0 (0.0%) | 0 (0.0%) |
| Professional & Scientific | 12 (50.0%) | 12 (50.0%) |
| Enterprise Management | 0 (0.0%) | 0 (0.0%) |
| Administrative & Support | 0 (0.0%) | 0 (0.0%) |
| Educational Services | 13 (20.3%) | 51 (79.7%) |
| Health Care & Social Assistance | 0 (0.0%) | 0 (0.0%) |
| Arts, Entertainment & Recreation | 14 (100.0%) | 0 (0.0%) |
| Accommodation & Food Services | 0 (0.0%) | 0 (0.0%) |
| Public Administration | 0 (0.0%) | 0 (0.0%) |
| Total | 117 (45.9%) | 138 (54.1%) |
Education in Union Deposit
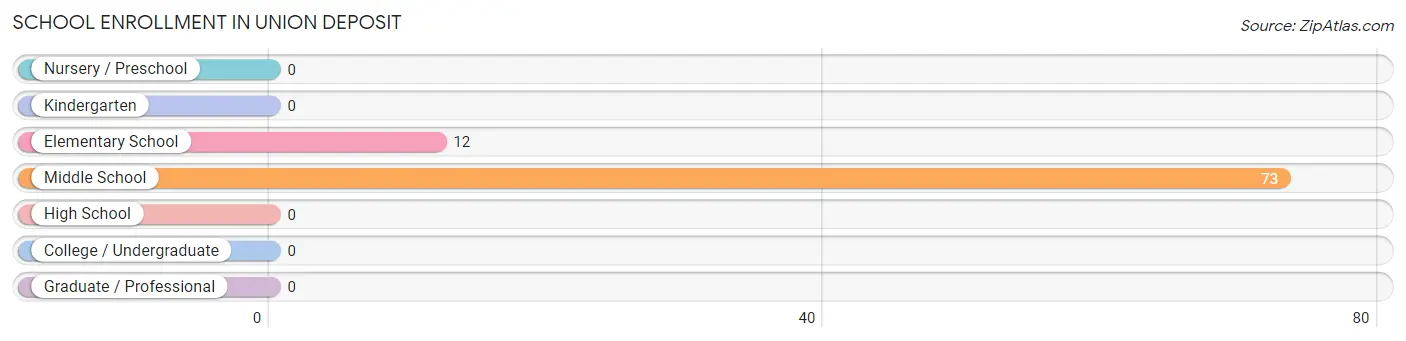
School Enrollment in Union Deposit
The most common levels of schooling among the 85 students in Union Deposit are middle school (73 | 85.9%), and elementary school (12 | 14.1%).
| School Level | # Students | % Students |
| Nursery / Preschool | 0 | 0.0% |
| Kindergarten | 0 | 0.0% |
| Elementary School | 12 | 14.1% |
| Middle School | 73 | 85.9% |
| High School | 0 | 0.0% |
| College / Undergraduate | 0 | 0.0% |
| Graduate / Professional | 0 | 0.0% |
| Total | 85 | 100.0% |
School Enrollment by Age by Funding Source in Union Deposit
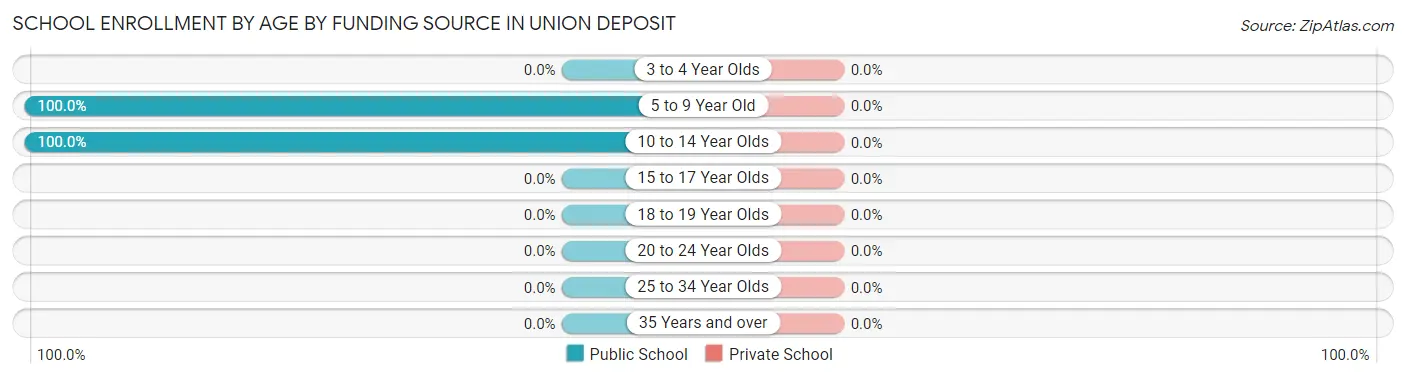
| Age Bracket | Public School | Private School |
| 3 to 4 Year Olds | 0 (0.0%) | 0 (0.0%) |
| 5 to 9 Year Old | 12 (100.0%) | 0 (0.0%) |
| 10 to 14 Year Olds | 73 (100.0%) | 0 (0.0%) |
| 15 to 17 Year Olds | 0 (0.0%) | 0 (0.0%) |
| 18 to 19 Year Olds | 0 (0.0%) | 0 (0.0%) |
| 20 to 24 Year Olds | 0 (0.0%) | 0 (0.0%) |
| 25 to 34 Year Olds | 0 (0.0%) | 0 (0.0%) |
| 35 Years and over | 0 (0.0%) | 0 (0.0%) |
| Total | 85 (100.0%) | 0 (0.0%) |
Educational Attainment by Field of Study in Union Deposit
Education (28 | 68.3%), and bio, nature & agricultural (13 | 31.7%) are the most common fields of study among 41 individuals in Union Deposit who have obtained a bachelor's degree or higher.
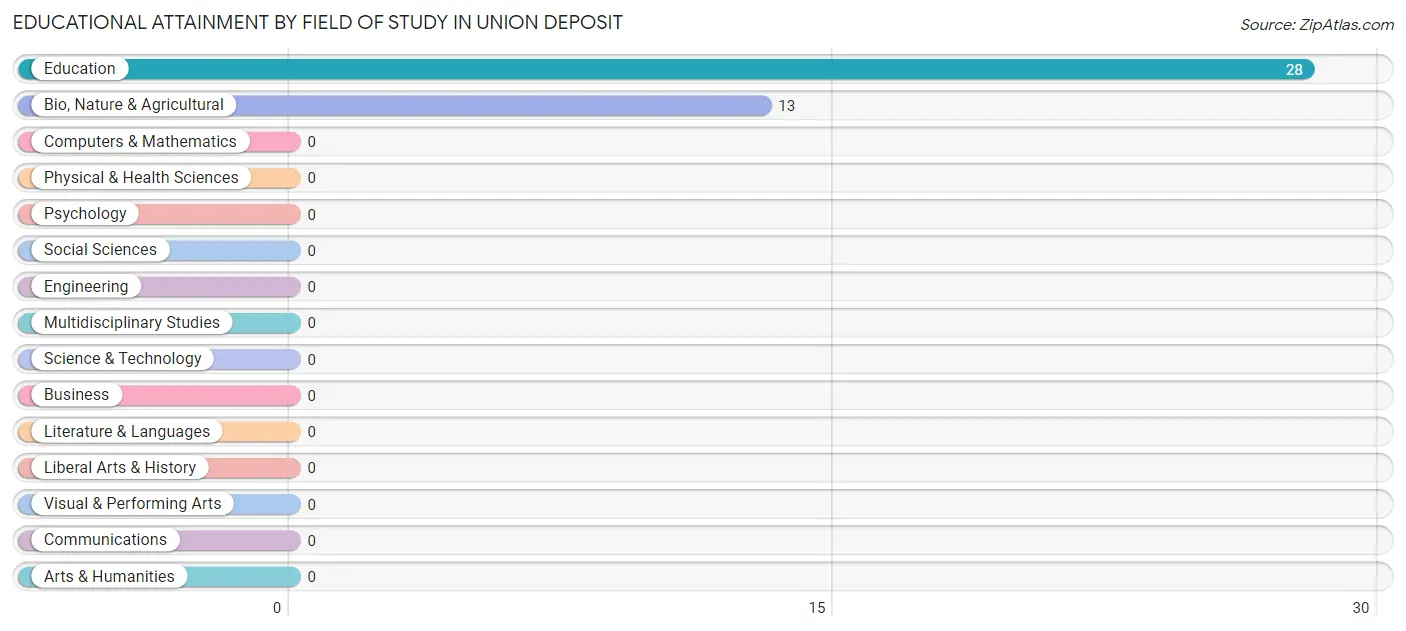
| Field of Study | # Graduates | % Graduates |
| Computers & Mathematics | 0 | 0.0% |
| Bio, Nature & Agricultural | 13 | 31.7% |
| Physical & Health Sciences | 0 | 0.0% |
| Psychology | 0 | 0.0% |
| Social Sciences | 0 | 0.0% |
| Engineering | 0 | 0.0% |
| Multidisciplinary Studies | 0 | 0.0% |
| Science & Technology | 0 | 0.0% |
| Business | 0 | 0.0% |
| Education | 28 | 68.3% |
| Literature & Languages | 0 | 0.0% |
| Liberal Arts & History | 0 | 0.0% |
| Visual & Performing Arts | 0 | 0.0% |
| Communications | 0 | 0.0% |
| Arts & Humanities | 0 | 0.0% |
| Total | 41 | 100.0% |
Transportation & Commute in Union Deposit
Vehicle Availability by Sex in Union Deposit
The most prevalent vehicle ownership categories in Union Deposit are males with 1 vehicle (79, accounting for 67.5%) and females with 1 vehicle (75, making up 90.8%).
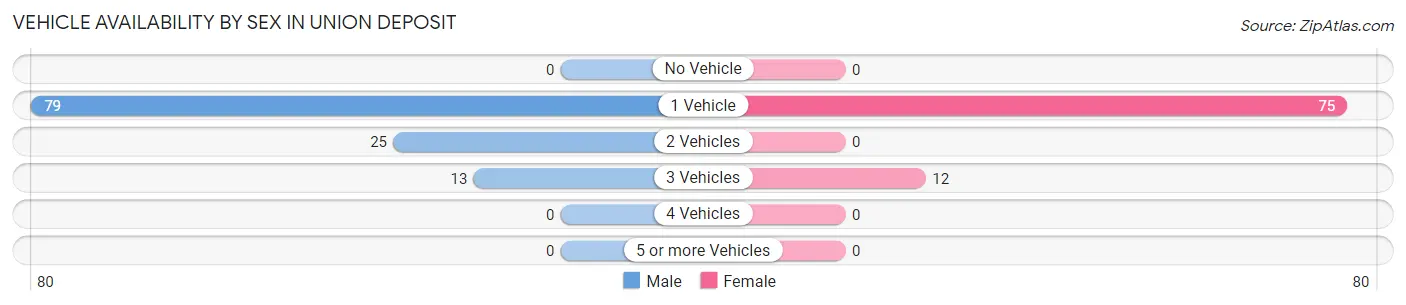
| Vehicles Available | Male | Female |
| No Vehicle | 0 (0.0%) | 0 (0.0%) |
| 1 Vehicle | 79 (67.5%) | 75 (86.2%) |
| 2 Vehicles | 25 (21.4%) | 0 (0.0%) |
| 3 Vehicles | 13 (11.1%) | 12 (13.8%) |
| 4 Vehicles | 0 (0.0%) | 0 (0.0%) |
| 5 or more Vehicles | 0 (0.0%) | 0 (0.0%) |
| Total | 117 (100.0%) | 87 (100.0%) |
Commute Time in Union Deposit
The most frequently occuring commute durations in Union Deposit are 10 to 14 minutes (147 commuters, 72.1%), 30 to 34 minutes (18 commuters, 8.8%), and 5 to 9 minutes (14 commuters, 6.9%).
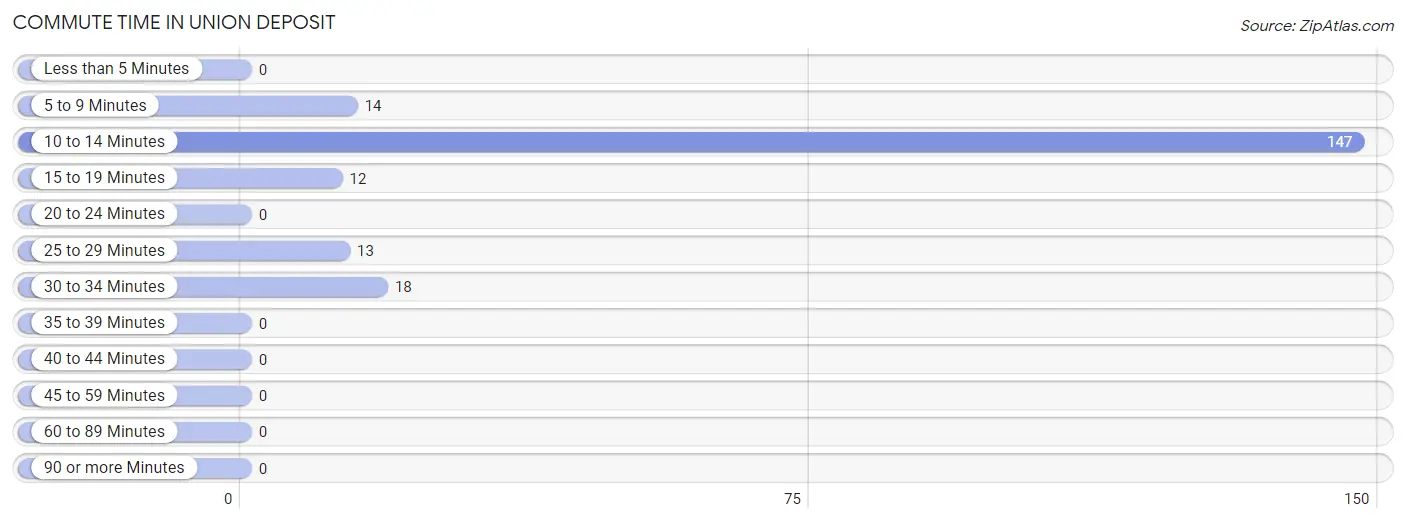
| Commute Time | # Commuters | % Commuters |
| Less than 5 Minutes | 0 | 0.0% |
| 5 to 9 Minutes | 14 | 6.9% |
| 10 to 14 Minutes | 147 | 72.1% |
| 15 to 19 Minutes | 12 | 5.9% |
| 20 to 24 Minutes | 0 | 0.0% |
| 25 to 29 Minutes | 13 | 6.4% |
| 30 to 34 Minutes | 18 | 8.8% |
| 35 to 39 Minutes | 0 | 0.0% |
| 40 to 44 Minutes | 0 | 0.0% |
| 45 to 59 Minutes | 0 | 0.0% |
| 60 to 89 Minutes | 0 | 0.0% |
| 90 or more Minutes | 0 | 0.0% |
Commute Time by Sex in Union Deposit
The most common commute times in Union Deposit are 10 to 14 minutes (78 commuters, 66.7%) for males and 10 to 14 minutes (69 commuters, 79.3%) for females.
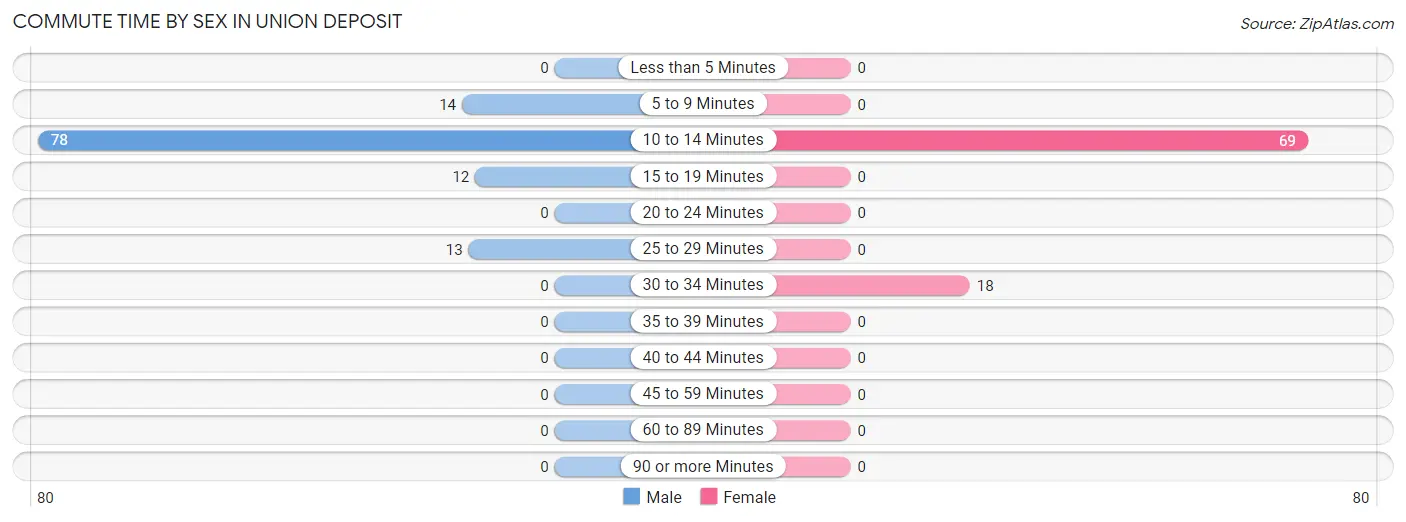
| Commute Time | Male | Female |
| Less than 5 Minutes | 0 (0.0%) | 0 (0.0%) |
| 5 to 9 Minutes | 14 (12.0%) | 0 (0.0%) |
| 10 to 14 Minutes | 78 (66.7%) | 69 (79.3%) |
| 15 to 19 Minutes | 12 (10.3%) | 0 (0.0%) |
| 20 to 24 Minutes | 0 (0.0%) | 0 (0.0%) |
| 25 to 29 Minutes | 13 (11.1%) | 0 (0.0%) |
| 30 to 34 Minutes | 0 (0.0%) | 18 (20.7%) |
| 35 to 39 Minutes | 0 (0.0%) | 0 (0.0%) |
| 40 to 44 Minutes | 0 (0.0%) | 0 (0.0%) |
| 45 to 59 Minutes | 0 (0.0%) | 0 (0.0%) |
| 60 to 89 Minutes | 0 (0.0%) | 0 (0.0%) |
| 90 or more Minutes | 0 (0.0%) | 0 (0.0%) |
Time of Departure to Work by Sex in Union Deposit
The most frequent times of departure to work in Union Deposit are 6:30 AM to 6:59 AM (64, 54.7%) for males and 6:30 AM to 6:59 AM (57, 65.5%) for females.
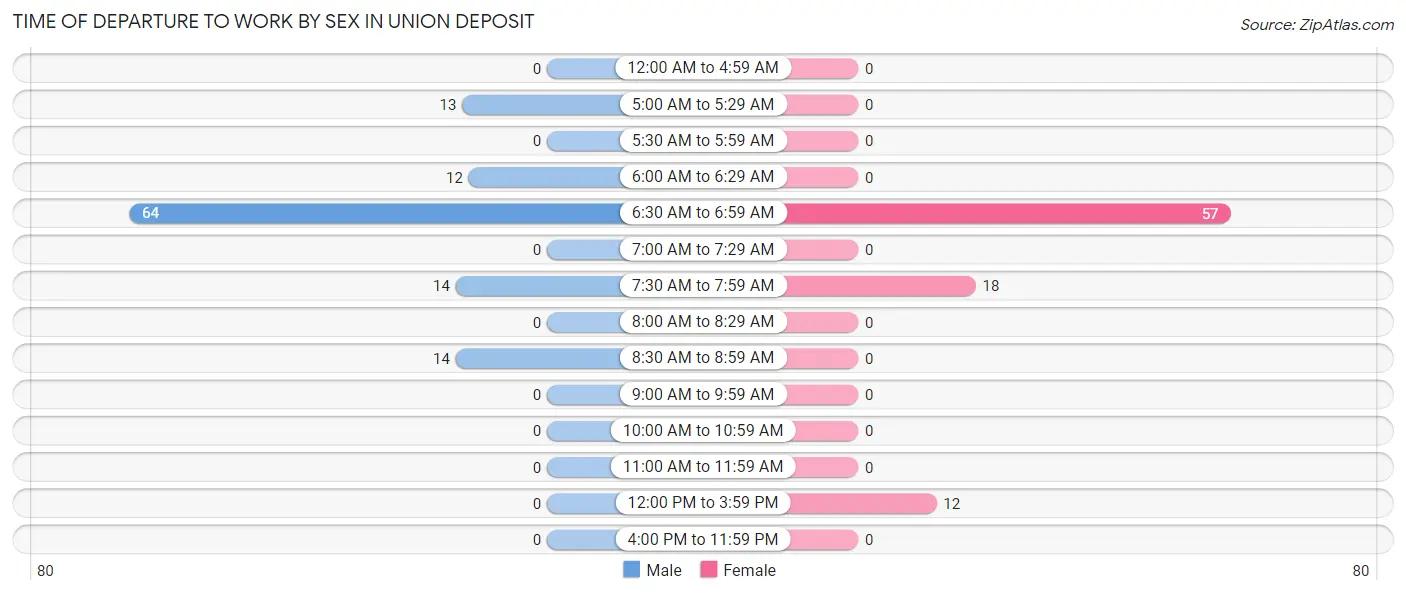
| Time of Departure | Male | Female |
| 12:00 AM to 4:59 AM | 0 (0.0%) | 0 (0.0%) |
| 5:00 AM to 5:29 AM | 13 (11.1%) | 0 (0.0%) |
| 5:30 AM to 5:59 AM | 0 (0.0%) | 0 (0.0%) |
| 6:00 AM to 6:29 AM | 12 (10.3%) | 0 (0.0%) |
| 6:30 AM to 6:59 AM | 64 (54.7%) | 57 (65.5%) |
| 7:00 AM to 7:29 AM | 0 (0.0%) | 0 (0.0%) |
| 7:30 AM to 7:59 AM | 14 (12.0%) | 18 (20.7%) |
| 8:00 AM to 8:29 AM | 0 (0.0%) | 0 (0.0%) |
| 8:30 AM to 8:59 AM | 14 (12.0%) | 0 (0.0%) |
| 9:00 AM to 9:59 AM | 0 (0.0%) | 0 (0.0%) |
| 10:00 AM to 10:59 AM | 0 (0.0%) | 0 (0.0%) |
| 11:00 AM to 11:59 AM | 0 (0.0%) | 0 (0.0%) |
| 12:00 PM to 3:59 PM | 0 (0.0%) | 12 (13.8%) |
| 4:00 PM to 11:59 PM | 0 (0.0%) | 0 (0.0%) |
| Total | 117 (100.0%) | 87 (100.0%) |
Housing Occupancy in Union Deposit
Occupancy by Ownership in Union Deposit
Of the total 168 dwellings in Union Deposit, owner-occupied units account for 42 (25.0%), while renter-occupied units make up 126 (75.0%).
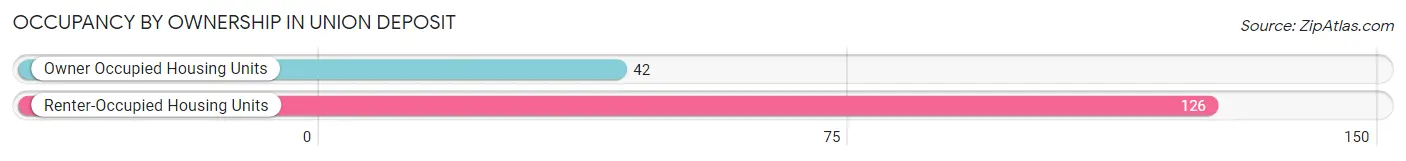
| Occupancy | # Housing Units | % Housing Units |
| Owner Occupied Housing Units | 42 | 25.0% |
| Renter-Occupied Housing Units | 126 | 75.0% |
| Total Occupied Housing Units | 168 | 100.0% |
Occupancy by Household Size in Union Deposit
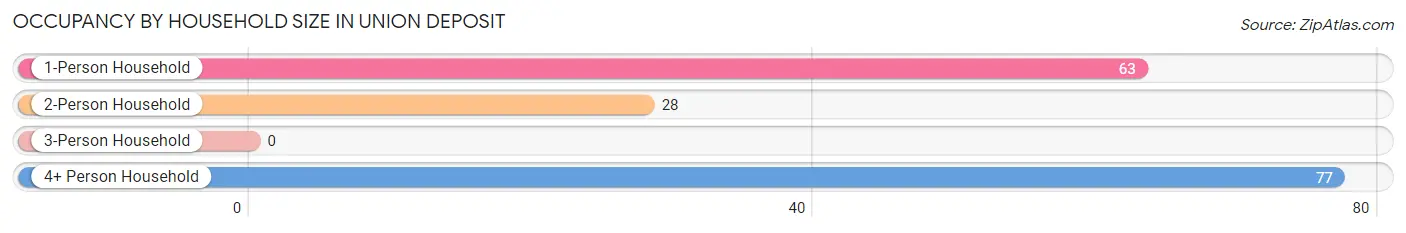
| Household Size | # Housing Units | % Housing Units |
| 1-Person Household | 63 | 37.5% |
| 2-Person Household | 28 | 16.7% |
| 3-Person Household | 0 | 0.0% |
| 4+ Person Household | 77 | 45.8% |
| Total Housing Units | 168 | 100.0% |
Occupancy by Ownership by Household Size in Union Deposit
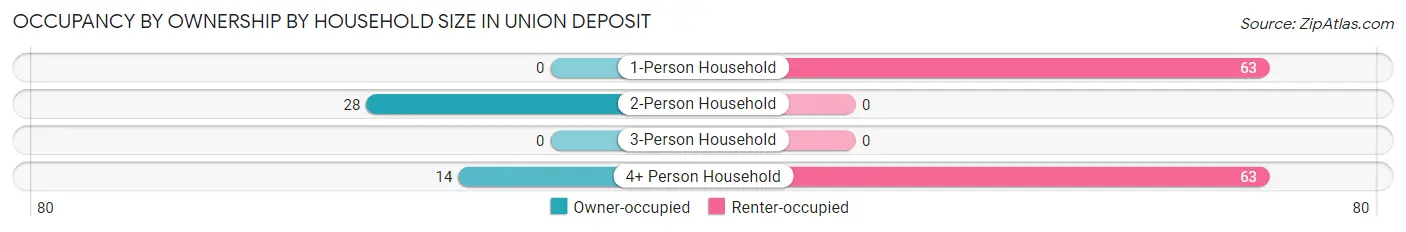
| Household Size | Owner-occupied | Renter-occupied |
| 1-Person Household | 0 (0.0%) | 63 (100.0%) |
| 2-Person Household | 28 (100.0%) | 0 (0.0%) |
| 3-Person Household | 0 (0.0%) | 0 (0.0%) |
| 4+ Person Household | 14 (18.2%) | 63 (81.8%) |
| Total Housing Units | 42 (25.0%) | 126 (75.0%) |
Occupancy by Educational Attainment in Union Deposit
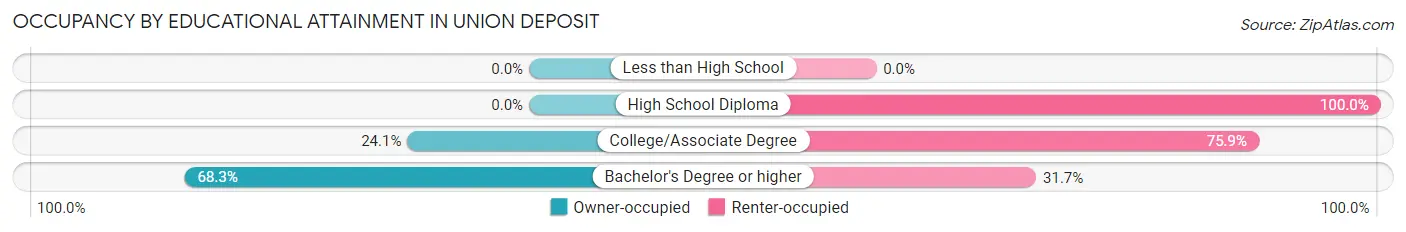
| Household Size | Owner-occupied | Renter-occupied |
| Less than High School | 0 (0.0%) | 0 (0.0%) |
| High School Diploma | 0 (0.0%) | 69 (100.0%) |
| College/Associate Degree | 14 (24.1%) | 44 (75.9%) |
| Bachelor's Degree or higher | 28 (68.3%) | 13 (31.7%) |
Occupancy by Age of Householder in Union Deposit

| Age Bracket | # Households | % Households |
| Under 35 Years | 32 | 19.1% |
| 35 to 44 Years | 25 | 14.9% |
| 45 to 54 Years | 51 | 30.4% |
| 55 to 64 Years | 0 | 0.0% |
| 65 to 74 Years | 27 | 16.1% |
| 75 to 84 Years | 15 | 8.9% |
| 85 Years and Over | 18 | 10.7% |
| Total | 168 | 100.0% |
Housing Finances in Union Deposit
Median Income by Occupancy in Union Deposit
| Occupancy Type | # Households | Median Income |
| Owner-Occupied | 42 (25.0%) | $0 |
| Renter-Occupied | 126 (75.0%) | $0 |
| Average | 168 (100.0%) | $0 |
Occupancy by Householder Income Bracket in Union Deposit
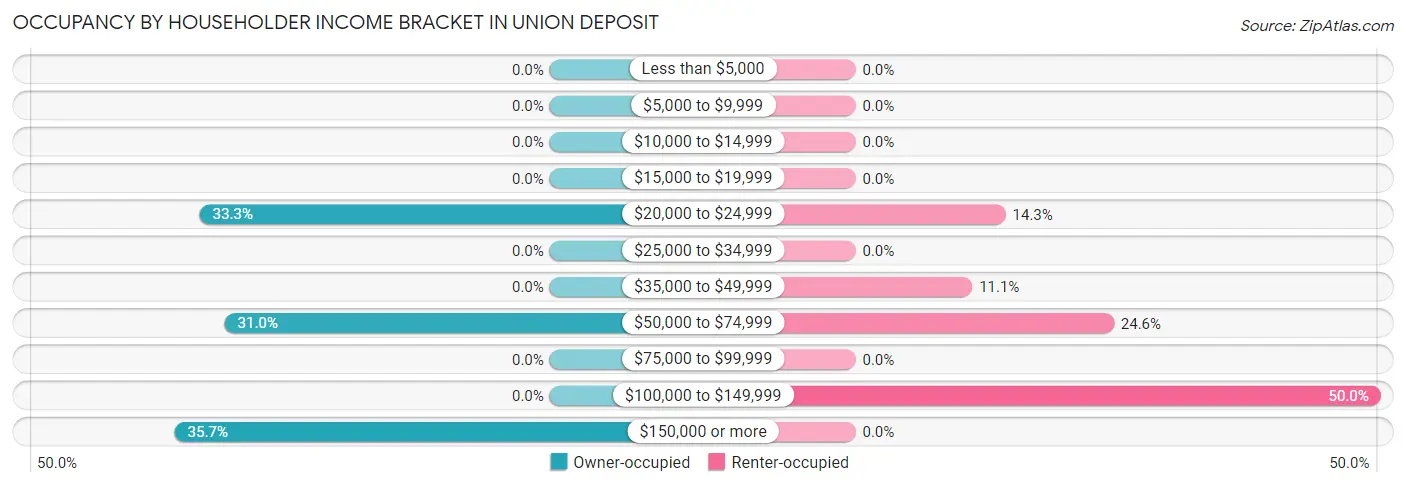
| Income Bracket | Owner-occupied | Renter-occupied |
| Less than $5,000 | 0 (0.0%) | 0 (0.0%) |
| $5,000 to $9,999 | 0 (0.0%) | 0 (0.0%) |
| $10,000 to $14,999 | 0 (0.0%) | 0 (0.0%) |
| $15,000 to $19,999 | 0 (0.0%) | 0 (0.0%) |
| $20,000 to $24,999 | 14 (33.3%) | 18 (14.3%) |
| $25,000 to $34,999 | 0 (0.0%) | 0 (0.0%) |
| $35,000 to $49,999 | 0 (0.0%) | 14 (11.1%) |
| $50,000 to $74,999 | 13 (30.9%) | 31 (24.6%) |
| $75,000 to $99,999 | 0 (0.0%) | 0 (0.0%) |
| $100,000 to $149,999 | 0 (0.0%) | 63 (50.0%) |
| $150,000 or more | 15 (35.7%) | 0 (0.0%) |
| Total | 42 (100.0%) | 126 (100.0%) |
Monthly Housing Cost Tiers in Union Deposit
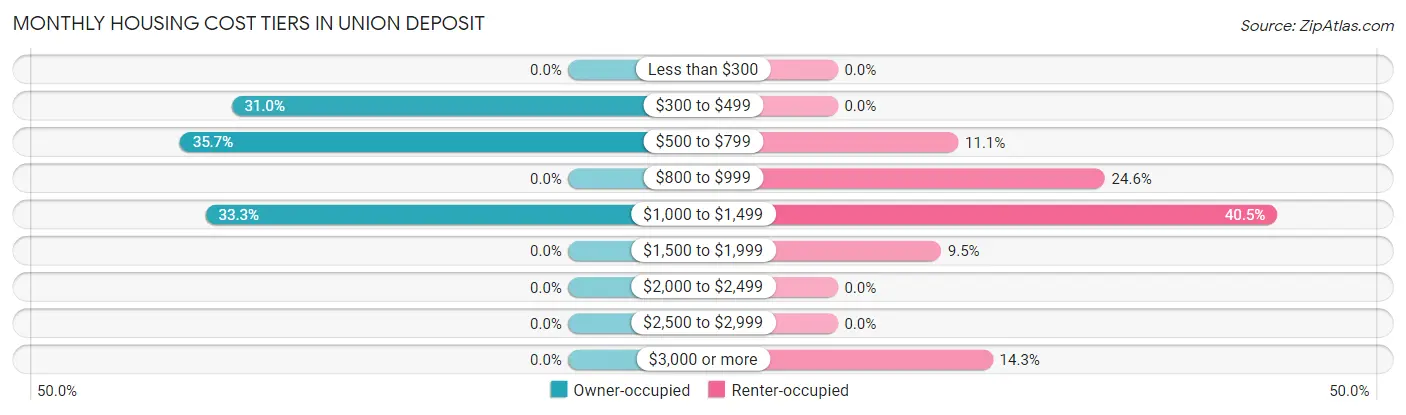
| Monthly Cost | Owner-occupied | Renter-occupied |
| Less than $300 | 0 (0.0%) | 0 (0.0%) |
| $300 to $499 | 13 (30.9%) | 0 (0.0%) |
| $500 to $799 | 15 (35.7%) | 14 (11.1%) |
| $800 to $999 | 0 (0.0%) | 31 (24.6%) |
| $1,000 to $1,499 | 14 (33.3%) | 51 (40.5%) |
| $1,500 to $1,999 | 0 (0.0%) | 12 (9.5%) |
| $2,000 to $2,499 | 0 (0.0%) | 0 (0.0%) |
| $2,500 to $2,999 | 0 (0.0%) | 0 (0.0%) |
| $3,000 or more | 0 (0.0%) | 18 (14.3%) |
| Total | 42 (100.0%) | 126 (100.0%) |
Physical Housing Characteristics in Union Deposit
Housing Structures in Union Deposit
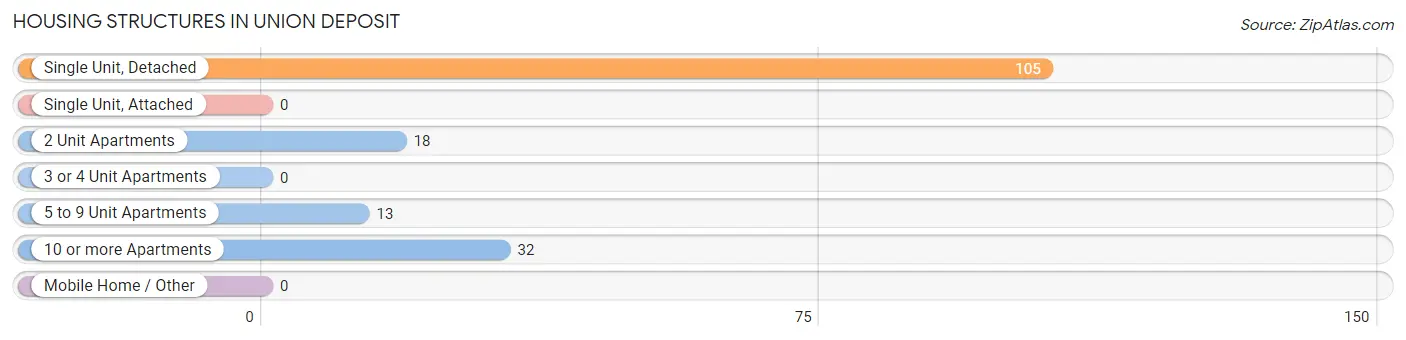
| Structure Type | # Housing Units | % Housing Units |
| Single Unit, Detached | 105 | 62.5% |
| Single Unit, Attached | 0 | 0.0% |
| 2 Unit Apartments | 18 | 10.7% |
| 3 or 4 Unit Apartments | 0 | 0.0% |
| 5 to 9 Unit Apartments | 13 | 7.7% |
| 10 or more Apartments | 32 | 19.1% |
| Mobile Home / Other | 0 | 0.0% |
| Total | 168 | 100.0% |
Housing Structures by Occupancy in Union Deposit
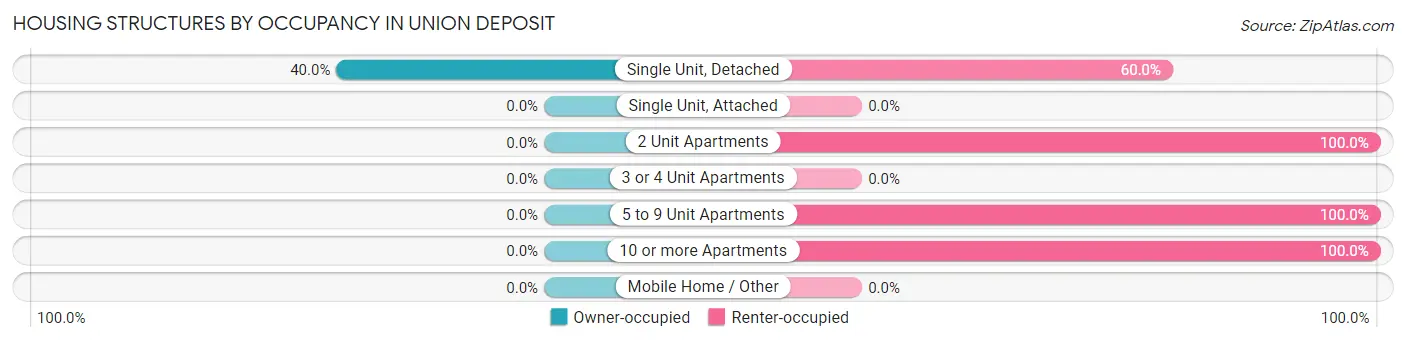
| Structure Type | Owner-occupied | Renter-occupied |
| Single Unit, Detached | 42 (40.0%) | 63 (60.0%) |
| Single Unit, Attached | 0 (0.0%) | 0 (0.0%) |
| 2 Unit Apartments | 0 (0.0%) | 18 (100.0%) |
| 3 or 4 Unit Apartments | 0 (0.0%) | 0 (0.0%) |
| 5 to 9 Unit Apartments | 0 (0.0%) | 13 (100.0%) |
| 10 or more Apartments | 0 (0.0%) | 32 (100.0%) |
| Mobile Home / Other | 0 (0.0%) | 0 (0.0%) |
| Total | 42 (25.0%) | 126 (75.0%) |
Housing Structures by Number of Rooms in Union Deposit
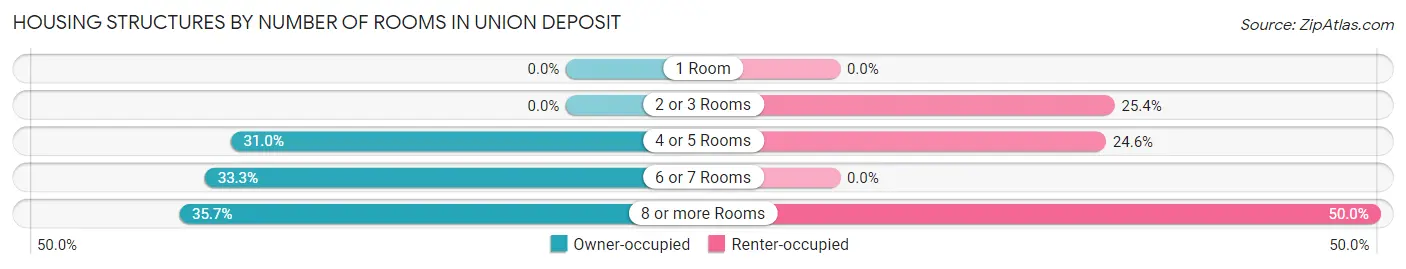
| Number of Rooms | Owner-occupied | Renter-occupied |
| 1 Room | 0 (0.0%) | 0 (0.0%) |
| 2 or 3 Rooms | 0 (0.0%) | 32 (25.4%) |
| 4 or 5 Rooms | 13 (30.9%) | 31 (24.6%) |
| 6 or 7 Rooms | 14 (33.3%) | 0 (0.0%) |
| 8 or more Rooms | 15 (35.7%) | 63 (50.0%) |
| Total | 42 (100.0%) | 126 (100.0%) |
Housing Structure by Heating Type in Union Deposit
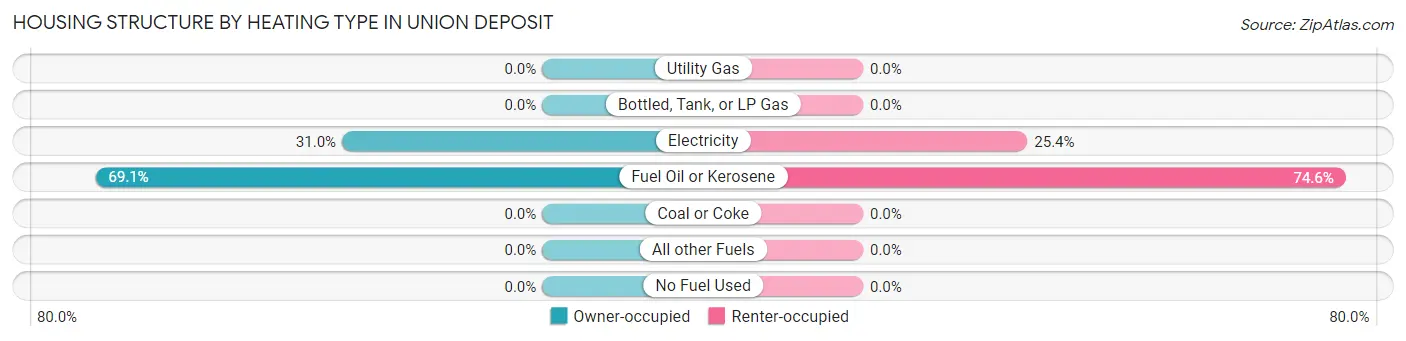
| Heating Type | Owner-occupied | Renter-occupied |
| Utility Gas | 0 (0.0%) | 0 (0.0%) |
| Bottled, Tank, or LP Gas | 0 (0.0%) | 0 (0.0%) |
| Electricity | 13 (30.9%) | 32 (25.4%) |
| Fuel Oil or Kerosene | 29 (69.1%) | 94 (74.6%) |
| Coal or Coke | 0 (0.0%) | 0 (0.0%) |
| All other Fuels | 0 (0.0%) | 0 (0.0%) |
| No Fuel Used | 0 (0.0%) | 0 (0.0%) |
| Total | 42 (100.0%) | 126 (100.0%) |
Household Vehicle Usage in Union Deposit
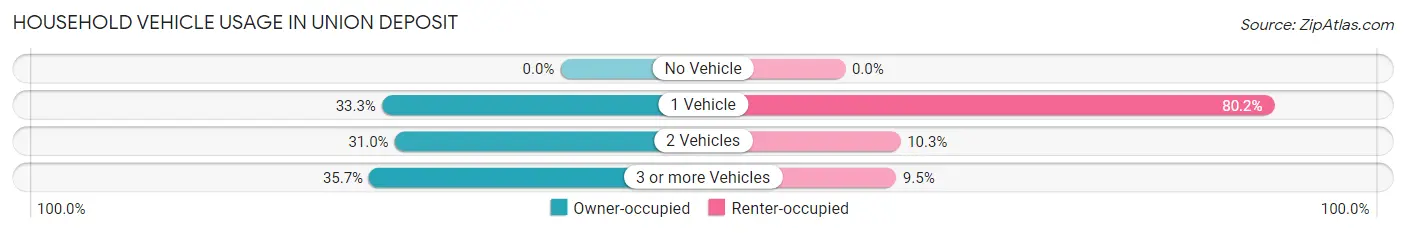
| Vehicles per Household | Owner-occupied | Renter-occupied |
| No Vehicle | 0 (0.0%) | 0 (0.0%) |
| 1 Vehicle | 14 (33.3%) | 101 (80.2%) |
| 2 Vehicles | 13 (30.9%) | 13 (10.3%) |
| 3 or more Vehicles | 15 (35.7%) | 12 (9.5%) |
| Total | 42 (100.0%) | 126 (100.0%) |
Real Estate & Mortgages in Union Deposit
Real Estate and Mortgage Overview in Union Deposit
| Characteristic | Without Mortgage | With Mortgage |
| Housing Units | 28 | 14 |
| Median Property Value | - | - |
| Median Household Income | - | - |
| Monthly Housing Costs | - | - |
| Real Estate Taxes | - | - |
Property Value by Mortgage Status in Union Deposit
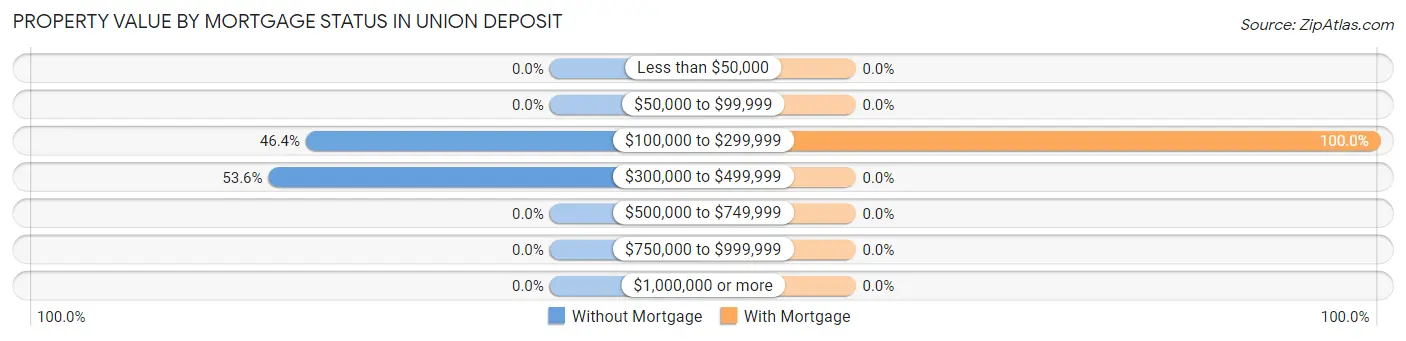
| Property Value | Without Mortgage | With Mortgage |
| Less than $50,000 | 0 (0.0%) | 0 (0.0%) |
| $50,000 to $99,999 | 0 (0.0%) | 0 (0.0%) |
| $100,000 to $299,999 | 13 (46.4%) | 14 (100.0%) |
| $300,000 to $499,999 | 15 (53.6%) | 0 (0.0%) |
| $500,000 to $749,999 | 0 (0.0%) | 0 (0.0%) |
| $750,000 to $999,999 | 0 (0.0%) | 0 (0.0%) |
| $1,000,000 or more | 0 (0.0%) | 0 (0.0%) |
| Total | 28 (100.0%) | 14 (100.0%) |
Household Income by Mortgage Status in Union Deposit
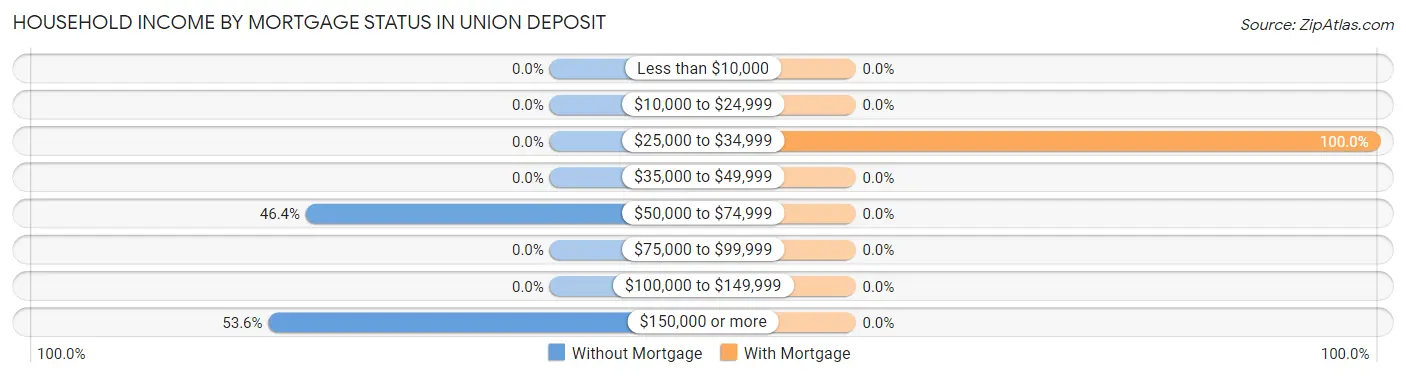
| Household Income | Without Mortgage | With Mortgage |
| Less than $10,000 | 0 (0.0%) | 0 (0.0%) |
| $10,000 to $24,999 | 0 (0.0%) | 0 (0.0%) |
| $25,000 to $34,999 | 0 (0.0%) | 14 (100.0%) |
| $35,000 to $49,999 | 0 (0.0%) | 0 (0.0%) |
| $50,000 to $74,999 | 13 (46.4%) | 0 (0.0%) |
| $75,000 to $99,999 | 0 (0.0%) | 0 (0.0%) |
| $100,000 to $149,999 | 0 (0.0%) | 0 (0.0%) |
| $150,000 or more | 15 (53.6%) | 0 (0.0%) |
| Total | 28 (100.0%) | 14 (100.0%) |
Property Value to Household Income Ratio in Union Deposit
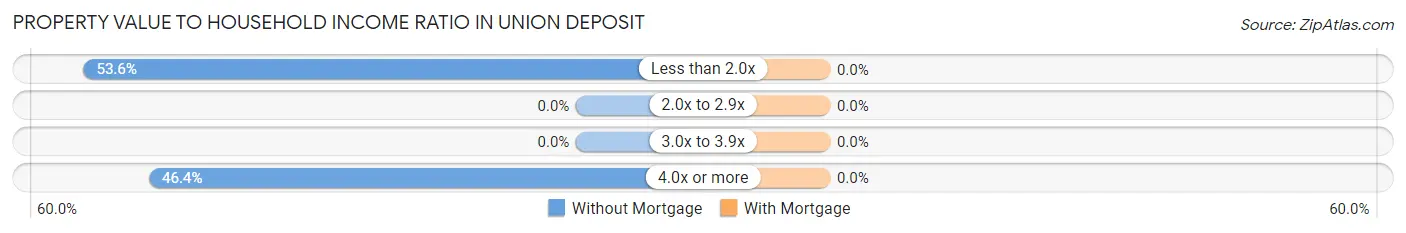
| Value-to-Income Ratio | Without Mortgage | With Mortgage |
| Less than 2.0x | 15 (53.6%) | 0 (0.0%) |
| 2.0x to 2.9x | 0 (0.0%) | 0 (0.0%) |
| 3.0x to 3.9x | 0 (0.0%) | 0 (0.0%) |
| 4.0x or more | 13 (46.4%) | 0 (0.0%) |
| Total | 28 (100.0%) | 14 (100.0%) |
Real Estate Taxes by Mortgage Status in Union Deposit
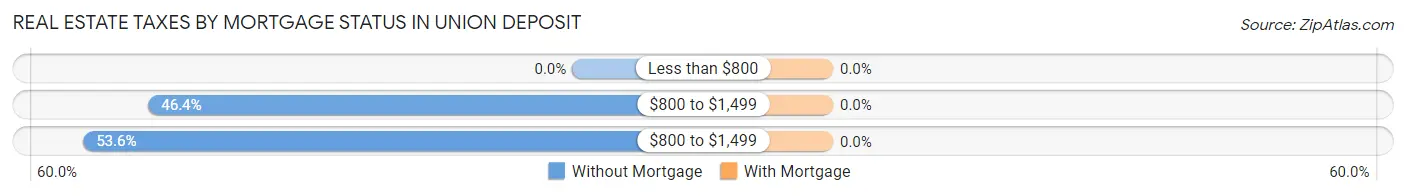
| Property Taxes | Without Mortgage | With Mortgage |
| Less than $800 | 0 (0.0%) | 0 (0.0%) |
| $800 to $1,499 | 13 (46.4%) | 0 (0.0%) |
| $800 to $1,499 | 15 (53.6%) | 0 (0.0%) |
| Total | 28 (100.0%) | 14 (100.0%) |
Health & Disability in Union Deposit
Health Insurance Coverage by Age in Union Deposit
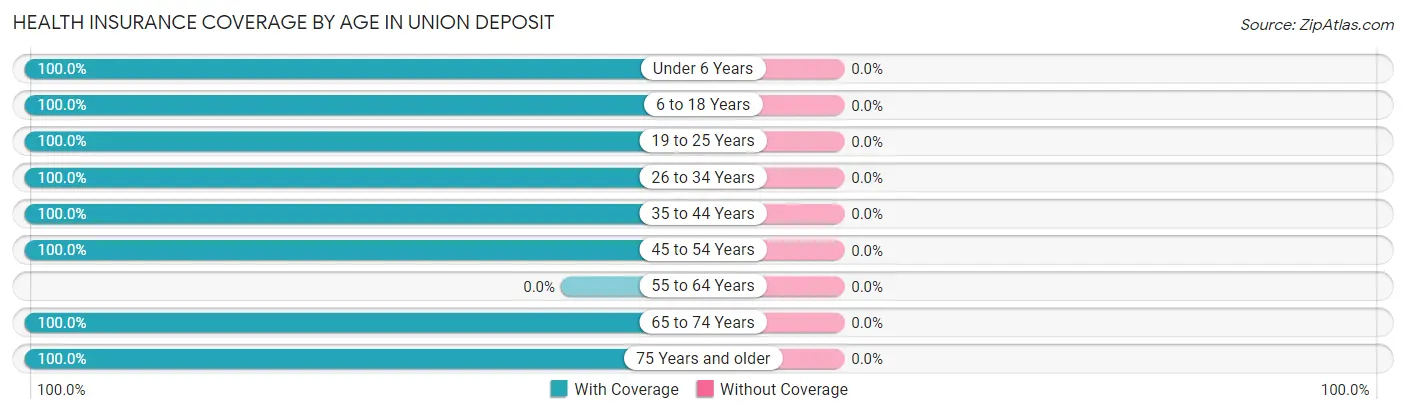
| Age Bracket | With Coverage | Without Coverage |
| Under 6 Years | 28 (100.0%) | 0 (0.0%) |
| 6 to 18 Years | 85 (100.0%) | 0 (0.0%) |
| 19 to 25 Years | 57 (100.0%) | 0 (0.0%) |
| 26 to 34 Years | 46 (100.0%) | 0 (0.0%) |
| 35 to 44 Years | 38 (100.0%) | 0 (0.0%) |
| 45 to 54 Years | 102 (100.0%) | 0 (0.0%) |
| 55 to 64 Years | 0 (0.0%) | 0 (0.0%) |
| 65 to 74 Years | 39 (100.0%) | 0 (0.0%) |
| 75 Years and older | 45 (100.0%) | 0 (0.0%) |
| Total | 440 (100.0%) | 0 (0.0%) |
Health Insurance Coverage by Citizenship Status in Union Deposit
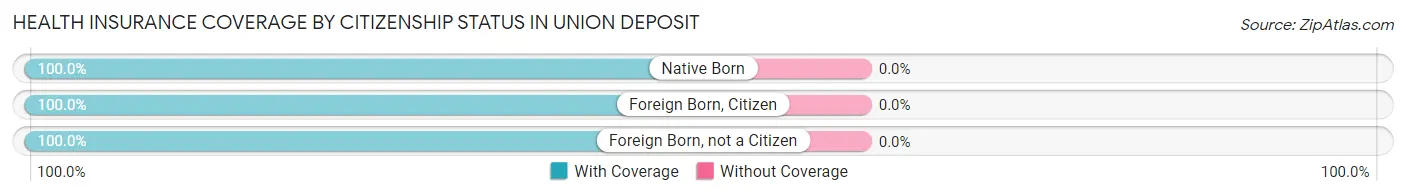
| Citizenship Status | With Coverage | Without Coverage |
| Native Born | 28 (100.0%) | 0 (0.0%) |
| Foreign Born, Citizen | 85 (100.0%) | 0 (0.0%) |
| Foreign Born, not a Citizen | 57 (100.0%) | 0 (0.0%) |
Health Insurance Coverage by Household Income in Union Deposit
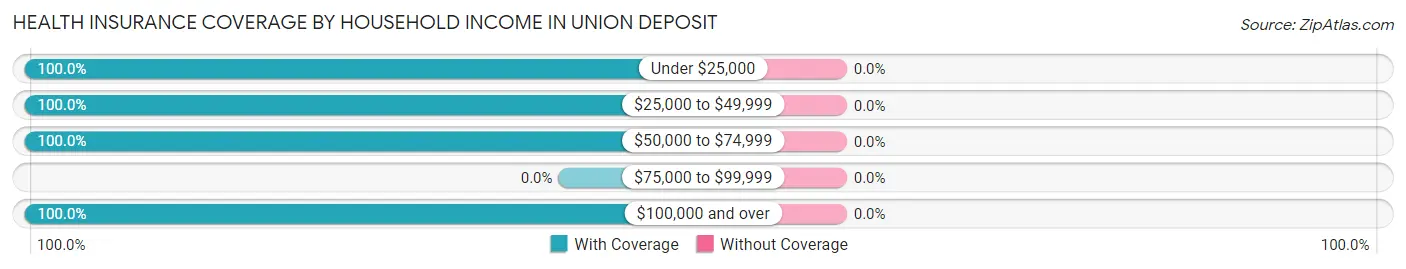
| Household Income | With Coverage | Without Coverage |
| Under $25,000 | 73 (100.0%) | 0 (0.0%) |
| $25,000 to $49,999 | 14 (100.0%) | 0 (0.0%) |
| $50,000 to $74,999 | 56 (100.0%) | 0 (0.0%) |
| $75,000 to $99,999 | 0 (0.0%) | 0 (0.0%) |
| $100,000 and over | 297 (100.0%) | 0 (0.0%) |
Public vs Private Health Insurance Coverage by Age in Union Deposit
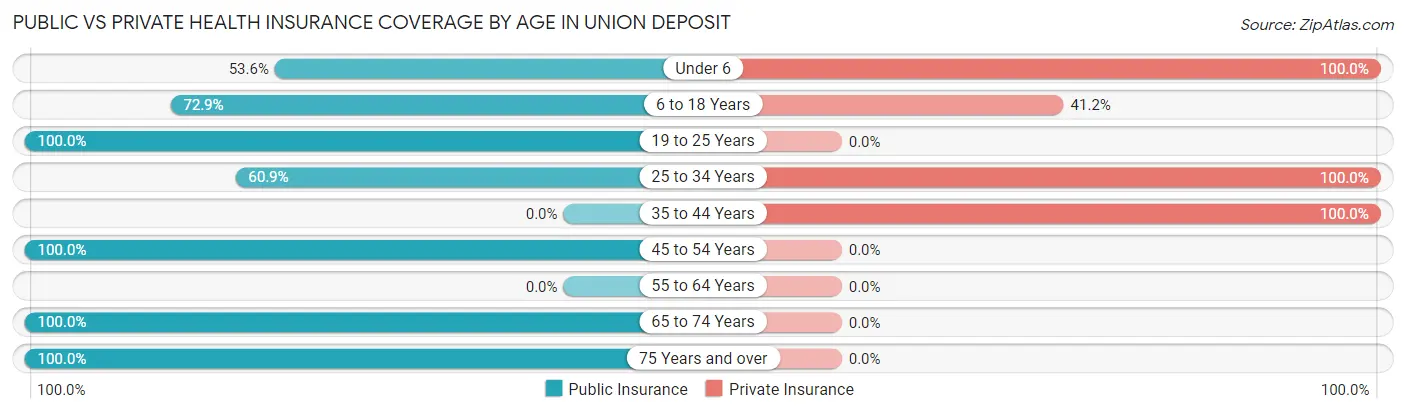
| Age Bracket | Public Insurance | Private Insurance |
| Under 6 | 15 (53.6%) | 28 (100.0%) |
| 6 to 18 Years | 62 (72.9%) | 35 (41.2%) |
| 19 to 25 Years | 57 (100.0%) | 0 (0.0%) |
| 25 to 34 Years | 28 (60.9%) | 46 (100.0%) |
| 35 to 44 Years | 0 (0.0%) | 38 (100.0%) |
| 45 to 54 Years | 102 (100.0%) | 0 (0.0%) |
| 55 to 64 Years | 0 (0.0%) | 0 (0.0%) |
| 65 to 74 Years | 39 (100.0%) | 0 (0.0%) |
| 75 Years and over | 45 (100.0%) | 0 (0.0%) |
| Total | 348 (79.1%) | 147 (33.4%) |
Disability Status by Sex by Age in Union Deposit
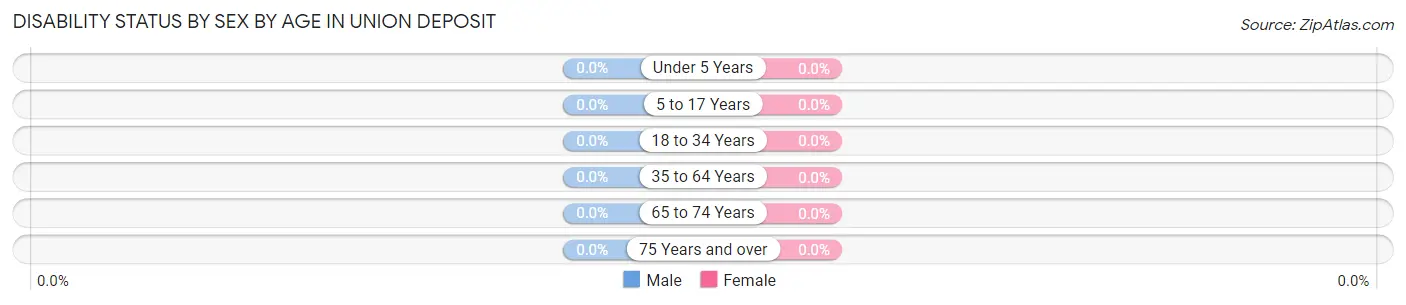
| Age Bracket | Male | Female |
| Under 5 Years | 0 (0.0%) | 0 (0.0%) |
| 5 to 17 Years | 0 (0.0%) | 0 (0.0%) |
| 18 to 34 Years | 0 (0.0%) | 0 (0.0%) |
| 35 to 64 Years | 0 (0.0%) | 0 (0.0%) |
| 65 to 74 Years | 0 (0.0%) | 0 (0.0%) |
| 75 Years and over | 0 (0.0%) | 0 (0.0%) |
Disability Class by Sex by Age in Union Deposit
Disability Class: Hearing Difficulty
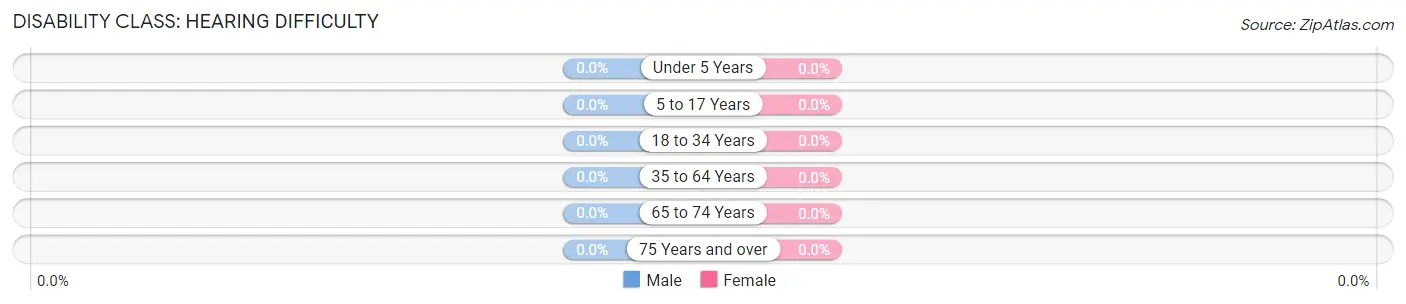
| Age Bracket | Male | Female |
| Under 5 Years | 0 (0.0%) | 0 (0.0%) |
| 5 to 17 Years | 0 (0.0%) | 0 (0.0%) |
| 18 to 34 Years | 0 (0.0%) | 0 (0.0%) |
| 35 to 64 Years | 0 (0.0%) | 0 (0.0%) |
| 65 to 74 Years | 0 (0.0%) | 0 (0.0%) |
| 75 Years and over | 0 (0.0%) | 0 (0.0%) |
Disability Class: Vision Difficulty
| Age Bracket | Male | Female |
| Under 5 Years | 0 (0.0%) | 0 (0.0%) |
| 5 to 17 Years | 0 (0.0%) | 0 (0.0%) |
| 18 to 34 Years | 0 (0.0%) | 0 (0.0%) |
| 35 to 64 Years | 0 (0.0%) | 0 (0.0%) |
| 65 to 74 Years | 0 (0.0%) | 0 (0.0%) |
| 75 Years and over | 0 (0.0%) | 0 (0.0%) |
Disability Class: Cognitive Difficulty
| Age Bracket | Male | Female |
| 5 to 17 Years | 0 (0.0%) | 0 (0.0%) |
| 18 to 34 Years | 0 (0.0%) | 0 (0.0%) |
| 35 to 64 Years | 0 (0.0%) | 0 (0.0%) |
| 65 to 74 Years | 0 (0.0%) | 0 (0.0%) |
| 75 Years and over | 0 (0.0%) | 0 (0.0%) |
Disability Class: Ambulatory Difficulty
| Age Bracket | Male | Female |
| 5 to 17 Years | 0 (0.0%) | 0 (0.0%) |
| 18 to 34 Years | 0 (0.0%) | 0 (0.0%) |
| 35 to 64 Years | 0 (0.0%) | 0 (0.0%) |
| 65 to 74 Years | 0 (0.0%) | 0 (0.0%) |
| 75 Years and over | 0 (0.0%) | 0 (0.0%) |
Disability Class: Self-Care Difficulty
| Age Bracket | Male | Female |
| 5 to 17 Years | 0 (0.0%) | 0 (0.0%) |
| 18 to 34 Years | 0 (0.0%) | 0 (0.0%) |
| 35 to 64 Years | 0 (0.0%) | 0 (0.0%) |
| 65 to 74 Years | 0 (0.0%) | 0 (0.0%) |
| 75 Years and over | 0 (0.0%) | 0 (0.0%) |
Technology Access in Union Deposit
Computing Device Access in Union Deposit
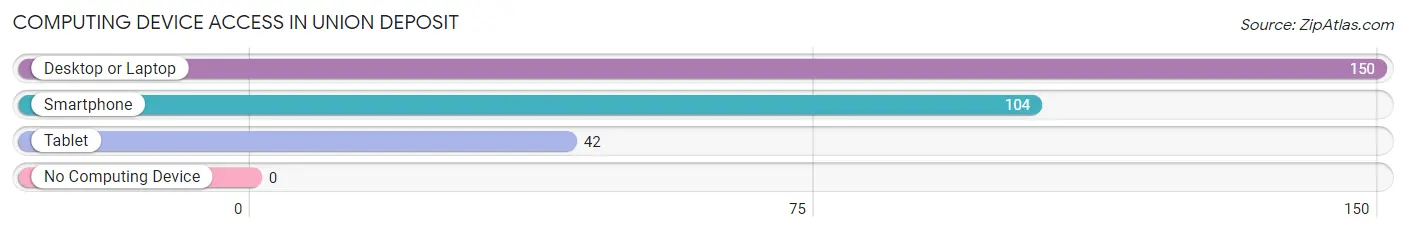
| Device Type | # Households | % Households |
| Desktop or Laptop | 150 | 89.3% |
| Smartphone | 104 | 61.9% |
| Tablet | 42 | 25.0% |
| No Computing Device | 0 | 0.0% |
| Total | 168 | 100.0% |
Internet Access in Union Deposit
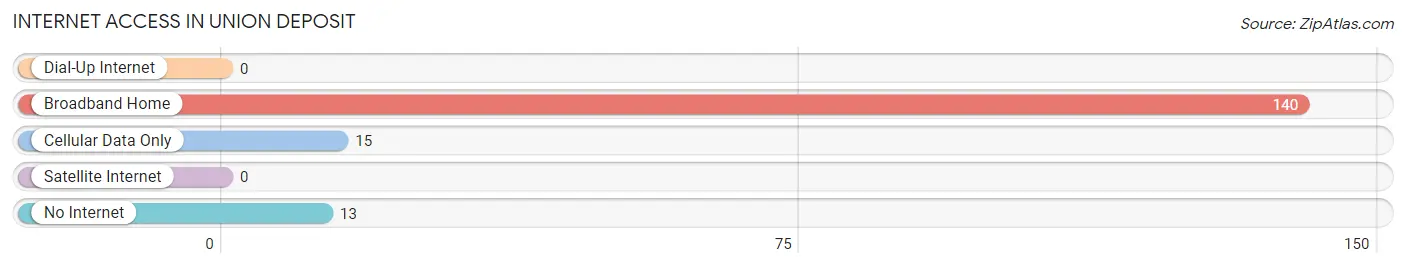
| Internet Type | # Households | % Households |
| Dial-Up Internet | 0 | 0.0% |
| Broadband Home | 140 | 83.3% |
| Cellular Data Only | 15 | 8.9% |
| Satellite Internet | 0 | 0.0% |
| No Internet | 13 | 7.7% |
| Total | 168 | 100.0% |
Union Deposit Summary
History
Union Deposit is a small unincorporated community located in Dauphin County, Pennsylvania. It is situated in the Susquehanna Valley, approximately 10 miles north of Harrisburg. The area was first settled in the late 1700s by German immigrants, who established a small farming community. The town was officially established in 1817, and was named for the Union Deposit Bank, which was founded in 1819.
The town grew slowly over the next few decades, and by the mid-1800s, it had become a thriving agricultural center. The town was home to several mills, including a grist mill, a saw mill, and a woolen mill. In addition, the town had a blacksmith, a tannery, and several stores.
In the late 1800s, the town began to experience a period of growth and prosperity. The Union Deposit Bank was a major contributor to this growth, as it provided loans to local businesses and farmers. The town also became a popular destination for tourists, as it was located near several popular attractions, such as the Hershey Park amusement park.
By the early 1900s, the town had become a bustling center of commerce and industry. The Union Deposit Bank had grown to become one of the largest banks in the state, and the town was home to several factories, including a cigar factory, a shoe factory, and a furniture factory.
The town continued to grow and prosper throughout the 20th century. In the 1950s, the town was home to several large businesses, including a paper mill, a steel mill, and a chemical plant. The town also had several retail stores, including a grocery store, a hardware store, and a drug store.
In the late 20th century, the town began to experience a period of decline. Many of the factories and businesses closed, and the population began to decline. Today, the town is a quiet, rural community, with a population of just over 1,000.
Geography
Union Deposit is located in the Susquehanna Valley, approximately 10 miles north of Harrisburg. The town is situated on the east bank of the Susquehanna River, and is surrounded by rolling hills and farmland. The town is located in a temperate climate, with hot summers and cold winters.
The town is home to several parks and recreational areas, including the Union Deposit Park, which features a playground, picnic areas, and a walking trail. The town is also home to several historic sites, including the Union Deposit Bank, which was founded in 1819.
Economy
Union Deposit is a small, rural community, and the economy is largely based on agriculture. The town is home to several farms, which produce a variety of crops, including corn, soybeans, and wheat. In addition, the town is home to several small businesses, including a grocery store, a hardware store, and a drug store.
The town is also home to several manufacturing companies, including a paper mill, a steel mill, and a chemical plant. These companies provide employment to many of the town’s residents.
Demographics
As of the 2010 census, the population of Union Deposit was 1,072. The town is predominantly white, with 92.3% of the population identifying as white. The town also has a small Hispanic population, with 4.2% of the population identifying as Hispanic or Latino. The median household income in the town is $45,000, and the median home value is $125,000.
Common Questions
What is Per Capita Income in Union Deposit?
Per Capita income in Union Deposit is $32,540.
What is the Median Family Income in Union Deposit?
Median Family Income in Union Deposit is $130,662.
What is Income or Wage Gap in Union Deposit?
Income or Wage Gap in Union Deposit is 30.6%.
Women in Union Deposit earn 69.4 cents for every dollar earned by a man.
What is Inequality or Gini Index in Union Deposit?
Inequality or Gini Index in Union Deposit is 0.30.
What is the Total Population of Union Deposit?
Total Population of Union Deposit is 440.
What is the Total Male Population of Union Deposit?
Total Male Population of Union Deposit is 218.
What is the Total Female Population of Union Deposit?
Total Female Population of Union Deposit is 222.
What is the Ratio of Males per 100 Females in Union Deposit?
There are 98.20 Males per 100 Females in Union Deposit.
What is the Ratio of Females per 100 Males in Union Deposit?
There are 101.83 Females per 100 Males in Union Deposit.
What is the Median Population Age in Union Deposit?
Median Population Age in Union Deposit is 37.3 Years.
What is the Average Family Size in Union Deposit
Average Family Size in Union Deposit is 3.5 People.
What is the Average Household Size in Union Deposit
Average Household Size in Union Deposit is 2.6 People.
How Large is the Labor Force in Union Deposit?
There are 255 People in the Labor Forcein in Union Deposit.
What is the Percentage of People in the Labor Force in Union Deposit?
78.0% of People are in the Labor Force in Union Deposit.