Titusville, PA Map & Demographics
Titusville Map
Titusville Overview
$21,948
PER CAPITA INCOME
$42,500
AVG FAMILY INCOME
$36,071
AVG HOUSEHOLD INCOME
0.9%
WAGE / INCOME GAP [ % ]
99.1¢/ $1
WAGE / INCOME GAP [ $ ]
0.43
INEQUALITY / GINI INDEX
5,262
TOTAL POPULATION
2,440
MALE POPULATION
2,822
FEMALE POPULATION
86.46
MALES / 100 FEMALES
115.66
FEMALES / 100 MALES
41.9
MEDIAN AGE
3.0
AVG FAMILY SIZE
2.1
AVG HOUSEHOLD SIZE
2,092
LABOR FORCE [ PEOPLE ]
48.3%
PERCENT IN LABOR FORCE
7.7%
UNEMPLOYMENT RATE
Titusville Zip Codes
Titusville Area Codes
Income in Titusville
Income Overview in Titusville
Per Capita Income in Titusville is $21,948, while median incomes of families and households are $42,500 and $36,071 respectively.
| Characteristic | Number | Measure |
| Per Capita Income | 5,262 | $21,948 |
| Median Family Income | 1,200 | $42,500 |
| Mean Family Income | 1,200 | $59,062 |
| Median Household Income | 2,340 | $36,071 |
| Mean Household Income | 2,340 | $46,817 |
| Income Deficit | 1,200 | $0 |
| Wage / Income Gap (%) | 5,262 | 0.94% |
| Wage / Income Gap ($) | 5,262 | 99.06¢ per $1 |
| Gini / Inequality Index | 5,262 | 0.43 |
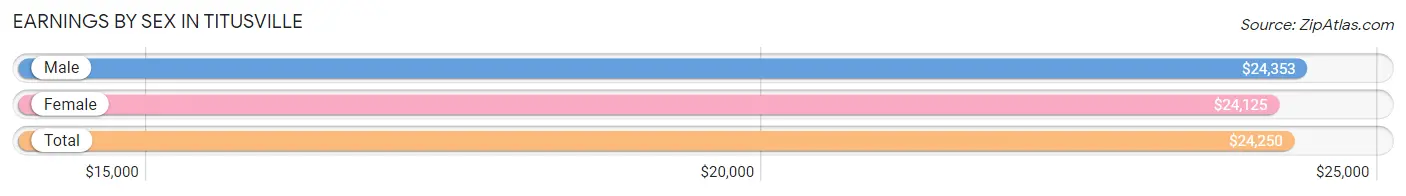
Earnings by Sex in Titusville
Average Earnings in Titusville are $24,250, $24,353 for men and $24,125 for women, a difference of 0.9%.
| Sex | Number | Average Earnings |
| Male | 1,072 (47.4%) | $24,353 |
| Female | 1,189 (52.6%) | $24,125 |
| Total | 2,261 (100.0%) | $24,250 |
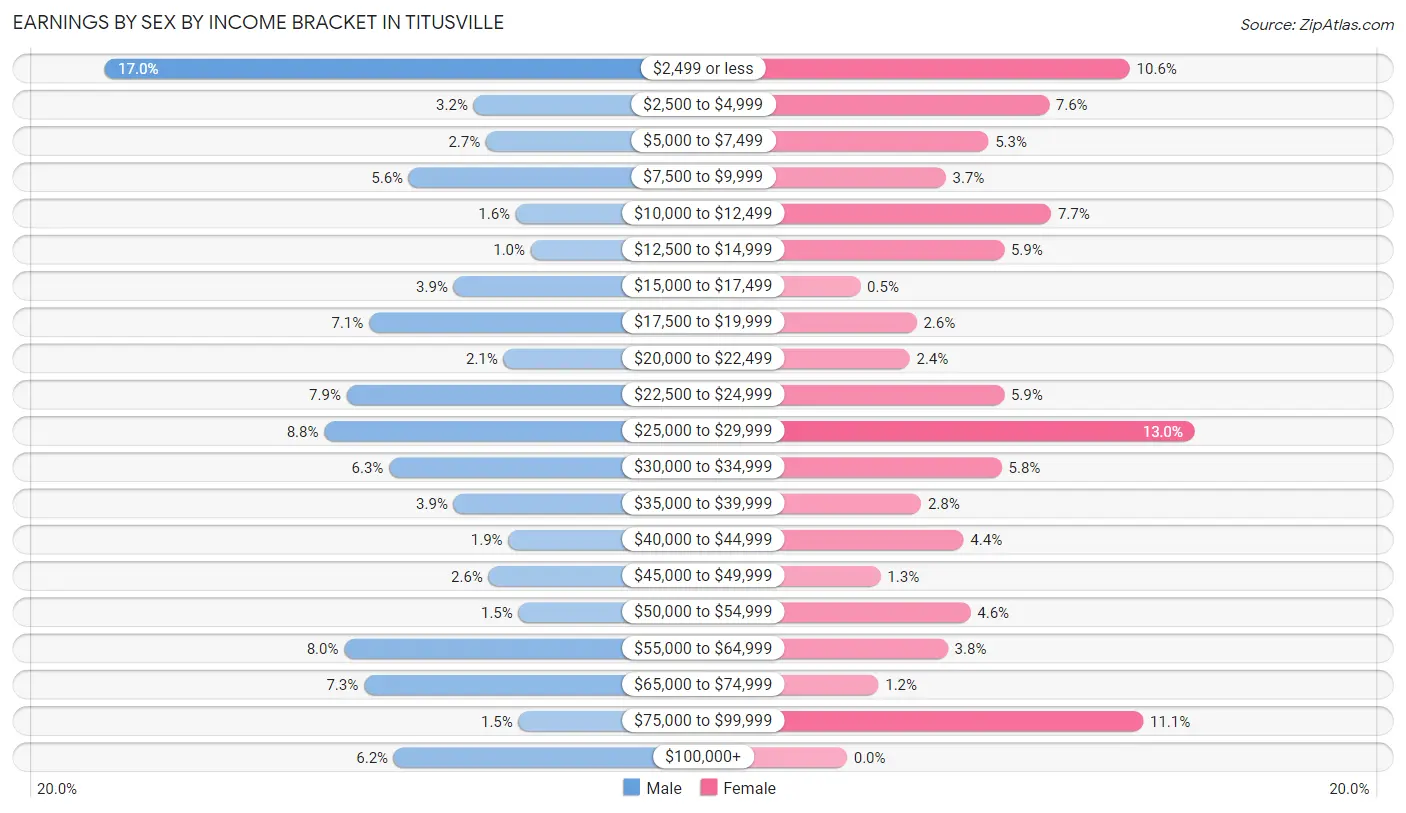
Earnings by Sex by Income Bracket in Titusville
The most common earnings brackets in Titusville are $2,499 or less for men (182 | 17.0%) and $25,000 to $29,999 for women (155 | 13.0%).
| Income | Male | Female |
| $2,499 or less | 182 (17.0%) | 126 (10.6%) |
| $2,500 to $4,999 | 34 (3.2%) | 90 (7.6%) |
| $5,000 to $7,499 | 29 (2.7%) | 63 (5.3%) |
| $7,500 to $9,999 | 60 (5.6%) | 44 (3.7%) |
| $10,000 to $12,499 | 17 (1.6%) | 91 (7.6%) |
| $12,500 to $14,999 | 11 (1.0%) | 70 (5.9%) |
| $15,000 to $17,499 | 42 (3.9%) | 6 (0.5%) |
| $17,500 to $19,999 | 76 (7.1%) | 31 (2.6%) |
| $20,000 to $22,499 | 22 (2.1%) | 28 (2.4%) |
| $22,500 to $24,999 | 85 (7.9%) | 70 (5.9%) |
| $25,000 to $29,999 | 94 (8.8%) | 155 (13.0%) |
| $30,000 to $34,999 | 68 (6.3%) | 69 (5.8%) |
| $35,000 to $39,999 | 42 (3.9%) | 33 (2.8%) |
| $40,000 to $44,999 | 20 (1.9%) | 52 (4.4%) |
| $45,000 to $49,999 | 28 (2.6%) | 15 (1.3%) |
| $50,000 to $54,999 | 16 (1.5%) | 55 (4.6%) |
| $55,000 to $64,999 | 86 (8.0%) | 45 (3.8%) |
| $65,000 to $74,999 | 78 (7.3%) | 14 (1.2%) |
| $75,000 to $99,999 | 16 (1.5%) | 132 (11.1%) |
| $100,000+ | 66 (6.2%) | 0 (0.0%) |
| Total | 1,072 (100.0%) | 1,189 (100.0%) |
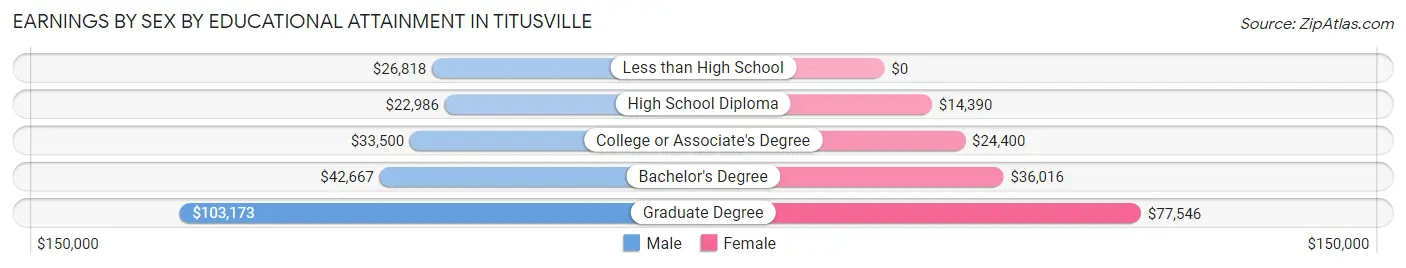
Earnings by Sex by Educational Attainment in Titusville
Average earnings in Titusville are $29,844 for men and $24,982 for women, a difference of 16.3%. Men with an educational attainment of graduate degree enjoy the highest average annual earnings of $103,173, while those with high school diploma education earn the least with $22,986. Women with an educational attainment of graduate degree earn the most with the average annual earnings of $77,546, while those with high school diploma education have the smallest earnings of $14,390.
| Educational Attainment | Male Income | Female Income |
| Less than High School | $26,818 | $0 |
| High School Diploma | $22,986 | $14,390 |
| College or Associate's Degree | $33,500 | $24,400 |
| Bachelor's Degree | $42,667 | $36,016 |
| Graduate Degree | $103,173 | $77,546 |
| Total | $29,844 | $24,982 |
Family Income in Titusville
Family Income Brackets in Titusville
According to the Titusville family income data, there are 289 families falling into the $35,000 to $49,999 income range, which is the most common income bracket and makes up 24.1% of all families. Conversely, the $200,000+ income bracket is the least frequent group with only 5 families (0.4%) belonging to this category.
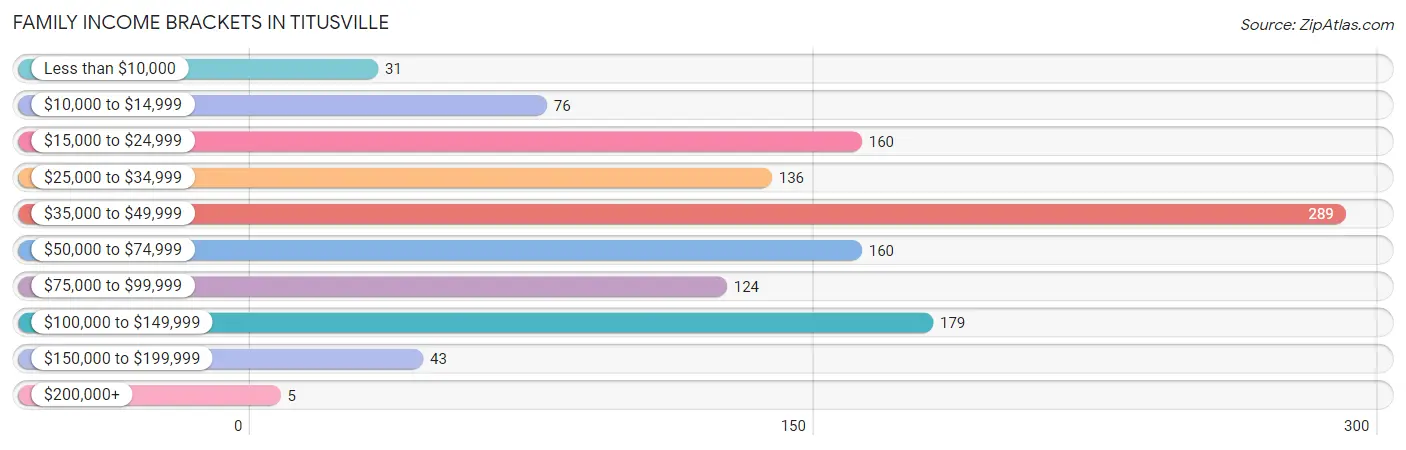
| Income Bracket | # Families | % Families |
| Less than $10,000 | 31 | 2.6% |
| $10,000 to $14,999 | 76 | 6.3% |
| $15,000 to $24,999 | 160 | 13.3% |
| $25,000 to $34,999 | 136 | 11.3% |
| $35,000 to $49,999 | 289 | 24.1% |
| $50,000 to $74,999 | 160 | 13.3% |
| $75,000 to $99,999 | 124 | 10.3% |
| $100,000 to $149,999 | 179 | 14.9% |
| $150,000 to $199,999 | 43 | 3.6% |
| $200,000+ | 5 | 0.4% |
Family Income by Famaliy Size in Titusville
4-person families (164 | 13.7%) account for the highest median family income in Titusville with $70,530 per family, while 2-person families (671 | 55.9%) have the highest median income of $20,768 per family member.
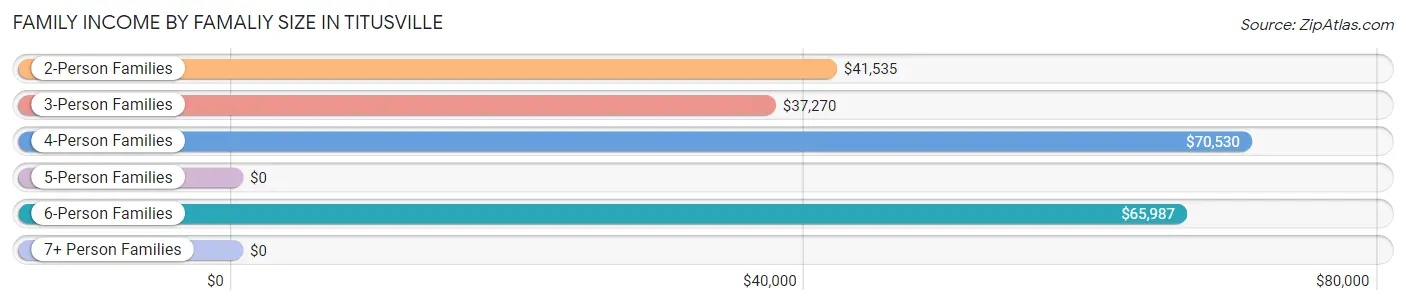
| Income Bracket | # Families | Median Income |
| 2-Person Families | 671 (55.9%) | $41,535 |
| 3-Person Families | 193 (16.1%) | $37,270 |
| 4-Person Families | 164 (13.7%) | $70,530 |
| 5-Person Families | 92 (7.7%) | $0 |
| 6-Person Families | 71 (5.9%) | $65,987 |
| 7+ Person Families | 9 (0.7%) | $0 |
| Total | 1,200 (100.0%) | $42,500 |
Family Income by Number of Earners in Titusville
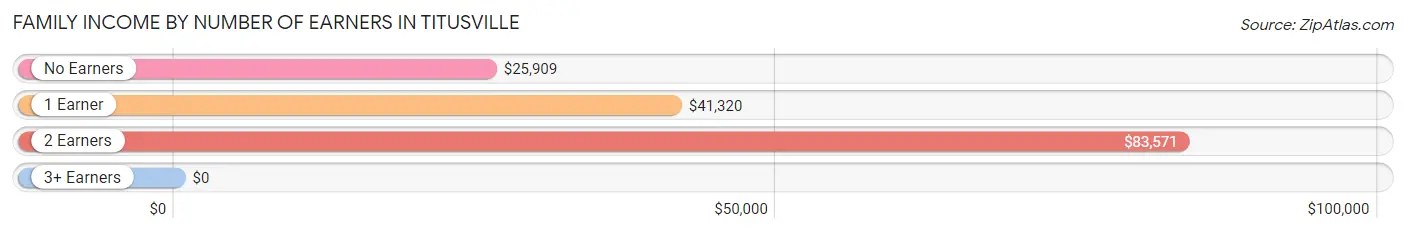
| Number of Earners | # Families | Median Income |
| No Earners | 304 (25.3%) | $25,909 |
| 1 Earner | 417 (34.7%) | $41,320 |
| 2 Earners | 406 (33.8%) | $83,571 |
| 3+ Earners | 73 (6.1%) | $0 |
| Total | 1,200 (100.0%) | $42,500 |
Household Income in Titusville
Household Income Brackets in Titusville
With 438 households falling in the category, the $15,000 to $24,999 income range is the most frequent in Titusville, accounting for 18.7% of all households. In contrast, only 5 households (0.2%) fall into the $200,000+ income bracket, making it the least populous group.
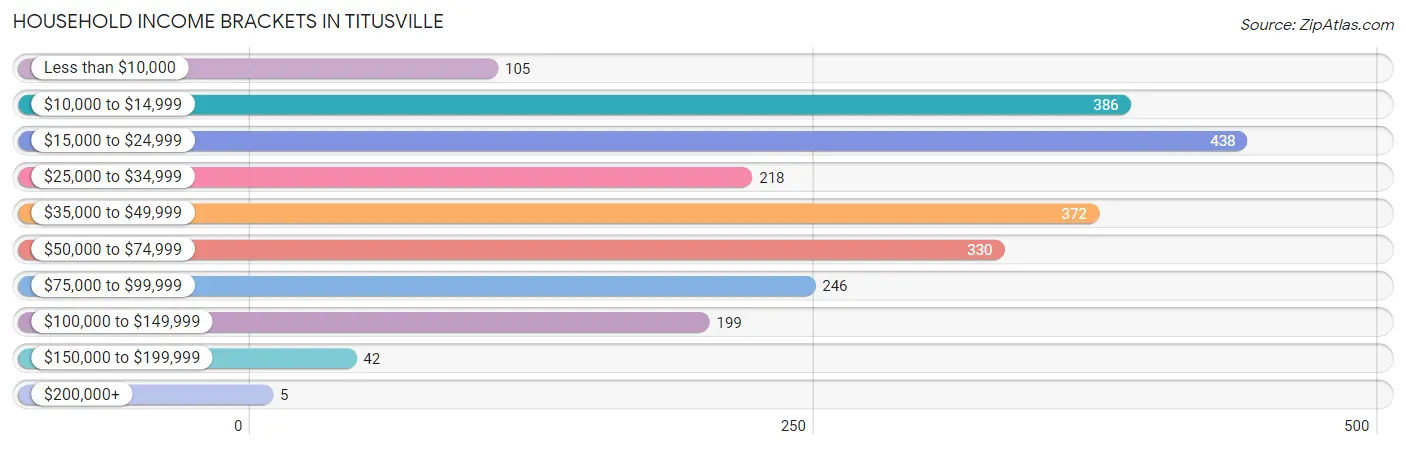
| Income Bracket | # Households | % Households |
| Less than $10,000 | 105 | 4.5% |
| $10,000 to $14,999 | 386 | 16.5% |
| $15,000 to $24,999 | 438 | 18.7% |
| $25,000 to $34,999 | 218 | 9.3% |
| $35,000 to $49,999 | 372 | 15.9% |
| $50,000 to $74,999 | 330 | 14.1% |
| $75,000 to $99,999 | 246 | 10.5% |
| $100,000 to $149,999 | 199 | 8.5% |
| $150,000 to $199,999 | 42 | 1.8% |
| $200,000+ | 5 | 0.2% |
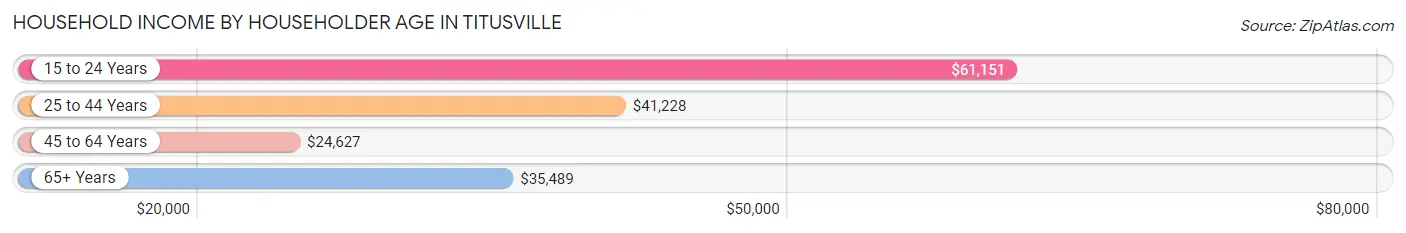
Household Income by Householder Age in Titusville
The median household income in Titusville is $36,071, with the highest median household income of $61,151 found in the 15 to 24 years age bracket for the primary householder. A total of 65 households (2.8%) fall into this category. Meanwhile, the 45 to 64 years age bracket for the primary householder has the lowest median household income of $24,627, with 931 households (39.8%) in this group.
| Income Bracket | # Households | Median Income |
| 15 to 24 Years | 65 (2.8%) | $61,151 |
| 25 to 44 Years | 499 (21.3%) | $41,228 |
| 45 to 64 Years | 931 (39.8%) | $24,627 |
| 65+ Years | 845 (36.1%) | $35,489 |
| Total | 2,340 (100.0%) | $36,071 |
Poverty in Titusville
Income Below Poverty by Sex and Age in Titusville
With 21.8% poverty level for males and 25.3% for females among the residents of Titusville, 16 and 17 year old males and 15 year old females are the most vulnerable to poverty, with 62 males (64.6%) and 14 females (58.3%) in their respective age groups living below the poverty level.
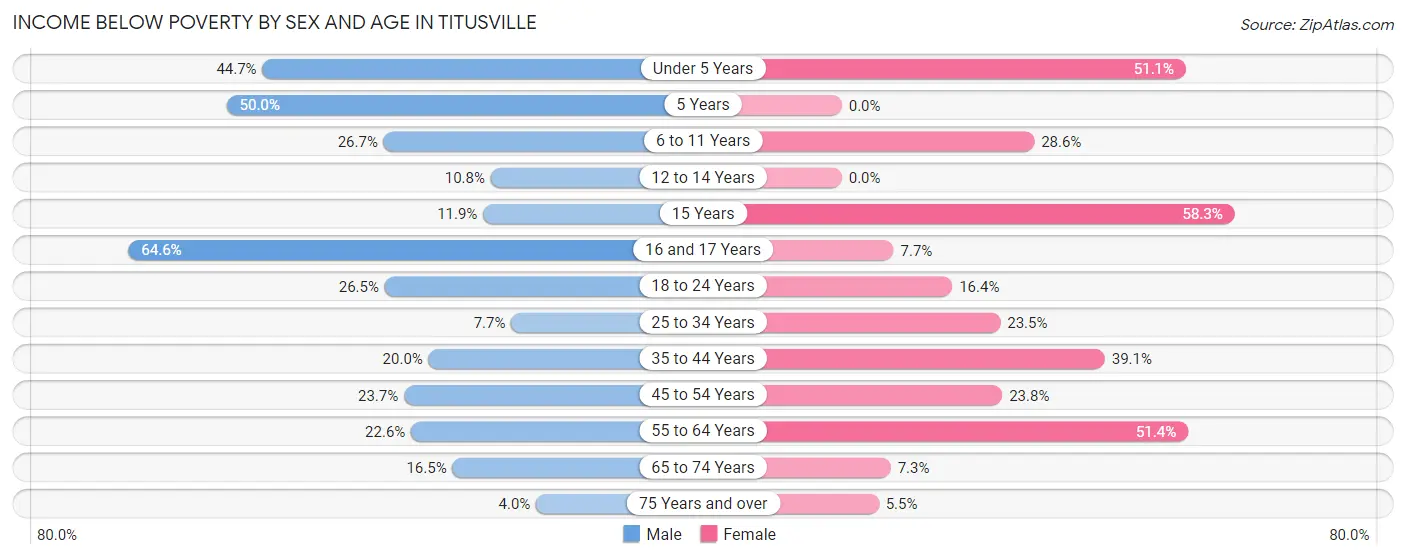
| Age Bracket | Male | Female |
| Under 5 Years | 42 (44.7%) | 47 (51.1%) |
| 5 Years | 23 (50.0%) | 0 (0.0%) |
| 6 to 11 Years | 64 (26.7%) | 48 (28.6%) |
| 12 to 14 Years | 11 (10.8%) | 0 (0.0%) |
| 15 Years | 5 (11.9%) | 14 (58.3%) |
| 16 and 17 Years | 62 (64.6%) | 4 (7.7%) |
| 18 to 24 Years | 66 (26.5%) | 31 (16.4%) |
| 25 to 34 Years | 18 (7.7%) | 72 (23.5%) |
| 35 to 44 Years | 43 (20.0%) | 100 (39.1%) |
| 45 to 54 Years | 48 (23.6%) | 91 (23.8%) |
| 55 to 64 Years | 66 (22.6%) | 220 (51.4%) |
| 65 to 74 Years | 53 (16.5%) | 25 (7.3%) |
| 75 Years and over | 8 (4.0%) | 17 (5.5%) |
| Total | 509 (21.8%) | 669 (25.3%) |
Income Above Poverty by Sex and Age in Titusville
According to the poverty statistics in Titusville, males aged 75 years and over and females aged 5 years are the age groups that are most secure financially, with 96.0% of males and 100.0% of females in these age groups living above the poverty line.
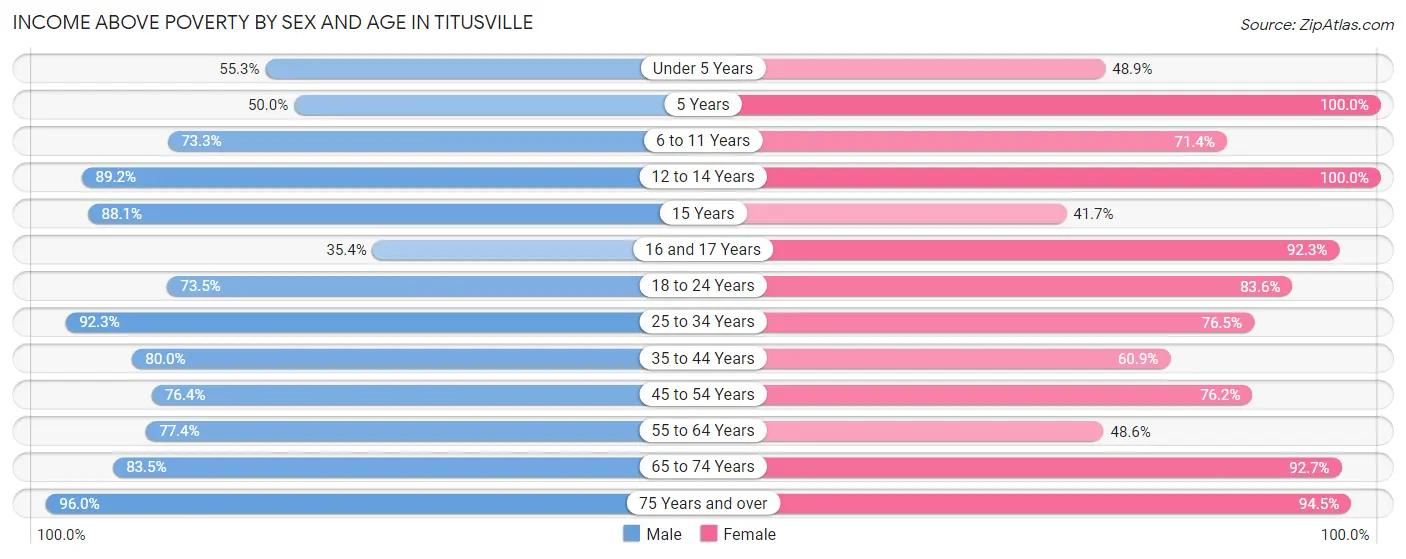
| Age Bracket | Male | Female |
| Under 5 Years | 52 (55.3%) | 45 (48.9%) |
| 5 Years | 23 (50.0%) | 8 (100.0%) |
| 6 to 11 Years | 176 (73.3%) | 120 (71.4%) |
| 12 to 14 Years | 91 (89.2%) | 89 (100.0%) |
| 15 Years | 37 (88.1%) | 10 (41.7%) |
| 16 and 17 Years | 34 (35.4%) | 48 (92.3%) |
| 18 to 24 Years | 183 (73.5%) | 158 (83.6%) |
| 25 to 34 Years | 215 (92.3%) | 234 (76.5%) |
| 35 to 44 Years | 172 (80.0%) | 156 (60.9%) |
| 45 to 54 Years | 155 (76.3%) | 291 (76.2%) |
| 55 to 64 Years | 226 (77.4%) | 208 (48.6%) |
| 65 to 74 Years | 269 (83.5%) | 319 (92.7%) |
| 75 Years and over | 190 (96.0%) | 293 (94.5%) |
| Total | 1,823 (78.2%) | 1,979 (74.7%) |
Income Below Poverty Among Married-Couple Families in Titusville
The poverty statistics for married-couple families in Titusville show that 8.3% or 66 of the total 792 families live below the poverty line. Families with 1 or 2 children have the highest poverty rate of 9.4%, comprising of 15 families. On the other hand, families with 3 or 4 children have the lowest poverty rate of 6.4%, which includes 8 families.
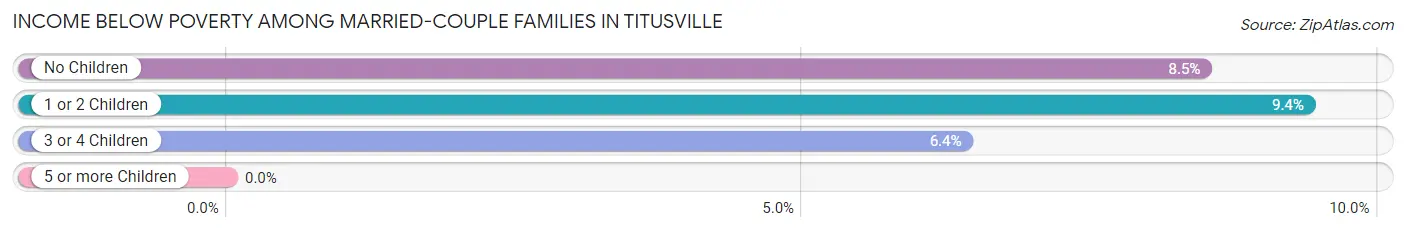
| Children | Above Poverty | Below Poverty |
| No Children | 464 (91.5%) | 43 (8.5%) |
| 1 or 2 Children | 145 (90.6%) | 15 (9.4%) |
| 3 or 4 Children | 117 (93.6%) | 8 (6.4%) |
| 5 or more Children | 0 (0.0%) | 0 (0.0%) |
| Total | 726 (91.7%) | 66 (8.3%) |
Income Below Poverty Among Single-Parent Households in Titusville
According to the poverty data in Titusville, 59.3% or 16 single-father households and 35.2% or 134 single-mother households are living below the poverty line. Among single-father households, those with 3 or 4 children have the highest poverty rate, with 7 households (100.0%) experiencing poverty. Likewise, among single-mother households, those with 3 or 4 children have the highest poverty rate, with 49 households (100.0%) falling below the poverty line.
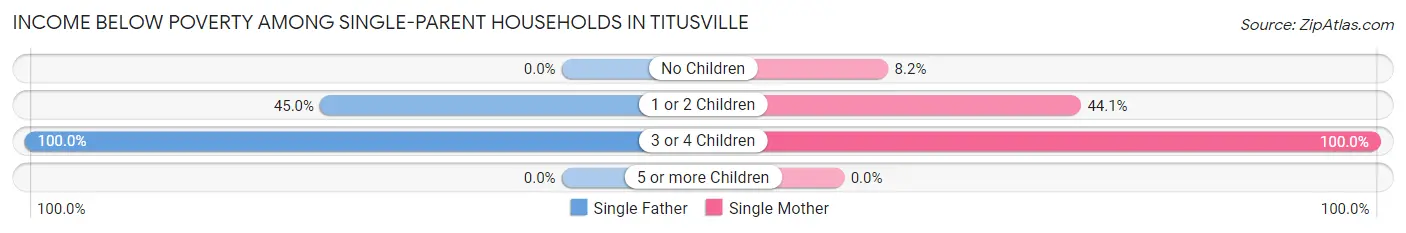
| Children | Single Father | Single Mother |
| No Children | 0 (0.0%) | 14 (8.2%) |
| 1 or 2 Children | 9 (45.0%) | 71 (44.1%) |
| 3 or 4 Children | 7 (100.0%) | 49 (100.0%) |
| 5 or more Children | 0 (0.0%) | 0 (0.0%) |
| Total | 16 (59.3%) | 134 (35.2%) |
Income Below Poverty Among Married-Couple vs Single-Parent Households in Titusville
The poverty data for Titusville shows that 66 of the married-couple family households (8.3%) and 150 of the single-parent households (36.8%) are living below the poverty level. Within the married-couple family households, those with 1 or 2 children have the highest poverty rate, with 15 households (9.4%) falling below the poverty line. Among the single-parent households, those with 3 or 4 children have the highest poverty rate, with 56 household (100.0%) living below poverty.
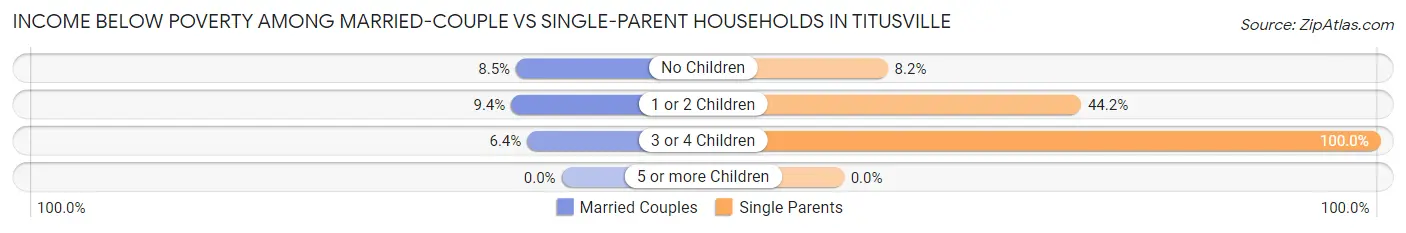
| Children | Married-Couple Families | Single-Parent Households |
| No Children | 43 (8.5%) | 14 (8.2%) |
| 1 or 2 Children | 15 (9.4%) | 80 (44.2%) |
| 3 or 4 Children | 8 (6.4%) | 56 (100.0%) |
| 5 or more Children | 0 (0.0%) | 0 (0.0%) |
| Total | 66 (8.3%) | 150 (36.8%) |
Race in Titusville
The most populous races in Titusville are White / Caucasian (4,969 | 94.4%), Black / African American (91 | 1.7%), and Some other Race (87 | 1.7%).
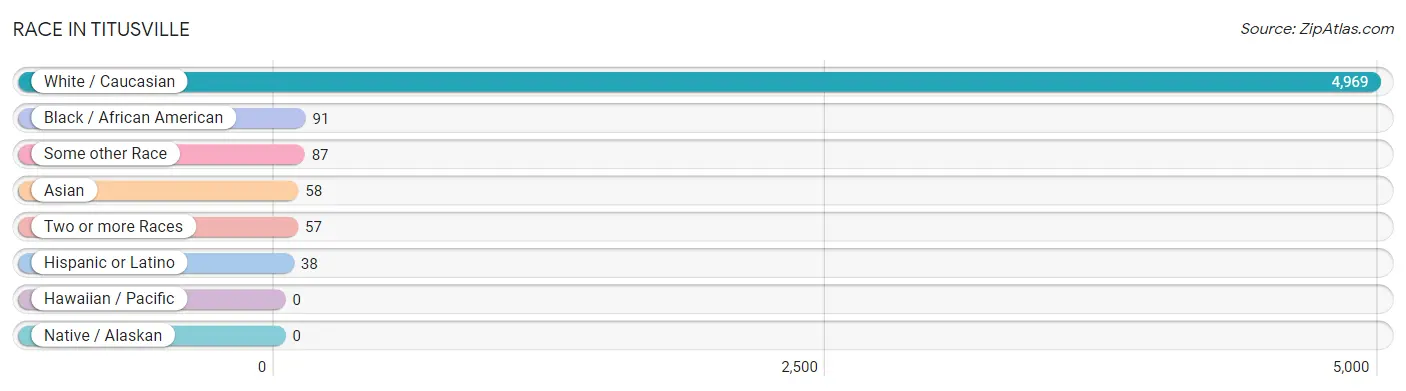
| Race | # Population | % Population |
| Asian | 58 | 1.1% |
| Black / African American | 91 | 1.7% |
| Hawaiian / Pacific | 0 | 0.0% |
| Hispanic or Latino | 38 | 0.7% |
| Native / Alaskan | 0 | 0.0% |
| White / Caucasian | 4,969 | 94.4% |
| Two or more Races | 57 | 1.1% |
| Some other Race | 87 | 1.7% |
| Total | 5,262 | 100.0% |
Ancestry in Titusville
The most populous ancestries reported in Titusville are German (887 | 16.9%), Irish (760 | 14.4%), English (733 | 13.9%), Swedish (347 | 6.6%), and Polish (343 | 6.5%), together accounting for 58.3% of all Titusville residents.
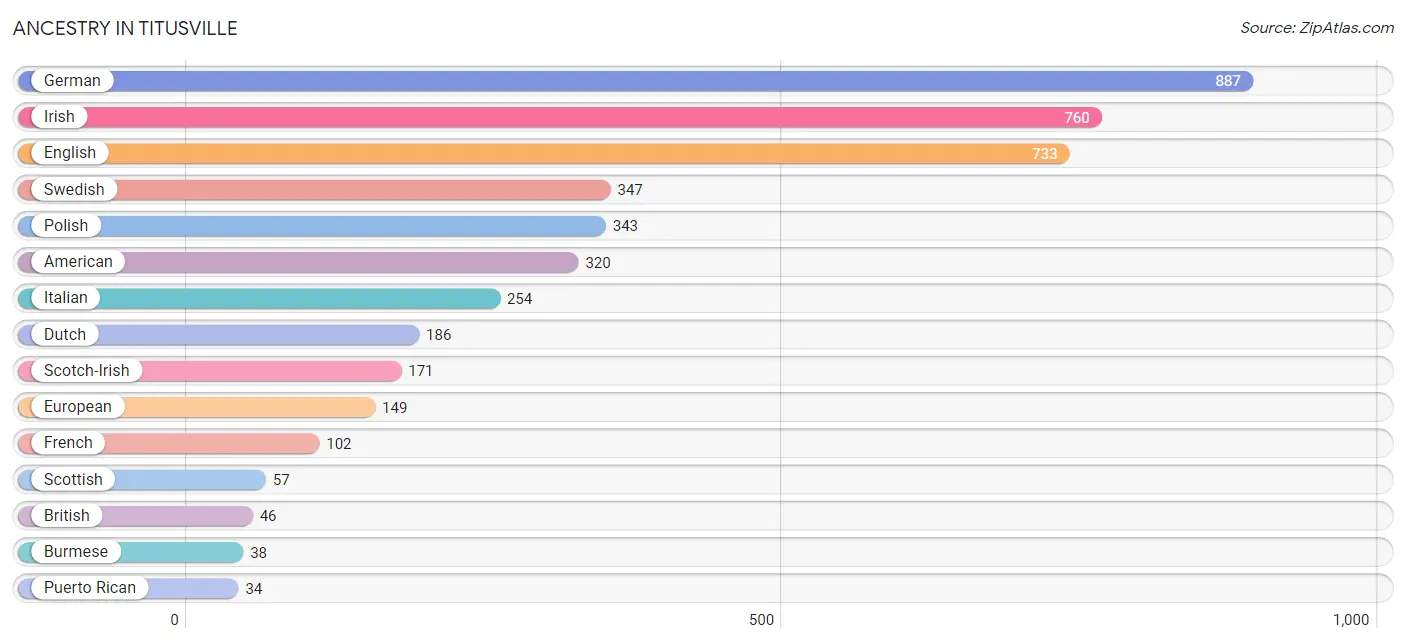
| Ancestry | # Population | % Population |
| American | 320 | 6.1% |
| Austrian | 8 | 0.2% |
| Bhutanese | 9 | 0.2% |
| British | 46 | 0.9% |
| Burmese | 38 | 0.7% |
| Carpatho Rusyn | 15 | 0.3% |
| Croatian | 7 | 0.1% |
| Czech | 21 | 0.4% |
| Danish | 5 | 0.1% |
| Dutch | 186 | 3.5% |
| English | 733 | 13.9% |
| European | 149 | 2.8% |
| Finnish | 10 | 0.2% |
| French | 102 | 1.9% |
| French Canadian | 20 | 0.4% |
| German | 887 | 16.9% |
| Greek | 8 | 0.2% |
| Hungarian | 19 | 0.4% |
| Irish | 760 | 14.4% |
| Italian | 254 | 4.8% |
| Pennsylvania German | 6 | 0.1% |
| Peruvian | 4 | 0.1% |
| Polish | 343 | 6.5% |
| Portuguese | 9 | 0.2% |
| Puerto Rican | 34 | 0.6% |
| Scotch-Irish | 171 | 3.3% |
| Scottish | 57 | 1.1% |
| Serbian | 21 | 0.4% |
| Slovak | 18 | 0.3% |
| South American | 4 | 0.1% |
| Sri Lankan | 15 | 0.3% |
| Swedish | 347 | 6.6% |
| Welsh | 14 | 0.3% | View All 33 Rows |
Immigrants in Titusville
The most numerous immigrant groups reported in Titusville came from Asia (38 | 0.7%), Eastern Asia (26 | 0.5%), Korea (21 | 0.4%), Europe (17 | 0.3%), and South Eastern Asia (12 | 0.2%), together accounting for 2.2% of all Titusville residents.
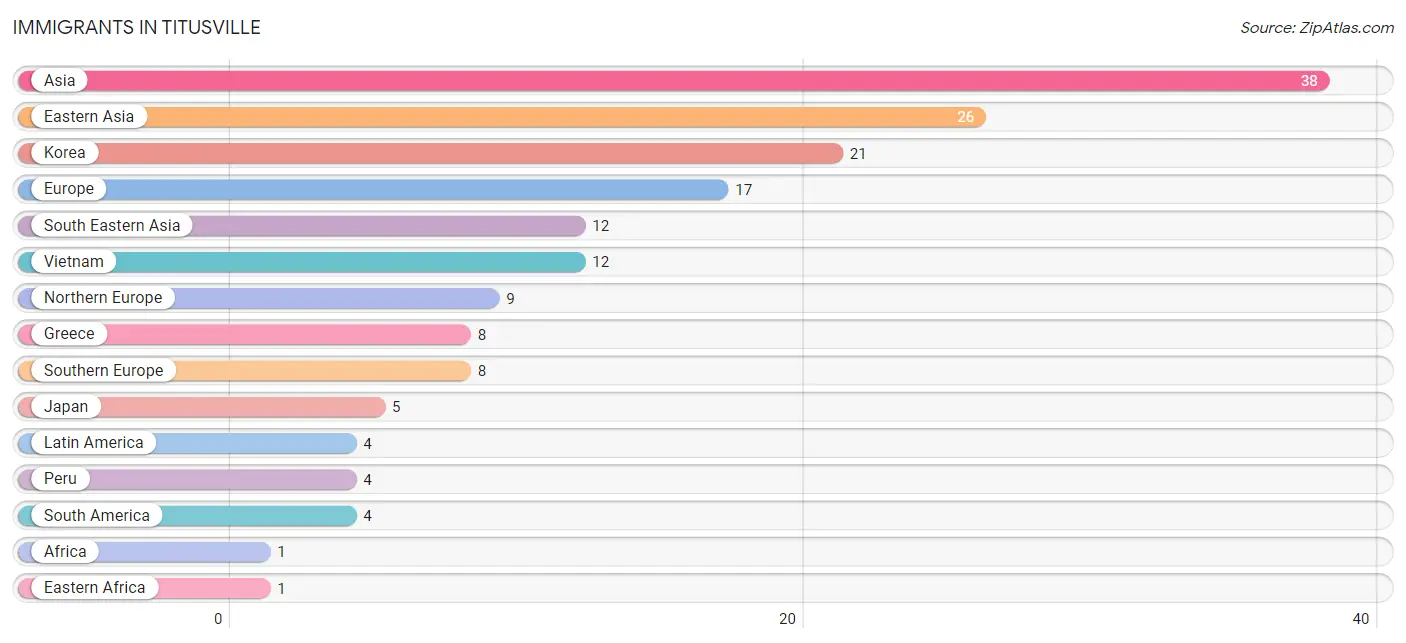
| Immigration Origin | # Population | % Population |
| Africa | 1 | 0.0% |
| Asia | 38 | 0.7% |
| Eastern Africa | 1 | 0.0% |
| Eastern Asia | 26 | 0.5% |
| Europe | 17 | 0.3% |
| Greece | 8 | 0.2% |
| Japan | 5 | 0.1% |
| Korea | 21 | 0.4% |
| Latin America | 4 | 0.1% |
| Northern Europe | 9 | 0.2% |
| Peru | 4 | 0.1% |
| Somalia | 1 | 0.0% |
| South America | 4 | 0.1% |
| South Eastern Asia | 12 | 0.2% |
| Southern Europe | 8 | 0.2% |
| Vietnam | 12 | 0.2% | View All 16 Rows |
Sex and Age in Titusville
Sex and Age in Titusville
The most populous age groups in Titusville are 15 to 19 Years (260 | 10.7%) for men and 45 to 49 Years (219 | 7.8%) for women.
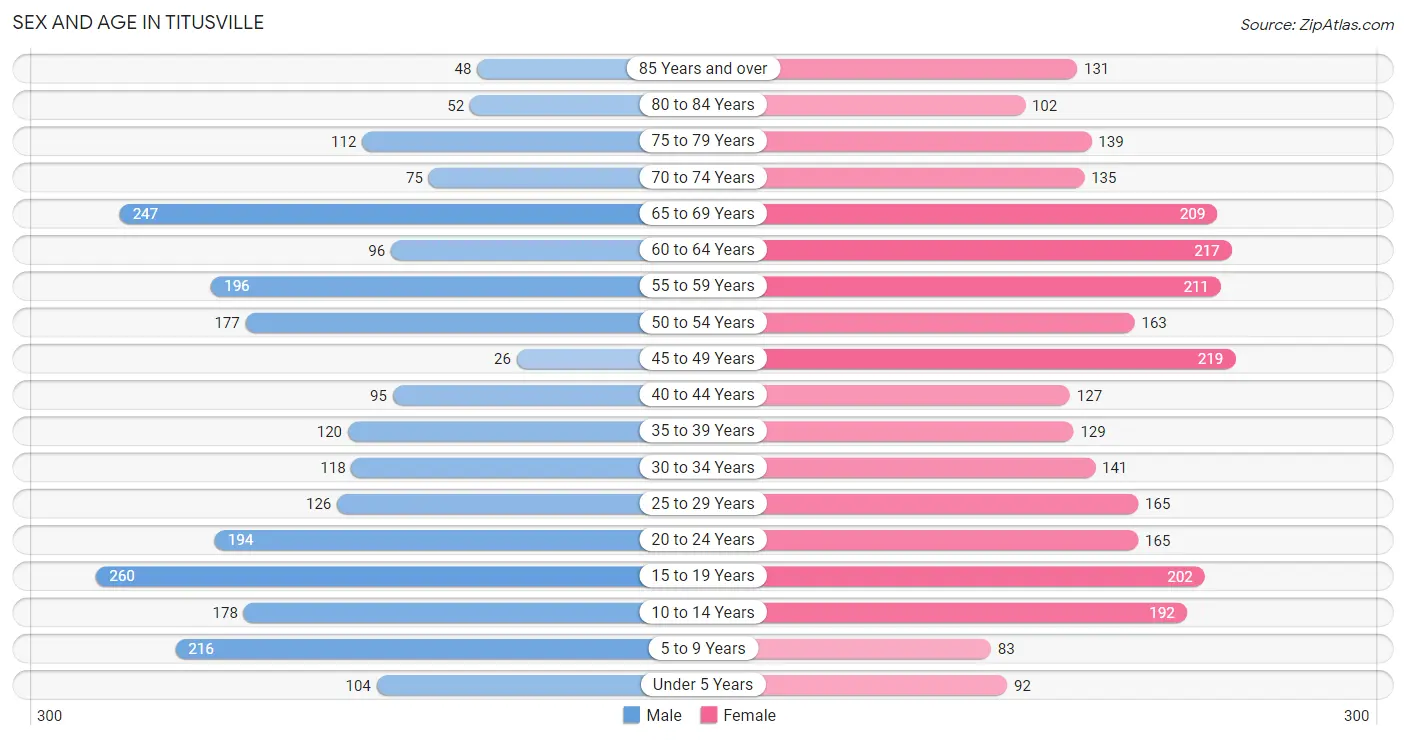
| Age Bracket | Male | Female |
| Under 5 Years | 104 (4.3%) | 92 (3.3%) |
| 5 to 9 Years | 216 (8.8%) | 83 (2.9%) |
| 10 to 14 Years | 178 (7.3%) | 192 (6.8%) |
| 15 to 19 Years | 260 (10.7%) | 202 (7.2%) |
| 20 to 24 Years | 194 (8.0%) | 165 (5.9%) |
| 25 to 29 Years | 126 (5.2%) | 165 (5.9%) |
| 30 to 34 Years | 118 (4.8%) | 141 (5.0%) |
| 35 to 39 Years | 120 (4.9%) | 129 (4.6%) |
| 40 to 44 Years | 95 (3.9%) | 127 (4.5%) |
| 45 to 49 Years | 26 (1.1%) | 219 (7.8%) |
| 50 to 54 Years | 177 (7.2%) | 163 (5.8%) |
| 55 to 59 Years | 196 (8.0%) | 211 (7.5%) |
| 60 to 64 Years | 96 (3.9%) | 217 (7.7%) |
| 65 to 69 Years | 247 (10.1%) | 209 (7.4%) |
| 70 to 74 Years | 75 (3.1%) | 135 (4.8%) |
| 75 to 79 Years | 112 (4.6%) | 139 (4.9%) |
| 80 to 84 Years | 52 (2.1%) | 102 (3.6%) |
| 85 Years and over | 48 (2.0%) | 131 (4.6%) |
| Total | 2,440 (100.0%) | 2,822 (100.0%) |
Families and Households in Titusville
Median Family Size in Titusville
The median family size in Titusville is 2.98 persons per family, with single male/father families (27 | 2.2%) accounting for the largest median family size of 3.37 persons per family. On the other hand, single female/mother families (381 | 31.8%) represent the smallest median family size with 2.79 persons per family.
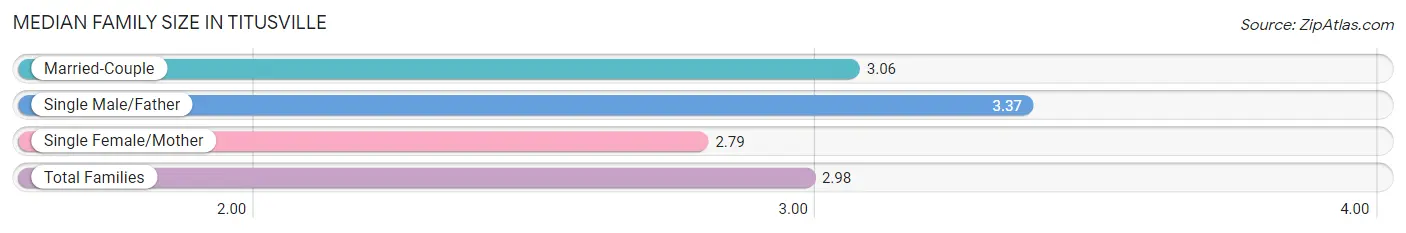
| Family Type | # Families | Family Size |
| Married-Couple | 792 (66.0%) | 3.06 |
| Single Male/Father | 27 (2.2%) | 3.37 |
| Single Female/Mother | 381 (31.8%) | 2.79 |
| Total Families | 1,200 (100.0%) | 2.98 |
Median Household Size in Titusville
The median household size in Titusville is 2.13 persons per household, with single male/father households (27 | 1.1%) accounting for the largest median household size of 4.11 persons per household. non-family households (1,140 | 48.7%) represent the smallest median household size with 1.10 persons per household.
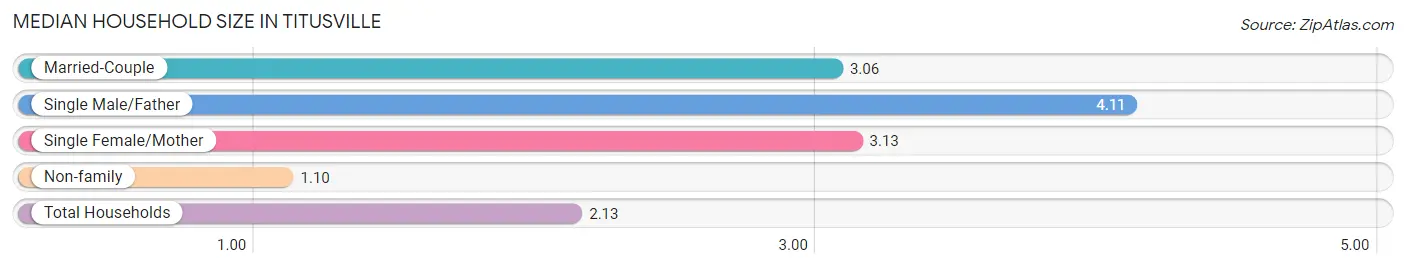
| Household Type | # Households | Household Size |
| Married-Couple | 792 (33.9%) | 3.06 |
| Single Male/Father | 27 (1.1%) | 4.11 |
| Single Female/Mother | 381 (16.3%) | 3.13 |
| Non-family | 1,140 (48.7%) | 1.10 |
| Total Households | 2,340 (100.0%) | 2.13 |
Household Size by Marriage Status in Titusville
Out of a total of 2,340 households in Titusville, 1,200 (51.3%) are family households, while 1,140 (48.7%) are nonfamily households. The most numerous type of family households are 2-person households, comprising 661, and the most common type of nonfamily households are 1-person households, comprising 1,041.
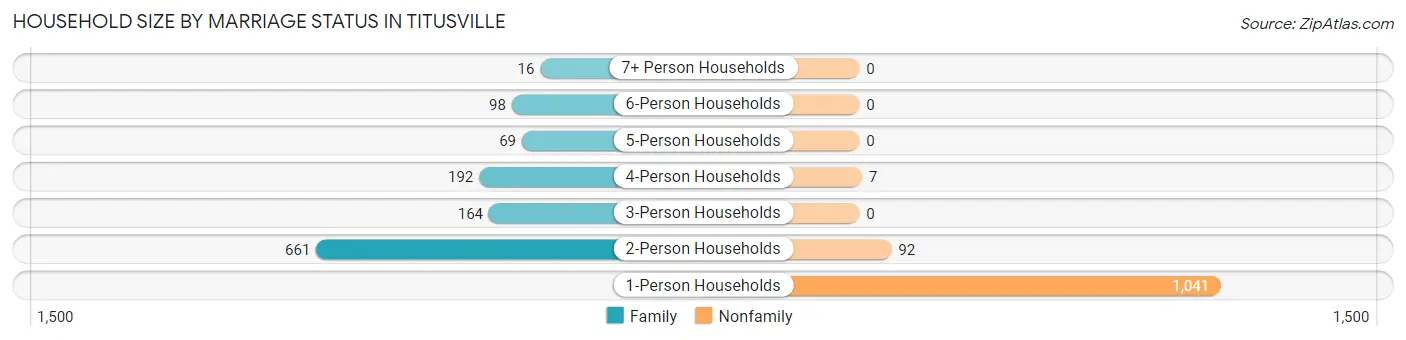
| Household Size | Family Households | Nonfamily Households |
| 1-Person Households | - | 1,041 (44.5%) |
| 2-Person Households | 661 (28.2%) | 92 (3.9%) |
| 3-Person Households | 164 (7.0%) | 0 (0.0%) |
| 4-Person Households | 192 (8.2%) | 7 (0.3%) |
| 5-Person Households | 69 (2.9%) | 0 (0.0%) |
| 6-Person Households | 98 (4.2%) | 0 (0.0%) |
| 7+ Person Households | 16 (0.7%) | 0 (0.0%) |
| Total | 1,200 (51.3%) | 1,140 (48.7%) |
Female Fertility in Titusville
Fertility by Age in Titusville
Average fertility rate in Titusville is 51.0 births per 1,000 women. Women in the age bracket of 20 to 34 years have the highest fertility rate with 115.0 births per 1,000 women. Women in the age bracket of 20 to 34 years acount for 88.5% of all women with births.
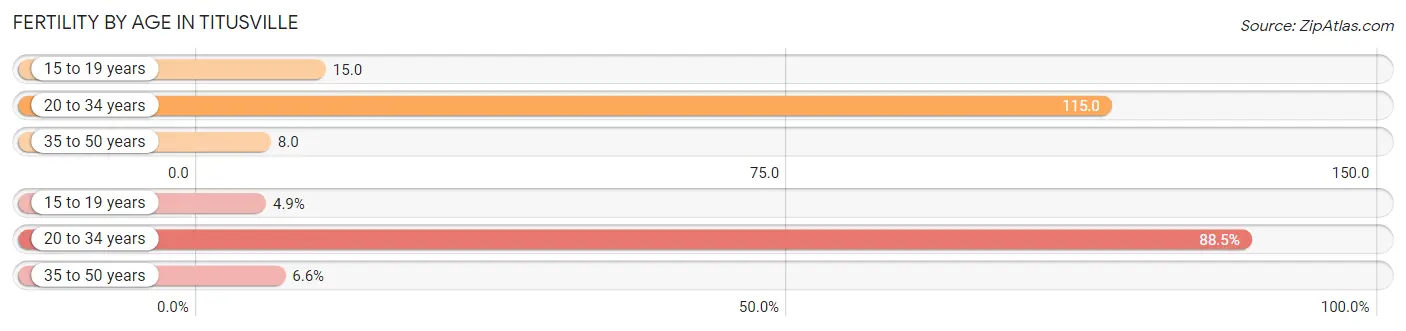
| Age Bracket | Women with Births | Births / 1,000 Women |
| 15 to 19 years | 3 (4.9%) | 15.0 |
| 20 to 34 years | 54 (88.5%) | 115.0 |
| 35 to 50 years | 4 (6.6%) | 8.0 |
| Total | 61 (100.0%) | 51.0 |
Fertility by Age by Marriage Status in Titusville
77.0% of women with births (61) in Titusville are married. The highest percentage of unmarried women with births falls into 15 to 19 years age bracket with 100.0% of them unmarried at the time of birth, while the lowest percentage of unmarried women with births belong to 35 to 50 years age bracket with 0.0% of them unmarried.
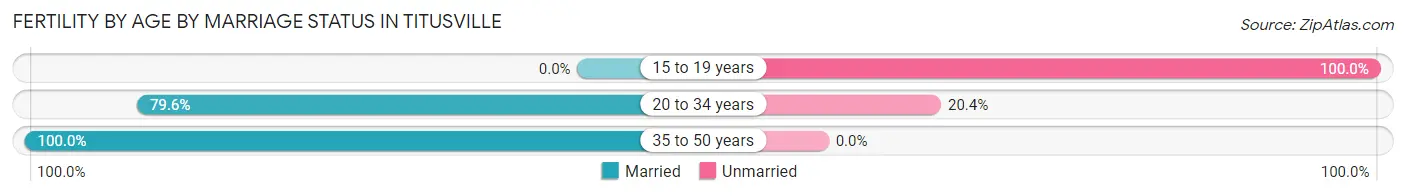
| Age Bracket | Married | Unmarried |
| 15 to 19 years | 0 (0.0%) | 3 (100.0%) |
| 20 to 34 years | 43 (79.6%) | 11 (20.4%) |
| 35 to 50 years | 4 (100.0%) | 0 (0.0%) |
| Total | 47 (77.0%) | 14 (23.0%) |
Fertility by Education in Titusville
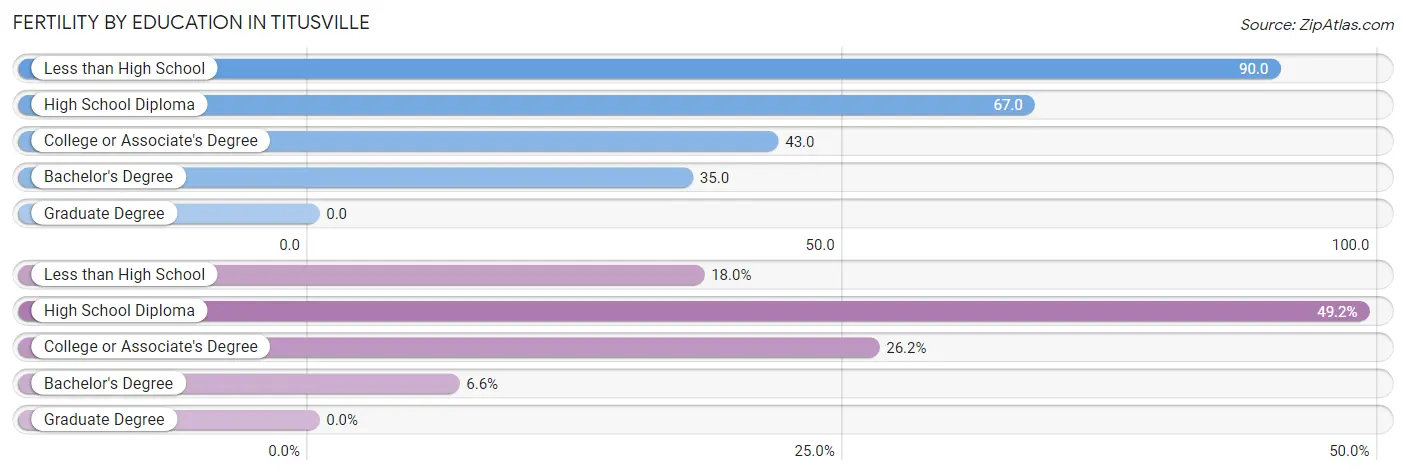
| Educational Attainment | Women with Births | Births / 1,000 Women |
| Less than High School | 11 (18.0%) | 90.0 |
| High School Diploma | 30 (49.2%) | 67.0 |
| College or Associate's Degree | 16 (26.2%) | 43.0 |
| Bachelor's Degree | 4 (6.6%) | 35.0 |
| Graduate Degree | 0 (0.0%) | 0.0 |
| Total | 61 (100.0%) | 51.0 |
Fertility by Education by Marriage Status in Titusville
23.0% of women with births in Titusville are unmarried. Women with the educational attainment of high school diploma are most likely to be married with 100.0% of them married at childbirth, while women with the educational attainment of less than high school are least likely to be married with 100.0% of them unmarried at childbirth.
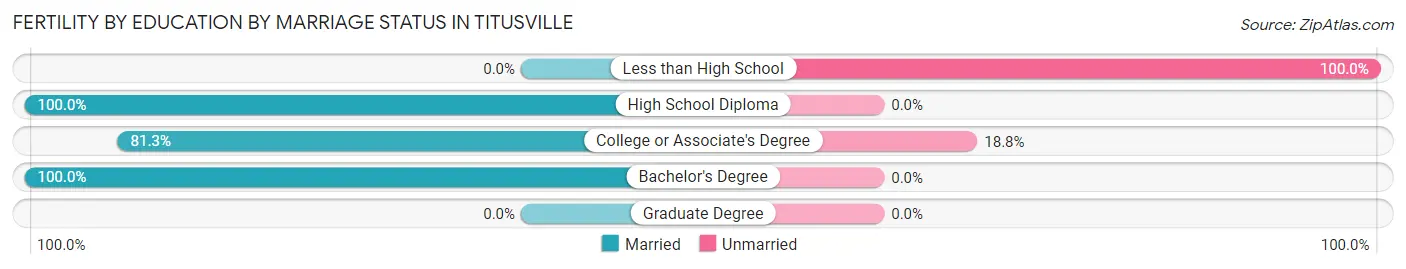
| Educational Attainment | Married | Unmarried |
| Less than High School | 0 (0.0%) | 11 (100.0%) |
| High School Diploma | 30 (100.0%) | 0 (0.0%) |
| College or Associate's Degree | 13 (81.2%) | 3 (18.8%) |
| Bachelor's Degree | 4 (100.0%) | 0 (0.0%) |
| Graduate Degree | 0 (0.0%) | 0 (0.0%) |
| Total | 47 (77.0%) | 14 (23.0%) |
Employment Characteristics in Titusville
Employment by Class of Employer in Titusville
Among the 1,899 employed individuals in Titusville, private company employees (1,144 | 60.2%), not-for-profit organizations (267 | 14.1%), and local government employees (156 | 8.2%) make up the most common classes of employment.
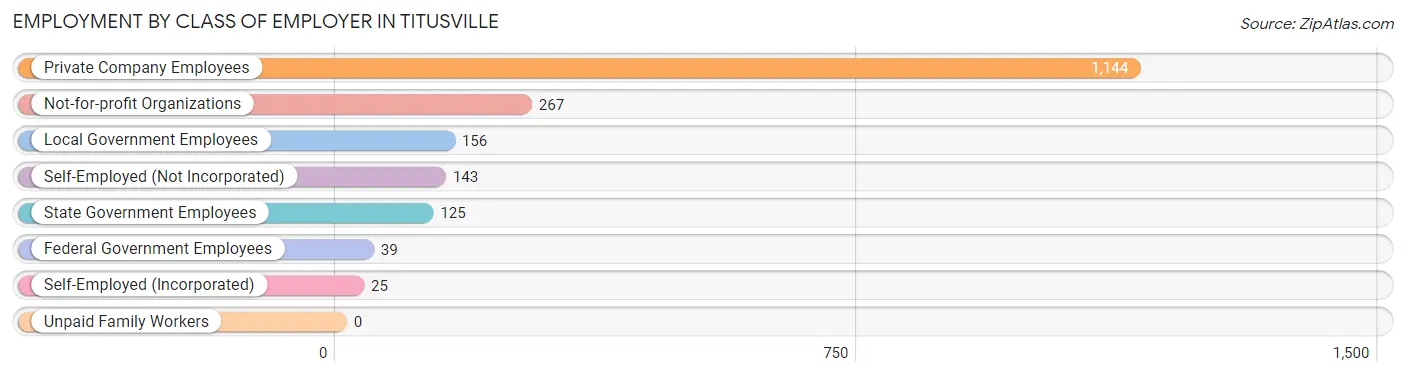
| Employer Class | # Employees | % Employees |
| Private Company Employees | 1,144 | 60.2% |
| Self-Employed (Incorporated) | 25 | 1.3% |
| Self-Employed (Not Incorporated) | 143 | 7.5% |
| Not-for-profit Organizations | 267 | 14.1% |
| Local Government Employees | 156 | 8.2% |
| State Government Employees | 125 | 6.6% |
| Federal Government Employees | 39 | 2.1% |
| Unpaid Family Workers | 0 | 0.0% |
| Total | 1,899 | 100.0% |
Employment Status by Age in Titusville
According to the labor force statistics for Titusville, out of the total population over 16 years of age (4,331), 48.3% or 2,092 individuals are in the labor force, with 7.7% or 161 of them unemployed. The age group with the highest labor force participation rate is 25 to 29 years, with 85.6% or 249 individuals in the labor force. Within the labor force, the 16 to 19 years age range has the highest percentage of unemployed individuals, with 23.4% or 41 of them being unemployed.
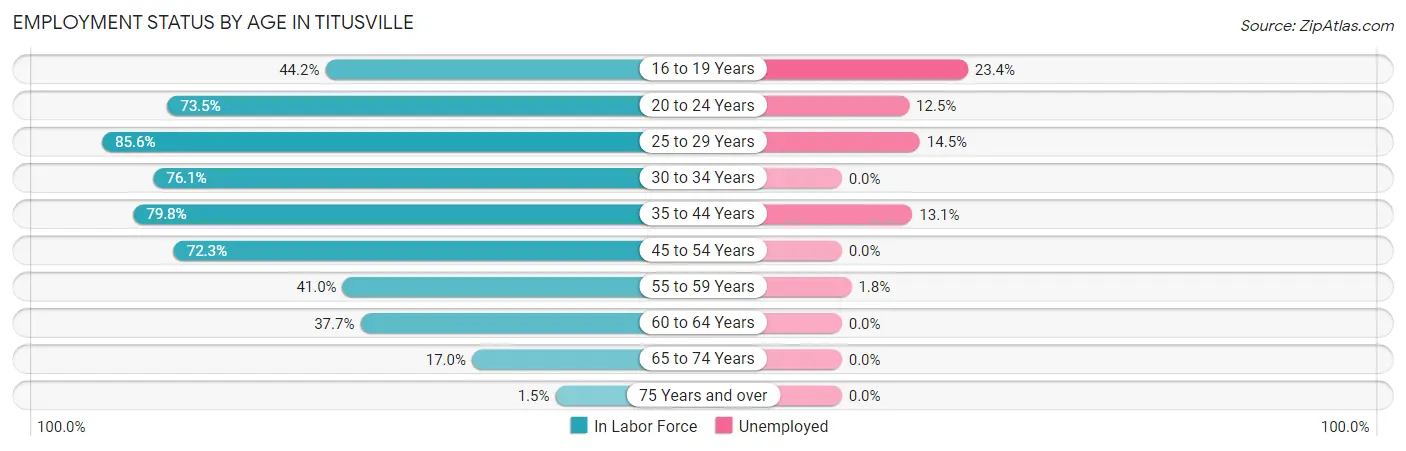
| Age Bracket | In Labor Force | Unemployed |
| 16 to 19 Years | 175 (44.2%) | 41 (23.4%) |
| 20 to 24 Years | 264 (73.5%) | 33 (12.5%) |
| 25 to 29 Years | 249 (85.6%) | 36 (14.5%) |
| 30 to 34 Years | 197 (76.1%) | 0 (0.0%) |
| 35 to 44 Years | 376 (79.8%) | 49 (13.1%) |
| 45 to 54 Years | 423 (72.3%) | 0 (0.0%) |
| 55 to 59 Years | 167 (41.0%) | 3 (1.8%) |
| 60 to 64 Years | 118 (37.7%) | 0 (0.0%) |
| 65 to 74 Years | 113 (17.0%) | 0 (0.0%) |
| 75 Years and over | 9 (1.5%) | 0 (0.0%) |
| Total | 2,092 (48.3%) | 161 (7.7%) |
Employment Status by Educational Attainment in Titusville
According to labor force statistics for Titusville, 65.8% of individuals (1,531) out of the total population between 25 and 64 years of age (2,326) are in the labor force, with 5.7% or 87 of them being unemployed. The group with the highest labor force participation rate are those with the educational attainment of bachelor's degree or higher, with 85.9% or 371 individuals in the labor force. Within the labor force, individuals with high school diploma education have the highest percentage of unemployment, with 10.0% or 69 of them being unemployed.
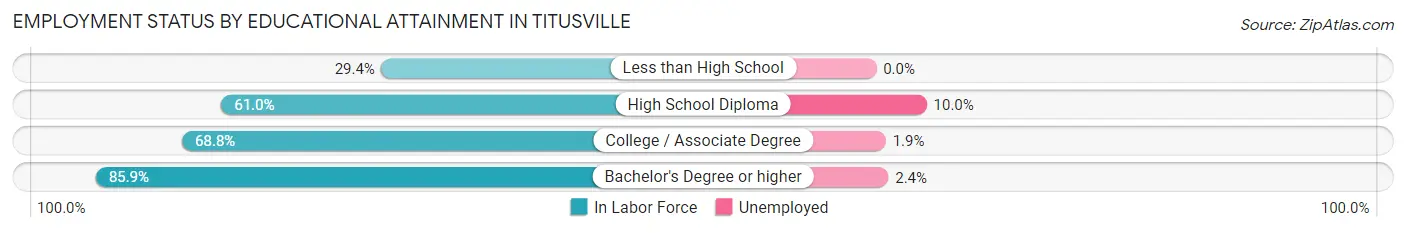
| Educational Attainment | In Labor Force | Unemployed |
| Less than High School | 42 (29.4%) | 0 (0.0%) |
| High School Diploma | 689 (61.0%) | 113 (10.0%) |
| College / Associate Degree | 428 (68.8%) | 12 (1.9%) |
| Bachelor's Degree or higher | 371 (85.9%) | 10 (2.4%) |
| Total | 1,531 (65.8%) | 133 (5.7%) |
Employment Occupations by Sex in Titusville
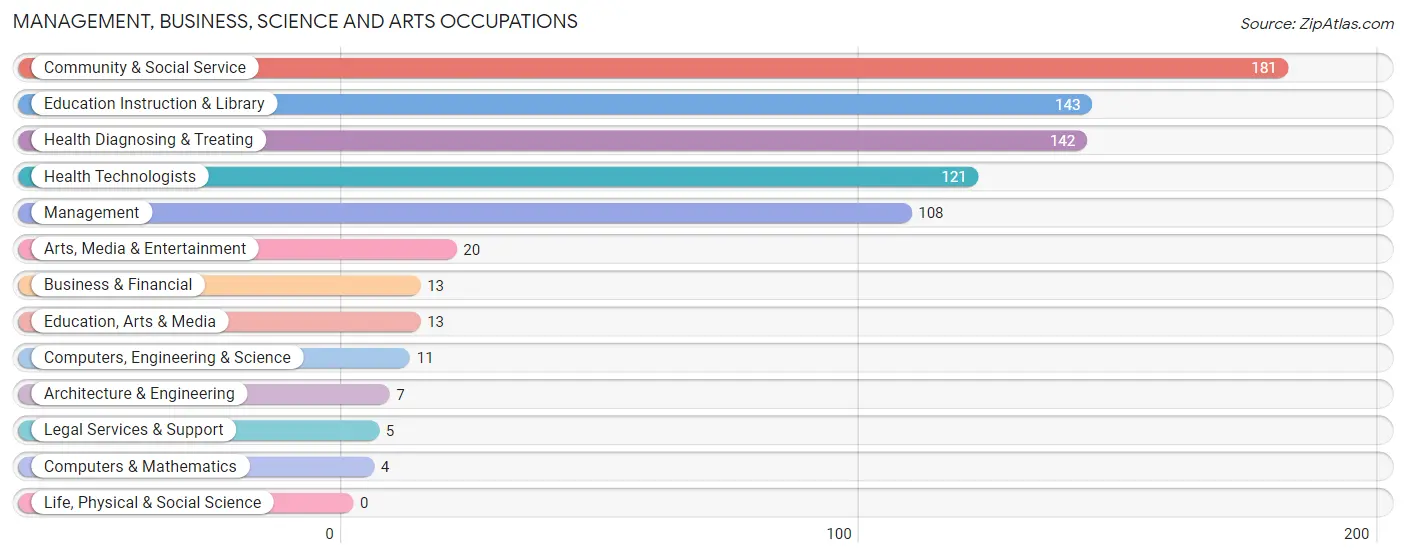
Management, Business, Science and Arts Occupations
The most common Management, Business, Science and Arts occupations in Titusville are Community & Social Service (181 | 9.5%), Education Instruction & Library (143 | 7.5%), Health Diagnosing & Treating (142 | 7.4%), Health Technologists (121 | 6.3%), and Management (108 | 5.6%).
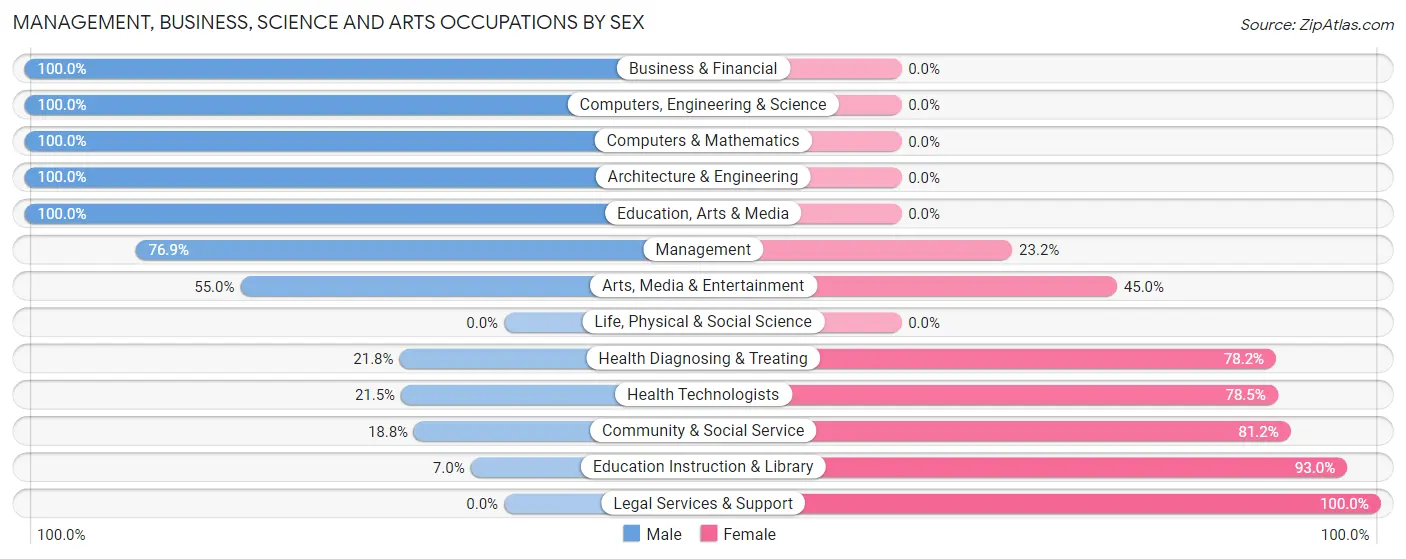
Management, Business, Science and Arts Occupations by Sex
Within the Management, Business, Science and Arts occupations in Titusville, the most male-oriented occupations are Business & Financial (100.0%), Computers, Engineering & Science (100.0%), and Computers & Mathematics (100.0%), while the most female-oriented occupations are Legal Services & Support (100.0%), Education Instruction & Library (93.0%), and Community & Social Service (81.2%).
| Occupation | Male | Female |
| Management | 83 (76.8%) | 25 (23.2%) |
| Business & Financial | 13 (100.0%) | 0 (0.0%) |
| Computers, Engineering & Science | 11 (100.0%) | 0 (0.0%) |
| Computers & Mathematics | 4 (100.0%) | 0 (0.0%) |
| Architecture & Engineering | 7 (100.0%) | 0 (0.0%) |
| Life, Physical & Social Science | 0 (0.0%) | 0 (0.0%) |
| Community & Social Service | 34 (18.8%) | 147 (81.2%) |
| Education, Arts & Media | 13 (100.0%) | 0 (0.0%) |
| Legal Services & Support | 0 (0.0%) | 5 (100.0%) |
| Education Instruction & Library | 10 (7.0%) | 133 (93.0%) |
| Arts, Media & Entertainment | 11 (55.0%) | 9 (45.0%) |
| Health Diagnosing & Treating | 31 (21.8%) | 111 (78.2%) |
| Health Technologists | 26 (21.5%) | 95 (78.5%) |
| Total (Category) | 172 (37.8%) | 283 (62.2%) |
| Total (Overall) | 877 (45.8%) | 1,038 (54.2%) |
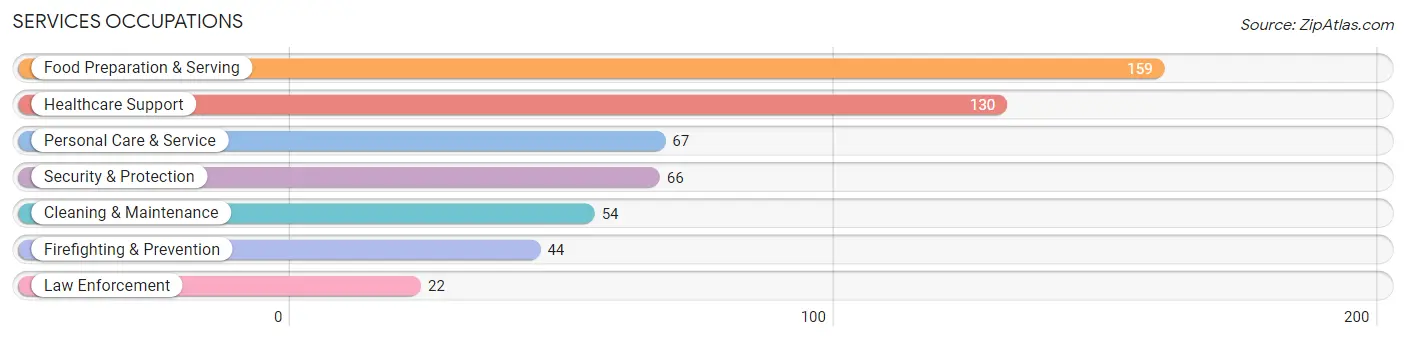
Services Occupations
The most common Services occupations in Titusville are Food Preparation & Serving (159 | 8.3%), Healthcare Support (130 | 6.8%), Personal Care & Service (67 | 3.5%), Security & Protection (66 | 3.5%), and Cleaning & Maintenance (54 | 2.8%).
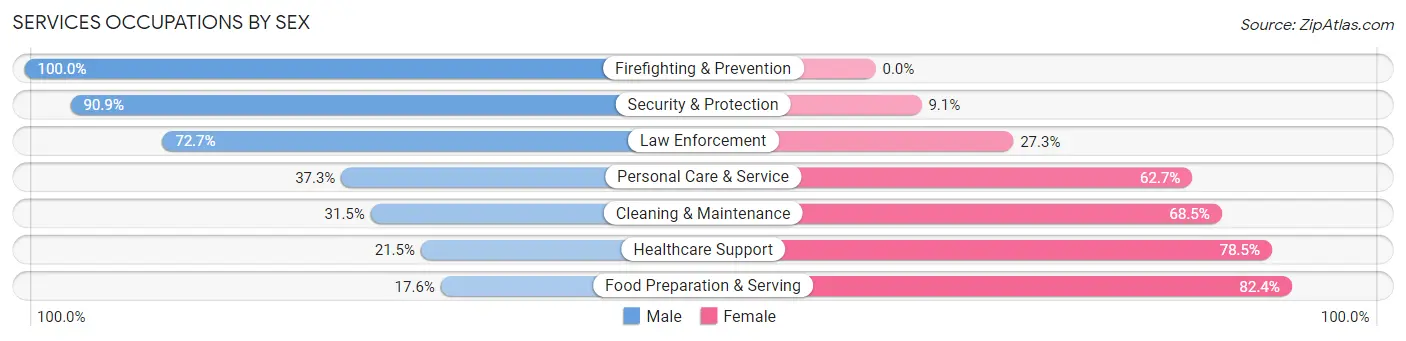
Services Occupations by Sex
Within the Services occupations in Titusville, the most male-oriented occupations are Firefighting & Prevention (100.0%), Security & Protection (90.9%), and Law Enforcement (72.7%), while the most female-oriented occupations are Food Preparation & Serving (82.4%), Healthcare Support (78.5%), and Cleaning & Maintenance (68.5%).
| Occupation | Male | Female |
| Healthcare Support | 28 (21.5%) | 102 (78.5%) |
| Security & Protection | 60 (90.9%) | 6 (9.1%) |
| Firefighting & Prevention | 44 (100.0%) | 0 (0.0%) |
| Law Enforcement | 16 (72.7%) | 6 (27.3%) |
| Food Preparation & Serving | 28 (17.6%) | 131 (82.4%) |
| Cleaning & Maintenance | 17 (31.5%) | 37 (68.5%) |
| Personal Care & Service | 25 (37.3%) | 42 (62.7%) |
| Total (Category) | 158 (33.2%) | 318 (66.8%) |
| Total (Overall) | 877 (45.8%) | 1,038 (54.2%) |
Sales and Office Occupations
The most common Sales and Office occupations in Titusville are Office & Administration (304 | 15.9%), and Sales & Related (184 | 9.6%).

Sales and Office Occupations by Sex
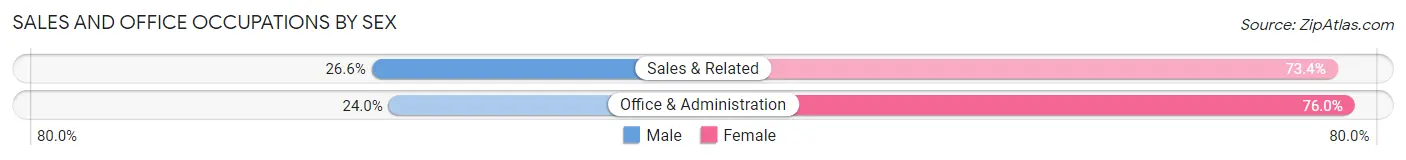
| Occupation | Male | Female |
| Sales & Related | 49 (26.6%) | 135 (73.4%) |
| Office & Administration | 73 (24.0%) | 231 (76.0%) |
| Total (Category) | 122 (25.0%) | 366 (75.0%) |
| Total (Overall) | 877 (45.8%) | 1,038 (54.2%) |
Natural Resources, Construction and Maintenance Occupations
The most common Natural Resources, Construction and Maintenance occupations in Titusville are Construction & Extraction (57 | 3.0%), Installation, Maintenance & Repair (44 | 2.3%), and Farming, Fishing & Forestry (9 | 0.5%).

Natural Resources, Construction and Maintenance Occupations by Sex

| Occupation | Male | Female |
| Farming, Fishing & Forestry | 9 (100.0%) | 0 (0.0%) |
| Construction & Extraction | 57 (100.0%) | 0 (0.0%) |
| Installation, Maintenance & Repair | 44 (100.0%) | 0 (0.0%) |
| Total (Category) | 110 (100.0%) | 0 (0.0%) |
| Total (Overall) | 877 (45.8%) | 1,038 (54.2%) |
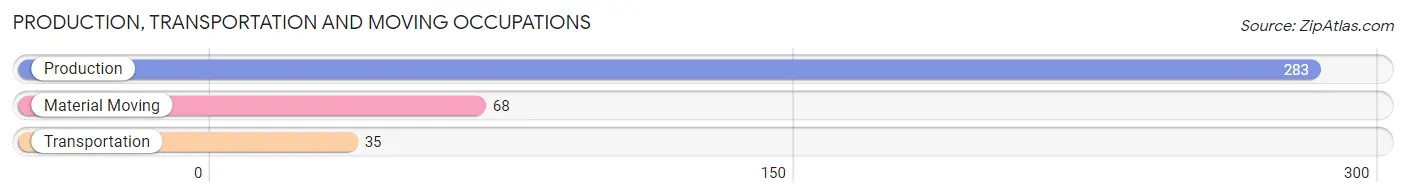
Production, Transportation and Moving Occupations
The most common Production, Transportation and Moving occupations in Titusville are Production (283 | 14.8%), Material Moving (68 | 3.5%), and Transportation (35 | 1.8%).
Production, Transportation and Moving Occupations by Sex
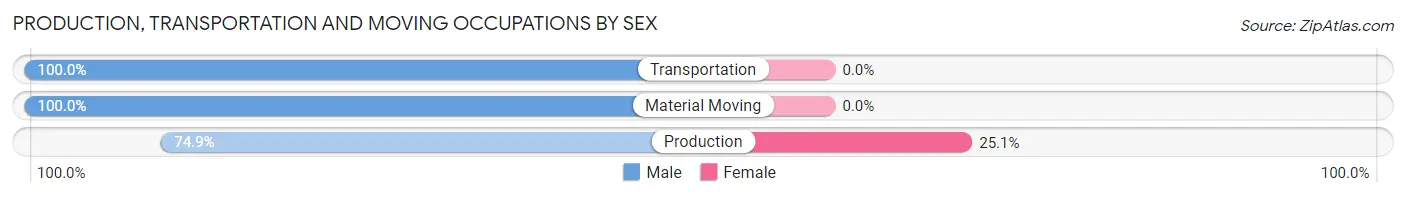
| Occupation | Male | Female |
| Production | 212 (74.9%) | 71 (25.1%) |
| Transportation | 35 (100.0%) | 0 (0.0%) |
| Material Moving | 68 (100.0%) | 0 (0.0%) |
| Total (Category) | 315 (81.6%) | 71 (18.4%) |
| Total (Overall) | 877 (45.8%) | 1,038 (54.2%) |
Employment Industries by Sex in Titusville
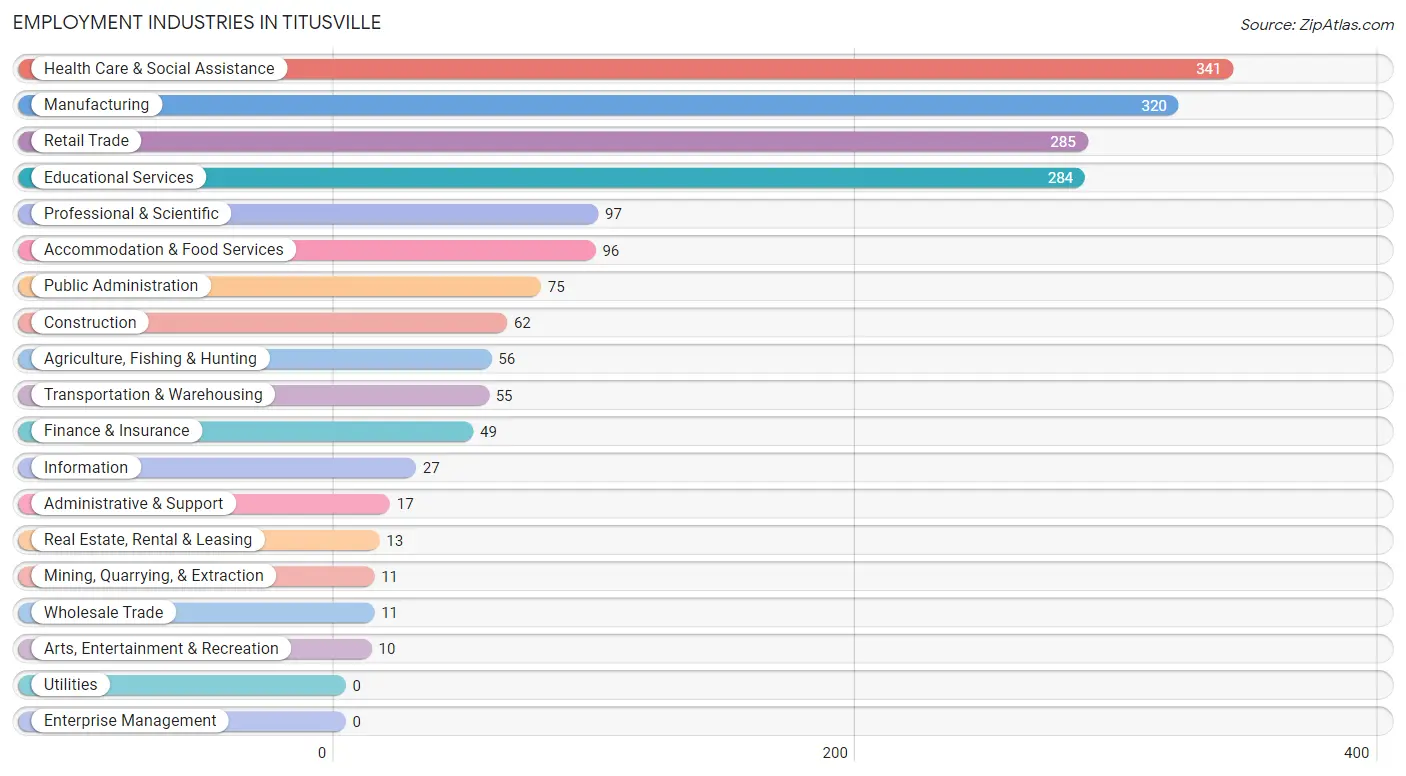
Employment Industries in Titusville
The major employment industries in Titusville include Health Care & Social Assistance (341 | 17.8%), Manufacturing (320 | 16.7%), Retail Trade (285 | 14.9%), Educational Services (284 | 14.8%), and Professional & Scientific (97 | 5.1%).
Employment Industries by Sex in Titusville
The Titusville industries that see more men than women are Mining, Quarrying, & Extraction (100.0%), Construction (100.0%), and Administrative & Support (100.0%), whereas the industries that tend to have a higher number of women are Accommodation & Food Services (83.3%), Health Care & Social Assistance (77.4%), and Finance & Insurance (75.5%).
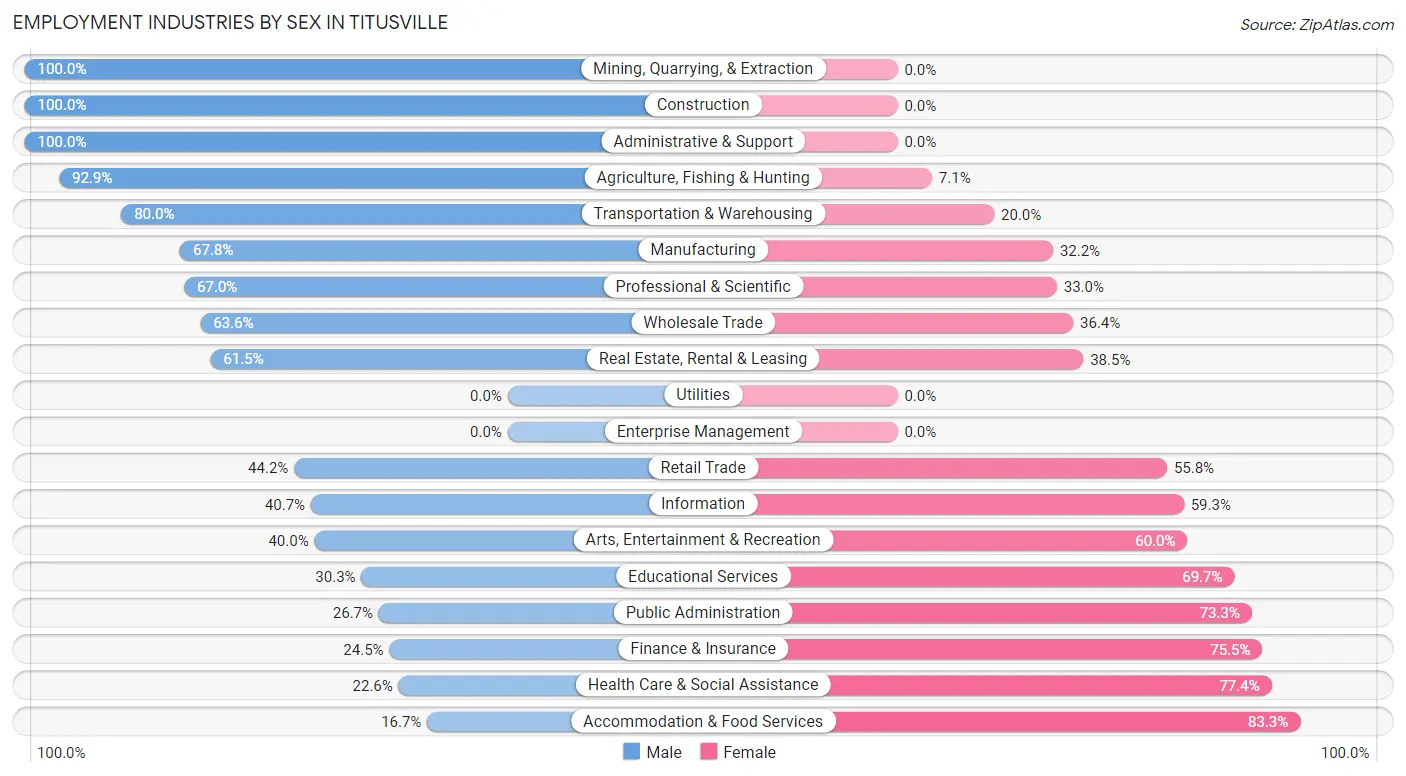
| Industry | Male | Female |
| Agriculture, Fishing & Hunting | 52 (92.9%) | 4 (7.1%) |
| Mining, Quarrying, & Extraction | 11 (100.0%) | 0 (0.0%) |
| Construction | 62 (100.0%) | 0 (0.0%) |
| Manufacturing | 217 (67.8%) | 103 (32.2%) |
| Wholesale Trade | 7 (63.6%) | 4 (36.4%) |
| Retail Trade | 126 (44.2%) | 159 (55.8%) |
| Transportation & Warehousing | 44 (80.0%) | 11 (20.0%) |
| Utilities | 0 (0.0%) | 0 (0.0%) |
| Information | 11 (40.7%) | 16 (59.3%) |
| Finance & Insurance | 12 (24.5%) | 37 (75.5%) |
| Real Estate, Rental & Leasing | 8 (61.5%) | 5 (38.5%) |
| Professional & Scientific | 65 (67.0%) | 32 (33.0%) |
| Enterprise Management | 0 (0.0%) | 0 (0.0%) |
| Administrative & Support | 17 (100.0%) | 0 (0.0%) |
| Educational Services | 86 (30.3%) | 198 (69.7%) |
| Health Care & Social Assistance | 77 (22.6%) | 264 (77.4%) |
| Arts, Entertainment & Recreation | 4 (40.0%) | 6 (60.0%) |
| Accommodation & Food Services | 16 (16.7%) | 80 (83.3%) |
| Public Administration | 20 (26.7%) | 55 (73.3%) |
| Total | 877 (45.8%) | 1,038 (54.2%) |
Education in Titusville
School Enrollment in Titusville
The most common levels of schooling among the 1,268 students in Titusville are college / undergraduate (340 | 26.8%), middle school (321 | 25.3%), and high school (272 | 21.4%).
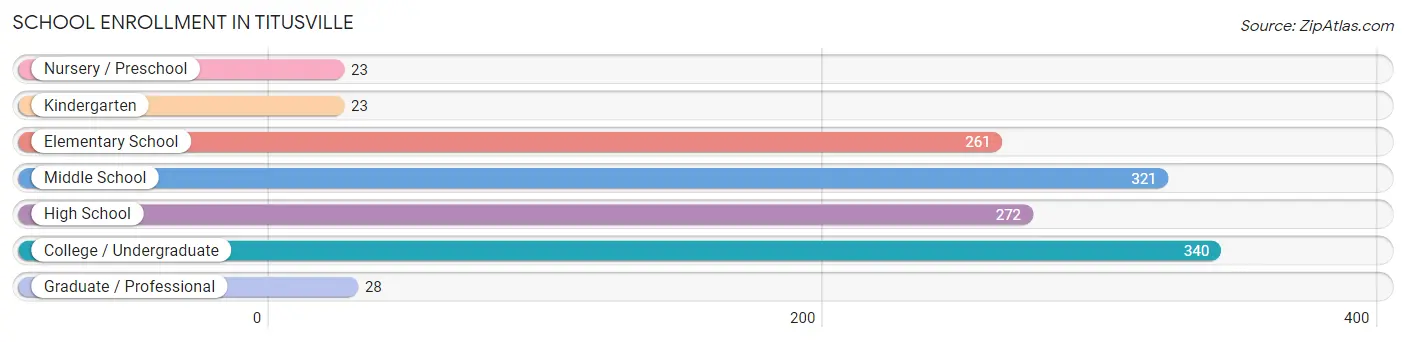
| School Level | # Students | % Students |
| Nursery / Preschool | 23 | 1.8% |
| Kindergarten | 23 | 1.8% |
| Elementary School | 261 | 20.6% |
| Middle School | 321 | 25.3% |
| High School | 272 | 21.4% |
| College / Undergraduate | 340 | 26.8% |
| Graduate / Professional | 28 | 2.2% |
| Total | 1,268 | 100.0% |
School Enrollment by Age by Funding Source in Titusville
Out of a total of 1,268 students who are enrolled in schools in Titusville, 290 (22.9%) attend a private institution, while the remaining 978 (77.1%) are enrolled in public schools. The age group of 25 to 34 year olds has the highest likelihood of being enrolled in private schools, with 31 (73.8% in the age bracket) enrolled. Conversely, the age group of 10 to 14 year olds has the lowest likelihood of being enrolled in a private school, with 348 (94.1% in the age bracket) attending a public institution.
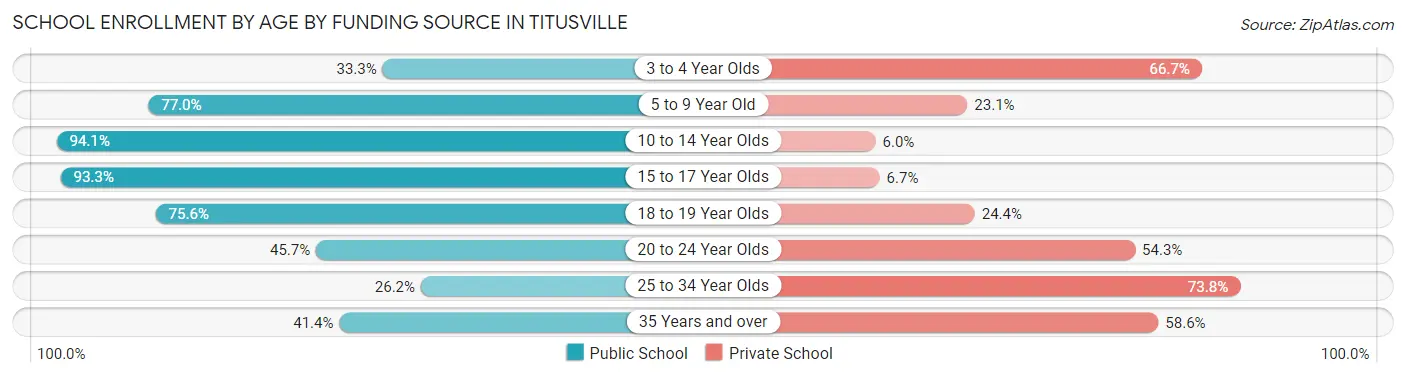
| Age Bracket | Public School | Private School |
| 3 to 4 Year Olds | 5 (33.3%) | 10 (66.7%) |
| 5 to 9 Year Old | 197 (76.9%) | 59 (23.1%) |
| 10 to 14 Year Olds | 348 (94.1%) | 22 (5.9%) |
| 15 to 17 Year Olds | 195 (93.3%) | 14 (6.7%) |
| 18 to 19 Year Olds | 130 (75.6%) | 42 (24.4%) |
| 20 to 24 Year Olds | 80 (45.7%) | 95 (54.3%) |
| 25 to 34 Year Olds | 11 (26.2%) | 31 (73.8%) |
| 35 Years and over | 12 (41.4%) | 17 (58.6%) |
| Total | 978 (77.1%) | 290 (22.9%) |
Educational Attainment by Field of Study in Titusville
Education (193 | 30.8%), science & technology (120 | 19.1%), psychology (71 | 11.3%), business (59 | 9.4%), and computers & mathematics (41 | 6.5%) are the most common fields of study among 627 individuals in Titusville who have obtained a bachelor's degree or higher.
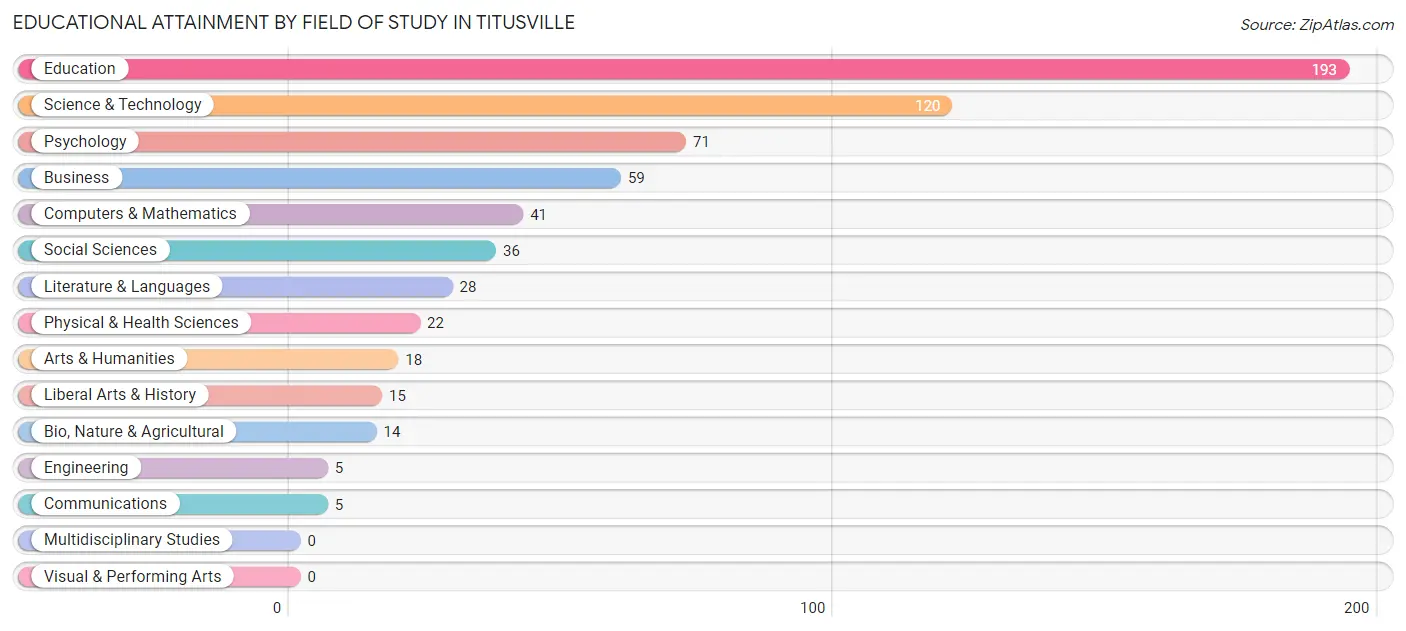
| Field of Study | # Graduates | % Graduates |
| Computers & Mathematics | 41 | 6.5% |
| Bio, Nature & Agricultural | 14 | 2.2% |
| Physical & Health Sciences | 22 | 3.5% |
| Psychology | 71 | 11.3% |
| Social Sciences | 36 | 5.7% |
| Engineering | 5 | 0.8% |
| Multidisciplinary Studies | 0 | 0.0% |
| Science & Technology | 120 | 19.1% |
| Business | 59 | 9.4% |
| Education | 193 | 30.8% |
| Literature & Languages | 28 | 4.5% |
| Liberal Arts & History | 15 | 2.4% |
| Visual & Performing Arts | 0 | 0.0% |
| Communications | 5 | 0.8% |
| Arts & Humanities | 18 | 2.9% |
| Total | 627 | 100.0% |
Transportation & Commute in Titusville
Vehicle Availability by Sex in Titusville
The most prevalent vehicle ownership categories in Titusville are males with 2 vehicles (384, accounting for 43.9%) and females with 2 vehicles (467, making up 39.6%).
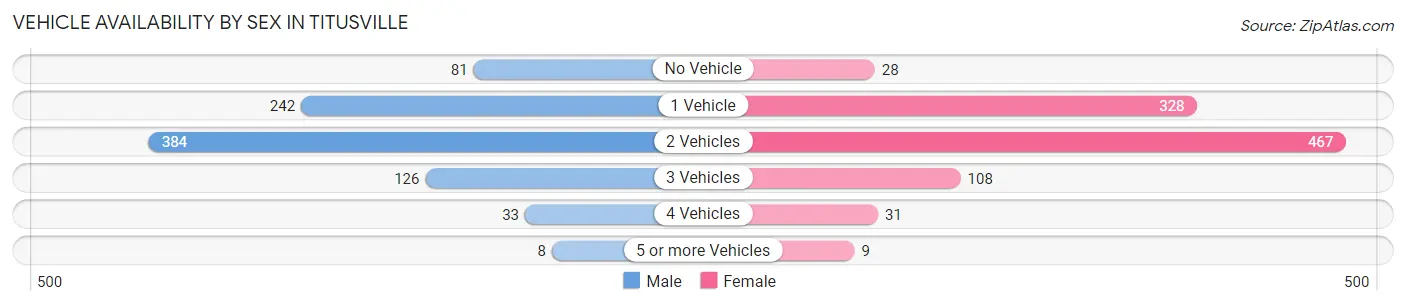
| Vehicles Available | Male | Female |
| No Vehicle | 81 (9.3%) | 28 (2.9%) |
| 1 Vehicle | 242 (27.7%) | 328 (33.8%) |
| 2 Vehicles | 384 (43.9%) | 467 (48.1%) |
| 3 Vehicles | 126 (14.4%) | 108 (11.1%) |
| 4 Vehicles | 33 (3.8%) | 31 (3.2%) |
| 5 or more Vehicles | 8 (0.9%) | 9 (0.9%) |
| Total | 874 (100.0%) | 971 (100.0%) |
Commute Time in Titusville
The most frequently occuring commute durations in Titusville are 5 to 9 minutes (448 commuters, 24.6%), 30 to 34 minutes (260 commuters, 14.3%), and 10 to 14 minutes (221 commuters, 12.2%).
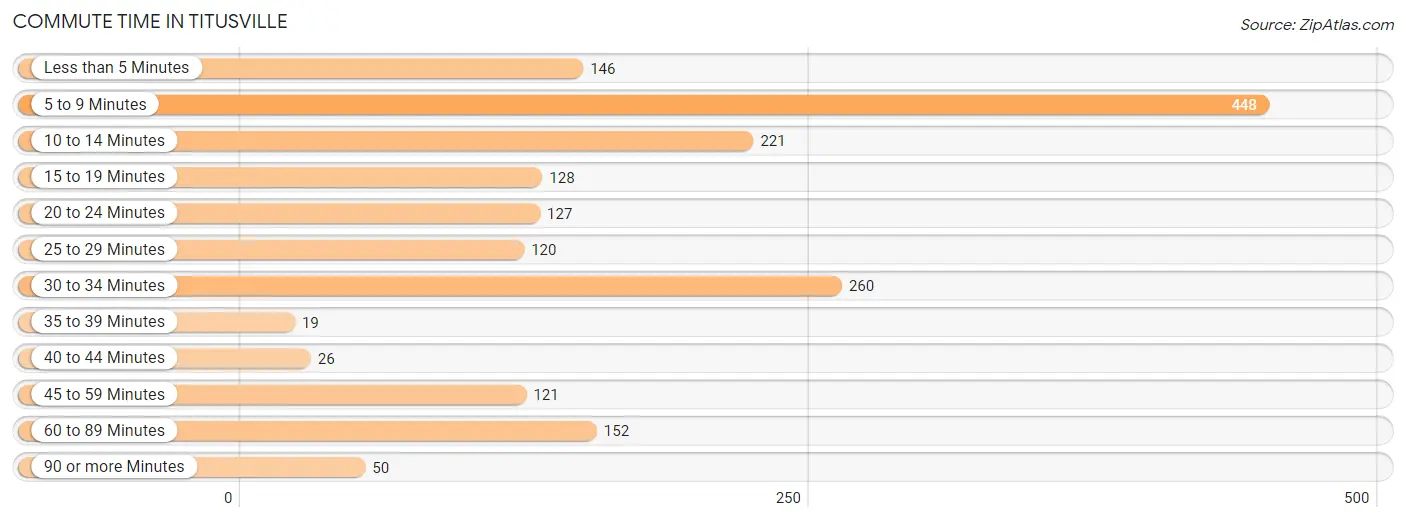
| Commute Time | # Commuters | % Commuters |
| Less than 5 Minutes | 146 | 8.0% |
| 5 to 9 Minutes | 448 | 24.6% |
| 10 to 14 Minutes | 221 | 12.2% |
| 15 to 19 Minutes | 128 | 7.0% |
| 20 to 24 Minutes | 127 | 7.0% |
| 25 to 29 Minutes | 120 | 6.6% |
| 30 to 34 Minutes | 260 | 14.3% |
| 35 to 39 Minutes | 19 | 1.1% |
| 40 to 44 Minutes | 26 | 1.4% |
| 45 to 59 Minutes | 121 | 6.7% |
| 60 to 89 Minutes | 152 | 8.4% |
| 90 or more Minutes | 50 | 2.8% |
Commute Time by Sex in Titusville
The most common commute times in Titusville are 10 to 14 minutes (132 commuters, 15.6%) for males and 5 to 9 minutes (319 commuters, 32.9%) for females.
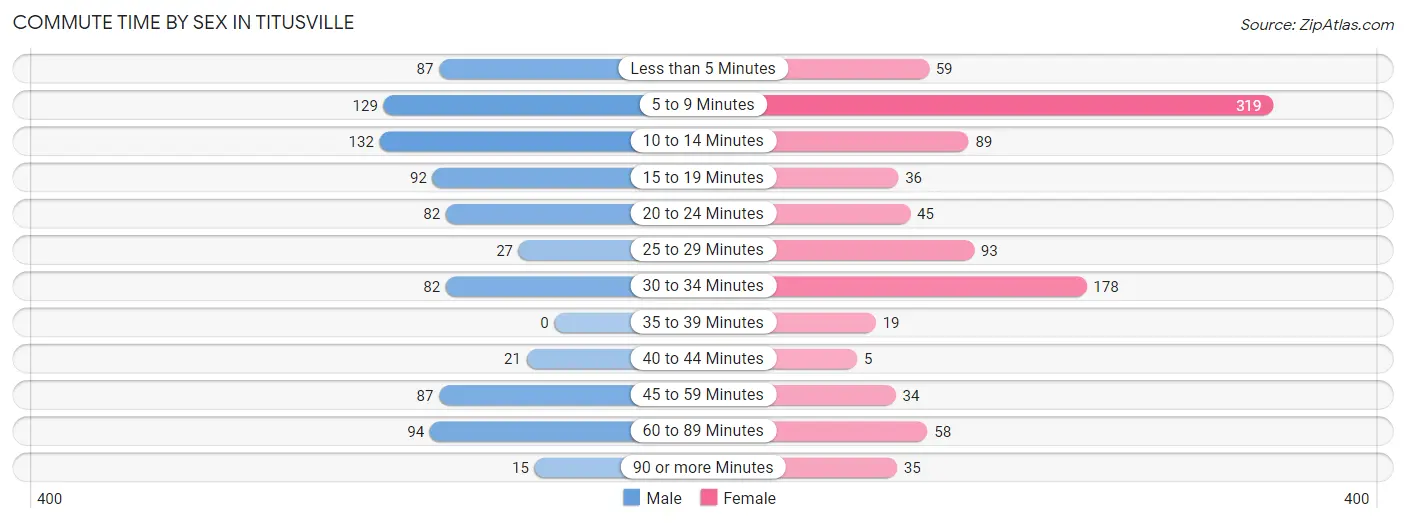
| Commute Time | Male | Female |
| Less than 5 Minutes | 87 (10.3%) | 59 (6.1%) |
| 5 to 9 Minutes | 129 (15.2%) | 319 (32.9%) |
| 10 to 14 Minutes | 132 (15.6%) | 89 (9.2%) |
| 15 to 19 Minutes | 92 (10.8%) | 36 (3.7%) |
| 20 to 24 Minutes | 82 (9.7%) | 45 (4.6%) |
| 25 to 29 Minutes | 27 (3.2%) | 93 (9.6%) |
| 30 to 34 Minutes | 82 (9.7%) | 178 (18.3%) |
| 35 to 39 Minutes | 0 (0.0%) | 19 (2.0%) |
| 40 to 44 Minutes | 21 (2.5%) | 5 (0.5%) |
| 45 to 59 Minutes | 87 (10.3%) | 34 (3.5%) |
| 60 to 89 Minutes | 94 (11.1%) | 58 (6.0%) |
| 90 or more Minutes | 15 (1.8%) | 35 (3.6%) |
Time of Departure to Work by Sex in Titusville
The most frequent times of departure to work in Titusville are 7:00 AM to 7:29 AM (139, 16.4%) for males and 12:00 PM to 3:59 PM (189, 19.5%) for females.
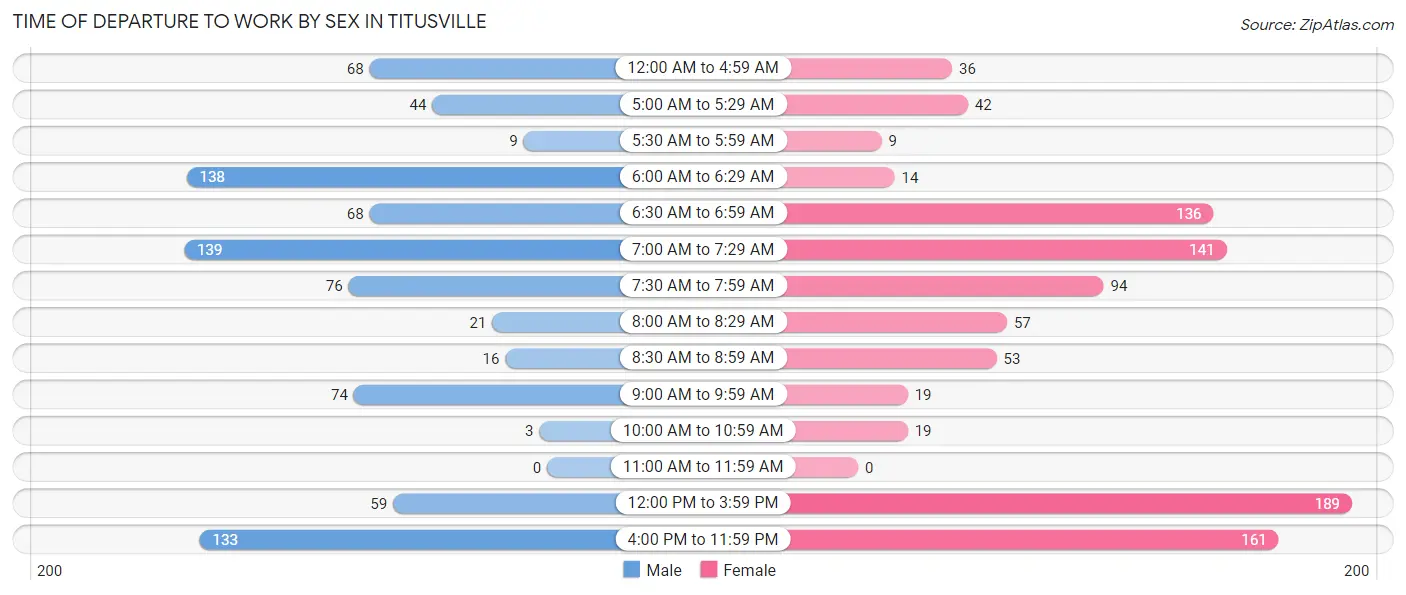
| Time of Departure | Male | Female |
| 12:00 AM to 4:59 AM | 68 (8.0%) | 36 (3.7%) |
| 5:00 AM to 5:29 AM | 44 (5.2%) | 42 (4.3%) |
| 5:30 AM to 5:59 AM | 9 (1.1%) | 9 (0.9%) |
| 6:00 AM to 6:29 AM | 138 (16.3%) | 14 (1.4%) |
| 6:30 AM to 6:59 AM | 68 (8.0%) | 136 (14.0%) |
| 7:00 AM to 7:29 AM | 139 (16.4%) | 141 (14.5%) |
| 7:30 AM to 7:59 AM | 76 (9.0%) | 94 (9.7%) |
| 8:00 AM to 8:29 AM | 21 (2.5%) | 57 (5.9%) |
| 8:30 AM to 8:59 AM | 16 (1.9%) | 53 (5.5%) |
| 9:00 AM to 9:59 AM | 74 (8.7%) | 19 (2.0%) |
| 10:00 AM to 10:59 AM | 3 (0.4%) | 19 (2.0%) |
| 11:00 AM to 11:59 AM | 0 (0.0%) | 0 (0.0%) |
| 12:00 PM to 3:59 PM | 59 (7.0%) | 189 (19.5%) |
| 4:00 PM to 11:59 PM | 133 (15.7%) | 161 (16.6%) |
| Total | 848 (100.0%) | 970 (100.0%) |
Housing Occupancy in Titusville
Occupancy by Ownership in Titusville
Of the total 2,340 dwellings in Titusville, owner-occupied units account for 1,336 (57.1%), while renter-occupied units make up 1,004 (42.9%).
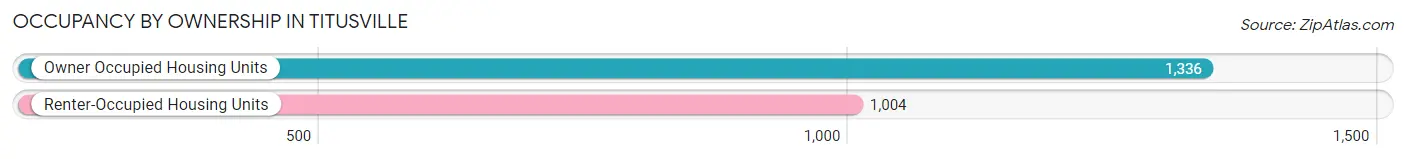
| Occupancy | # Housing Units | % Housing Units |
| Owner Occupied Housing Units | 1,336 | 57.1% |
| Renter-Occupied Housing Units | 1,004 | 42.9% |
| Total Occupied Housing Units | 2,340 | 100.0% |
Occupancy by Household Size in Titusville
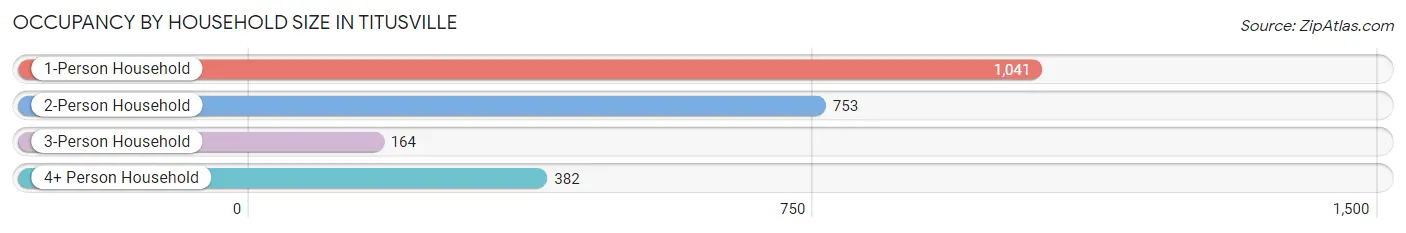
| Household Size | # Housing Units | % Housing Units |
| 1-Person Household | 1,041 | 44.5% |
| 2-Person Household | 753 | 32.2% |
| 3-Person Household | 164 | 7.0% |
| 4+ Person Household | 382 | 16.3% |
| Total Housing Units | 2,340 | 100.0% |
Occupancy by Ownership by Household Size in Titusville
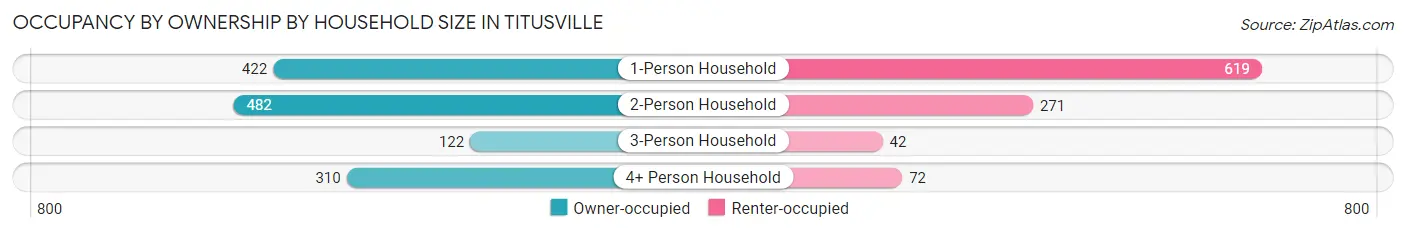
| Household Size | Owner-occupied | Renter-occupied |
| 1-Person Household | 422 (40.5%) | 619 (59.5%) |
| 2-Person Household | 482 (64.0%) | 271 (36.0%) |
| 3-Person Household | 122 (74.4%) | 42 (25.6%) |
| 4+ Person Household | 310 (81.1%) | 72 (18.9%) |
| Total Housing Units | 1,336 (57.1%) | 1,004 (42.9%) |
Occupancy by Educational Attainment in Titusville
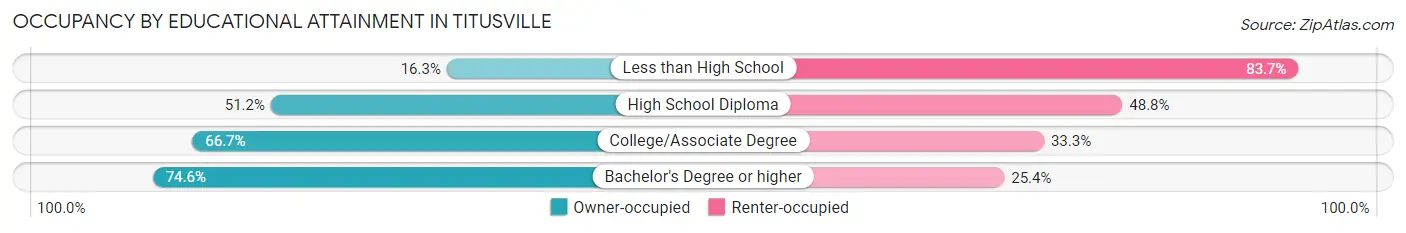
| Household Size | Owner-occupied | Renter-occupied |
| Less than High School | 23 (16.3%) | 118 (83.7%) |
| High School Diploma | 622 (51.2%) | 593 (48.8%) |
| College/Associate Degree | 365 (66.7%) | 182 (33.3%) |
| Bachelor's Degree or higher | 326 (74.6%) | 111 (25.4%) |
Occupancy by Age of Householder in Titusville
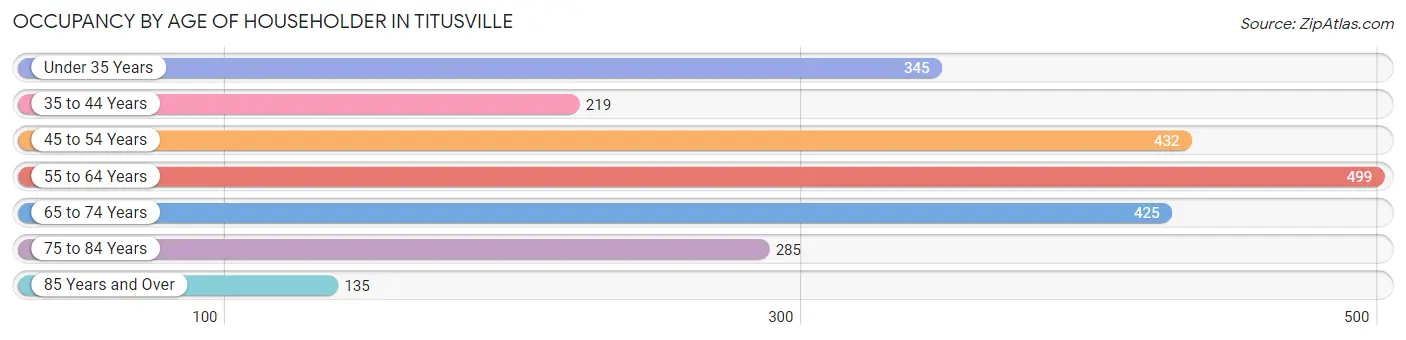
| Age Bracket | # Households | % Households |
| Under 35 Years | 345 | 14.7% |
| 35 to 44 Years | 219 | 9.4% |
| 45 to 54 Years | 432 | 18.5% |
| 55 to 64 Years | 499 | 21.3% |
| 65 to 74 Years | 425 | 18.2% |
| 75 to 84 Years | 285 | 12.2% |
| 85 Years and Over | 135 | 5.8% |
| Total | 2,340 | 100.0% |
Housing Finances in Titusville
Median Income by Occupancy in Titusville
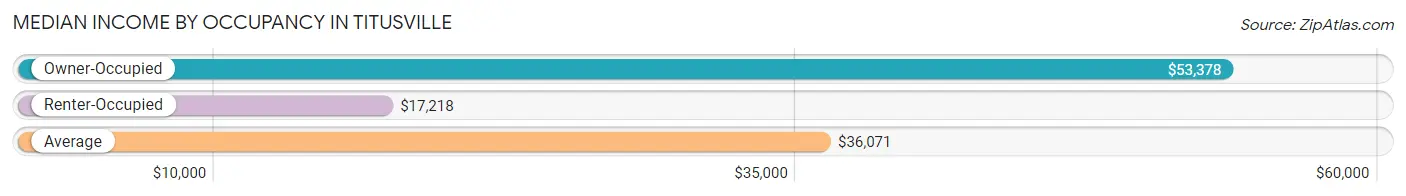
| Occupancy Type | # Households | Median Income |
| Owner-Occupied | 1,336 (57.1%) | $53,378 |
| Renter-Occupied | 1,004 (42.9%) | $17,218 |
| Average | 2,340 (100.0%) | $36,071 |
Occupancy by Householder Income Bracket in Titusville
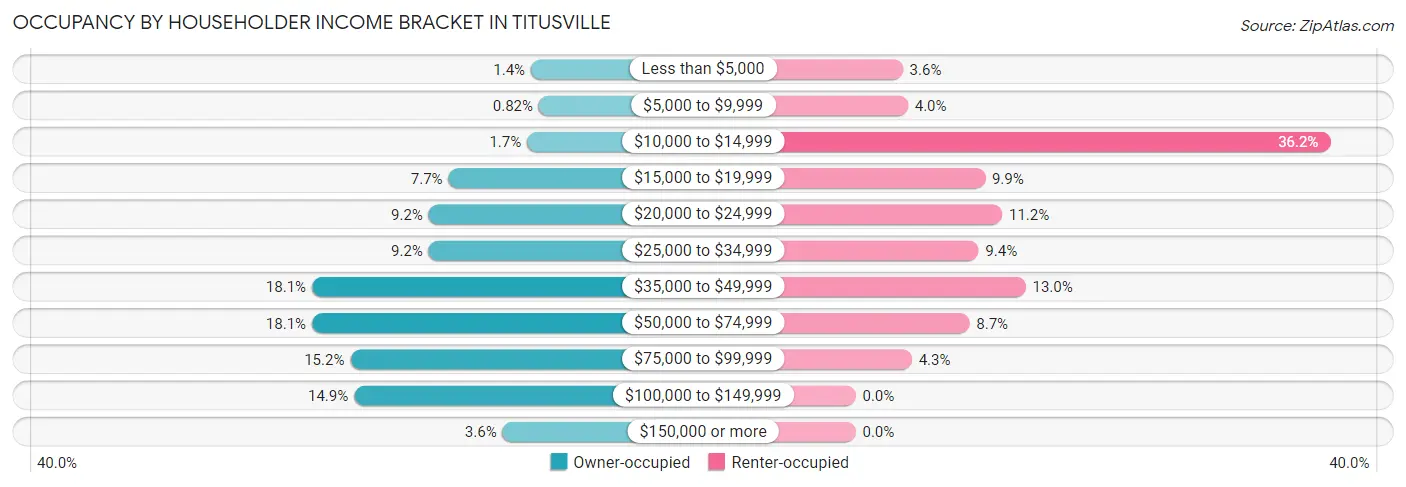
| Income Bracket | Owner-occupied | Renter-occupied |
| Less than $5,000 | 19 (1.4%) | 36 (3.6%) |
| $5,000 to $9,999 | 11 (0.8%) | 40 (4.0%) |
| $10,000 to $14,999 | 23 (1.7%) | 363 (36.2%) |
| $15,000 to $19,999 | 103 (7.7%) | 99 (9.9%) |
| $20,000 to $24,999 | 123 (9.2%) | 112 (11.2%) |
| $25,000 to $34,999 | 123 (9.2%) | 94 (9.4%) |
| $35,000 to $49,999 | 242 (18.1%) | 130 (13.0%) |
| $50,000 to $74,999 | 242 (18.1%) | 87 (8.7%) |
| $75,000 to $99,999 | 203 (15.2%) | 43 (4.3%) |
| $100,000 to $149,999 | 199 (14.9%) | 0 (0.0%) |
| $150,000 or more | 48 (3.6%) | 0 (0.0%) |
| Total | 1,336 (100.0%) | 1,004 (100.0%) |
Monthly Housing Cost Tiers in Titusville
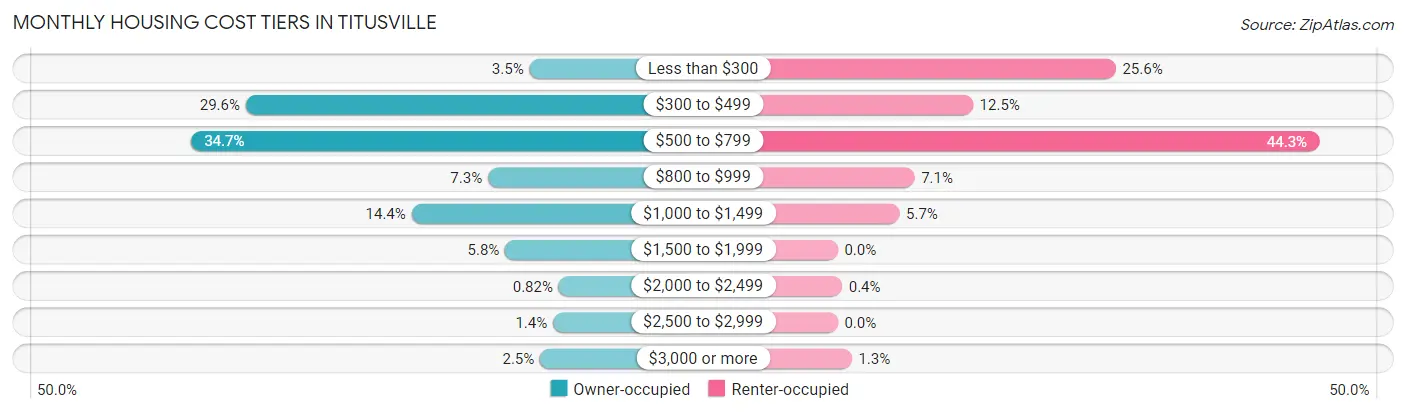
| Monthly Cost | Owner-occupied | Renter-occupied |
| Less than $300 | 47 (3.5%) | 257 (25.6%) |
| $300 to $499 | 396 (29.6%) | 125 (12.4%) |
| $500 to $799 | 463 (34.7%) | 445 (44.3%) |
| $800 to $999 | 98 (7.3%) | 71 (7.1%) |
| $1,000 to $1,499 | 192 (14.4%) | 57 (5.7%) |
| $1,500 to $1,999 | 77 (5.8%) | 0 (0.0%) |
| $2,000 to $2,499 | 11 (0.8%) | 4 (0.4%) |
| $2,500 to $2,999 | 18 (1.3%) | 0 (0.0%) |
| $3,000 or more | 34 (2.5%) | 13 (1.3%) |
| Total | 1,336 (100.0%) | 1,004 (100.0%) |
Physical Housing Characteristics in Titusville
Housing Structures in Titusville
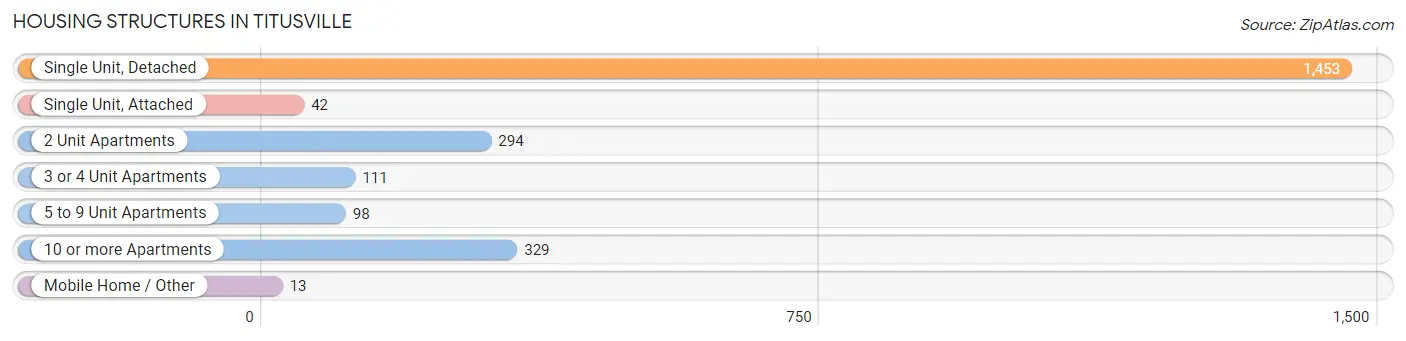
| Structure Type | # Housing Units | % Housing Units |
| Single Unit, Detached | 1,453 | 62.1% |
| Single Unit, Attached | 42 | 1.8% |
| 2 Unit Apartments | 294 | 12.6% |
| 3 or 4 Unit Apartments | 111 | 4.7% |
| 5 to 9 Unit Apartments | 98 | 4.2% |
| 10 or more Apartments | 329 | 14.1% |
| Mobile Home / Other | 13 | 0.6% |
| Total | 2,340 | 100.0% |
Housing Structures by Occupancy in Titusville
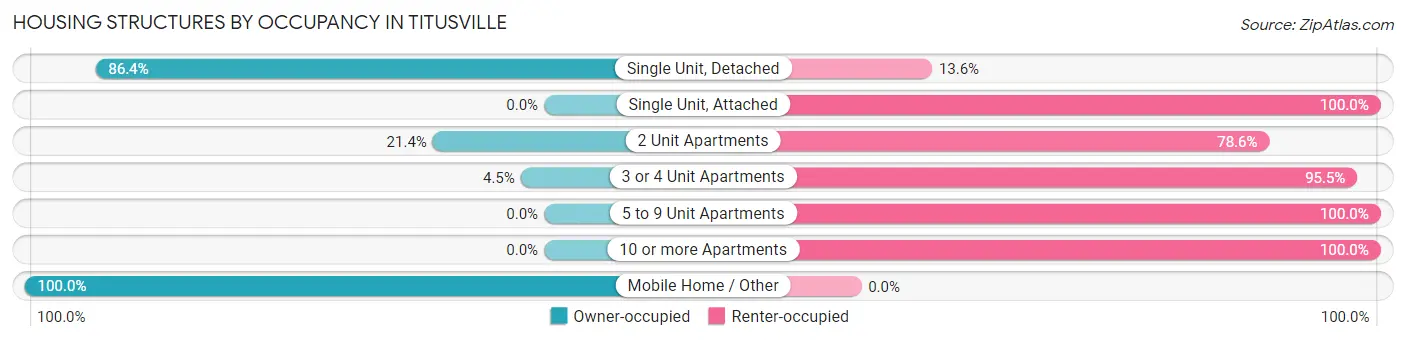
| Structure Type | Owner-occupied | Renter-occupied |
| Single Unit, Detached | 1,255 (86.4%) | 198 (13.6%) |
| Single Unit, Attached | 0 (0.0%) | 42 (100.0%) |
| 2 Unit Apartments | 63 (21.4%) | 231 (78.6%) |
| 3 or 4 Unit Apartments | 5 (4.5%) | 106 (95.5%) |
| 5 to 9 Unit Apartments | 0 (0.0%) | 98 (100.0%) |
| 10 or more Apartments | 0 (0.0%) | 329 (100.0%) |
| Mobile Home / Other | 13 (100.0%) | 0 (0.0%) |
| Total | 1,336 (57.1%) | 1,004 (42.9%) |
Housing Structures by Number of Rooms in Titusville
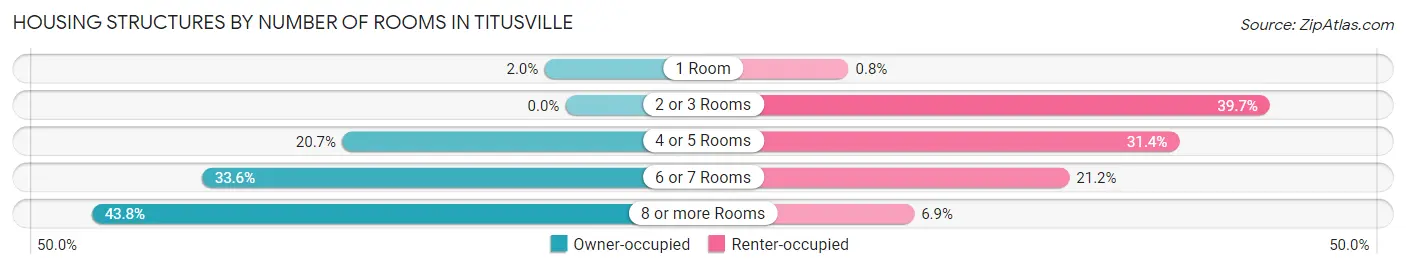
| Number of Rooms | Owner-occupied | Renter-occupied |
| 1 Room | 26 (1.9%) | 8 (0.8%) |
| 2 or 3 Rooms | 0 (0.0%) | 399 (39.7%) |
| 4 or 5 Rooms | 276 (20.7%) | 315 (31.4%) |
| 6 or 7 Rooms | 449 (33.6%) | 213 (21.2%) |
| 8 or more Rooms | 585 (43.8%) | 69 (6.9%) |
| Total | 1,336 (100.0%) | 1,004 (100.0%) |
Housing Structure by Heating Type in Titusville
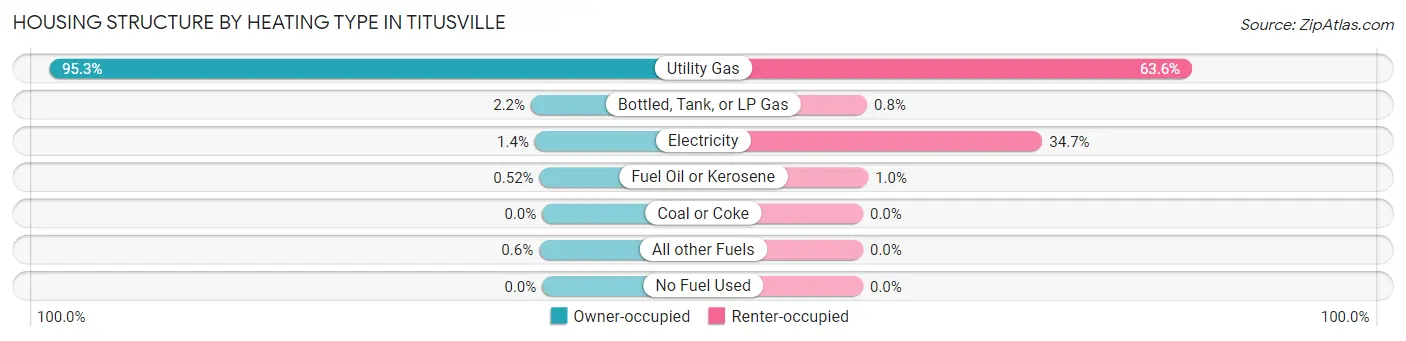
| Heating Type | Owner-occupied | Renter-occupied |
| Utility Gas | 1,273 (95.3%) | 638 (63.5%) |
| Bottled, Tank, or LP Gas | 29 (2.2%) | 8 (0.8%) |
| Electricity | 19 (1.4%) | 348 (34.7%) |
| Fuel Oil or Kerosene | 7 (0.5%) | 10 (1.0%) |
| Coal or Coke | 0 (0.0%) | 0 (0.0%) |
| All other Fuels | 8 (0.6%) | 0 (0.0%) |
| No Fuel Used | 0 (0.0%) | 0 (0.0%) |
| Total | 1,336 (100.0%) | 1,004 (100.0%) |
Household Vehicle Usage in Titusville
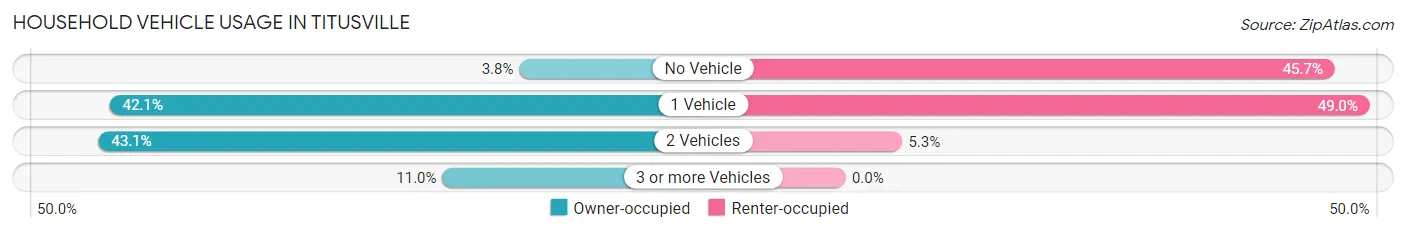
| Vehicles per Household | Owner-occupied | Renter-occupied |
| No Vehicle | 51 (3.8%) | 459 (45.7%) |
| 1 Vehicle | 562 (42.1%) | 492 (49.0%) |
| 2 Vehicles | 576 (43.1%) | 53 (5.3%) |
| 3 or more Vehicles | 147 (11.0%) | 0 (0.0%) |
| Total | 1,336 (100.0%) | 1,004 (100.0%) |
Real Estate & Mortgages in Titusville
Real Estate and Mortgage Overview in Titusville
| Characteristic | Without Mortgage | With Mortgage |
| Housing Units | 685 | 651 |
| Median Property Value | $69,000 | $73,300 |
| Median Household Income | $42,699 | $19 |
| Monthly Housing Costs | $491 | $23 |
| Real Estate Taxes | $1,452 | $19 |
Property Value by Mortgage Status in Titusville
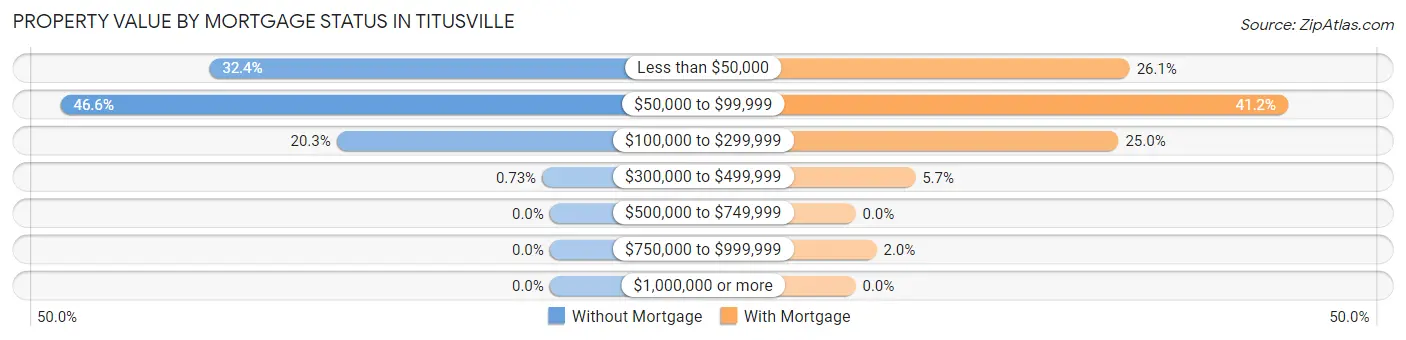
| Property Value | Without Mortgage | With Mortgage |
| Less than $50,000 | 222 (32.4%) | 170 (26.1%) |
| $50,000 to $99,999 | 319 (46.6%) | 268 (41.2%) |
| $100,000 to $299,999 | 139 (20.3%) | 163 (25.0%) |
| $300,000 to $499,999 | 5 (0.7%) | 37 (5.7%) |
| $500,000 to $749,999 | 0 (0.0%) | 0 (0.0%) |
| $750,000 to $999,999 | 0 (0.0%) | 13 (2.0%) |
| $1,000,000 or more | 0 (0.0%) | 0 (0.0%) |
| Total | 685 (100.0%) | 651 (100.0%) |
Household Income by Mortgage Status in Titusville
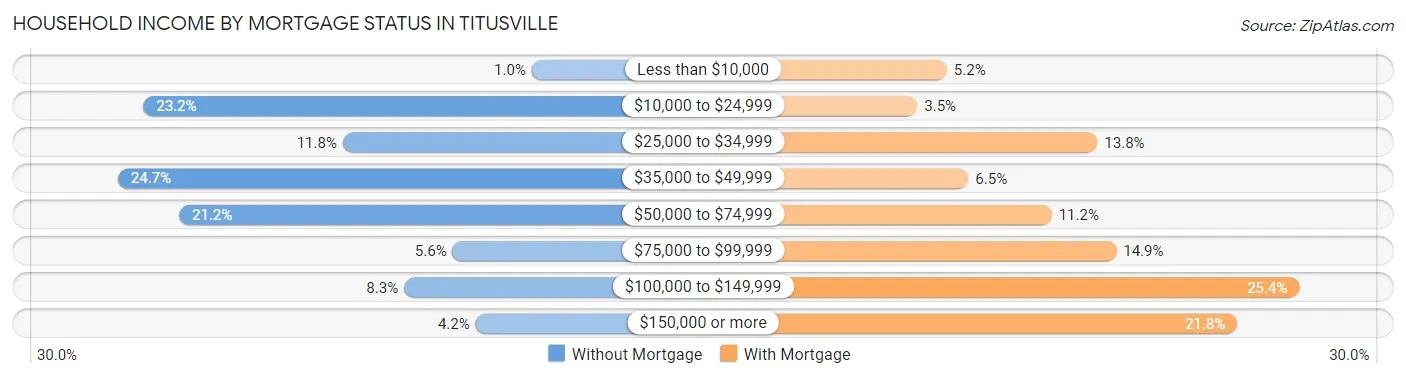
| Household Income | Without Mortgage | With Mortgage |
| Less than $10,000 | 7 (1.0%) | 34 (5.2%) |
| $10,000 to $24,999 | 159 (23.2%) | 23 (3.5%) |
| $25,000 to $34,999 | 81 (11.8%) | 90 (13.8%) |
| $35,000 to $49,999 | 169 (24.7%) | 42 (6.5%) |
| $50,000 to $74,999 | 145 (21.2%) | 73 (11.2%) |
| $75,000 to $99,999 | 38 (5.6%) | 97 (14.9%) |
| $100,000 to $149,999 | 57 (8.3%) | 165 (25.4%) |
| $150,000 or more | 29 (4.2%) | 142 (21.8%) |
| Total | 685 (100.0%) | 651 (100.0%) |
Property Value to Household Income Ratio in Titusville
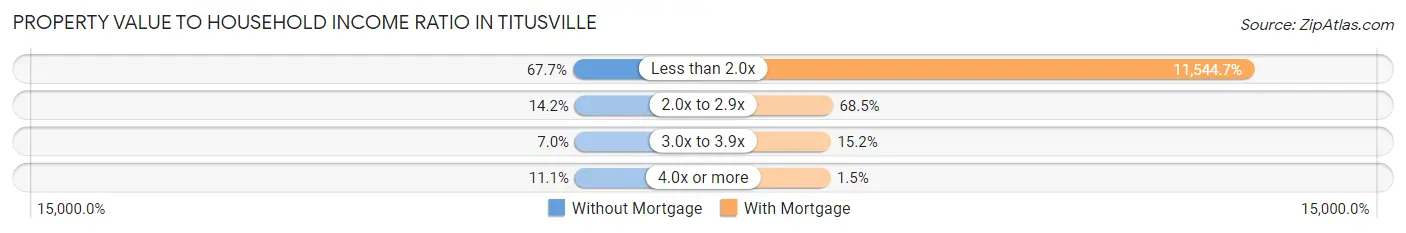
| Value-to-Income Ratio | Without Mortgage | With Mortgage |
| Less than 2.0x | 464 (67.7%) | 75,156 (11,544.7%) |
| 2.0x to 2.9x | 97 (14.2%) | 446 (68.5%) |
| 3.0x to 3.9x | 48 (7.0%) | 99 (15.2%) |
| 4.0x or more | 76 (11.1%) | 10 (1.5%) |
| Total | 685 (100.0%) | 651 (100.0%) |
Real Estate Taxes by Mortgage Status in Titusville
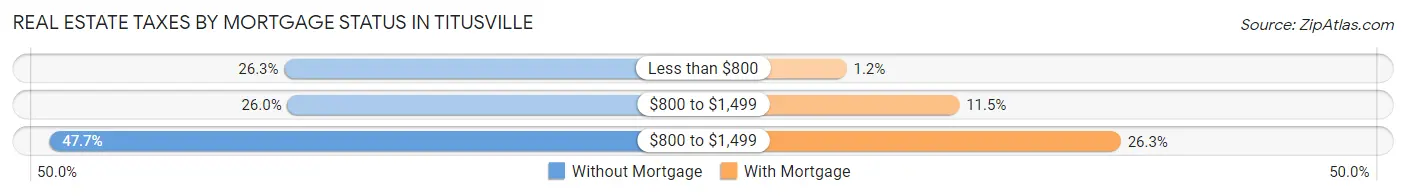
| Property Taxes | Without Mortgage | With Mortgage |
| Less than $800 | 180 (26.3%) | 8 (1.2%) |
| $800 to $1,499 | 178 (26.0%) | 75 (11.5%) |
| $800 to $1,499 | 327 (47.7%) | 171 (26.3%) |
| Total | 685 (100.0%) | 651 (100.0%) |
Health & Disability in Titusville
Health Insurance Coverage by Age in Titusville
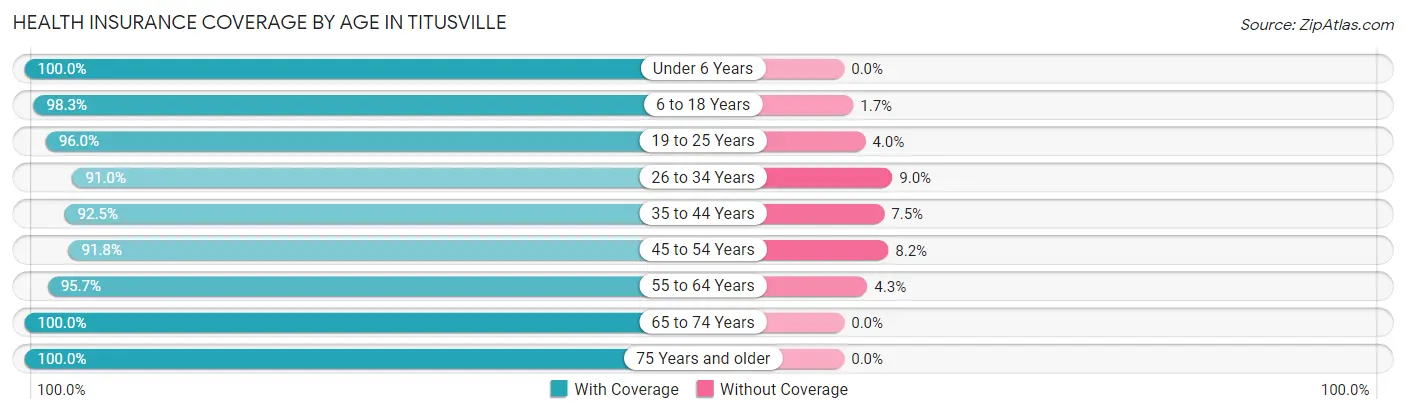
| Age Bracket | With Coverage | Without Coverage |
| Under 6 Years | 250 (100.0%) | 0 (0.0%) |
| 6 to 18 Years | 874 (98.3%) | 15 (1.7%) |
| 19 to 25 Years | 582 (96.0%) | 24 (4.0%) |
| 26 to 34 Years | 447 (91.0%) | 44 (9.0%) |
| 35 to 44 Years | 421 (92.5%) | 34 (7.5%) |
| 45 to 54 Years | 537 (91.8%) | 48 (8.2%) |
| 55 to 64 Years | 689 (95.7%) | 31 (4.3%) |
| 65 to 74 Years | 666 (100.0%) | 0 (0.0%) |
| 75 Years and older | 508 (100.0%) | 0 (0.0%) |
| Total | 4,974 (96.2%) | 196 (3.8%) |
Health Insurance Coverage by Citizenship Status in Titusville
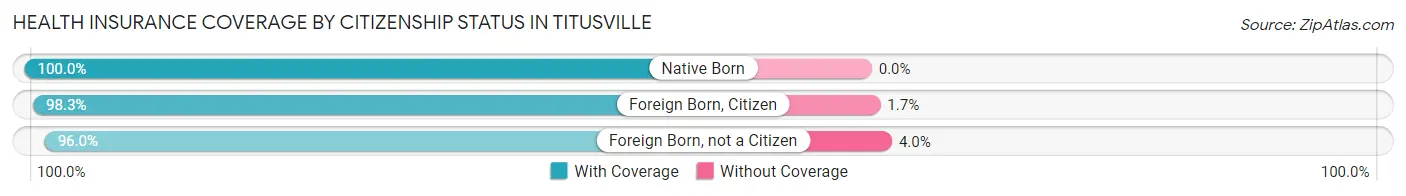
| Citizenship Status | With Coverage | Without Coverage |
| Native Born | 250 (100.0%) | 0 (0.0%) |
| Foreign Born, Citizen | 874 (98.3%) | 15 (1.7%) |
| Foreign Born, not a Citizen | 582 (96.0%) | 24 (4.0%) |
Health Insurance Coverage by Household Income in Titusville
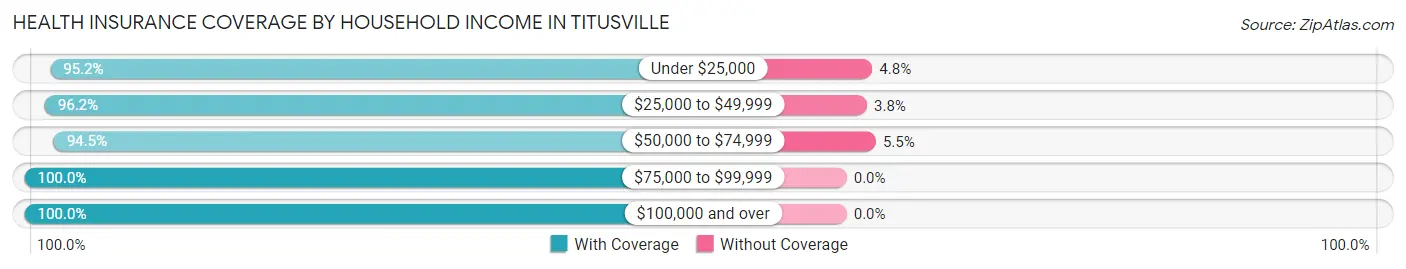
| Household Income | With Coverage | Without Coverage |
| Under $25,000 | 1,270 (95.2%) | 64 (4.8%) |
| $25,000 to $49,999 | 1,394 (96.2%) | 55 (3.8%) |
| $50,000 to $74,999 | 812 (94.5%) | 47 (5.5%) |
| $75,000 to $99,999 | 483 (100.0%) | 0 (0.0%) |
| $100,000 and over | 839 (100.0%) | 0 (0.0%) |
Public vs Private Health Insurance Coverage by Age in Titusville
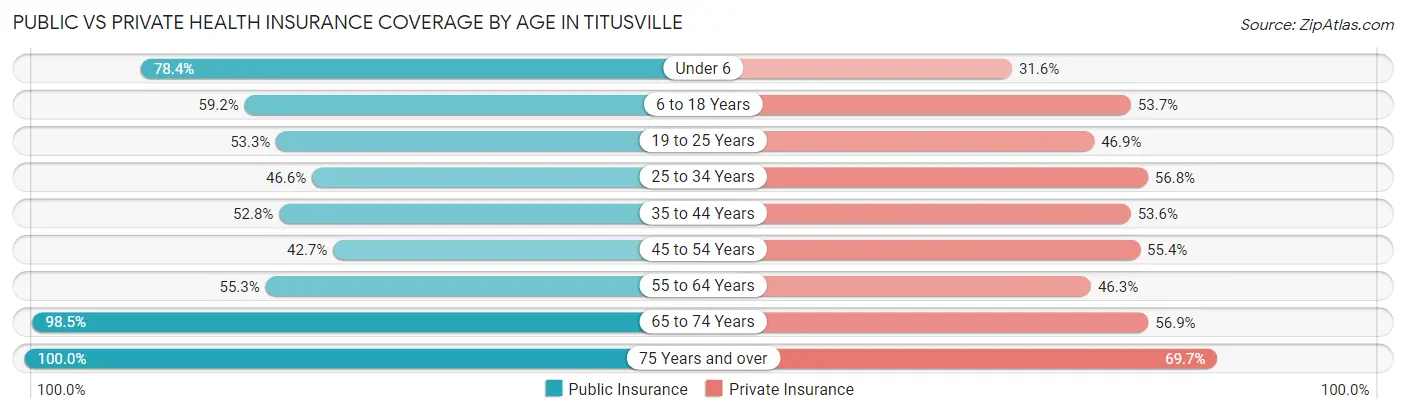
| Age Bracket | Public Insurance | Private Insurance |
| Under 6 | 196 (78.4%) | 79 (31.6%) |
| 6 to 18 Years | 526 (59.2%) | 477 (53.7%) |
| 19 to 25 Years | 323 (53.3%) | 284 (46.9%) |
| 25 to 34 Years | 229 (46.6%) | 279 (56.8%) |
| 35 to 44 Years | 240 (52.7%) | 244 (53.6%) |
| 45 to 54 Years | 250 (42.7%) | 324 (55.4%) |
| 55 to 64 Years | 398 (55.3%) | 333 (46.3%) |
| 65 to 74 Years | 656 (98.5%) | 379 (56.9%) |
| 75 Years and over | 508 (100.0%) | 354 (69.7%) |
| Total | 3,326 (64.3%) | 2,753 (53.2%) |
Disability Status by Sex by Age in Titusville
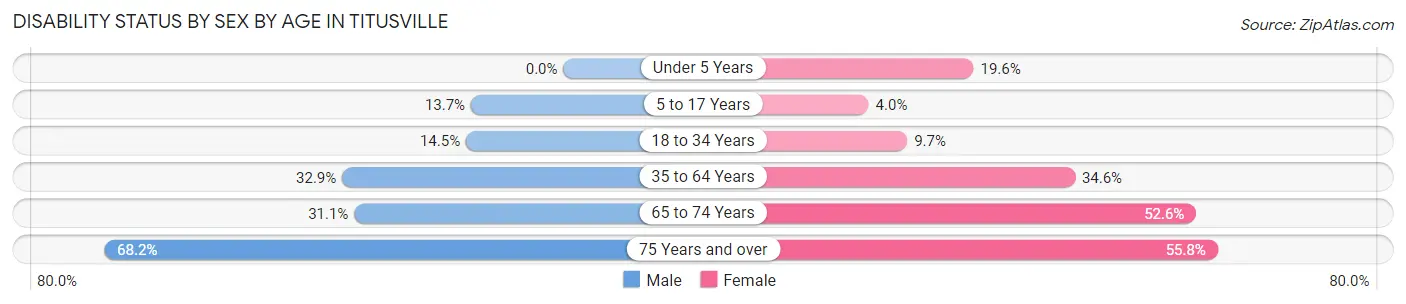
| Age Bracket | Male | Female |
| Under 5 Years | 0 (0.0%) | 18 (19.6%) |
| 5 to 17 Years | 73 (13.7%) | 14 (4.0%) |
| 18 to 34 Years | 81 (14.5%) | 58 (9.7%) |
| 35 to 64 Years | 228 (32.9%) | 369 (34.6%) |
| 65 to 74 Years | 100 (31.1%) | 181 (52.6%) |
| 75 Years and over | 135 (68.2%) | 173 (55.8%) |
Disability Class by Sex by Age in Titusville
Disability Class: Hearing Difficulty
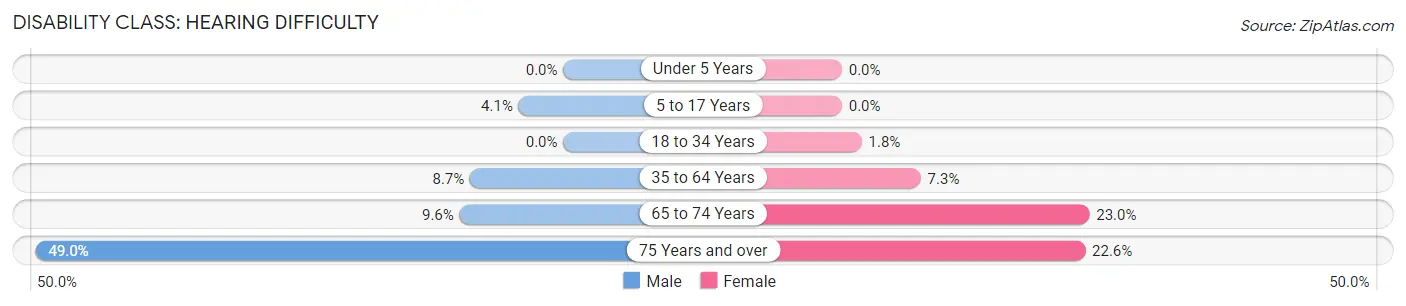
| Age Bracket | Male | Female |
| Under 5 Years | 0 (0.0%) | 0 (0.0%) |
| 5 to 17 Years | 22 (4.1%) | 0 (0.0%) |
| 18 to 34 Years | 0 (0.0%) | 11 (1.8%) |
| 35 to 64 Years | 60 (8.6%) | 78 (7.3%) |
| 65 to 74 Years | 31 (9.6%) | 79 (23.0%) |
| 75 Years and over | 97 (49.0%) | 70 (22.6%) |
Disability Class: Vision Difficulty
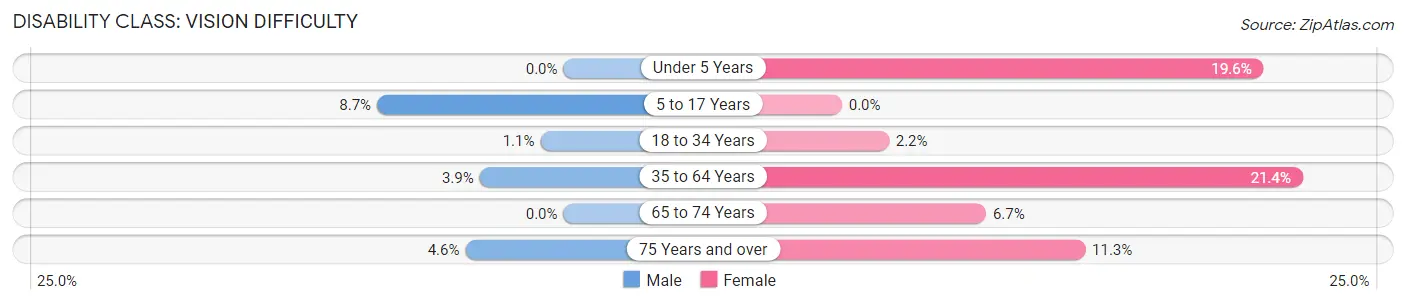
| Age Bracket | Male | Female |
| Under 5 Years | 0 (0.0%) | 18 (19.6%) |
| 5 to 17 Years | 46 (8.6%) | 0 (0.0%) |
| 18 to 34 Years | 6 (1.1%) | 13 (2.2%) |
| 35 to 64 Years | 27 (3.9%) | 228 (21.4%) |
| 65 to 74 Years | 0 (0.0%) | 23 (6.7%) |
| 75 Years and over | 9 (4.5%) | 35 (11.3%) |
Disability Class: Cognitive Difficulty
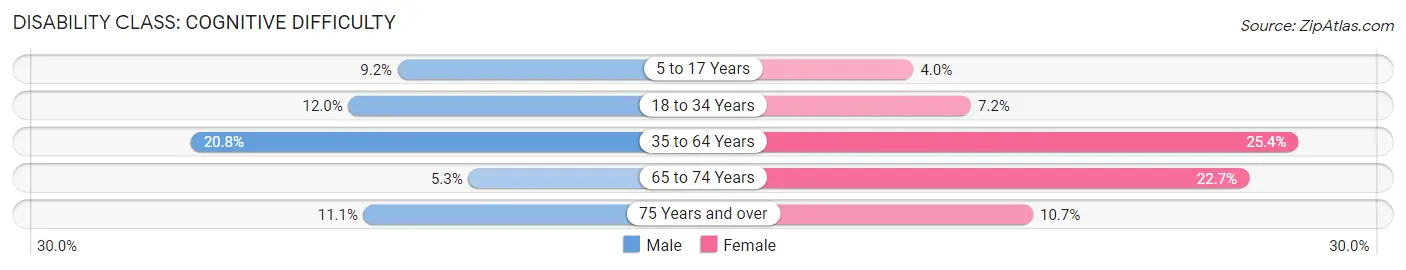
| Age Bracket | Male | Female |
| 5 to 17 Years | 49 (9.2%) | 14 (4.0%) |
| 18 to 34 Years | 67 (12.0%) | 43 (7.2%) |
| 35 to 64 Years | 144 (20.7%) | 271 (25.4%) |
| 65 to 74 Years | 17 (5.3%) | 78 (22.7%) |
| 75 Years and over | 22 (11.1%) | 33 (10.6%) |
Disability Class: Ambulatory Difficulty
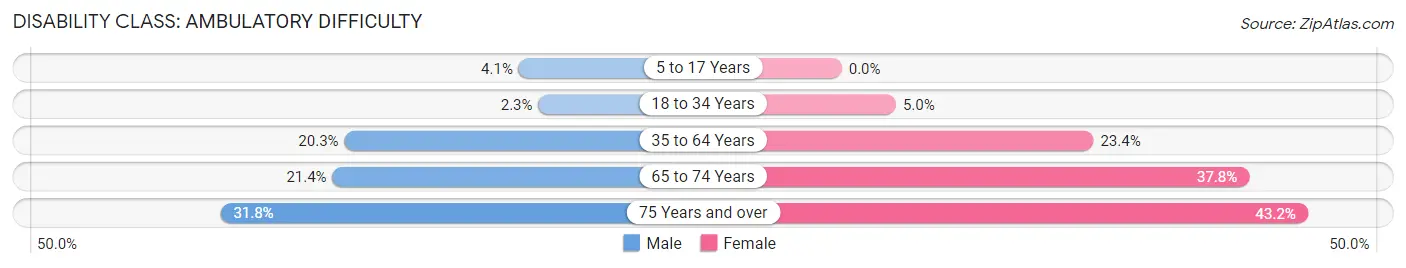
| Age Bracket | Male | Female |
| 5 to 17 Years | 22 (4.1%) | 0 (0.0%) |
| 18 to 34 Years | 13 (2.3%) | 30 (5.0%) |
| 35 to 64 Years | 141 (20.3%) | 249 (23.4%) |
| 65 to 74 Years | 69 (21.4%) | 130 (37.8%) |
| 75 Years and over | 63 (31.8%) | 134 (43.2%) |
Disability Class: Self-Care Difficulty
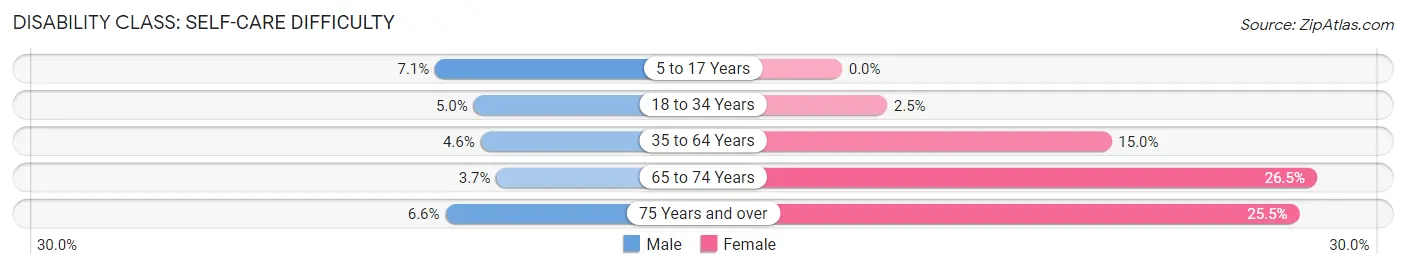
| Age Bracket | Male | Female |
| 5 to 17 Years | 38 (7.1%) | 0 (0.0%) |
| 18 to 34 Years | 28 (5.0%) | 15 (2.5%) |
| 35 to 64 Years | 32 (4.6%) | 160 (15.0%) |
| 65 to 74 Years | 12 (3.7%) | 91 (26.5%) |
| 75 Years and over | 13 (6.6%) | 79 (25.5%) |
Technology Access in Titusville
Computing Device Access in Titusville
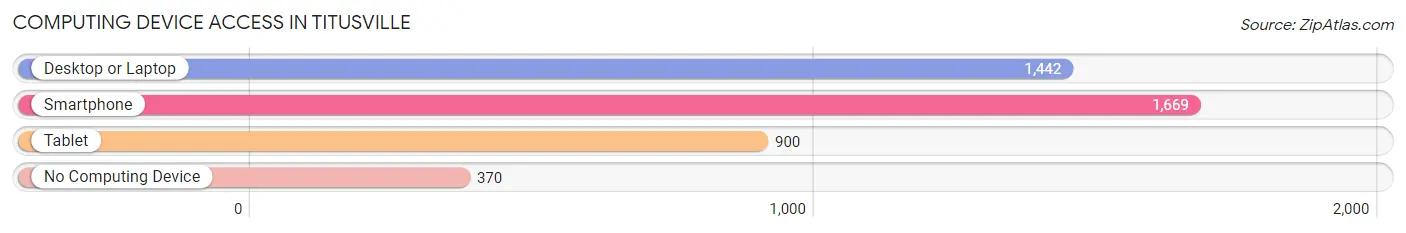
| Device Type | # Households | % Households |
| Desktop or Laptop | 1,442 | 61.6% |
| Smartphone | 1,669 | 71.3% |
| Tablet | 900 | 38.5% |
| No Computing Device | 370 | 15.8% |
| Total | 2,340 | 100.0% |
Internet Access in Titusville
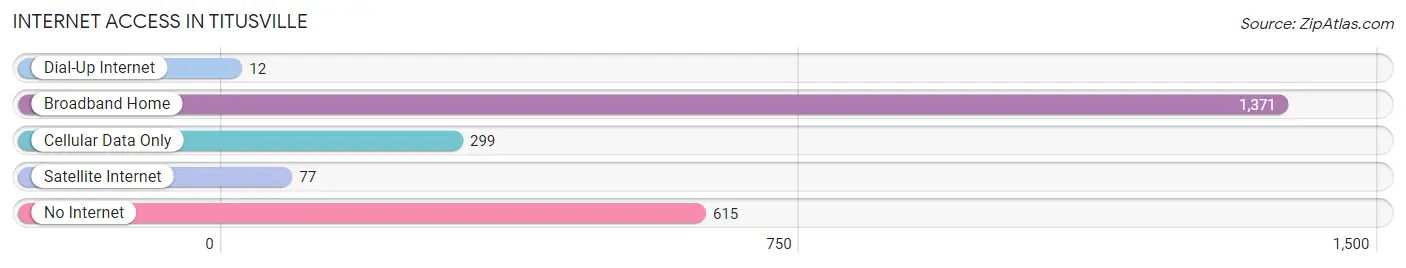
| Internet Type | # Households | % Households |
| Dial-Up Internet | 12 | 0.5% |
| Broadband Home | 1,371 | 58.6% |
| Cellular Data Only | 299 | 12.8% |
| Satellite Internet | 77 | 3.3% |
| No Internet | 615 | 26.3% |
| Total | 2,340 | 100.0% |
Titusville Summary
Titusville is a city located in Crawford County, Pennsylvania, United States. It is situated along the banks of the Oil Creek, approximately 30 miles south of Erie. The city is the birthplace of the modern oil industry, and is home to the Drake Well Museum, which commemorates the first successful oil well drilled in the United States. As of the 2010 census, the city had a total population of 5,601.
History
Titusville was founded in 1796 by Jonathan Titus, a settler from New Jersey. The city was originally known as "Titusville, or Oil Creek", and was incorporated as a borough in 1849. The city was named after Jonathan Titus, who was the first settler in the area.
In 1859, Edwin Drake drilled the first successful oil well in the United States in Titusville. This event marked the beginning of the modern oil industry, and the city quickly became a center of oil production. By the late 19th century, Titusville was one of the largest oil-producing cities in the world.
In the early 20th century, the city's economy shifted away from oil production and towards manufacturing. The city's population peaked in the 1950s, but has since declined due to the decline of the manufacturing industry.
Geography
Titusville is located at 41°37′N 79°41′W (41.619, -79.683). According to the United States Census Bureau, the city has a total area of 2.3 square miles (6.0 km2), all of it land.
The city is located in the foothills of the Allegheny Mountains, and is surrounded by rolling hills and forests. Oil Creek flows through the city, and is a popular destination for fishing and canoeing.
Economy
Titusville's economy is largely based on manufacturing and tourism. The city is home to several manufacturing companies, including a paper mill, a plastics plant, and a metal fabrication plant. The city is also home to the Drake Well Museum, which is a popular tourist destination.
The city's unemployment rate was 5.2% in 2019, which is lower than the national average of 3.7%. The median household income in Titusville was $37,845 in 2019, which is lower than the national median of $61,937.
Demographics
As of the 2010 census, there were 5,601 people, 2,521 households, and 1,521 families residing in the city. The population density was 2,427.3 people per square mile (937.2/km2). There were 2,817 housing units at an average density of 1,213.3 per square mile (468.7/km2). The racial makeup of the city was 97.2% White, 0.7% African American, 0.2% Native American, 0.4% Asian, 0.1% Pacific Islander, 0.4% from other races, and 1.0% from two or more races. Hispanic or Latino of any race were 1.2% of the population.
There were 2,521 households, out of which 25.2% had children under the age of 18 living with them, 43.2% were married couples living together, 13.2% had a female householder with no husband present, and 39.2% were non-families. 33.7% of all households were made up of individuals, and 16.2% had someone living alone who was 65 years of age or older. The average household size was 2.22 and the average family size was 2.83.
In the city, the population was spread out, with 21.3% under the age of 18, 8.2% from 18 to 24, 25.2% from 25 to 44, 25.2% from 45 to 64, and 20.1% who were 65 years of age or older. The median age was 41 years. For every 100 females, there were 87.2 males. For every 100 females age 18 and over, there were 83.3 males.
The median income for a household in the city was $30,917, and the median income for a family was $38,958. Males had a median income of $31,917 versus $21,917 for females. The per capita income for the city was $17,845. About 11.2% of families and 14.2% of the population were below the poverty line, including 20.2% of those under age 18 and 8.7% of those age 65 or over.
Common Questions
What is Per Capita Income in Titusville?
Per Capita income in Titusville is $21,948.
What is the Median Family Income in Titusville?
Median Family Income in Titusville is $42,500.
What is the Median Household income in Titusville?
Median Household Income in Titusville is $36,071.
What is Income or Wage Gap in Titusville?
Income or Wage Gap in Titusville is 0.9%.
Women in Titusville earn 99.1 cents for every dollar earned by a man.
What is Inequality or Gini Index in Titusville?
Inequality or Gini Index in Titusville is 0.43.
What is the Total Population of Titusville?
Total Population of Titusville is 5,262.
What is the Total Male Population of Titusville?
Total Male Population of Titusville is 2,440.
What is the Total Female Population of Titusville?
Total Female Population of Titusville is 2,822.
What is the Ratio of Males per 100 Females in Titusville?
There are 86.46 Males per 100 Females in Titusville.
What is the Ratio of Females per 100 Males in Titusville?
There are 115.66 Females per 100 Males in Titusville.
What is the Median Population Age in Titusville?
Median Population Age in Titusville is 41.9 Years.
What is the Average Family Size in Titusville
Average Family Size in Titusville is 3.0 People.
What is the Average Household Size in Titusville
Average Household Size in Titusville is 2.1 People.
How Large is the Labor Force in Titusville?
There are 2,092 People in the Labor Forcein in Titusville.
What is the Percentage of People in the Labor Force in Titusville?
48.3% of People are in the Labor Force in Titusville.
What is the Unemployment Rate in Titusville?
Unemployment Rate in Titusville is 7.7%.