Sylvania borough, PA Map & Demographics
Sylvania borough Overview
$28,585
PER CAPITA INCOME
$69,583
AVG FAMILY INCOME
$53,438
AVG HOUSEHOLD INCOME
70.6%
WAGE / INCOME GAP [ % ]
29.4¢/ $1
WAGE / INCOME GAP [ $ ]
0.40
INEQUALITY / GINI INDEX
246
TOTAL POPULATION
105
MALE POPULATION
141
FEMALE POPULATION
74.47
MALES / 100 FEMALES
134.29
FEMALES / 100 MALES
36.4
MEDIAN AGE
3.0
AVG FAMILY SIZE
2.6
AVG HOUSEHOLD SIZE
89
LABOR FORCE [ PEOPLE ]
50.9%
PERCENT IN LABOR FORCE
2.2%
UNEMPLOYMENT RATE
Income in Sylvania borough
Income Overview in Sylvania borough
Per Capita Income in Sylvania borough is $28,585, while median incomes of families and households are $69,583 and $53,438 respectively.
| Characteristic | Number | Measure |
| Per Capita Income | 246 | $28,585 |
| Median Family Income | 59 | $69,583 |
| Mean Family Income | 59 | $93,588 |
| Median Household Income | 93 | $53,438 |
| Mean Household Income | 93 | $74,786 |
| Income Deficit | 59 | $0 |
| Wage / Income Gap (%) | 246 | 70.58% |
| Wage / Income Gap ($) | 246 | 29.42¢ per $1 |
| Gini / Inequality Index | 246 | 0.40 |
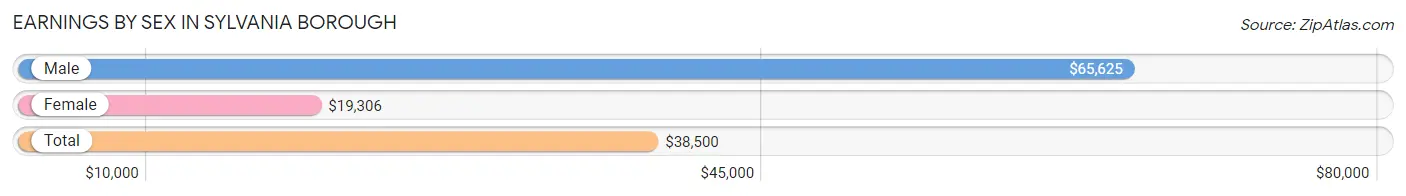
Earnings by Sex in Sylvania borough
Average Earnings in Sylvania borough are $38,500, $65,625 for men and $19,306 for women, a difference of 70.6%.
| Sex | Number | Average Earnings |
| Male | 41 (42.7%) | $65,625 |
| Female | 55 (57.3%) | $19,306 |
| Total | 96 (100.0%) | $38,500 |
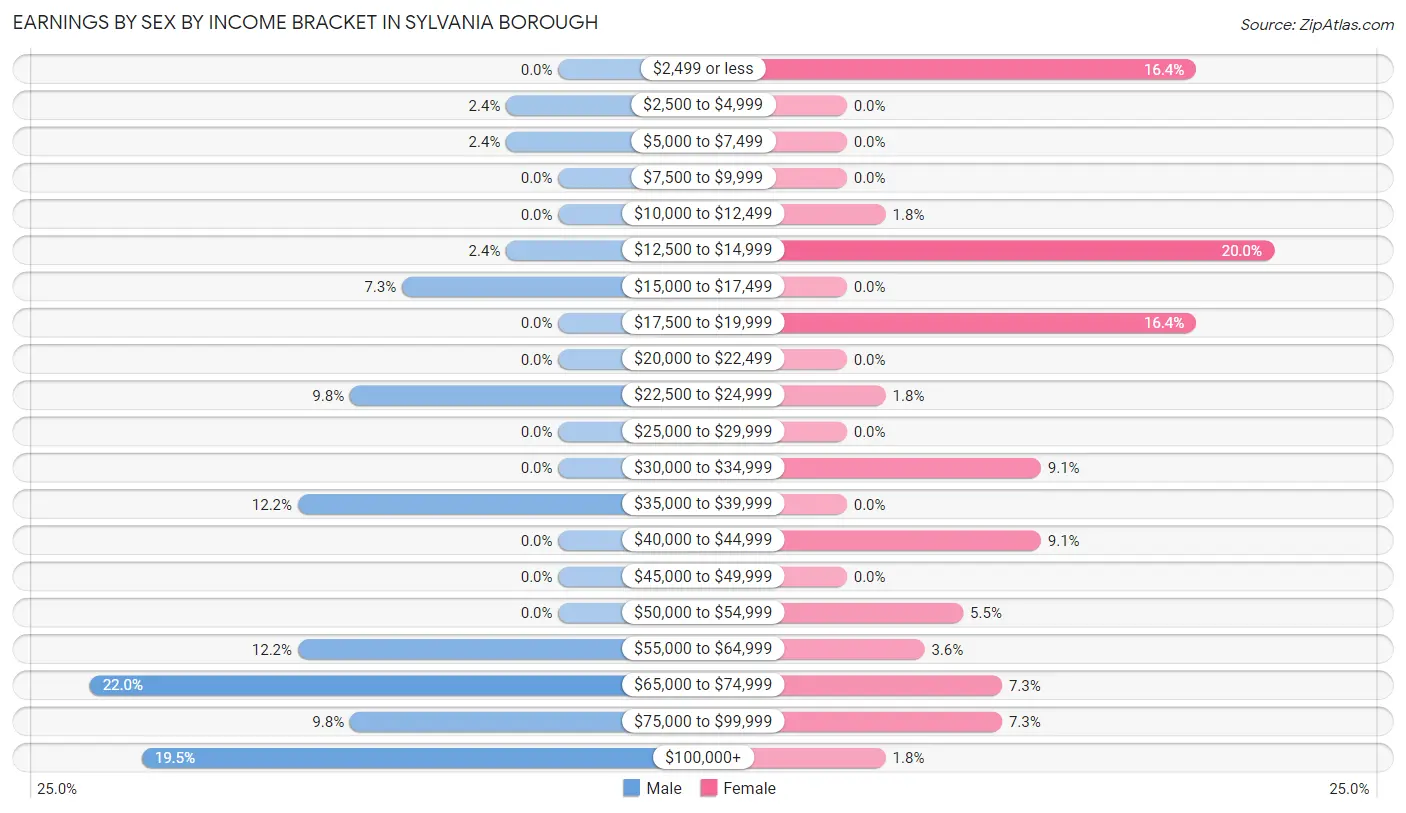
Earnings by Sex by Income Bracket in Sylvania borough
The most common earnings brackets in Sylvania borough are $65,000 to $74,999 for men (9 | 22.0%) and $12,500 to $14,999 for women (11 | 20.0%).
| Income | Male | Female |
| $2,499 or less | 0 (0.0%) | 9 (16.4%) |
| $2,500 to $4,999 | 1 (2.4%) | 0 (0.0%) |
| $5,000 to $7,499 | 1 (2.4%) | 0 (0.0%) |
| $7,500 to $9,999 | 0 (0.0%) | 0 (0.0%) |
| $10,000 to $12,499 | 0 (0.0%) | 1 (1.8%) |
| $12,500 to $14,999 | 1 (2.4%) | 11 (20.0%) |
| $15,000 to $17,499 | 3 (7.3%) | 0 (0.0%) |
| $17,500 to $19,999 | 0 (0.0%) | 9 (16.4%) |
| $20,000 to $22,499 | 0 (0.0%) | 0 (0.0%) |
| $22,500 to $24,999 | 4 (9.8%) | 1 (1.8%) |
| $25,000 to $29,999 | 0 (0.0%) | 0 (0.0%) |
| $30,000 to $34,999 | 0 (0.0%) | 5 (9.1%) |
| $35,000 to $39,999 | 5 (12.2%) | 0 (0.0%) |
| $40,000 to $44,999 | 0 (0.0%) | 5 (9.1%) |
| $45,000 to $49,999 | 0 (0.0%) | 0 (0.0%) |
| $50,000 to $54,999 | 0 (0.0%) | 3 (5.4%) |
| $55,000 to $64,999 | 5 (12.2%) | 2 (3.6%) |
| $65,000 to $74,999 | 9 (22.0%) | 4 (7.3%) |
| $75,000 to $99,999 | 4 (9.8%) | 4 (7.3%) |
| $100,000+ | 8 (19.5%) | 1 (1.8%) |
| Total | 41 (100.0%) | 55 (100.0%) |
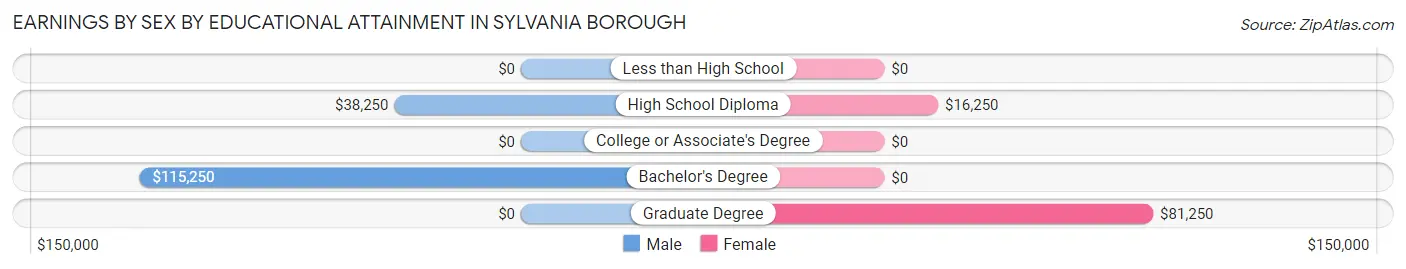
Earnings by Sex by Educational Attainment in Sylvania borough
| Educational Attainment | Male Income | Female Income |
| Less than High School | - | - |
| High School Diploma | $38,250 | $16,250 |
| College or Associate's Degree | - | - |
| Bachelor's Degree | $115,250 | $0 |
| Graduate Degree | - | - |
| Total | $66,250 | $0 |
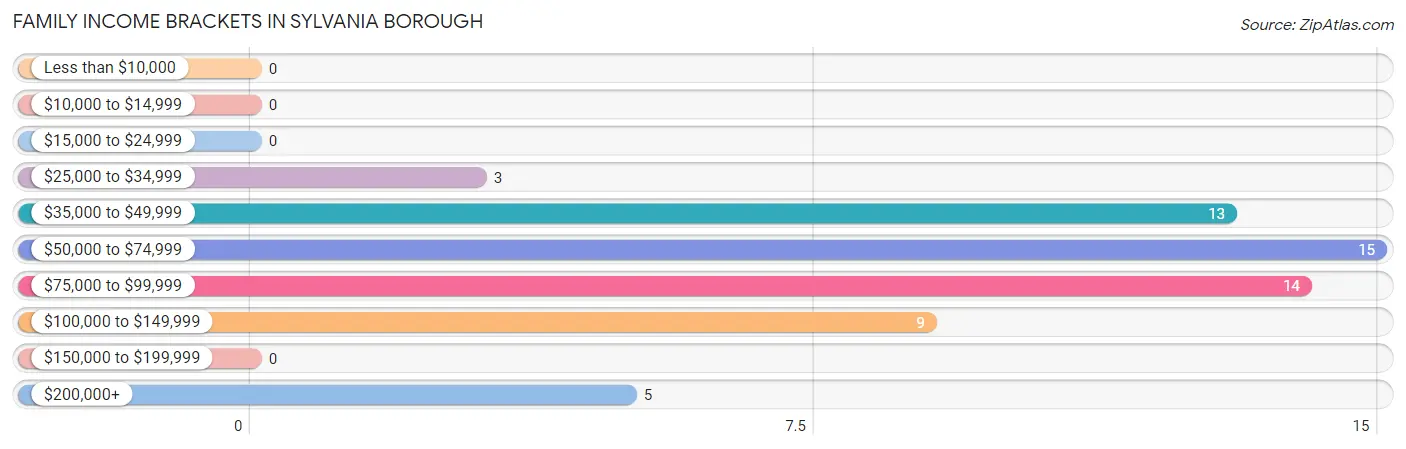
Family Income in Sylvania borough
Family Income Brackets in Sylvania borough
According to the Sylvania borough family income data, there are 15 families falling into the $50,000 to $74,999 income range, which is the most common income bracket and makes up 25.4% of all families.
| Income Bracket | # Families | % Families |
| Less than $10,000 | 0 | 0.0% |
| $10,000 to $14,999 | 0 | 0.0% |
| $15,000 to $24,999 | 0 | 0.0% |
| $25,000 to $34,999 | 3 | 5.1% |
| $35,000 to $49,999 | 13 | 22.0% |
| $50,000 to $74,999 | 15 | 25.4% |
| $75,000 to $99,999 | 14 | 23.7% |
| $100,000 to $149,999 | 9 | 15.3% |
| $150,000 to $199,999 | 0 | 0.0% |
| $200,000+ | 5 | 8.5% |
Family Income by Famaliy Size in Sylvania borough
4-person families (16 | 27.1%) account for the highest median family income in Sylvania borough with $90,833 per family, while 2-person families (25 | 42.4%) have the highest median income of $26,406 per family member.
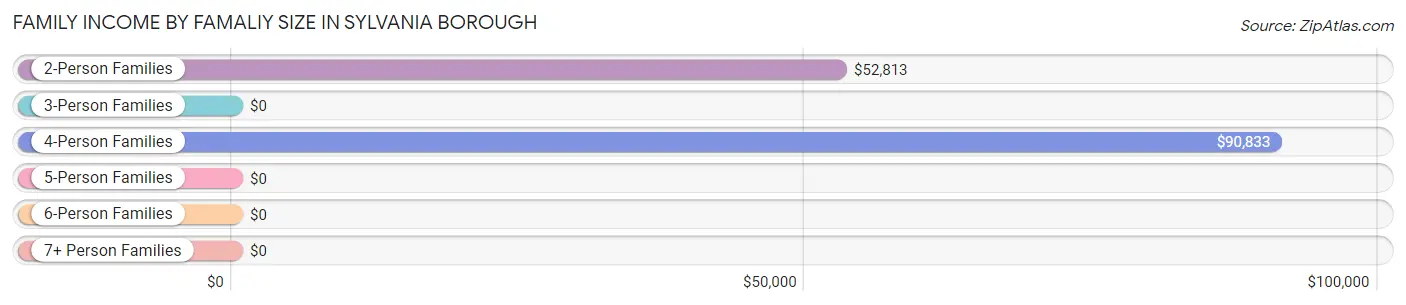
| Income Bracket | # Families | Median Income |
| 2-Person Families | 25 (42.4%) | $52,813 |
| 3-Person Families | 13 (22.0%) | $0 |
| 4-Person Families | 16 (27.1%) | $90,833 |
| 5-Person Families | 3 (5.1%) | $0 |
| 6-Person Families | 2 (3.4%) | $0 |
| 7+ Person Families | 0 (0.0%) | $0 |
| Total | 59 (100.0%) | $69,583 |
Family Income by Number of Earners in Sylvania borough
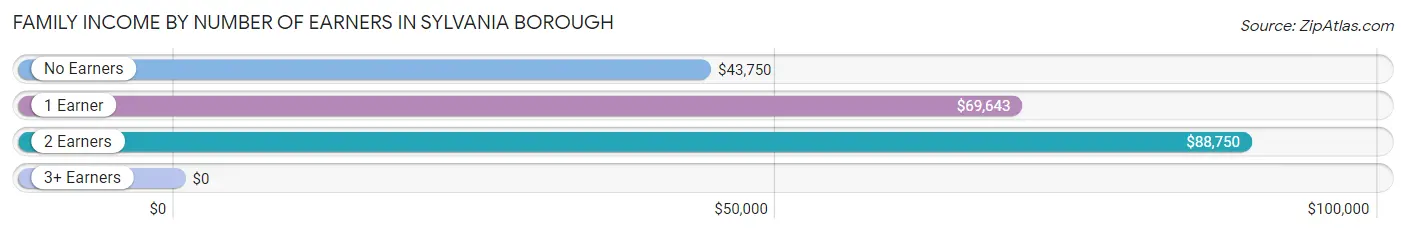
| Number of Earners | # Families | Median Income |
| No Earners | 14 (23.7%) | $43,750 |
| 1 Earner | 18 (30.5%) | $69,643 |
| 2 Earners | 23 (39.0%) | $88,750 |
| 3+ Earners | 4 (6.8%) | $0 |
| Total | 59 (100.0%) | $69,583 |
Household Income in Sylvania borough
Household Income Brackets in Sylvania borough
With 29 households falling in the category, the $35,000 to $49,999 income range is the most frequent in Sylvania borough, accounting for 31.2% of all households.
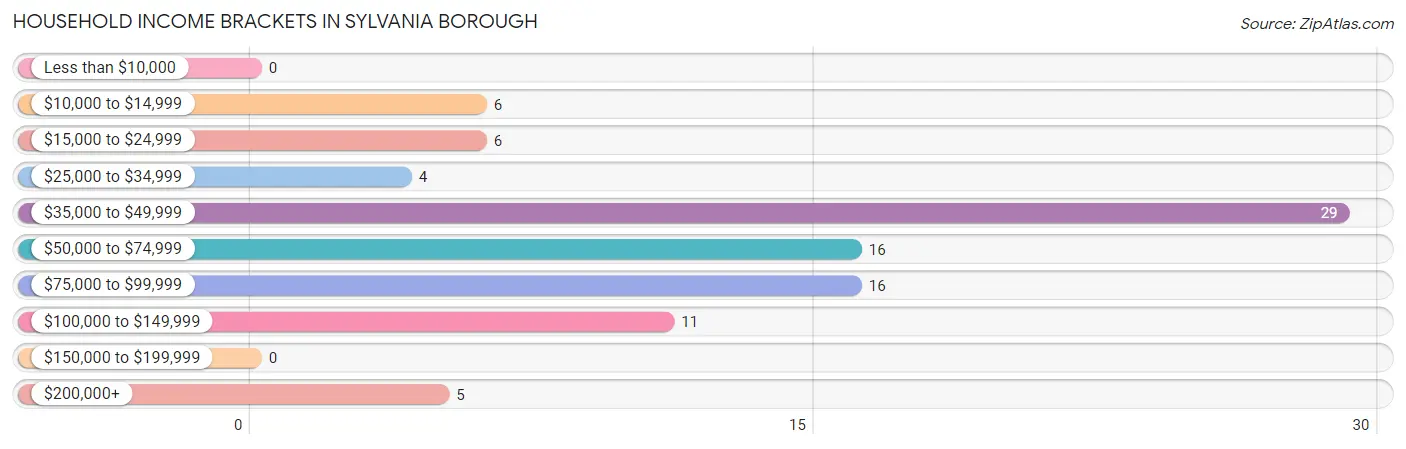
| Income Bracket | # Households | % Households |
| Less than $10,000 | 0 | 0.0% |
| $10,000 to $14,999 | 6 | 6.5% |
| $15,000 to $24,999 | 6 | 6.5% |
| $25,000 to $34,999 | 4 | 4.3% |
| $35,000 to $49,999 | 29 | 31.2% |
| $50,000 to $74,999 | 16 | 17.2% |
| $75,000 to $99,999 | 16 | 17.2% |
| $100,000 to $149,999 | 11 | 11.8% |
| $150,000 to $199,999 | 0 | 0.0% |
| $200,000+ | 5 | 5.4% |
Household Income by Householder Age in Sylvania borough
The median household income in Sylvania borough is $53,438, with the highest median household income of $90,556 found in the 25 to 44 years age bracket for the primary householder. A total of 36 households (38.7%) fall into this category.
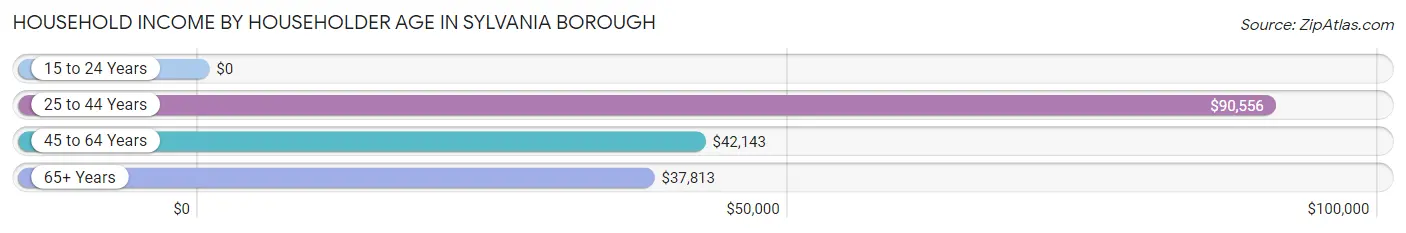
| Income Bracket | # Households | Median Income |
| 15 to 24 Years | 0 (0.0%) | $0 |
| 25 to 44 Years | 36 (38.7%) | $90,556 |
| 45 to 64 Years | 28 (30.1%) | $42,143 |
| 65+ Years | 29 (31.2%) | $37,813 |
| Total | 93 (100.0%) | $53,438 |
Poverty in Sylvania borough
Income Below Poverty by Sex and Age in Sylvania borough
With 6.7% poverty level for males and 21.3% for females among the residents of Sylvania borough, 35 to 44 year old males and 25 to 34 year old females are the most vulnerable to poverty, with 7 males (50.0%) and 18 females (64.3%) in their respective age groups living below the poverty level.
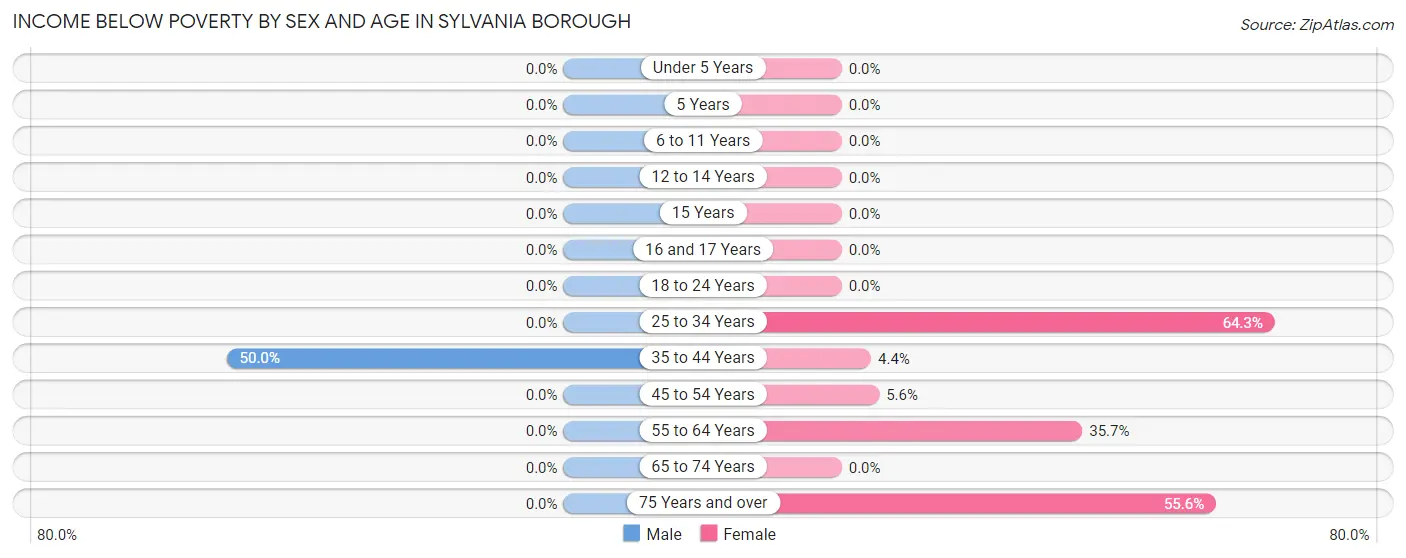
| Age Bracket | Male | Female |
| Under 5 Years | 0 (0.0%) | 0 (0.0%) |
| 5 Years | 0 (0.0%) | 0 (0.0%) |
| 6 to 11 Years | 0 (0.0%) | 0 (0.0%) |
| 12 to 14 Years | 0 (0.0%) | 0 (0.0%) |
| 15 Years | 0 (0.0%) | 0 (0.0%) |
| 16 and 17 Years | 0 (0.0%) | 0 (0.0%) |
| 18 to 24 Years | 0 (0.0%) | 0 (0.0%) |
| 25 to 34 Years | 0 (0.0%) | 18 (64.3%) |
| 35 to 44 Years | 7 (50.0%) | 1 (4.3%) |
| 45 to 54 Years | 0 (0.0%) | 1 (5.6%) |
| 55 to 64 Years | 0 (0.0%) | 5 (35.7%) |
| 65 to 74 Years | 0 (0.0%) | 0 (0.0%) |
| 75 Years and over | 0 (0.0%) | 5 (55.6%) |
| Total | 7 (6.7%) | 30 (21.3%) |
Income Above Poverty by Sex and Age in Sylvania borough
According to the poverty statistics in Sylvania borough, males aged under 5 years and females aged under 5 years are the age groups that are most secure financially, with 100.0% of males and 100.0% of females in these age groups living above the poverty line.
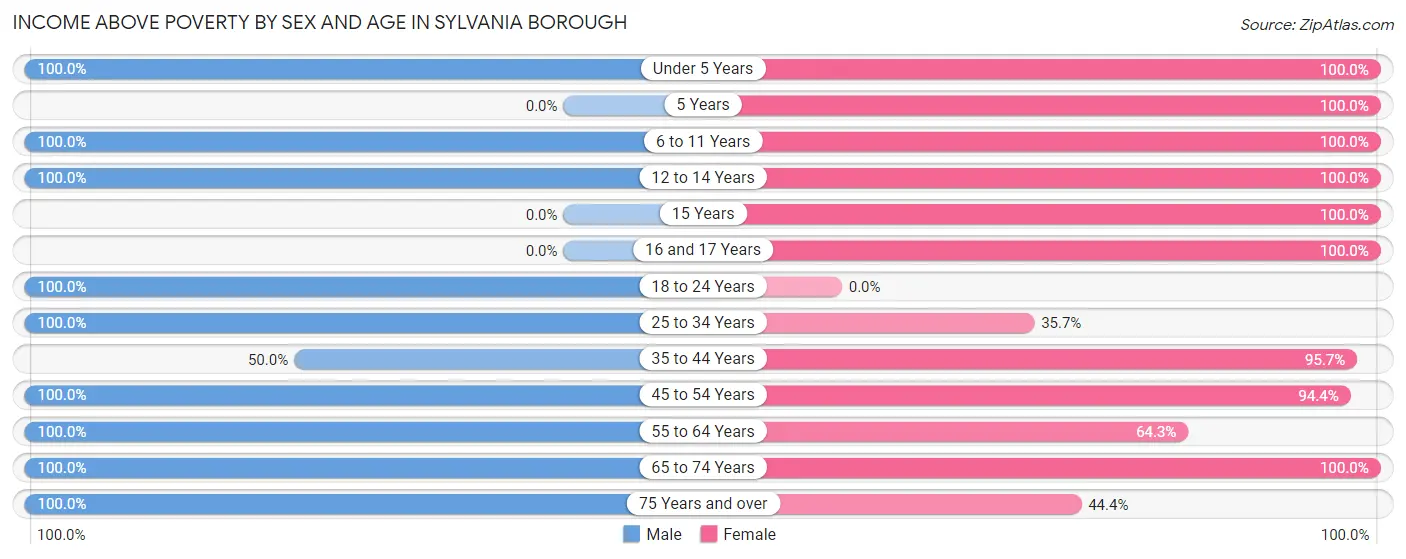
| Age Bracket | Male | Female |
| Under 5 Years | 20 (100.0%) | 7 (100.0%) |
| 5 Years | 0 (0.0%) | 1 (100.0%) |
| 6 to 11 Years | 11 (100.0%) | 17 (100.0%) |
| 12 to 14 Years | 5 (100.0%) | 6 (100.0%) |
| 15 Years | 0 (0.0%) | 4 (100.0%) |
| 16 and 17 Years | 0 (0.0%) | 5 (100.0%) |
| 18 to 24 Years | 1 (100.0%) | 0 (0.0%) |
| 25 to 34 Years | 14 (100.0%) | 10 (35.7%) |
| 35 to 44 Years | 7 (50.0%) | 22 (95.7%) |
| 45 to 54 Years | 10 (100.0%) | 17 (94.4%) |
| 55 to 64 Years | 6 (100.0%) | 9 (64.3%) |
| 65 to 74 Years | 18 (100.0%) | 9 (100.0%) |
| 75 Years and over | 6 (100.0%) | 4 (44.4%) |
| Total | 98 (93.3%) | 111 (78.7%) |
Income Below Poverty Among Married-Couple Families in Sylvania borough
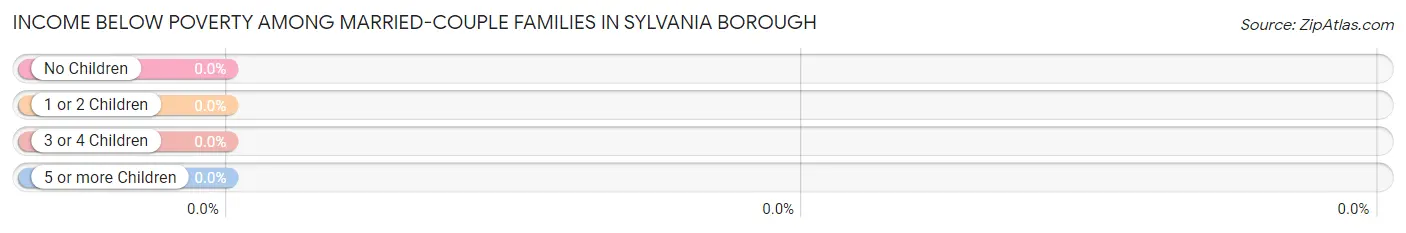
| Children | Above Poverty | Below Poverty |
| No Children | 21 (100.0%) | 0 (0.0%) |
| 1 or 2 Children | 20 (100.0%) | 0 (0.0%) |
| 3 or 4 Children | 2 (100.0%) | 0 (0.0%) |
| 5 or more Children | 0 (0.0%) | 0 (0.0%) |
| Total | 43 (100.0%) | 0 (0.0%) |
Income Below Poverty Among Single-Parent Households in Sylvania borough
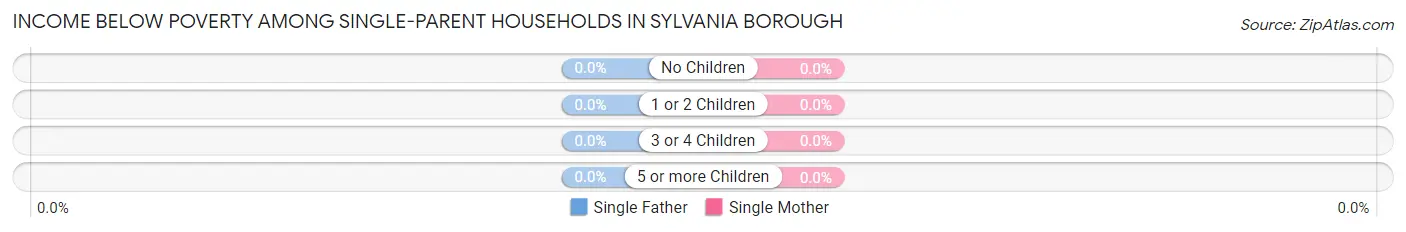
| Children | Single Father | Single Mother |
| No Children | 0 (0.0%) | 0 (0.0%) |
| 1 or 2 Children | 0 (0.0%) | 0 (0.0%) |
| 3 or 4 Children | 0 (0.0%) | 0 (0.0%) |
| 5 or more Children | 0 (0.0%) | 0 (0.0%) |
| Total | 0 (0.0%) | 0 (0.0%) |
Income Below Poverty Among Married-Couple vs Single-Parent Households in Sylvania borough
| Children | Married-Couple Families | Single-Parent Households |
| No Children | 0 (0.0%) | 0 (0.0%) |
| 1 or 2 Children | 0 (0.0%) | 0 (0.0%) |
| 3 or 4 Children | 0 (0.0%) | 0 (0.0%) |
| 5 or more Children | 0 (0.0%) | 0 (0.0%) |
| Total | 0 (0.0%) | 0 (0.0%) |
Race in Sylvania borough
The most populous races in Sylvania borough are White / Caucasian (246 | 100.0%), and Hispanic or Latino (13 | 5.3%).
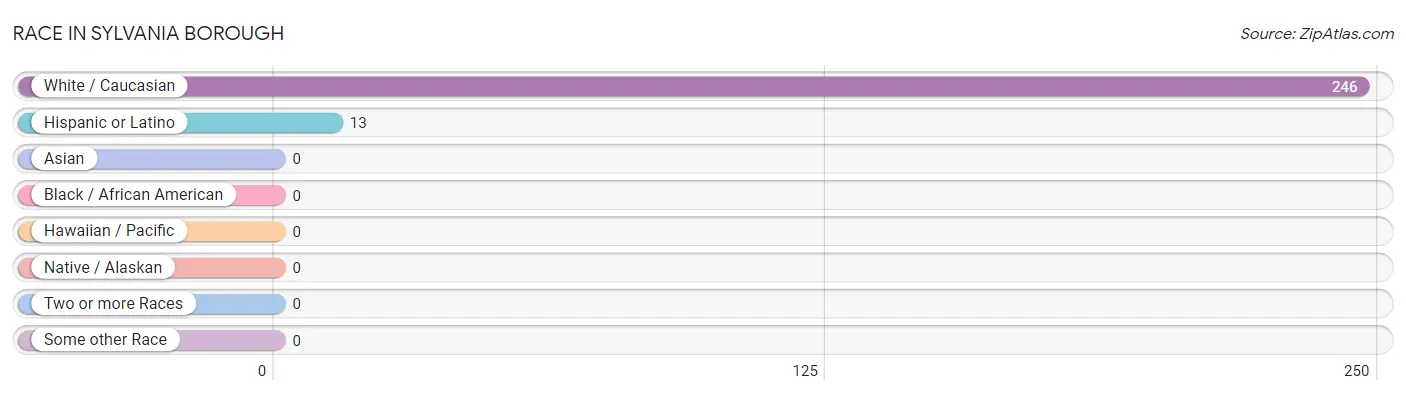
| Race | # Population | % Population |
| Asian | 0 | 0.0% |
| Black / African American | 0 | 0.0% |
| Hawaiian / Pacific | 0 | 0.0% |
| Hispanic or Latino | 13 | 5.3% |
| Native / Alaskan | 0 | 0.0% |
| White / Caucasian | 246 | 100.0% |
| Two or more Races | 0 | 0.0% |
| Some other Race | 0 | 0.0% |
| Total | 246 | 100.0% |
Ancestry in Sylvania borough
The most populous ancestries reported in Sylvania borough are English (42 | 17.1%), German (33 | 13.4%), Irish (19 | 7.7%), American (15 | 6.1%), and Italian (13 | 5.3%), together accounting for 49.6% of all Sylvania borough residents.
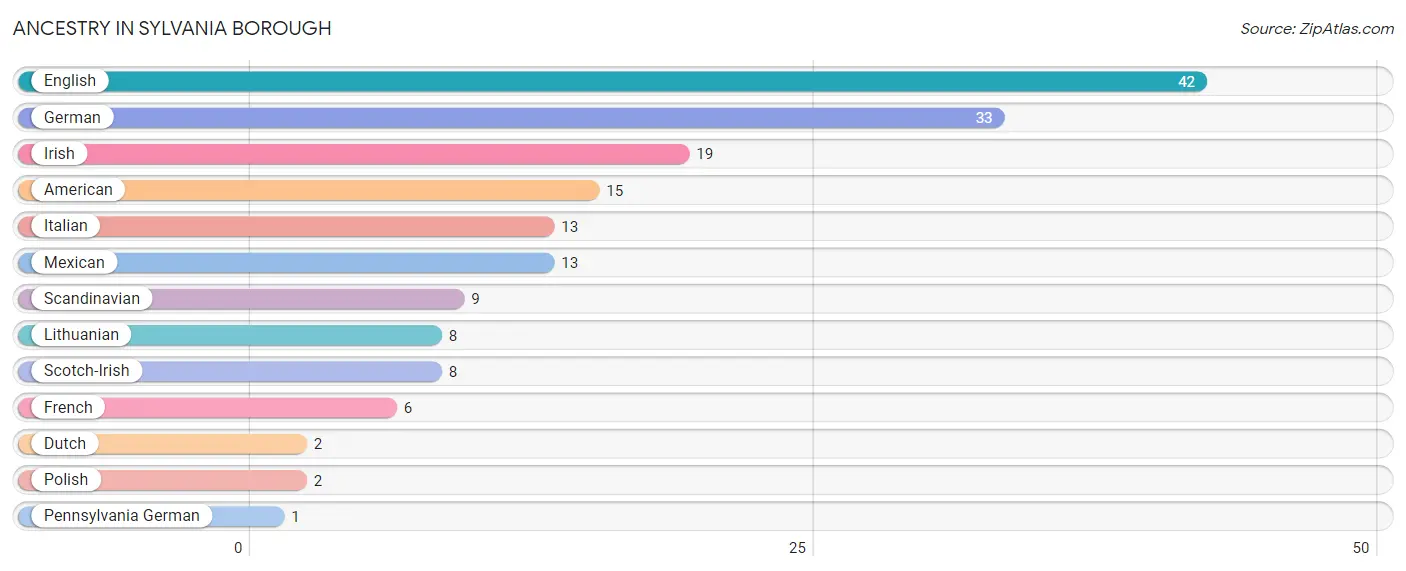
| Ancestry | # Population | % Population |
| American | 15 | 6.1% |
| Dutch | 2 | 0.8% |
| English | 42 | 17.1% |
| French | 6 | 2.4% |
| German | 33 | 13.4% |
| Irish | 19 | 7.7% |
| Italian | 13 | 5.3% |
| Lithuanian | 8 | 3.3% |
| Mexican | 13 | 5.3% |
| Pennsylvania German | 1 | 0.4% |
| Polish | 2 | 0.8% |
| Scandinavian | 9 | 3.7% |
| Scotch-Irish | 8 | 3.3% | View All 13 Rows |
Immigrants in Sylvania borough

| Immigration Origin | # Population | % Population | View All 0 Rows |
Sex and Age in Sylvania borough
Sex and Age in Sylvania borough
The most populous age groups in Sylvania borough are Under 5 Years (20 | 19.1%) for men and 25 to 29 Years (22 | 15.6%) for women.
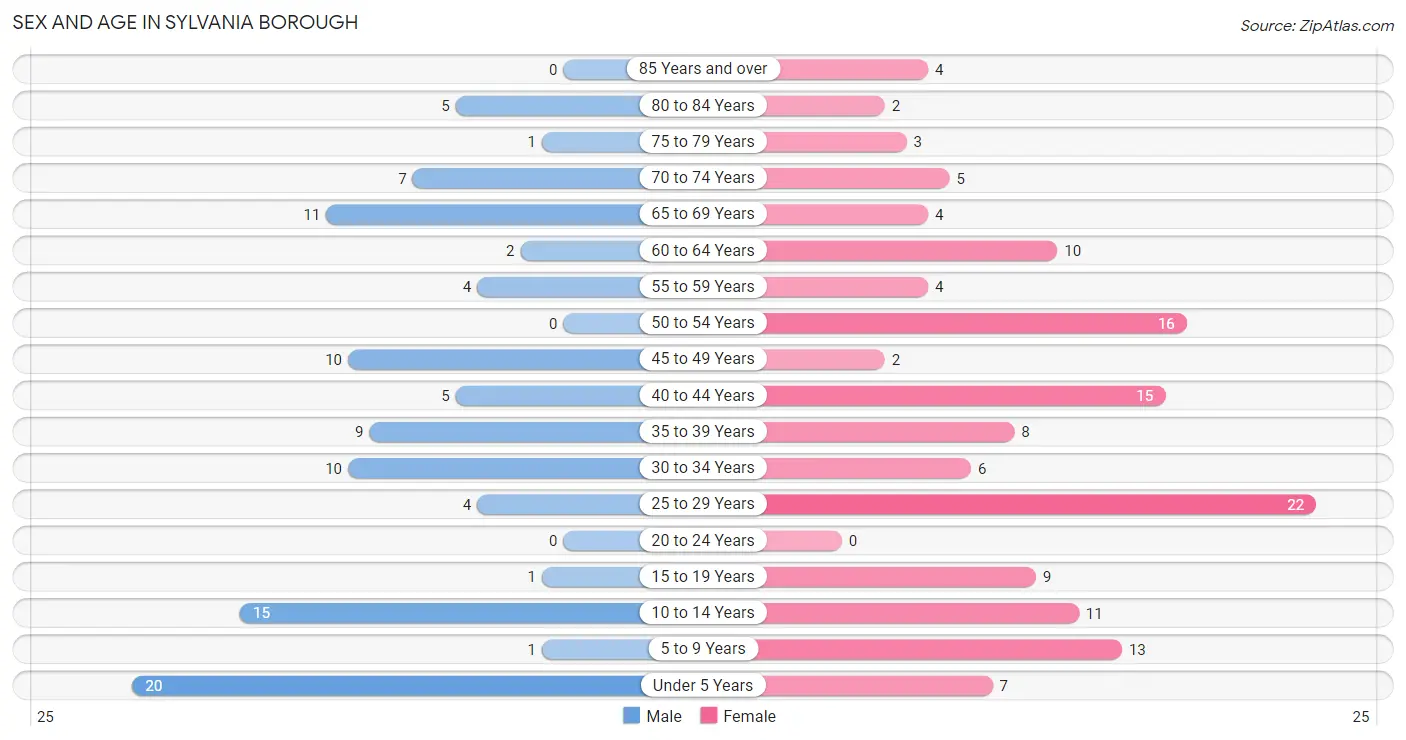
| Age Bracket | Male | Female |
| Under 5 Years | 20 (19.1%) | 7 (5.0%) |
| 5 to 9 Years | 1 (0.9%) | 13 (9.2%) |
| 10 to 14 Years | 15 (14.3%) | 11 (7.8%) |
| 15 to 19 Years | 1 (0.9%) | 9 (6.4%) |
| 20 to 24 Years | 0 (0.0%) | 0 (0.0%) |
| 25 to 29 Years | 4 (3.8%) | 22 (15.6%) |
| 30 to 34 Years | 10 (9.5%) | 6 (4.3%) |
| 35 to 39 Years | 9 (8.6%) | 8 (5.7%) |
| 40 to 44 Years | 5 (4.8%) | 15 (10.6%) |
| 45 to 49 Years | 10 (9.5%) | 2 (1.4%) |
| 50 to 54 Years | 0 (0.0%) | 16 (11.4%) |
| 55 to 59 Years | 4 (3.8%) | 4 (2.8%) |
| 60 to 64 Years | 2 (1.9%) | 10 (7.1%) |
| 65 to 69 Years | 11 (10.5%) | 4 (2.8%) |
| 70 to 74 Years | 7 (6.7%) | 5 (3.5%) |
| 75 to 79 Years | 1 (0.9%) | 3 (2.1%) |
| 80 to 84 Years | 5 (4.8%) | 2 (1.4%) |
| 85 Years and over | 0 (0.0%) | 4 (2.8%) |
| Total | 105 (100.0%) | 141 (100.0%) |
Families and Households in Sylvania borough
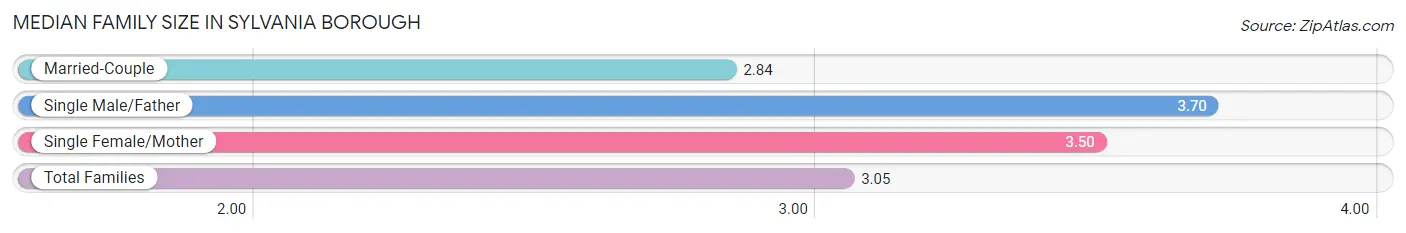
Median Family Size in Sylvania borough
The median family size in Sylvania borough is 3.05 persons per family, with single male/father families (10 | 17.0%) accounting for the largest median family size of 3.7 persons per family. On the other hand, married-couple families (43 | 72.9%) represent the smallest median family size with 2.84 persons per family.
| Family Type | # Families | Family Size |
| Married-Couple | 43 (72.9%) | 2.84 |
| Single Male/Father | 10 (17.0%) | 3.70 |
| Single Female/Mother | 6 (10.2%) | 3.50 |
| Total Families | 59 (100.0%) | 3.05 |
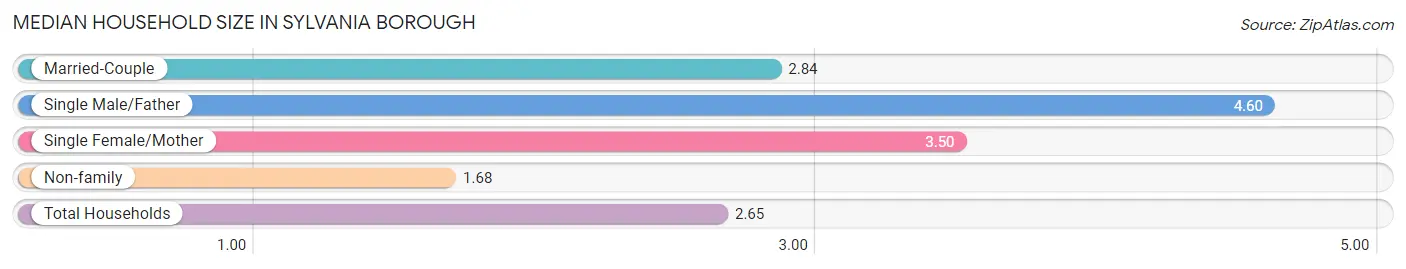
Median Household Size in Sylvania borough
The median household size in Sylvania borough is 2.65 persons per household, with single male/father households (10 | 10.7%) accounting for the largest median household size of 4.6 persons per household. non-family households (34 | 36.6%) represent the smallest median household size with 1.68 persons per household.
| Household Type | # Households | Household Size |
| Married-Couple | 43 (46.2%) | 2.84 |
| Single Male/Father | 10 (10.7%) | 4.60 |
| Single Female/Mother | 6 (6.5%) | 3.50 |
| Non-family | 34 (36.6%) | 1.68 |
| Total Households | 93 (100.0%) | 2.65 |
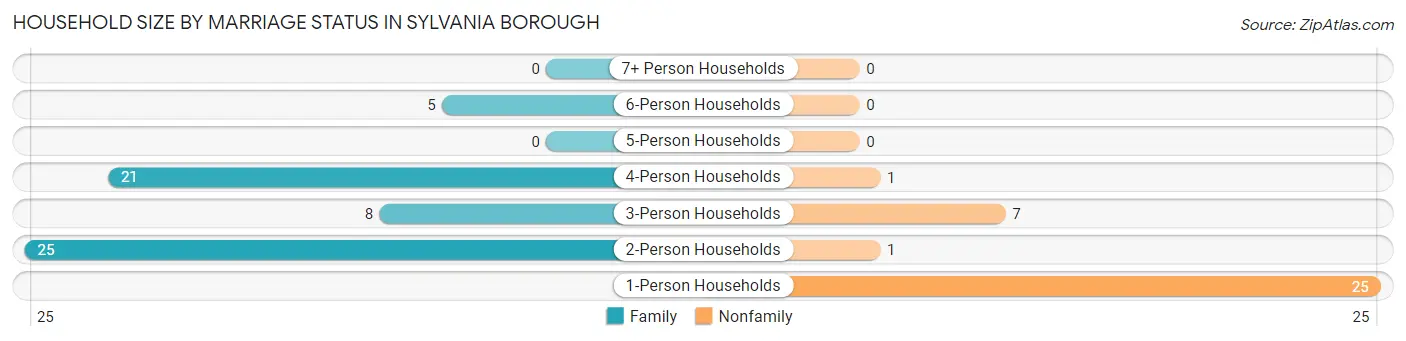
Household Size by Marriage Status in Sylvania borough
Out of a total of 93 households in Sylvania borough, 59 (63.4%) are family households, while 34 (36.6%) are nonfamily households. The most numerous type of family households are 2-person households, comprising 25, and the most common type of nonfamily households are 1-person households, comprising 25.
| Household Size | Family Households | Nonfamily Households |
| 1-Person Households | - | 25 (26.9%) |
| 2-Person Households | 25 (26.9%) | 1 (1.1%) |
| 3-Person Households | 8 (8.6%) | 7 (7.5%) |
| 4-Person Households | 21 (22.6%) | 1 (1.1%) |
| 5-Person Households | 0 (0.0%) | 0 (0.0%) |
| 6-Person Households | 5 (5.4%) | 0 (0.0%) |
| 7+ Person Households | 0 (0.0%) | 0 (0.0%) |
| Total | 59 (63.4%) | 34 (36.6%) |
Female Fertility in Sylvania borough
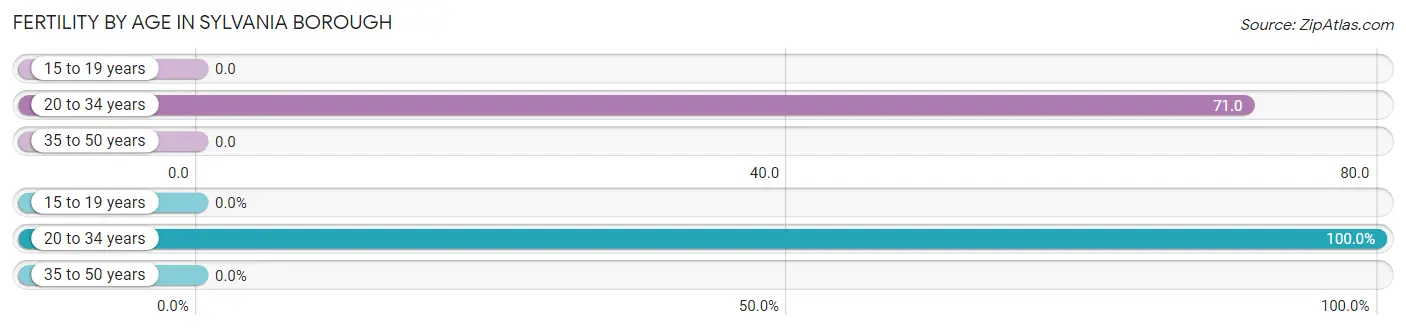
Fertility by Age in Sylvania borough
Average fertility rate in Sylvania borough is 31.0 births per 1,000 women. Women in the age bracket of 20 to 34 years have the highest fertility rate with 71.0 births per 1,000 women. Women in the age bracket of 20 to 34 years acount for 100.0% of all women with births.
| Age Bracket | Women with Births | Births / 1,000 Women |
| 15 to 19 years | 0 (0.0%) | 0.0 |
| 20 to 34 years | 2 (100.0%) | 71.0 |
| 35 to 50 years | 0 (0.0%) | 0.0 |
| Total | 2 (100.0%) | 31.0 |
Fertility by Age by Marriage Status in Sylvania borough
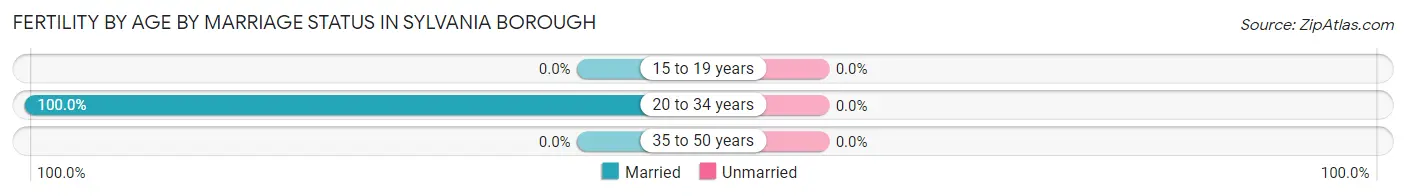
| Age Bracket | Married | Unmarried |
| 15 to 19 years | 0 (0.0%) | 0 (0.0%) |
| 20 to 34 years | 2 (100.0%) | 0 (0.0%) |
| 35 to 50 years | 0 (0.0%) | 0 (0.0%) |
| Total | 2 (100.0%) | 0 (0.0%) |
Fertility by Education in Sylvania borough
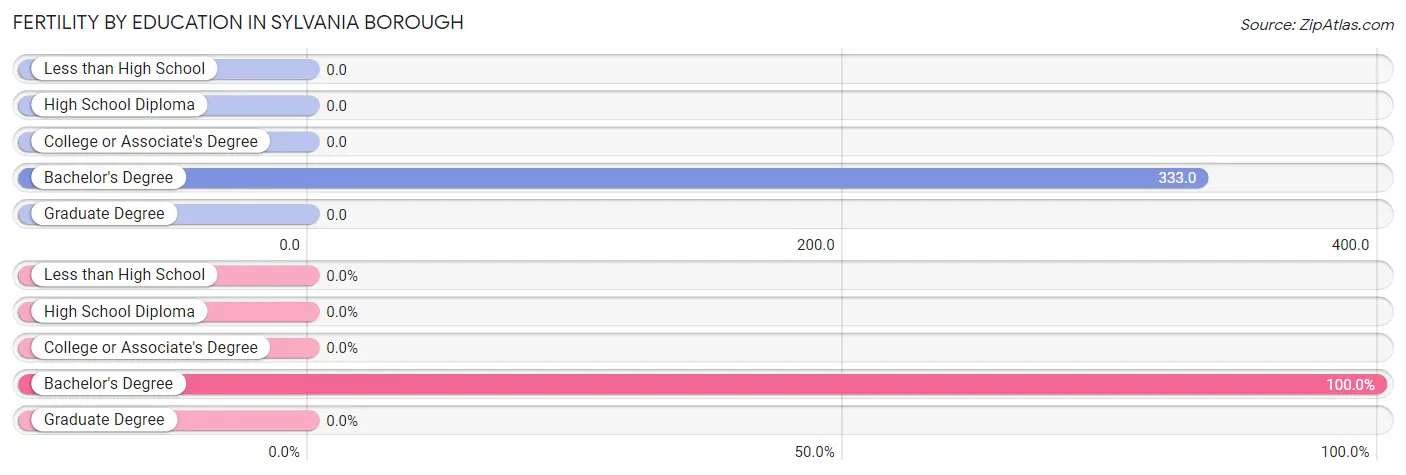
| Educational Attainment | Women with Births | Births / 1,000 Women |
| Less than High School | 0 (0.0%) | 0.0 |
| High School Diploma | 0 (0.0%) | 0.0 |
| College or Associate's Degree | 0 (0.0%) | 0.0 |
| Bachelor's Degree | 2 (100.0%) | 333.0 |
| Graduate Degree | 0 (0.0%) | 0.0 |
| Total | 2 (100.0%) | 31.0 |
Fertility by Education by Marriage Status in Sylvania borough
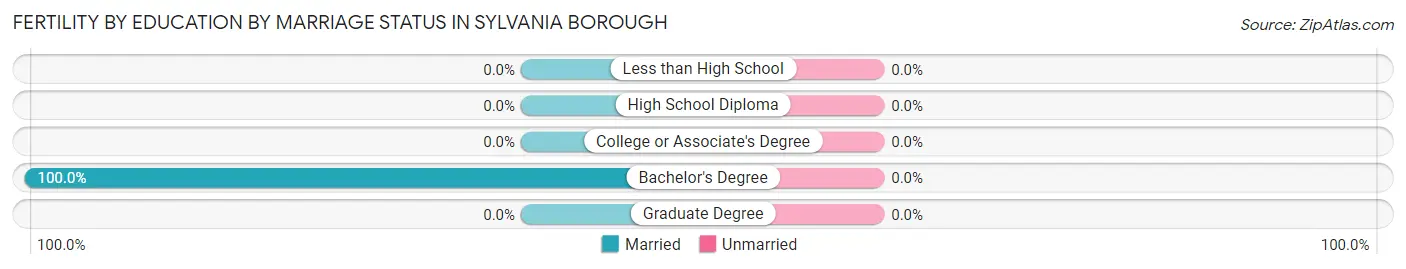
| Educational Attainment | Married | Unmarried |
| Less than High School | 0 (0.0%) | 0 (0.0%) |
| High School Diploma | 0 (0.0%) | 0 (0.0%) |
| College or Associate's Degree | 0 (0.0%) | 0 (0.0%) |
| Bachelor's Degree | 2 (100.0%) | 0 (0.0%) |
| Graduate Degree | 0 (0.0%) | 0 (0.0%) |
| Total | 2 (100.0%) | 0 (0.0%) |
Employment Characteristics in Sylvania borough
Employment by Class of Employer in Sylvania borough
Among the 87 employed individuals in Sylvania borough, private company employees (56 | 64.4%), self-employed (not incorporated) (11 | 12.6%), and not-for-profit organizations (11 | 12.6%) make up the most common classes of employment.
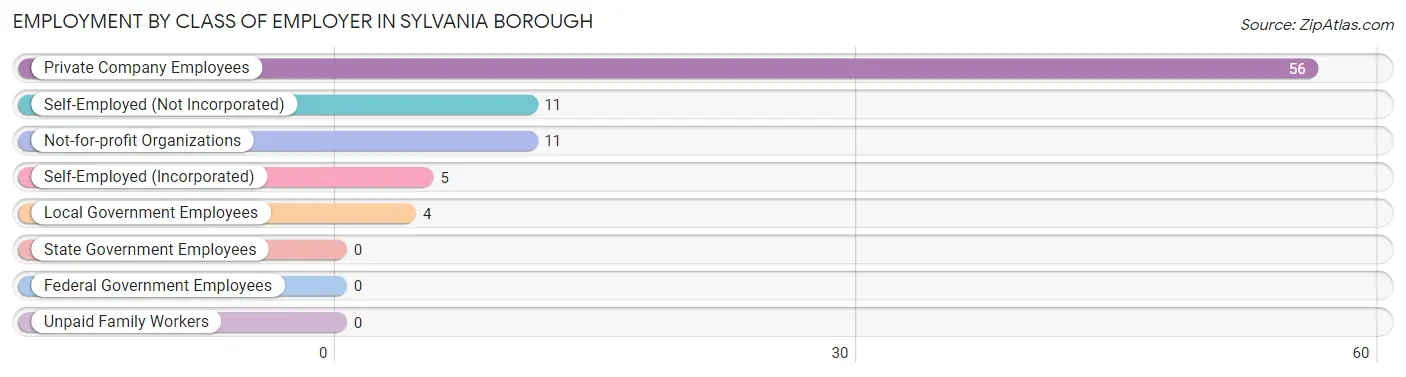
| Employer Class | # Employees | % Employees |
| Private Company Employees | 56 | 64.4% |
| Self-Employed (Incorporated) | 5 | 5.8% |
| Self-Employed (Not Incorporated) | 11 | 12.6% |
| Not-for-profit Organizations | 11 | 12.6% |
| Local Government Employees | 4 | 4.6% |
| State Government Employees | 0 | 0.0% |
| Federal Government Employees | 0 | 0.0% |
| Unpaid Family Workers | 0 | 0.0% |
| Total | 87 | 100.0% |
Employment Status by Age in Sylvania borough
According to the labor force statistics for Sylvania borough, out of the total population over 16 years of age (175), 50.9% or 89 individuals are in the labor force, with 2.2% or 2 of them unemployed. The age group with the highest labor force participation rate is 16 to 19 years, with 100.0% or 6 individuals in the labor force. Within the labor force, the 55 to 59 years age range has the highest percentage of unemployed individuals, with 25.0% or 1 of them being unemployed.
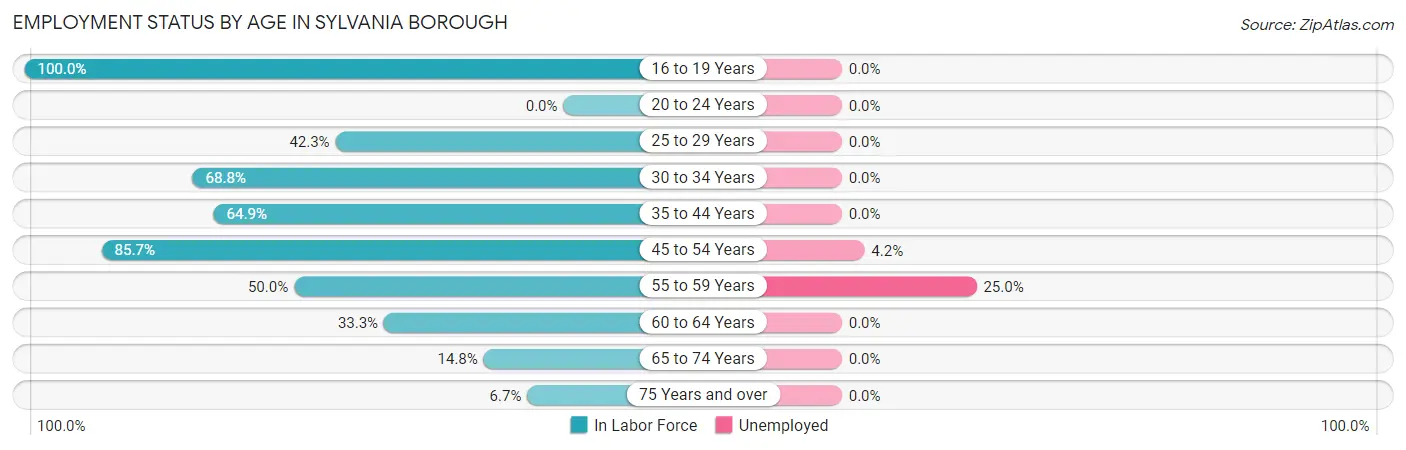
| Age Bracket | In Labor Force | Unemployed |
| 16 to 19 Years | 6 (100.0%) | 0 (0.0%) |
| 20 to 24 Years | 0 (0.0%) | 0 (0.0%) |
| 25 to 29 Years | 11 (42.3%) | 0 (0.0%) |
| 30 to 34 Years | 11 (68.8%) | 0 (0.0%) |
| 35 to 44 Years | 24 (64.9%) | 0 (0.0%) |
| 45 to 54 Years | 24 (85.7%) | 1 (4.2%) |
| 55 to 59 Years | 4 (50.0%) | 1 (25.0%) |
| 60 to 64 Years | 4 (33.3%) | 0 (0.0%) |
| 65 to 74 Years | 4 (14.8%) | 0 (0.0%) |
| 75 Years and over | 1 (6.7%) | 0 (0.0%) |
| Total | 89 (50.9%) | 2 (2.2%) |
Employment Status by Educational Attainment in Sylvania borough
According to labor force statistics for Sylvania borough, 61.4% of individuals (78) out of the total population between 25 and 64 years of age (127) are in the labor force, with 2.6% or 2 of them being unemployed. The group with the highest labor force participation rate are those with the educational attainment of bachelor's degree or higher, with 91.7% or 22 individuals in the labor force. Within the labor force, individuals with college / associate degree education have the highest percentage of unemployment, with 7.1% or 1 of them being unemployed.
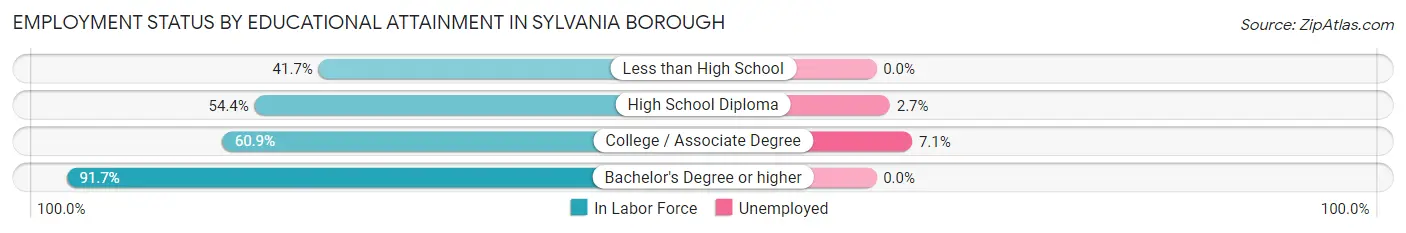
| Educational Attainment | In Labor Force | Unemployed |
| Less than High School | 5 (41.7%) | 0 (0.0%) |
| High School Diploma | 37 (54.4%) | 2 (2.7%) |
| College / Associate Degree | 14 (60.9%) | 2 (7.1%) |
| Bachelor's Degree or higher | 22 (91.7%) | 0 (0.0%) |
| Total | 78 (61.4%) | 3 (2.6%) |
Employment Occupations by Sex in Sylvania borough
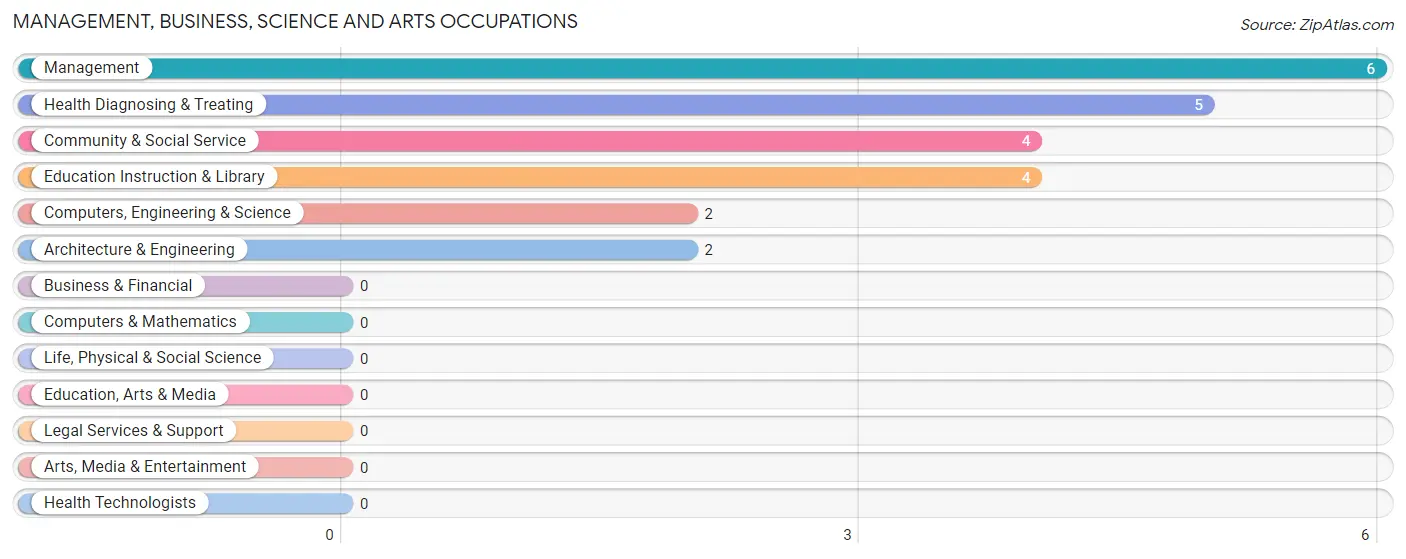
Management, Business, Science and Arts Occupations
The most common Management, Business, Science and Arts occupations in Sylvania borough are Management (6 | 6.9%), Health Diagnosing & Treating (5 | 5.8%), Community & Social Service (4 | 4.6%), Education Instruction & Library (4 | 4.6%), and Computers, Engineering & Science (2 | 2.3%).
Management, Business, Science and Arts Occupations by Sex
Within the Management, Business, Science and Arts occupations in Sylvania borough, the most male-oriented occupations are Computers, Engineering & Science (100.0%), Architecture & Engineering (100.0%), and Management (16.7%), while the most female-oriented occupations are Community & Social Service (100.0%), Education Instruction & Library (100.0%), and Health Diagnosing & Treating (100.0%).
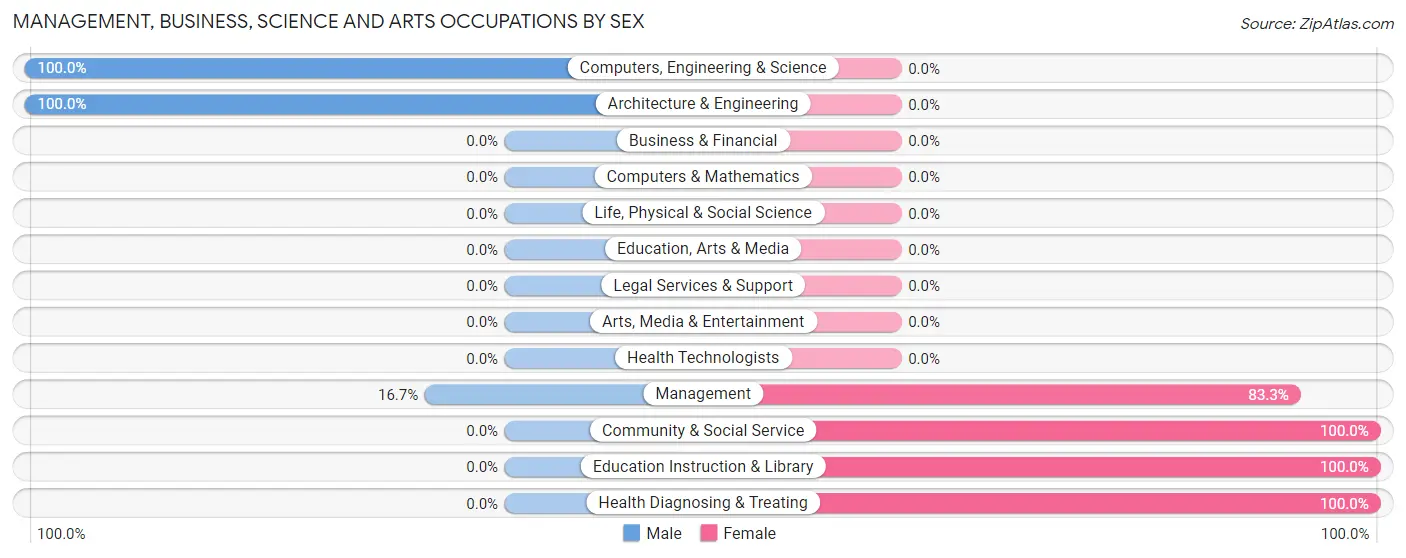
| Occupation | Male | Female |
| Management | 1 (16.7%) | 5 (83.3%) |
| Business & Financial | 0 (0.0%) | 0 (0.0%) |
| Computers, Engineering & Science | 2 (100.0%) | 0 (0.0%) |
| Computers & Mathematics | 0 (0.0%) | 0 (0.0%) |
| Architecture & Engineering | 2 (100.0%) | 0 (0.0%) |
| Life, Physical & Social Science | 0 (0.0%) | 0 (0.0%) |
| Community & Social Service | 0 (0.0%) | 4 (100.0%) |
| Education, Arts & Media | 0 (0.0%) | 0 (0.0%) |
| Legal Services & Support | 0 (0.0%) | 0 (0.0%) |
| Education Instruction & Library | 0 (0.0%) | 4 (100.0%) |
| Arts, Media & Entertainment | 0 (0.0%) | 0 (0.0%) |
| Health Diagnosing & Treating | 0 (0.0%) | 5 (100.0%) |
| Health Technologists | 0 (0.0%) | 0 (0.0%) |
| Total (Category) | 3 (17.6%) | 14 (82.4%) |
| Total (Overall) | 35 (40.2%) | 52 (59.8%) |
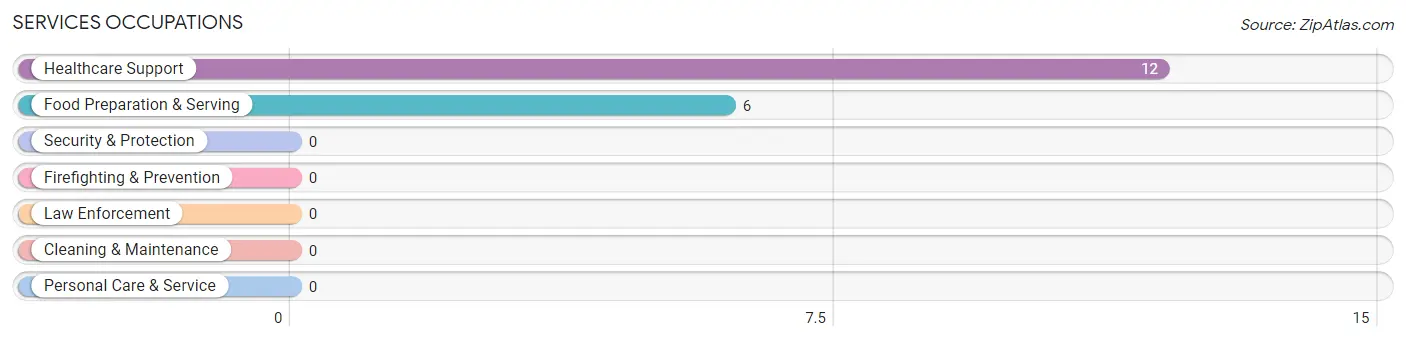
Services Occupations
The most common Services occupations in Sylvania borough are Healthcare Support (12 | 13.8%), and Food Preparation & Serving (6 | 6.9%).
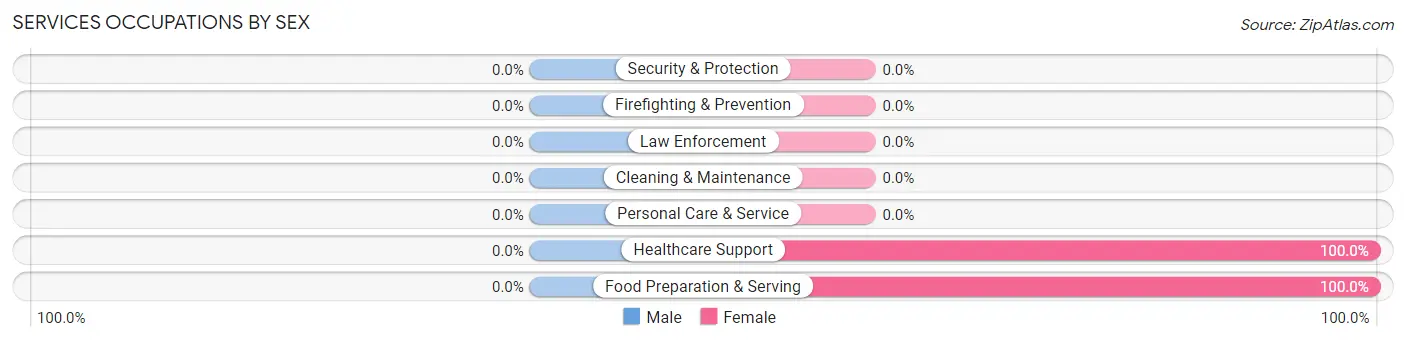
Services Occupations by Sex
| Occupation | Male | Female |
| Healthcare Support | 0 (0.0%) | 12 (100.0%) |
| Security & Protection | 0 (0.0%) | 0 (0.0%) |
| Firefighting & Prevention | 0 (0.0%) | 0 (0.0%) |
| Law Enforcement | 0 (0.0%) | 0 (0.0%) |
| Food Preparation & Serving | 0 (0.0%) | 6 (100.0%) |
| Cleaning & Maintenance | 0 (0.0%) | 0 (0.0%) |
| Personal Care & Service | 0 (0.0%) | 0 (0.0%) |
| Total (Category) | 0 (0.0%) | 18 (100.0%) |
| Total (Overall) | 35 (40.2%) | 52 (59.8%) |
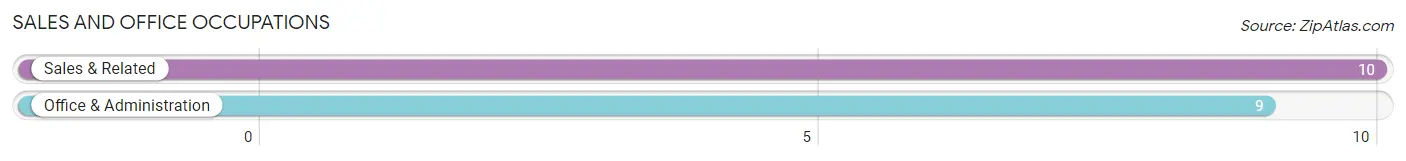
Sales and Office Occupations
The most common Sales and Office occupations in Sylvania borough are Sales & Related (10 | 11.5%), and Office & Administration (9 | 10.3%).
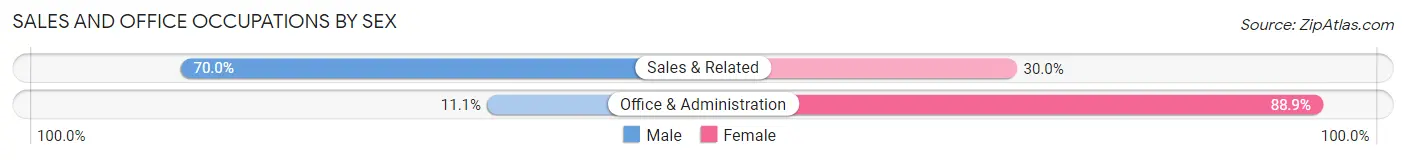
Sales and Office Occupations by Sex
| Occupation | Male | Female |
| Sales & Related | 7 (70.0%) | 3 (30.0%) |
| Office & Administration | 1 (11.1%) | 8 (88.9%) |
| Total (Category) | 8 (42.1%) | 11 (57.9%) |
| Total (Overall) | 35 (40.2%) | 52 (59.8%) |
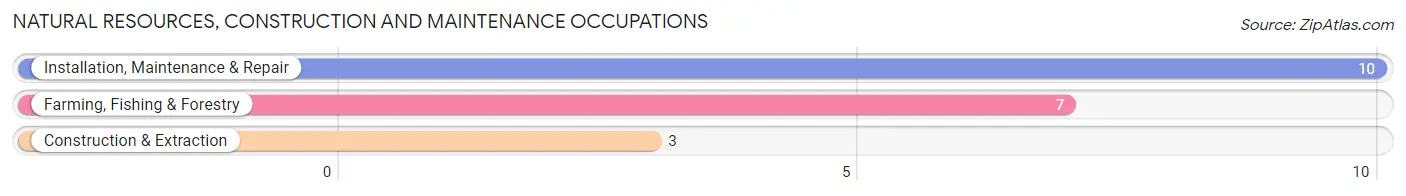
Natural Resources, Construction and Maintenance Occupations
The most common Natural Resources, Construction and Maintenance occupations in Sylvania borough are Installation, Maintenance & Repair (10 | 11.5%), Farming, Fishing & Forestry (7 | 8.1%), and Construction & Extraction (3 | 3.5%).
Natural Resources, Construction and Maintenance Occupations by Sex
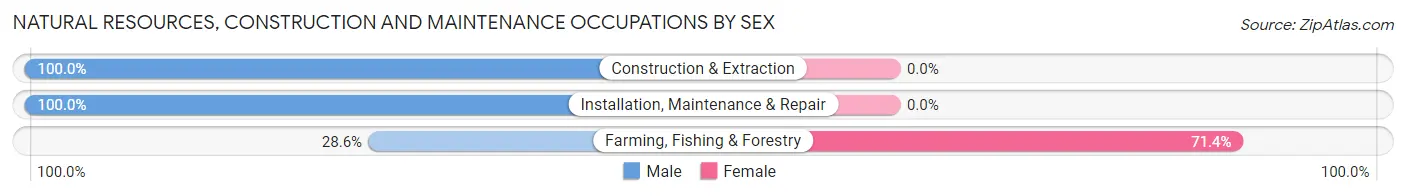
| Occupation | Male | Female |
| Farming, Fishing & Forestry | 2 (28.6%) | 5 (71.4%) |
| Construction & Extraction | 3 (100.0%) | 0 (0.0%) |
| Installation, Maintenance & Repair | 10 (100.0%) | 0 (0.0%) |
| Total (Category) | 15 (75.0%) | 5 (25.0%) |
| Total (Overall) | 35 (40.2%) | 52 (59.8%) |
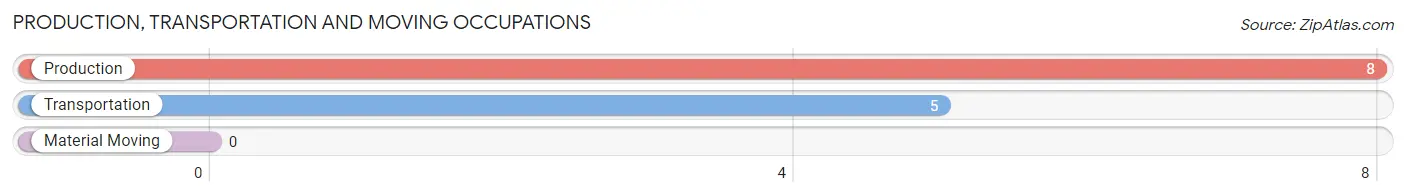
Production, Transportation and Moving Occupations
The most common Production, Transportation and Moving occupations in Sylvania borough are Production (8 | 9.2%), and Transportation (5 | 5.8%).
Production, Transportation and Moving Occupations by Sex
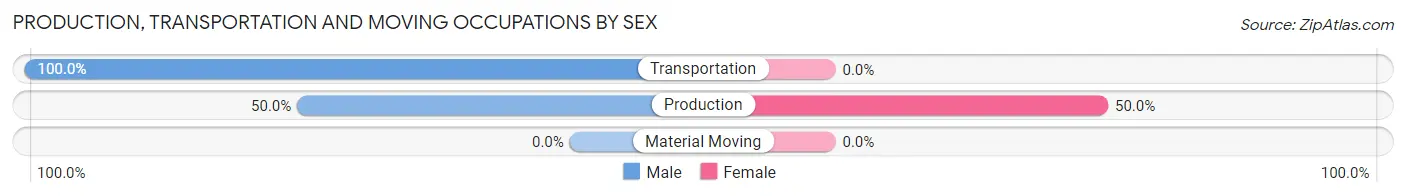
| Occupation | Male | Female |
| Production | 4 (50.0%) | 4 (50.0%) |
| Transportation | 5 (100.0%) | 0 (0.0%) |
| Material Moving | 0 (0.0%) | 0 (0.0%) |
| Total (Category) | 9 (69.2%) | 4 (30.8%) |
| Total (Overall) | 35 (40.2%) | 52 (59.8%) |
Employment Industries by Sex in Sylvania borough
Employment Industries in Sylvania borough
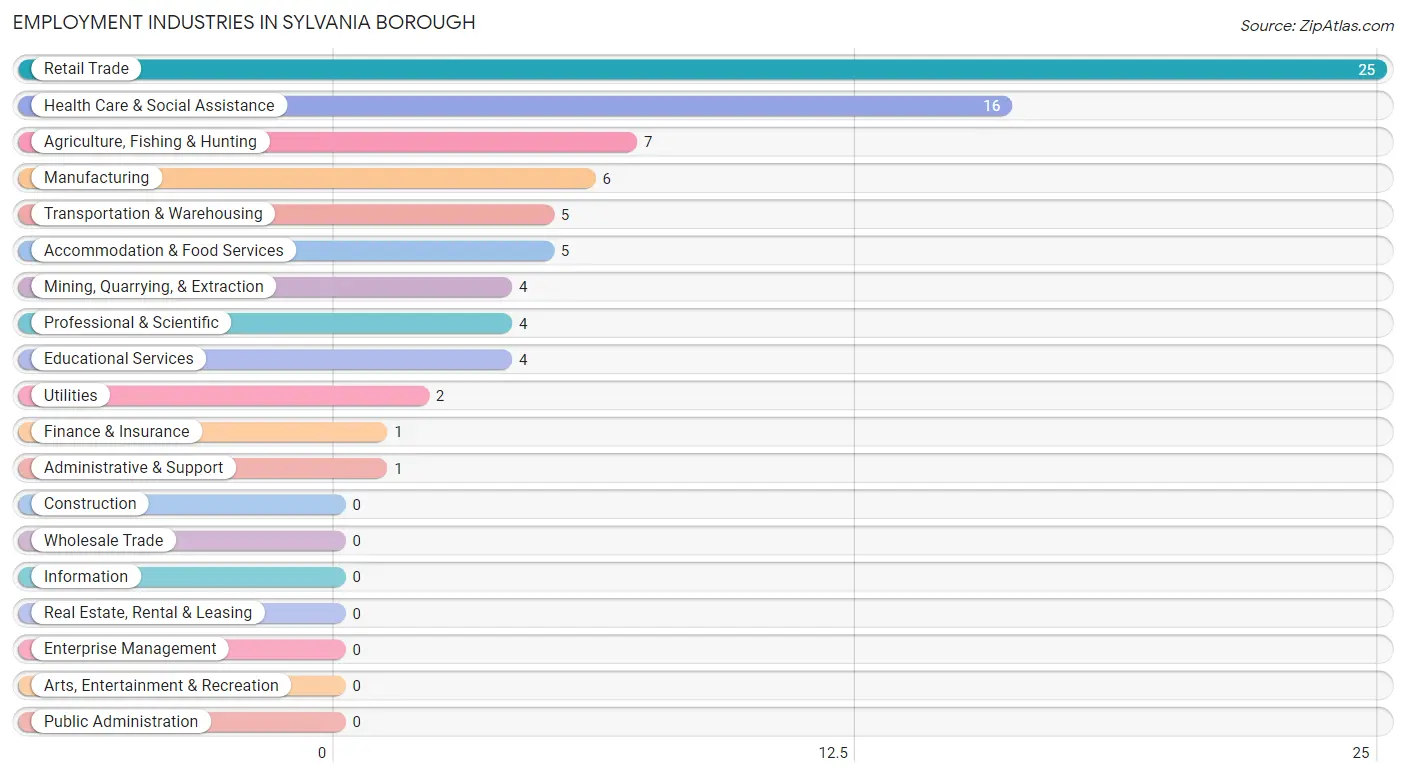
The major employment industries in Sylvania borough include Retail Trade (25 | 28.7%), Health Care & Social Assistance (16 | 18.4%), Agriculture, Fishing & Hunting (7 | 8.1%), Manufacturing (6 | 6.9%), and Transportation & Warehousing (5 | 5.8%).
Employment Industries by Sex in Sylvania borough
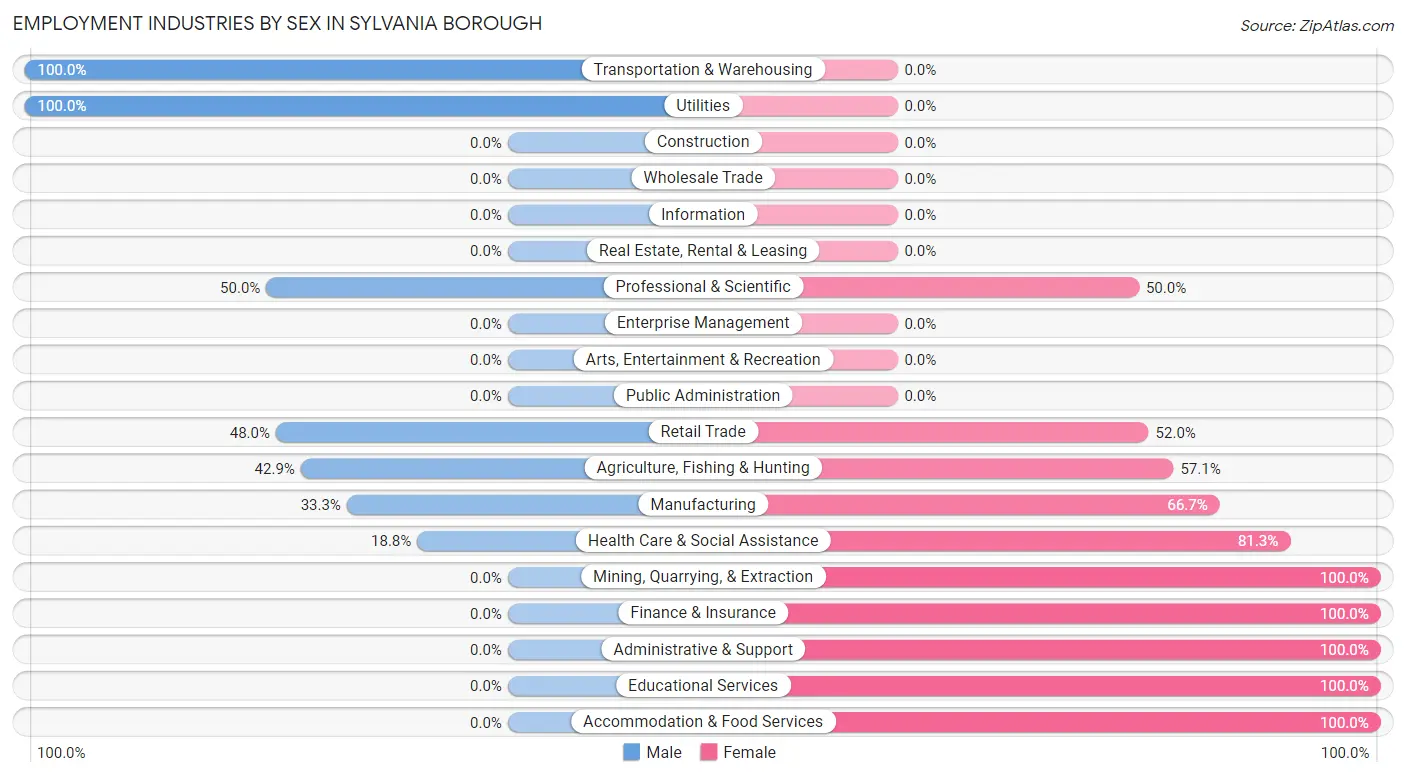
The Sylvania borough industries that see more men than women are Transportation & Warehousing (100.0%), Utilities (100.0%), and Professional & Scientific (50.0%), whereas the industries that tend to have a higher number of women are Mining, Quarrying, & Extraction (100.0%), Finance & Insurance (100.0%), and Administrative & Support (100.0%).
| Industry | Male | Female |
| Agriculture, Fishing & Hunting | 3 (42.9%) | 4 (57.1%) |
| Mining, Quarrying, & Extraction | 0 (0.0%) | 4 (100.0%) |
| Construction | 0 (0.0%) | 0 (0.0%) |
| Manufacturing | 2 (33.3%) | 4 (66.7%) |
| Wholesale Trade | 0 (0.0%) | 0 (0.0%) |
| Retail Trade | 12 (48.0%) | 13 (52.0%) |
| Transportation & Warehousing | 5 (100.0%) | 0 (0.0%) |
| Utilities | 2 (100.0%) | 0 (0.0%) |
| Information | 0 (0.0%) | 0 (0.0%) |
| Finance & Insurance | 0 (0.0%) | 1 (100.0%) |
| Real Estate, Rental & Leasing | 0 (0.0%) | 0 (0.0%) |
| Professional & Scientific | 2 (50.0%) | 2 (50.0%) |
| Enterprise Management | 0 (0.0%) | 0 (0.0%) |
| Administrative & Support | 0 (0.0%) | 1 (100.0%) |
| Educational Services | 0 (0.0%) | 4 (100.0%) |
| Health Care & Social Assistance | 3 (18.8%) | 13 (81.2%) |
| Arts, Entertainment & Recreation | 0 (0.0%) | 0 (0.0%) |
| Accommodation & Food Services | 0 (0.0%) | 5 (100.0%) |
| Public Administration | 0 (0.0%) | 0 (0.0%) |
| Total | 35 (40.2%) | 52 (59.8%) |
Education in Sylvania borough
School Enrollment in Sylvania borough
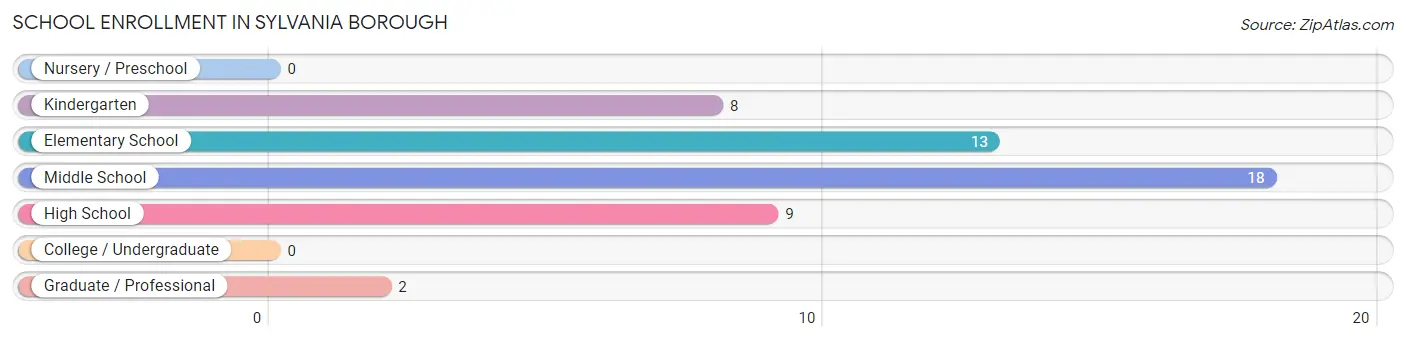
The most common levels of schooling among the 50 students in Sylvania borough are middle school (18 | 36.0%), elementary school (13 | 26.0%), and high school (9 | 18.0%).
| School Level | # Students | % Students |
| Nursery / Preschool | 0 | 0.0% |
| Kindergarten | 8 | 16.0% |
| Elementary School | 13 | 26.0% |
| Middle School | 18 | 36.0% |
| High School | 9 | 18.0% |
| College / Undergraduate | 0 | 0.0% |
| Graduate / Professional | 2 | 4.0% |
| Total | 50 | 100.0% |
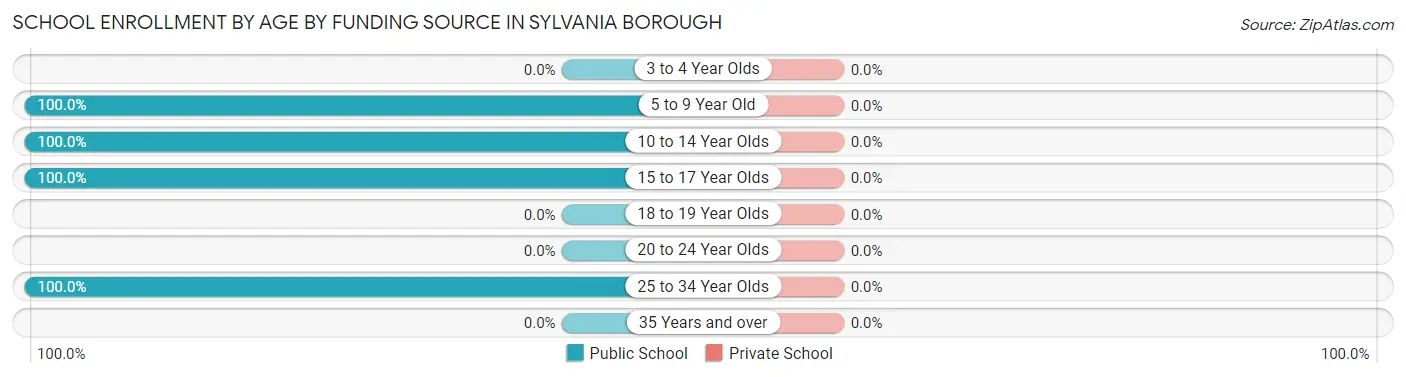
School Enrollment by Age by Funding Source in Sylvania borough
| Age Bracket | Public School | Private School |
| 3 to 4 Year Olds | 0 (0.0%) | 0 (0.0%) |
| 5 to 9 Year Old | 13 (100.0%) | 0 (0.0%) |
| 10 to 14 Year Olds | 26 (100.0%) | 0 (0.0%) |
| 15 to 17 Year Olds | 9 (100.0%) | 0 (0.0%) |
| 18 to 19 Year Olds | 0 (0.0%) | 0 (0.0%) |
| 20 to 24 Year Olds | 0 (0.0%) | 0 (0.0%) |
| 25 to 34 Year Olds | 2 (100.0%) | 0 (0.0%) |
| 35 Years and over | 0 (0.0%) | 0 (0.0%) |
| Total | 50 (100.0%) | 0 (0.0%) |
Educational Attainment by Field of Study in Sylvania borough
Education (10 | 34.5%), science & technology (6 | 20.7%), business (6 | 20.7%), liberal arts & history (3 | 10.3%), and bio, nature & agricultural (2 | 6.9%) are the most common fields of study among 29 individuals in Sylvania borough who have obtained a bachelor's degree or higher.
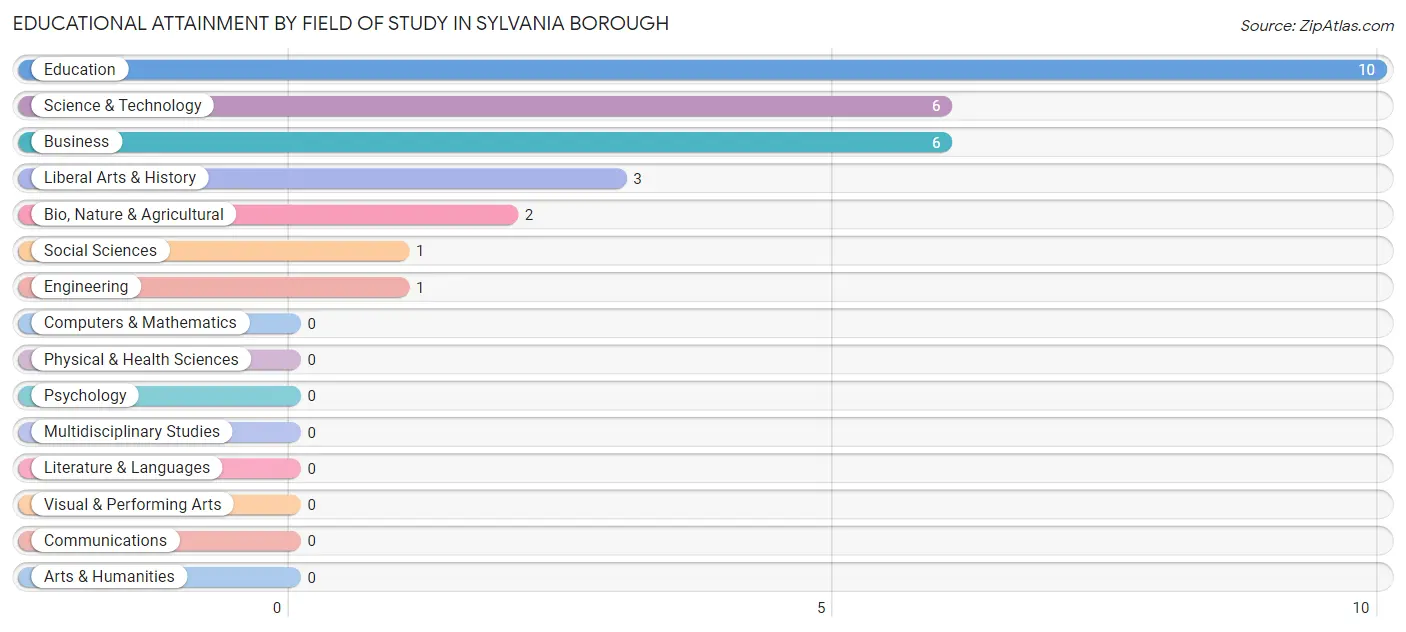
| Field of Study | # Graduates | % Graduates |
| Computers & Mathematics | 0 | 0.0% |
| Bio, Nature & Agricultural | 2 | 6.9% |
| Physical & Health Sciences | 0 | 0.0% |
| Psychology | 0 | 0.0% |
| Social Sciences | 1 | 3.5% |
| Engineering | 1 | 3.5% |
| Multidisciplinary Studies | 0 | 0.0% |
| Science & Technology | 6 | 20.7% |
| Business | 6 | 20.7% |
| Education | 10 | 34.5% |
| Literature & Languages | 0 | 0.0% |
| Liberal Arts & History | 3 | 10.3% |
| Visual & Performing Arts | 0 | 0.0% |
| Communications | 0 | 0.0% |
| Arts & Humanities | 0 | 0.0% |
| Total | 29 | 100.0% |
Transportation & Commute in Sylvania borough
Vehicle Availability by Sex in Sylvania borough
The most prevalent vehicle ownership categories in Sylvania borough are males with 2 vehicles (24, accounting for 68.6%) and females with 2 vehicles (26, making up 46.2%).
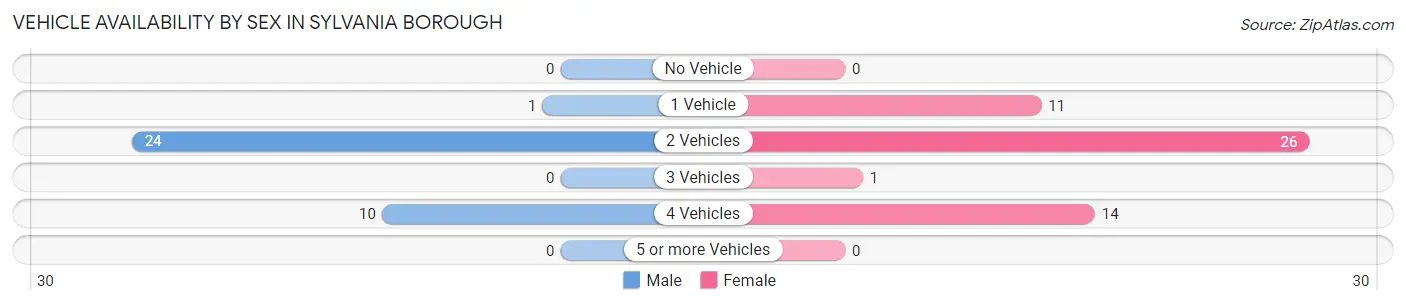
| Vehicles Available | Male | Female |
| No Vehicle | 0 (0.0%) | 0 (0.0%) |
| 1 Vehicle | 1 (2.9%) | 11 (21.1%) |
| 2 Vehicles | 24 (68.6%) | 26 (50.0%) |
| 3 Vehicles | 0 (0.0%) | 1 (1.9%) |
| 4 Vehicles | 10 (28.6%) | 14 (26.9%) |
| 5 or more Vehicles | 0 (0.0%) | 0 (0.0%) |
| Total | 35 (100.0%) | 52 (100.0%) |
Commute Time in Sylvania borough
The most frequently occuring commute durations in Sylvania borough are 5 to 9 minutes (30 commuters, 34.5%), 10 to 14 minutes (11 commuters, 12.6%), and 45 to 59 minutes (11 commuters, 12.6%).
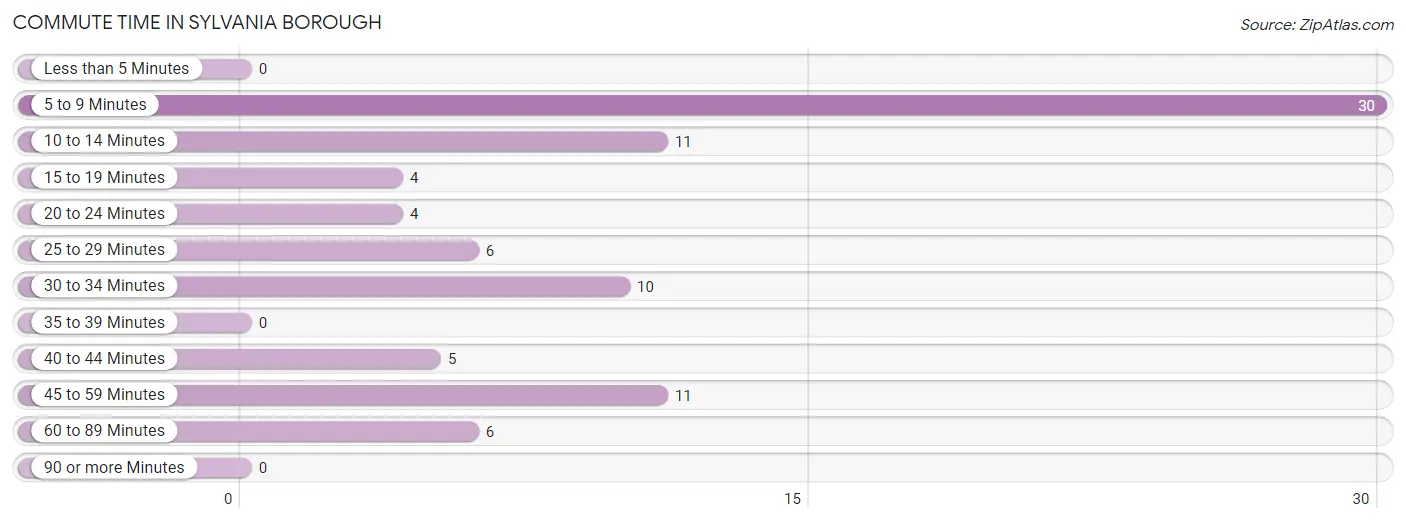
| Commute Time | # Commuters | % Commuters |
| Less than 5 Minutes | 0 | 0.0% |
| 5 to 9 Minutes | 30 | 34.5% |
| 10 to 14 Minutes | 11 | 12.6% |
| 15 to 19 Minutes | 4 | 4.6% |
| 20 to 24 Minutes | 4 | 4.6% |
| 25 to 29 Minutes | 6 | 6.9% |
| 30 to 34 Minutes | 10 | 11.5% |
| 35 to 39 Minutes | 0 | 0.0% |
| 40 to 44 Minutes | 5 | 5.8% |
| 45 to 59 Minutes | 11 | 12.6% |
| 60 to 89 Minutes | 6 | 6.9% |
| 90 or more Minutes | 0 | 0.0% |
Commute Time by Sex in Sylvania borough
The most common commute times in Sylvania borough are 5 to 9 minutes (14 commuters, 40.0%) for males and 5 to 9 minutes (16 commuters, 30.8%) for females.
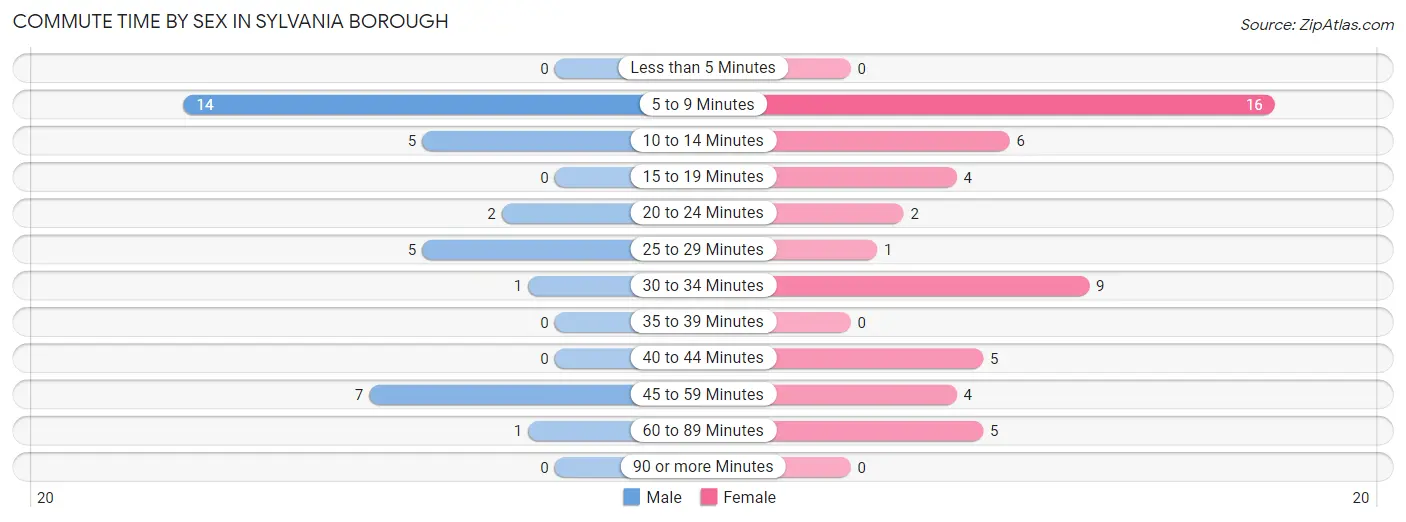
| Commute Time | Male | Female |
| Less than 5 Minutes | 0 (0.0%) | 0 (0.0%) |
| 5 to 9 Minutes | 14 (40.0%) | 16 (30.8%) |
| 10 to 14 Minutes | 5 (14.3%) | 6 (11.5%) |
| 15 to 19 Minutes | 0 (0.0%) | 4 (7.7%) |
| 20 to 24 Minutes | 2 (5.7%) | 2 (3.8%) |
| 25 to 29 Minutes | 5 (14.3%) | 1 (1.9%) |
| 30 to 34 Minutes | 1 (2.9%) | 9 (17.3%) |
| 35 to 39 Minutes | 0 (0.0%) | 0 (0.0%) |
| 40 to 44 Minutes | 0 (0.0%) | 5 (9.6%) |
| 45 to 59 Minutes | 7 (20.0%) | 4 (7.7%) |
| 60 to 89 Minutes | 1 (2.9%) | 5 (9.6%) |
| 90 or more Minutes | 0 (0.0%) | 0 (0.0%) |
Time of Departure to Work by Sex in Sylvania borough
The most frequent times of departure to work in Sylvania borough are 7:30 AM to 7:59 AM (9, 25.7%) for males and 8:00 AM to 8:29 AM (24, 46.2%) for females.
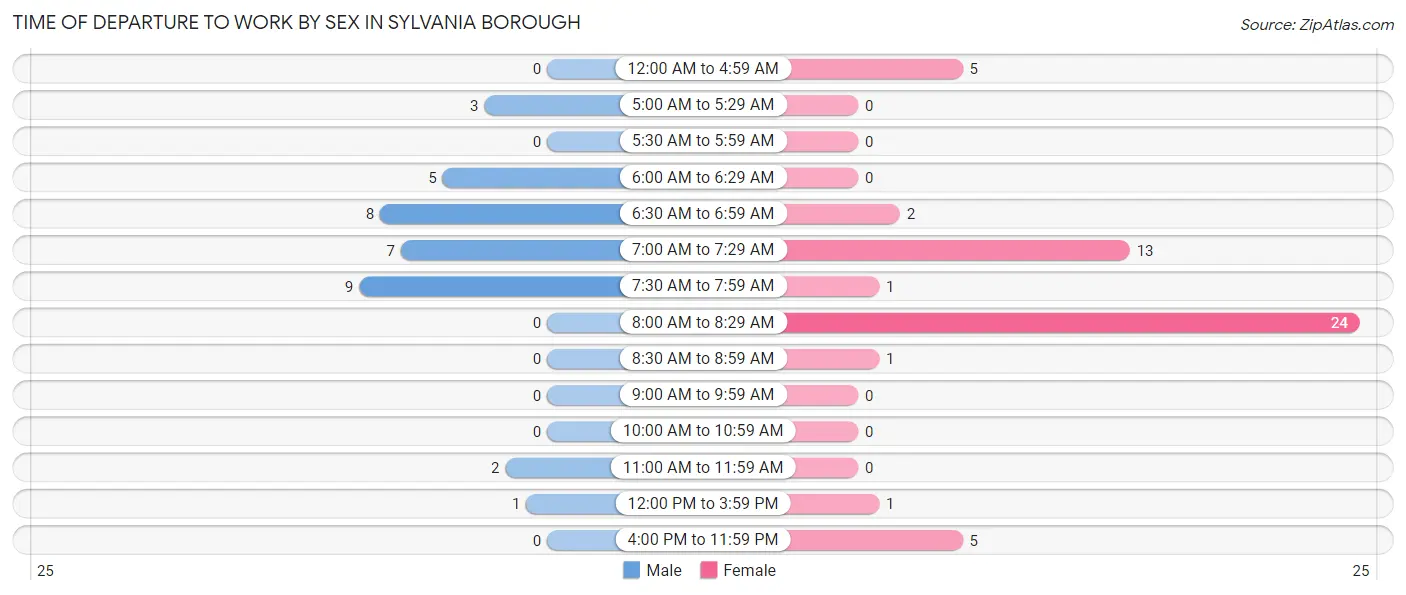
| Time of Departure | Male | Female |
| 12:00 AM to 4:59 AM | 0 (0.0%) | 5 (9.6%) |
| 5:00 AM to 5:29 AM | 3 (8.6%) | 0 (0.0%) |
| 5:30 AM to 5:59 AM | 0 (0.0%) | 0 (0.0%) |
| 6:00 AM to 6:29 AM | 5 (14.3%) | 0 (0.0%) |
| 6:30 AM to 6:59 AM | 8 (22.9%) | 2 (3.8%) |
| 7:00 AM to 7:29 AM | 7 (20.0%) | 13 (25.0%) |
| 7:30 AM to 7:59 AM | 9 (25.7%) | 1 (1.9%) |
| 8:00 AM to 8:29 AM | 0 (0.0%) | 24 (46.2%) |
| 8:30 AM to 8:59 AM | 0 (0.0%) | 1 (1.9%) |
| 9:00 AM to 9:59 AM | 0 (0.0%) | 0 (0.0%) |
| 10:00 AM to 10:59 AM | 0 (0.0%) | 0 (0.0%) |
| 11:00 AM to 11:59 AM | 2 (5.7%) | 0 (0.0%) |
| 12:00 PM to 3:59 PM | 1 (2.9%) | 1 (1.9%) |
| 4:00 PM to 11:59 PM | 0 (0.0%) | 5 (9.6%) |
| Total | 35 (100.0%) | 52 (100.0%) |
Housing Occupancy in Sylvania borough
Occupancy by Ownership in Sylvania borough
Of the total 93 dwellings in Sylvania borough, owner-occupied units account for 78 (83.9%), while renter-occupied units make up 15 (16.1%).
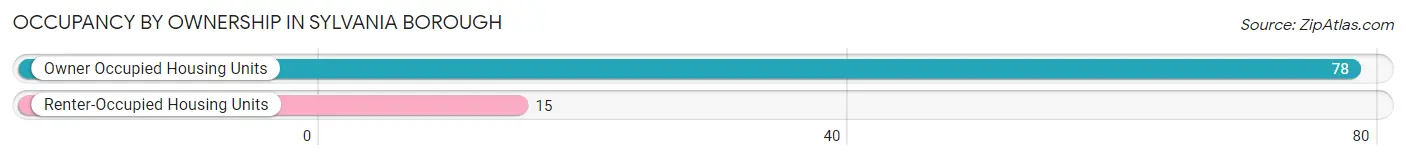
| Occupancy | # Housing Units | % Housing Units |
| Owner Occupied Housing Units | 78 | 83.9% |
| Renter-Occupied Housing Units | 15 | 16.1% |
| Total Occupied Housing Units | 93 | 100.0% |
Occupancy by Household Size in Sylvania borough
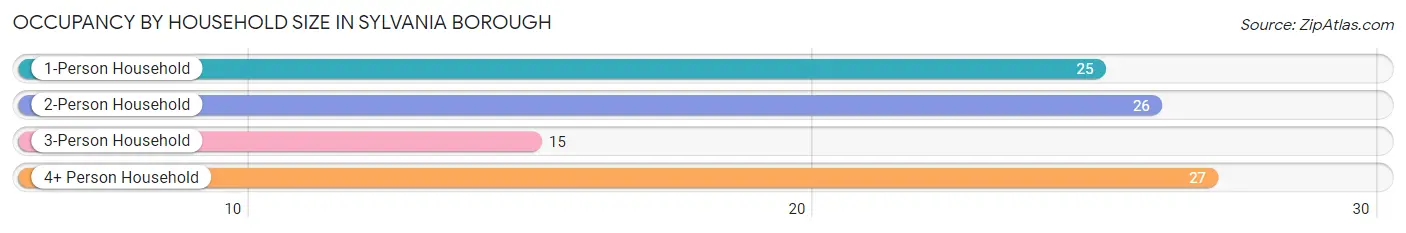
| Household Size | # Housing Units | % Housing Units |
| 1-Person Household | 25 | 26.9% |
| 2-Person Household | 26 | 28.0% |
| 3-Person Household | 15 | 16.1% |
| 4+ Person Household | 27 | 29.0% |
| Total Housing Units | 93 | 100.0% |
Occupancy by Ownership by Household Size in Sylvania borough
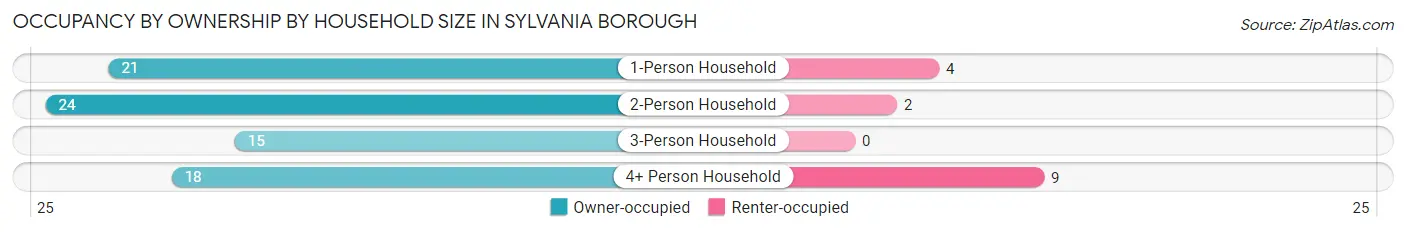
| Household Size | Owner-occupied | Renter-occupied |
| 1-Person Household | 21 (84.0%) | 4 (16.0%) |
| 2-Person Household | 24 (92.3%) | 2 (7.7%) |
| 3-Person Household | 15 (100.0%) | 0 (0.0%) |
| 4+ Person Household | 18 (66.7%) | 9 (33.3%) |
| Total Housing Units | 78 (83.9%) | 15 (16.1%) |
Occupancy by Educational Attainment in Sylvania borough
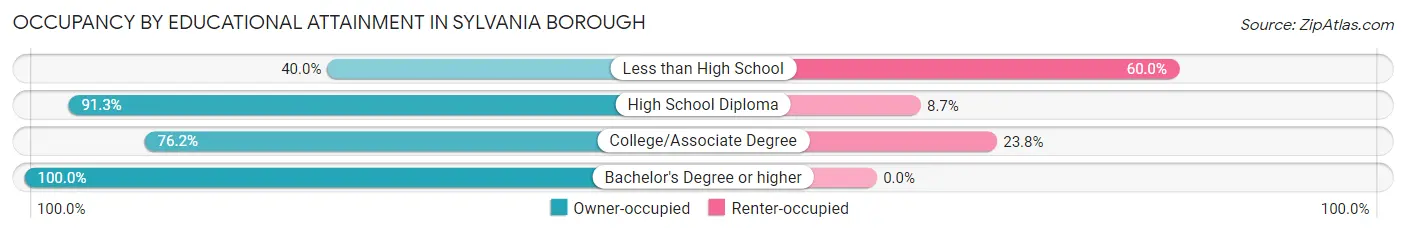
| Household Size | Owner-occupied | Renter-occupied |
| Less than High School | 4 (40.0%) | 6 (60.0%) |
| High School Diploma | 42 (91.3%) | 4 (8.7%) |
| College/Associate Degree | 16 (76.2%) | 5 (23.8%) |
| Bachelor's Degree or higher | 16 (100.0%) | 0 (0.0%) |
Occupancy by Age of Householder in Sylvania borough
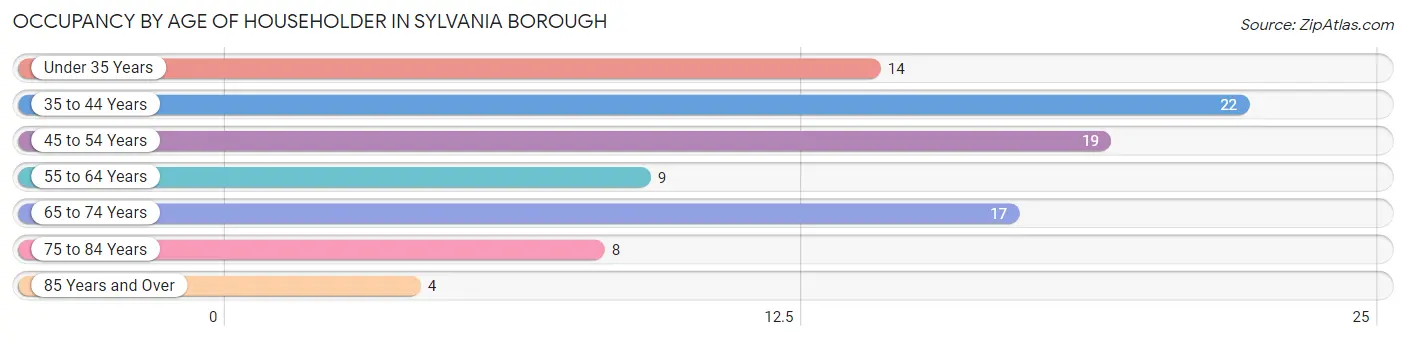
| Age Bracket | # Households | % Households |
| Under 35 Years | 14 | 15.0% |
| 35 to 44 Years | 22 | 23.7% |
| 45 to 54 Years | 19 | 20.4% |
| 55 to 64 Years | 9 | 9.7% |
| 65 to 74 Years | 17 | 18.3% |
| 75 to 84 Years | 8 | 8.6% |
| 85 Years and Over | 4 | 4.3% |
| Total | 93 | 100.0% |
Housing Finances in Sylvania borough
Median Income by Occupancy in Sylvania borough
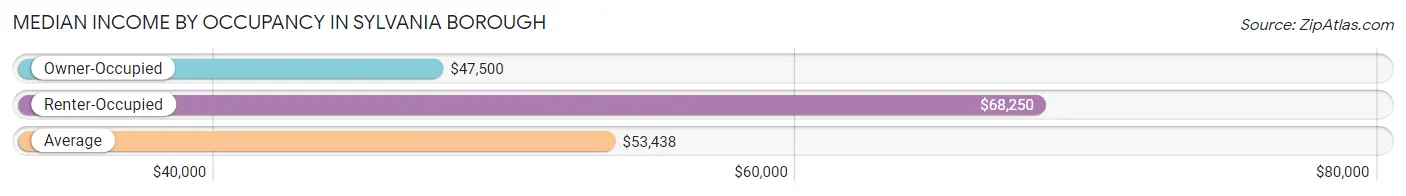
| Occupancy Type | # Households | Median Income |
| Owner-Occupied | 78 (83.9%) | $47,500 |
| Renter-Occupied | 15 (16.1%) | $68,250 |
| Average | 93 (100.0%) | $53,438 |
Occupancy by Householder Income Bracket in Sylvania borough
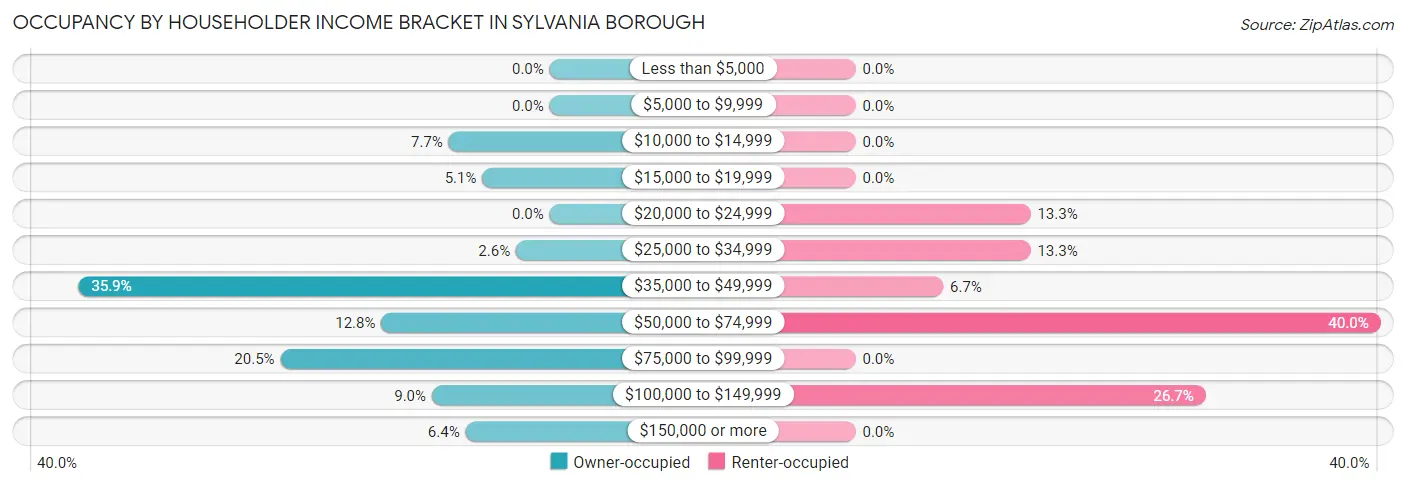
| Income Bracket | Owner-occupied | Renter-occupied |
| Less than $5,000 | 0 (0.0%) | 0 (0.0%) |
| $5,000 to $9,999 | 0 (0.0%) | 0 (0.0%) |
| $10,000 to $14,999 | 6 (7.7%) | 0 (0.0%) |
| $15,000 to $19,999 | 4 (5.1%) | 0 (0.0%) |
| $20,000 to $24,999 | 0 (0.0%) | 2 (13.3%) |
| $25,000 to $34,999 | 2 (2.6%) | 2 (13.3%) |
| $35,000 to $49,999 | 28 (35.9%) | 1 (6.7%) |
| $50,000 to $74,999 | 10 (12.8%) | 6 (40.0%) |
| $75,000 to $99,999 | 16 (20.5%) | 0 (0.0%) |
| $100,000 to $149,999 | 7 (9.0%) | 4 (26.7%) |
| $150,000 or more | 5 (6.4%) | 0 (0.0%) |
| Total | 78 (100.0%) | 15 (100.0%) |
Monthly Housing Cost Tiers in Sylvania borough
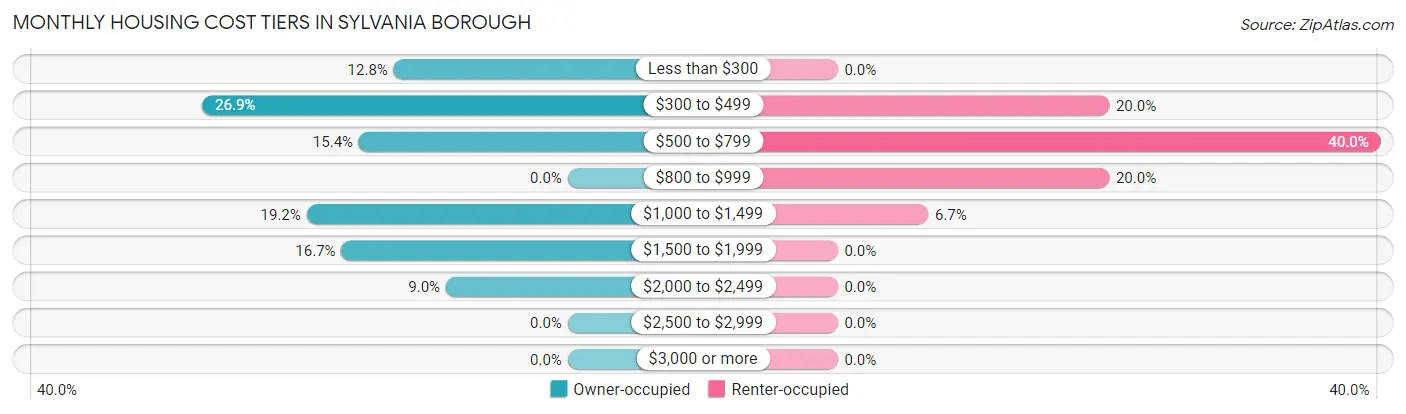
| Monthly Cost | Owner-occupied | Renter-occupied |
| Less than $300 | 10 (12.8%) | 0 (0.0%) |
| $300 to $499 | 21 (26.9%) | 3 (20.0%) |
| $500 to $799 | 12 (15.4%) | 6 (40.0%) |
| $800 to $999 | 0 (0.0%) | 3 (20.0%) |
| $1,000 to $1,499 | 15 (19.2%) | 1 (6.7%) |
| $1,500 to $1,999 | 13 (16.7%) | 0 (0.0%) |
| $2,000 to $2,499 | 7 (9.0%) | 0 (0.0%) |
| $2,500 to $2,999 | 0 (0.0%) | 0 (0.0%) |
| $3,000 or more | 0 (0.0%) | 0 (0.0%) |
| Total | 78 (100.0%) | 15 (100.0%) |
Physical Housing Characteristics in Sylvania borough
Housing Structures in Sylvania borough
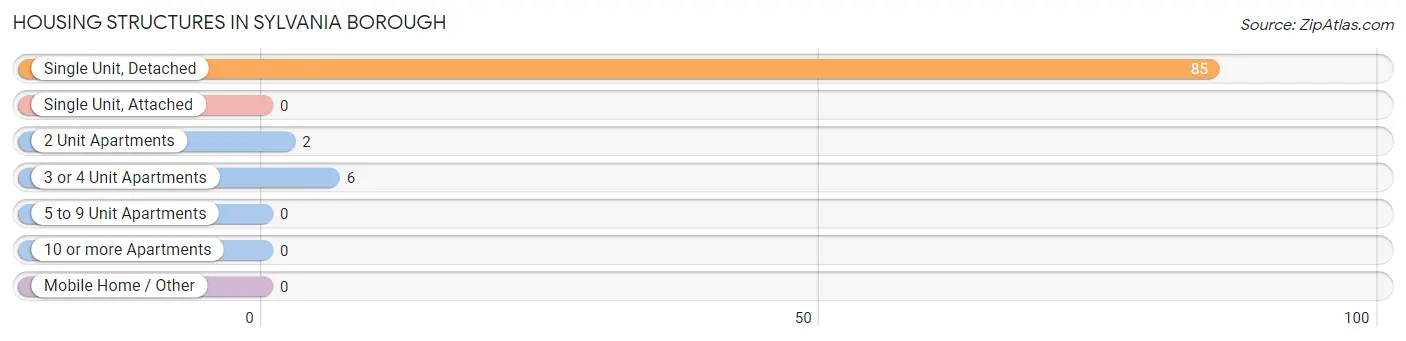
| Structure Type | # Housing Units | % Housing Units |
| Single Unit, Detached | 85 | 91.4% |
| Single Unit, Attached | 0 | 0.0% |
| 2 Unit Apartments | 2 | 2.1% |
| 3 or 4 Unit Apartments | 6 | 6.5% |
| 5 to 9 Unit Apartments | 0 | 0.0% |
| 10 or more Apartments | 0 | 0.0% |
| Mobile Home / Other | 0 | 0.0% |
| Total | 93 | 100.0% |
Housing Structures by Occupancy in Sylvania borough
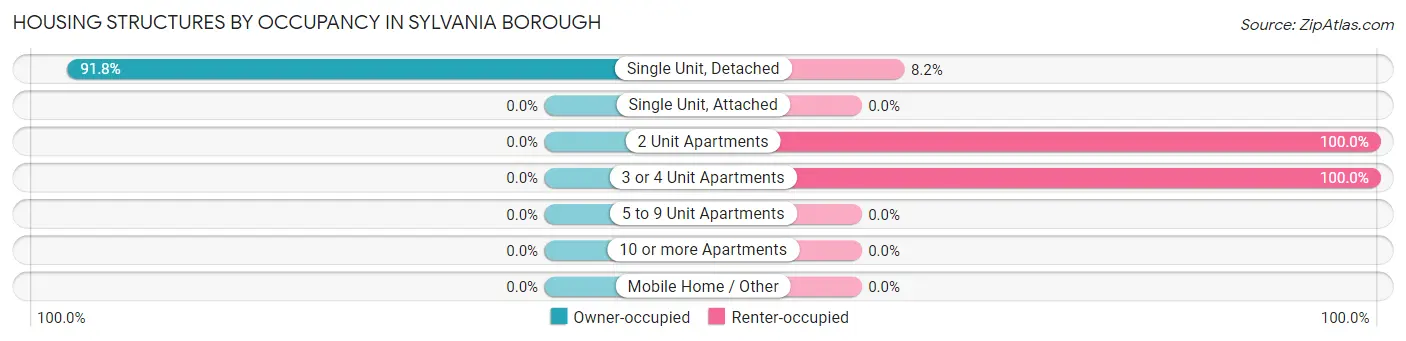
| Structure Type | Owner-occupied | Renter-occupied |
| Single Unit, Detached | 78 (91.8%) | 7 (8.2%) |
| Single Unit, Attached | 0 (0.0%) | 0 (0.0%) |
| 2 Unit Apartments | 0 (0.0%) | 2 (100.0%) |
| 3 or 4 Unit Apartments | 0 (0.0%) | 6 (100.0%) |
| 5 to 9 Unit Apartments | 0 (0.0%) | 0 (0.0%) |
| 10 or more Apartments | 0 (0.0%) | 0 (0.0%) |
| Mobile Home / Other | 0 (0.0%) | 0 (0.0%) |
| Total | 78 (83.9%) | 15 (16.1%) |
Housing Structures by Number of Rooms in Sylvania borough
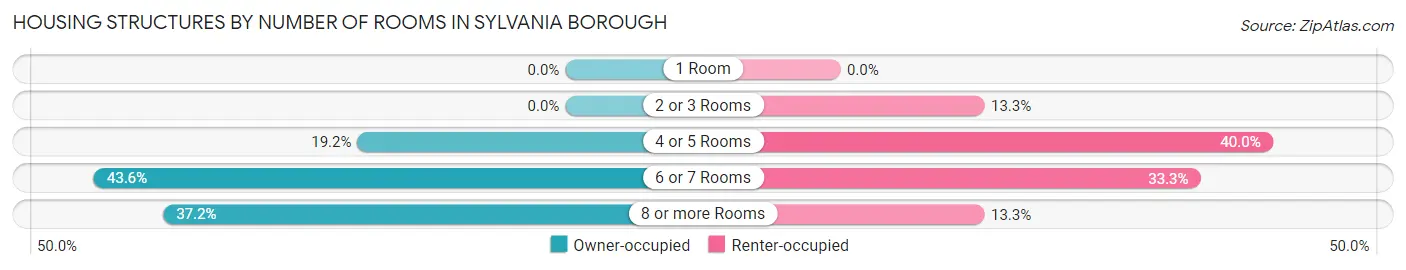
| Number of Rooms | Owner-occupied | Renter-occupied |
| 1 Room | 0 (0.0%) | 0 (0.0%) |
| 2 or 3 Rooms | 0 (0.0%) | 2 (13.3%) |
| 4 or 5 Rooms | 15 (19.2%) | 6 (40.0%) |
| 6 or 7 Rooms | 34 (43.6%) | 5 (33.3%) |
| 8 or more Rooms | 29 (37.2%) | 2 (13.3%) |
| Total | 78 (100.0%) | 15 (100.0%) |
Housing Structure by Heating Type in Sylvania borough
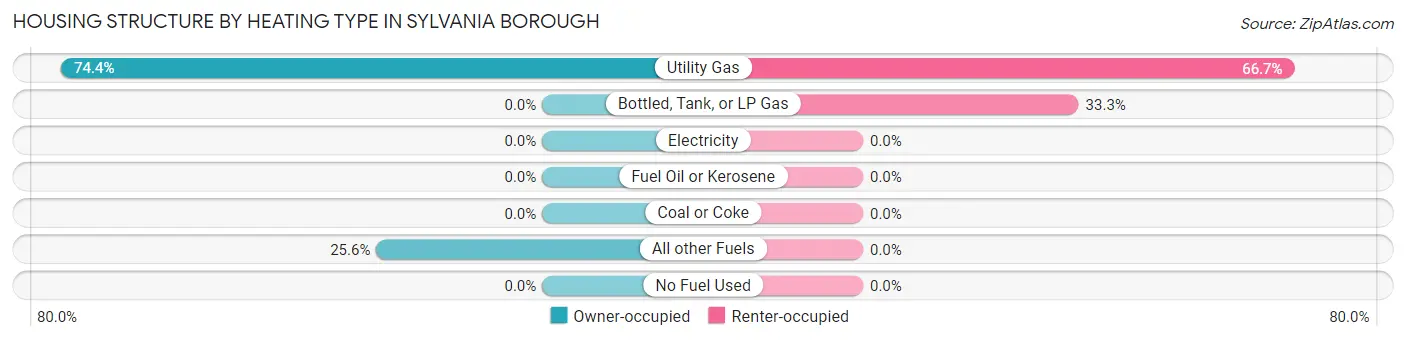
| Heating Type | Owner-occupied | Renter-occupied |
| Utility Gas | 58 (74.4%) | 10 (66.7%) |
| Bottled, Tank, or LP Gas | 0 (0.0%) | 5 (33.3%) |
| Electricity | 0 (0.0%) | 0 (0.0%) |
| Fuel Oil or Kerosene | 0 (0.0%) | 0 (0.0%) |
| Coal or Coke | 0 (0.0%) | 0 (0.0%) |
| All other Fuels | 20 (25.6%) | 0 (0.0%) |
| No Fuel Used | 0 (0.0%) | 0 (0.0%) |
| Total | 78 (100.0%) | 15 (100.0%) |
Household Vehicle Usage in Sylvania borough
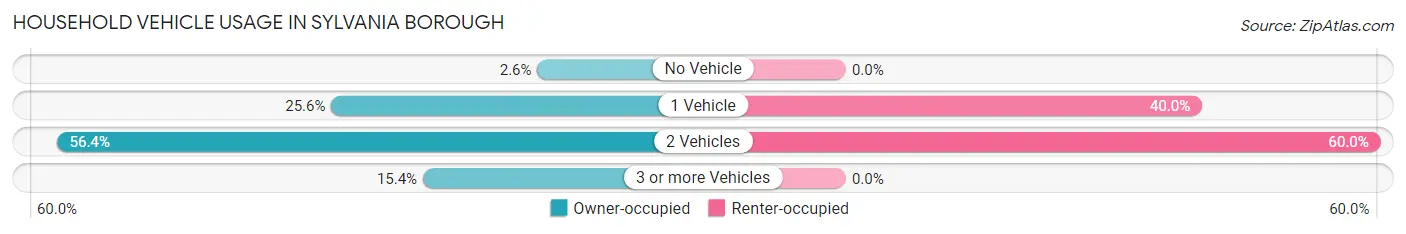
| Vehicles per Household | Owner-occupied | Renter-occupied |
| No Vehicle | 2 (2.6%) | 0 (0.0%) |
| 1 Vehicle | 20 (25.6%) | 6 (40.0%) |
| 2 Vehicles | 44 (56.4%) | 9 (60.0%) |
| 3 or more Vehicles | 12 (15.4%) | 0 (0.0%) |
| Total | 78 (100.0%) | 15 (100.0%) |
Real Estate & Mortgages in Sylvania borough
Real Estate and Mortgage Overview in Sylvania borough
| Characteristic | Without Mortgage | With Mortgage |
| Housing Units | 40 | 38 |
| Median Property Value | $85,000 | $171,400 |
| Median Household Income | $43,333 | $0 |
| Monthly Housing Costs | $400 | $0 |
| Real Estate Taxes | $1,571 | $0 |
Property Value by Mortgage Status in Sylvania borough
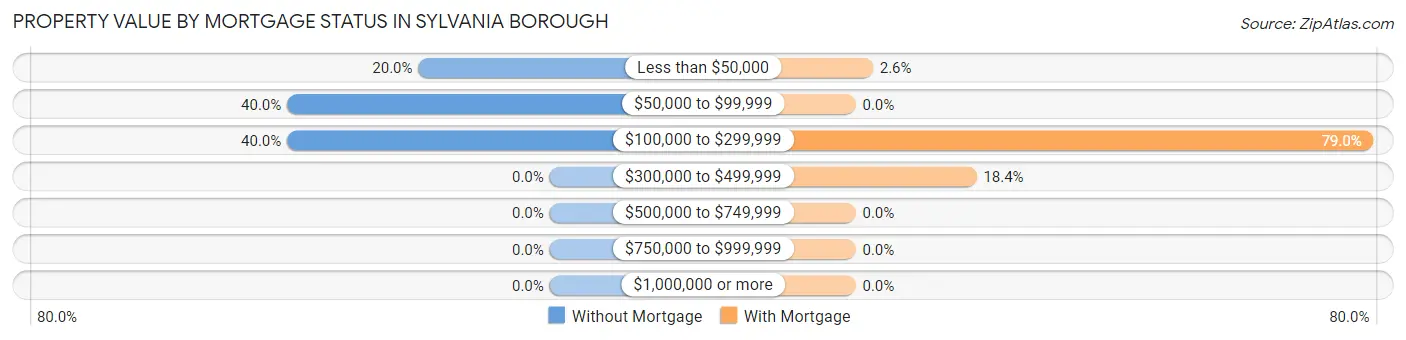
| Property Value | Without Mortgage | With Mortgage |
| Less than $50,000 | 8 (20.0%) | 1 (2.6%) |
| $50,000 to $99,999 | 16 (40.0%) | 0 (0.0%) |
| $100,000 to $299,999 | 16 (40.0%) | 30 (78.9%) |
| $300,000 to $499,999 | 0 (0.0%) | 7 (18.4%) |
| $500,000 to $749,999 | 0 (0.0%) | 0 (0.0%) |
| $750,000 to $999,999 | 0 (0.0%) | 0 (0.0%) |
| $1,000,000 or more | 0 (0.0%) | 0 (0.0%) |
| Total | 40 (100.0%) | 38 (100.0%) |
Household Income by Mortgage Status in Sylvania borough
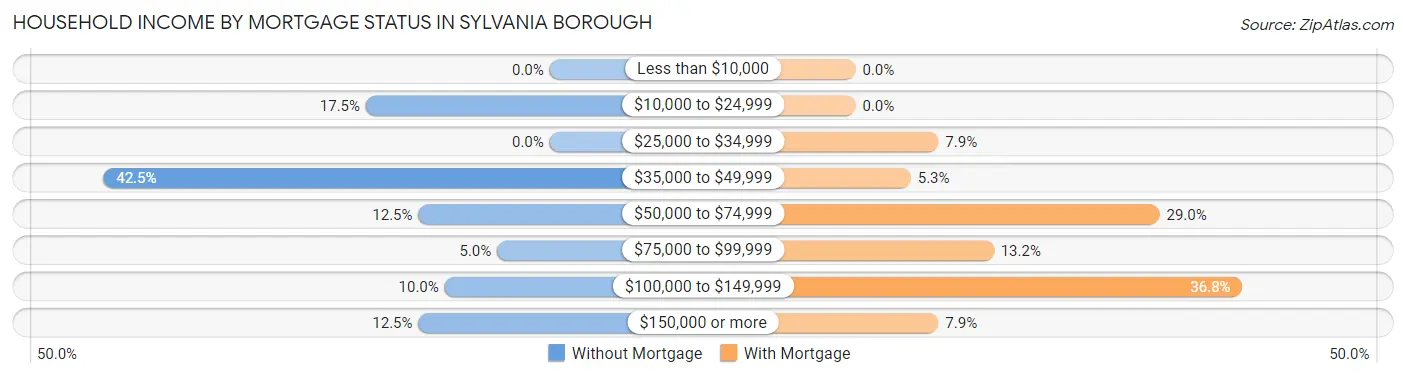
| Household Income | Without Mortgage | With Mortgage |
| Less than $10,000 | 0 (0.0%) | 0 (0.0%) |
| $10,000 to $24,999 | 7 (17.5%) | 0 (0.0%) |
| $25,000 to $34,999 | 0 (0.0%) | 3 (7.9%) |
| $35,000 to $49,999 | 17 (42.5%) | 2 (5.3%) |
| $50,000 to $74,999 | 5 (12.5%) | 11 (28.9%) |
| $75,000 to $99,999 | 2 (5.0%) | 5 (13.2%) |
| $100,000 to $149,999 | 4 (10.0%) | 14 (36.8%) |
| $150,000 or more | 5 (12.5%) | 3 (7.9%) |
| Total | 40 (100.0%) | 38 (100.0%) |
Property Value to Household Income Ratio in Sylvania borough
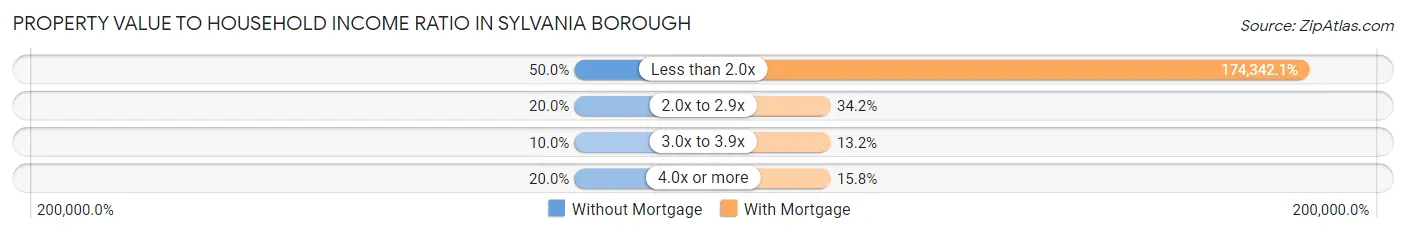
| Value-to-Income Ratio | Without Mortgage | With Mortgage |
| Less than 2.0x | 20 (50.0%) | 66,250 (174,342.1%) |
| 2.0x to 2.9x | 8 (20.0%) | 13 (34.2%) |
| 3.0x to 3.9x | 4 (10.0%) | 5 (13.2%) |
| 4.0x or more | 8 (20.0%) | 6 (15.8%) |
| Total | 40 (100.0%) | 38 (100.0%) |
Real Estate Taxes by Mortgage Status in Sylvania borough
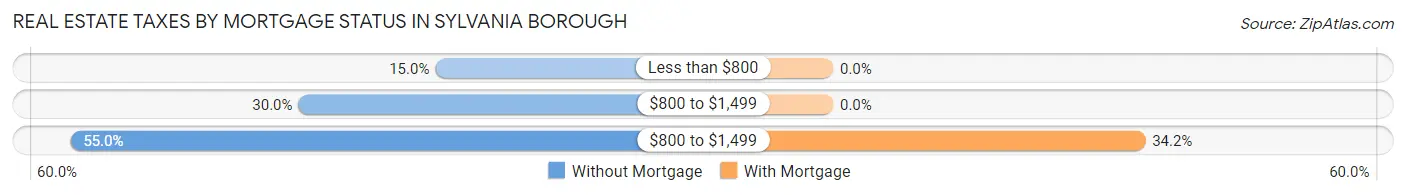
| Property Taxes | Without Mortgage | With Mortgage |
| Less than $800 | 6 (15.0%) | 0 (0.0%) |
| $800 to $1,499 | 12 (30.0%) | 0 (0.0%) |
| $800 to $1,499 | 22 (55.0%) | 13 (34.2%) |
| Total | 40 (100.0%) | 38 (100.0%) |
Health & Disability in Sylvania borough
Health Insurance Coverage by Age in Sylvania borough
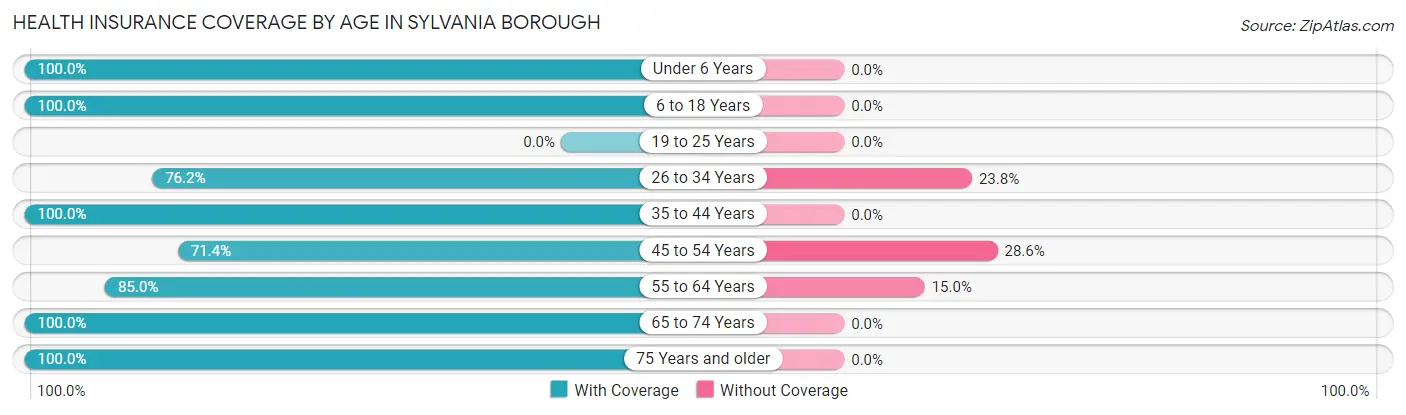
| Age Bracket | With Coverage | Without Coverage |
| Under 6 Years | 28 (100.0%) | 0 (0.0%) |
| 6 to 18 Years | 49 (100.0%) | 0 (0.0%) |
| 19 to 25 Years | 0 (0.0%) | 0 (0.0%) |
| 26 to 34 Years | 32 (76.2%) | 10 (23.8%) |
| 35 to 44 Years | 37 (100.0%) | 0 (0.0%) |
| 45 to 54 Years | 20 (71.4%) | 8 (28.6%) |
| 55 to 64 Years | 17 (85.0%) | 3 (15.0%) |
| 65 to 74 Years | 27 (100.0%) | 0 (0.0%) |
| 75 Years and older | 15 (100.0%) | 0 (0.0%) |
| Total | 225 (91.5%) | 21 (8.5%) |
Health Insurance Coverage by Citizenship Status in Sylvania borough
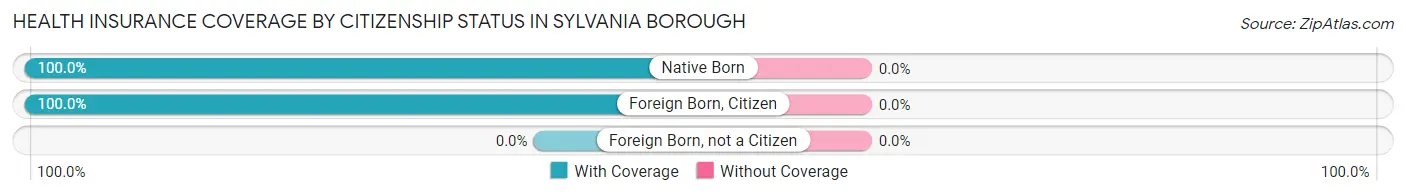
| Citizenship Status | With Coverage | Without Coverage |
| Native Born | 28 (100.0%) | 0 (0.0%) |
| Foreign Born, Citizen | 49 (100.0%) | 0 (0.0%) |
| Foreign Born, not a Citizen | 0 (0.0%) | 0 (0.0%) |
Health Insurance Coverage by Household Income in Sylvania borough
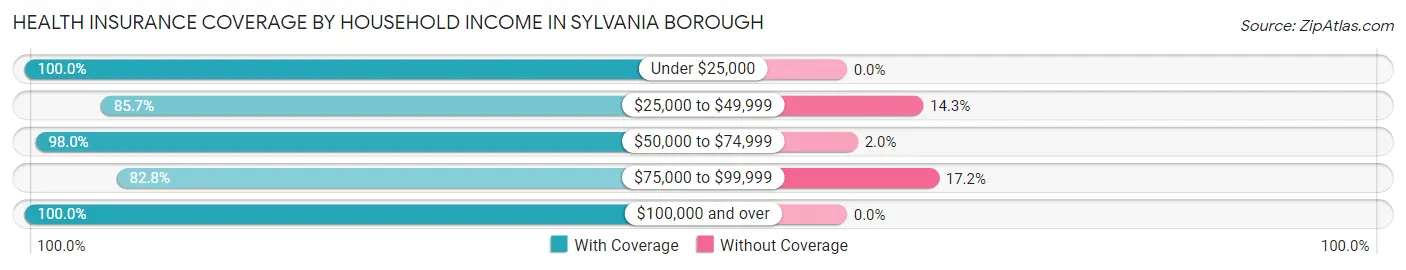
| Household Income | With Coverage | Without Coverage |
| Under $25,000 | 17 (100.0%) | 0 (0.0%) |
| $25,000 to $49,999 | 60 (85.7%) | 10 (14.3%) |
| $50,000 to $74,999 | 48 (98.0%) | 1 (2.0%) |
| $75,000 to $99,999 | 48 (82.8%) | 10 (17.2%) |
| $100,000 and over | 52 (100.0%) | 0 (0.0%) |
Public vs Private Health Insurance Coverage by Age in Sylvania borough
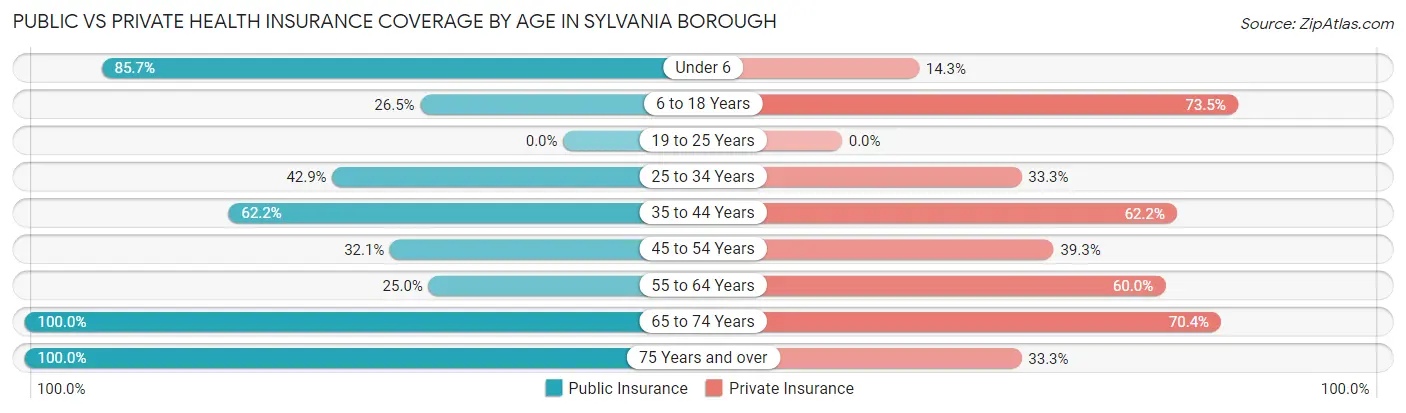
| Age Bracket | Public Insurance | Private Insurance |
| Under 6 | 24 (85.7%) | 4 (14.3%) |
| 6 to 18 Years | 13 (26.5%) | 36 (73.5%) |
| 19 to 25 Years | 0 (0.0%) | 0 (0.0%) |
| 25 to 34 Years | 18 (42.9%) | 14 (33.3%) |
| 35 to 44 Years | 23 (62.2%) | 23 (62.2%) |
| 45 to 54 Years | 9 (32.1%) | 11 (39.3%) |
| 55 to 64 Years | 5 (25.0%) | 12 (60.0%) |
| 65 to 74 Years | 27 (100.0%) | 19 (70.4%) |
| 75 Years and over | 15 (100.0%) | 5 (33.3%) |
| Total | 134 (54.5%) | 124 (50.4%) |
Disability Status by Sex by Age in Sylvania borough
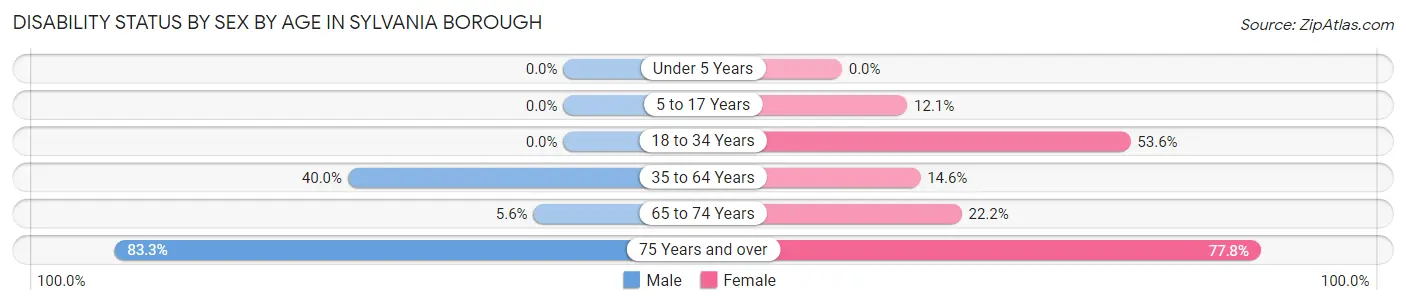
| Age Bracket | Male | Female |
| Under 5 Years | 0 (0.0%) | 0 (0.0%) |
| 5 to 17 Years | 0 (0.0%) | 4 (12.1%) |
| 18 to 34 Years | 0 (0.0%) | 15 (53.6%) |
| 35 to 64 Years | 12 (40.0%) | 8 (14.5%) |
| 65 to 74 Years | 1 (5.6%) | 2 (22.2%) |
| 75 Years and over | 5 (83.3%) | 7 (77.8%) |
Disability Class by Sex by Age in Sylvania borough
Disability Class: Hearing Difficulty
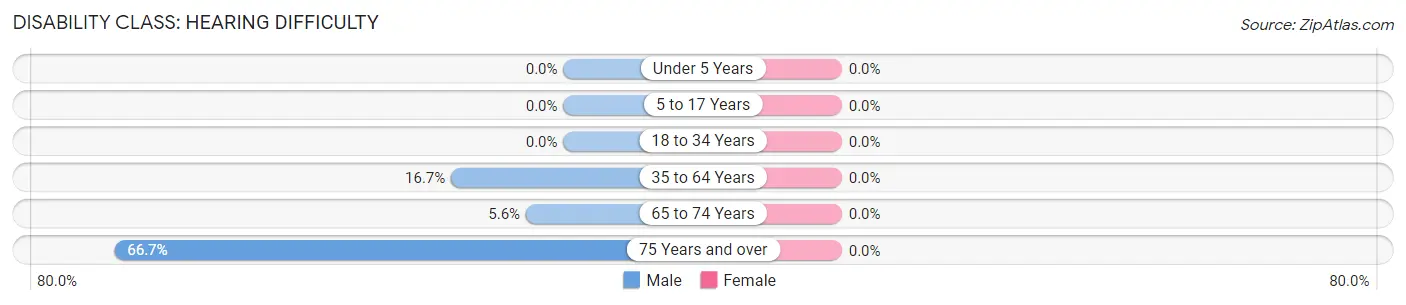
| Age Bracket | Male | Female |
| Under 5 Years | 0 (0.0%) | 0 (0.0%) |
| 5 to 17 Years | 0 (0.0%) | 0 (0.0%) |
| 18 to 34 Years | 0 (0.0%) | 0 (0.0%) |
| 35 to 64 Years | 5 (16.7%) | 0 (0.0%) |
| 65 to 74 Years | 1 (5.6%) | 0 (0.0%) |
| 75 Years and over | 4 (66.7%) | 0 (0.0%) |
Disability Class: Vision Difficulty
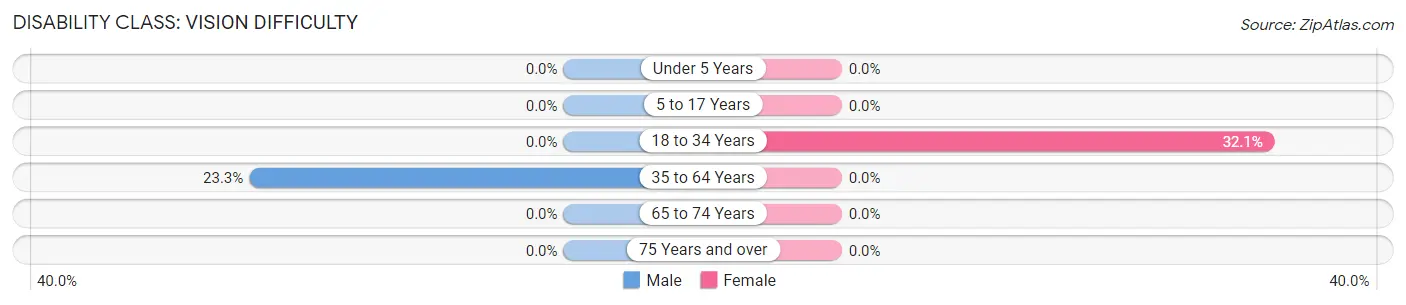
| Age Bracket | Male | Female |
| Under 5 Years | 0 (0.0%) | 0 (0.0%) |
| 5 to 17 Years | 0 (0.0%) | 0 (0.0%) |
| 18 to 34 Years | 0 (0.0%) | 9 (32.1%) |
| 35 to 64 Years | 7 (23.3%) | 0 (0.0%) |
| 65 to 74 Years | 0 (0.0%) | 0 (0.0%) |
| 75 Years and over | 0 (0.0%) | 0 (0.0%) |
Disability Class: Cognitive Difficulty
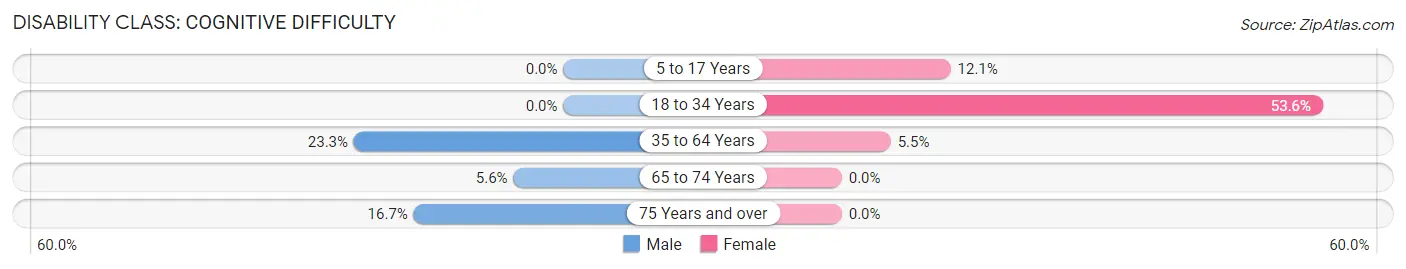
| Age Bracket | Male | Female |
| 5 to 17 Years | 0 (0.0%) | 4 (12.1%) |
| 18 to 34 Years | 0 (0.0%) | 15 (53.6%) |
| 35 to 64 Years | 7 (23.3%) | 3 (5.4%) |
| 65 to 74 Years | 1 (5.6%) | 0 (0.0%) |
| 75 Years and over | 1 (16.7%) | 0 (0.0%) |
Disability Class: Ambulatory Difficulty
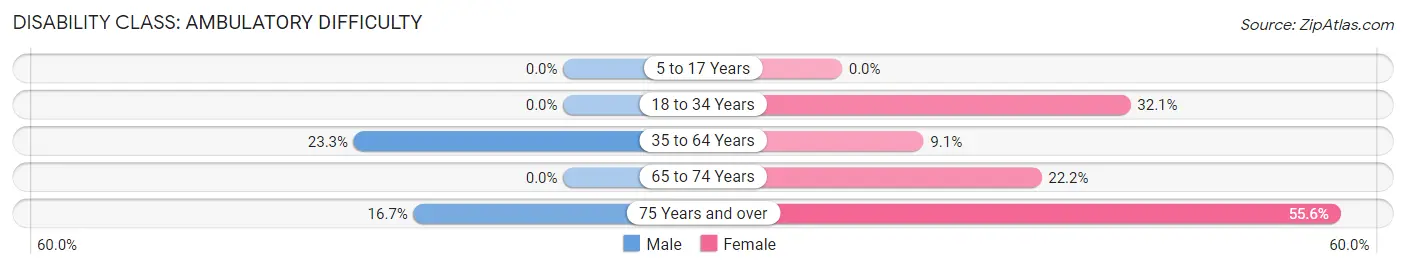
| Age Bracket | Male | Female |
| 5 to 17 Years | 0 (0.0%) | 0 (0.0%) |
| 18 to 34 Years | 0 (0.0%) | 9 (32.1%) |
| 35 to 64 Years | 7 (23.3%) | 5 (9.1%) |
| 65 to 74 Years | 0 (0.0%) | 2 (22.2%) |
| 75 Years and over | 1 (16.7%) | 5 (55.6%) |
Disability Class: Self-Care Difficulty
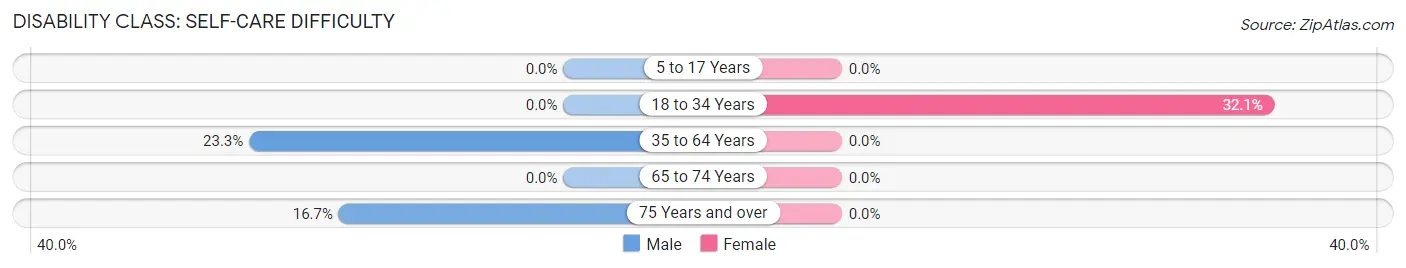
| Age Bracket | Male | Female |
| 5 to 17 Years | 0 (0.0%) | 0 (0.0%) |
| 18 to 34 Years | 0 (0.0%) | 9 (32.1%) |
| 35 to 64 Years | 7 (23.3%) | 0 (0.0%) |
| 65 to 74 Years | 0 (0.0%) | 0 (0.0%) |
| 75 Years and over | 1 (16.7%) | 0 (0.0%) |
Technology Access in Sylvania borough
Computing Device Access in Sylvania borough
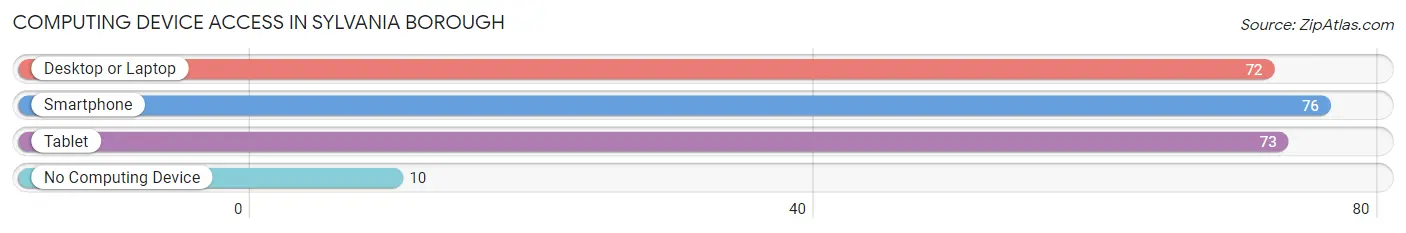
| Device Type | # Households | % Households |
| Desktop or Laptop | 72 | 77.4% |
| Smartphone | 76 | 81.7% |
| Tablet | 73 | 78.5% |
| No Computing Device | 10 | 10.7% |
| Total | 93 | 100.0% |
Internet Access in Sylvania borough
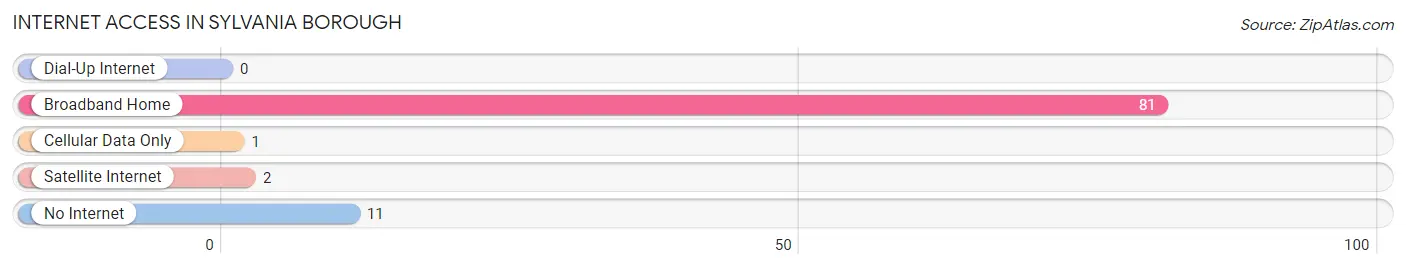
| Internet Type | # Households | % Households |
| Dial-Up Internet | 0 | 0.0% |
| Broadband Home | 81 | 87.1% |
| Cellular Data Only | 1 | 1.1% |
| Satellite Internet | 2 | 2.1% |
| No Internet | 11 | 11.8% |
| Total | 93 | 100.0% |
Sylvania borough Summary
Sylvania Borough is a small borough located in the Allegheny Mountains of Pennsylvania. It is situated in the northern part of the state, in the county of Potter. The borough is located in the heart of the Allegheny National Forest, and is surrounded by the Susquehanna River and the Allegheny River. The population of Sylvania Borough was 1,093 in the 2010 census.
Geography
Sylvania Borough is located in the northern part of Potter County, Pennsylvania. It is situated in the Allegheny Mountains, and is surrounded by the Susquehanna River and the Allegheny River. The borough is located in the heart of the Allegheny National Forest, and is surrounded by the Susquehanna River and the Allegheny River. The borough is located at an elevation of 1,890 feet above sea level. The total area of the borough is 0.7 square miles, all of which is land.
The climate in Sylvania Borough is classified as humid continental, with cold winters and warm summers. The average annual temperature is 46.2 degrees Fahrenheit, and the average annual precipitation is 40.2 inches.
Economy
The economy of Sylvania Borough is largely based on tourism and recreation. The borough is home to several recreational activities, including fishing, hunting, camping, and hiking. The borough is also home to several small businesses, including restaurants, retail stores, and lodging.
Demographics
As of the 2010 census, the population of Sylvania Borough was 1,093. The racial makeup of the borough was 97.2% White, 0.7% African American, 0.2% Native American, 0.2% Asian, 0.2% from other races, and 1.7% from two or more races. Hispanic or Latino of any race were 0.7% of the population.
The median income for a household in the borough was $37,500, and the median income for a family was $41,250. The per capita income for the borough was $17,845. About 11.2% of families and 13.2% of the population were below the poverty line, including 16.7% of those under age 18 and 8.3% of those age 65 or over.
History
Sylvania Borough was founded in 1845 by a group of settlers from New York. The borough was named after the Latin word for “forest”, and was originally intended to be a logging town. The borough was incorporated in 1851, and the first post office was established in 1852.
In the late 19th century, the borough became a popular tourist destination, due to its proximity to the Allegheny National Forest. The borough was also home to several small businesses, including a sawmill, a grist mill, and a tannery.
In the early 20th century, the borough began to decline, as the logging industry began to decline. The borough was also affected by the Great Depression, and many of the businesses in the borough closed.
In the late 20th century, the borough began to experience a resurgence, as tourism and recreation began to increase. The borough is now home to several small businesses, including restaurants, retail stores, and lodging.
Common Questions
What is Per Capita Income in Sylvania borough?
Per Capita income in Sylvania borough is $28,585.
What is the Median Family Income in Sylvania borough?
Median Family Income in Sylvania borough is $69,583.
What is the Median Household income in Sylvania borough?
Median Household Income in Sylvania borough is $53,438.
What is Income or Wage Gap in Sylvania borough?
Income or Wage Gap in Sylvania borough is 70.6%.
Women in Sylvania borough earn 29.4 cents for every dollar earned by a man.
What is Inequality or Gini Index in Sylvania borough?
Inequality or Gini Index in Sylvania borough is 0.40.
What is the Total Population of Sylvania borough?
Total Population of Sylvania borough is 246.
What is the Total Male Population of Sylvania borough?
Total Male Population of Sylvania borough is 105.
What is the Total Female Population of Sylvania borough?
Total Female Population of Sylvania borough is 141.
What is the Ratio of Males per 100 Females in Sylvania borough?
There are 74.47 Males per 100 Females in Sylvania borough.
What is the Ratio of Females per 100 Males in Sylvania borough?
There are 134.29 Females per 100 Males in Sylvania borough.
What is the Median Population Age in Sylvania borough?
Median Population Age in Sylvania borough is 36.4 Years.
What is the Average Family Size in Sylvania borough
Average Family Size in Sylvania borough is 3.0 People.
What is the Average Household Size in Sylvania borough
Average Household Size in Sylvania borough is 2.6 People.
How Large is the Labor Force in Sylvania borough?
There are 89 People in the Labor Forcein in Sylvania borough.
What is the Percentage of People in the Labor Force in Sylvania borough?
50.9% of People are in the Labor Force in Sylvania borough.
What is the Unemployment Rate in Sylvania borough?
Unemployment Rate in Sylvania borough is 2.2%.