Strattanville borough, PA Map & Demographics
Strattanville borough Overview
$28,625
PER CAPITA INCOME
$52,054
AVG FAMILY INCOME
$51,250
AVG HOUSEHOLD INCOME
40.0%
WAGE / INCOME GAP [ % ]
60.0¢/ $1
WAGE / INCOME GAP [ $ ]
0.37
INEQUALITY / GINI INDEX
605
TOTAL POPULATION
306
MALE POPULATION
299
FEMALE POPULATION
102.34
MALES / 100 FEMALES
97.71
FEMALES / 100 MALES
46.3
MEDIAN AGE
2.5
AVG FAMILY SIZE
2.2
AVG HOUSEHOLD SIZE
336
LABOR FORCE [ PEOPLE ]
64.0%
PERCENT IN LABOR FORCE
1.2%
UNEMPLOYMENT RATE
Income in Strattanville borough
Income Overview in Strattanville borough
Per Capita Income in Strattanville borough is $28,625, while median incomes of families and households are $52,054 and $51,250 respectively.
| Characteristic | Number | Measure |
| Per Capita Income | 605 | $28,625 |
| Median Family Income | 178 | $52,054 |
| Mean Family Income | 178 | $66,179 |
| Median Household Income | 268 | $51,250 |
| Mean Household Income | 268 | $64,185 |
| Income Deficit | 178 | $0 |
| Wage / Income Gap (%) | 605 | 39.97% |
| Wage / Income Gap ($) | 605 | 60.03¢ per $1 |
| Gini / Inequality Index | 605 | 0.37 |
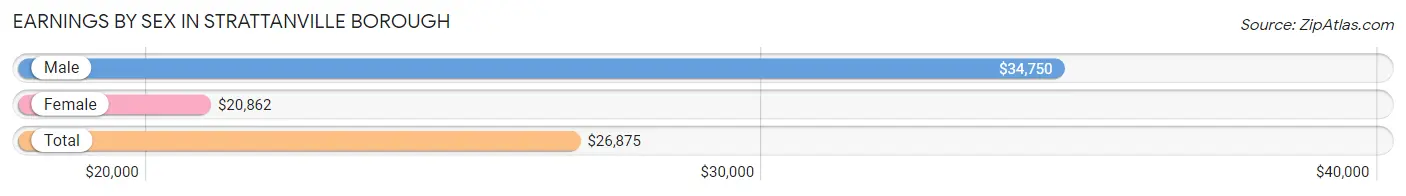
Earnings by Sex in Strattanville borough
Average Earnings in Strattanville borough are $26,875, $34,750 for men and $20,862 for women, a difference of 40.0%.
| Sex | Number | Average Earnings |
| Male | 211 (51.3%) | $34,750 |
| Female | 200 (48.7%) | $20,862 |
| Total | 411 (100.0%) | $26,875 |
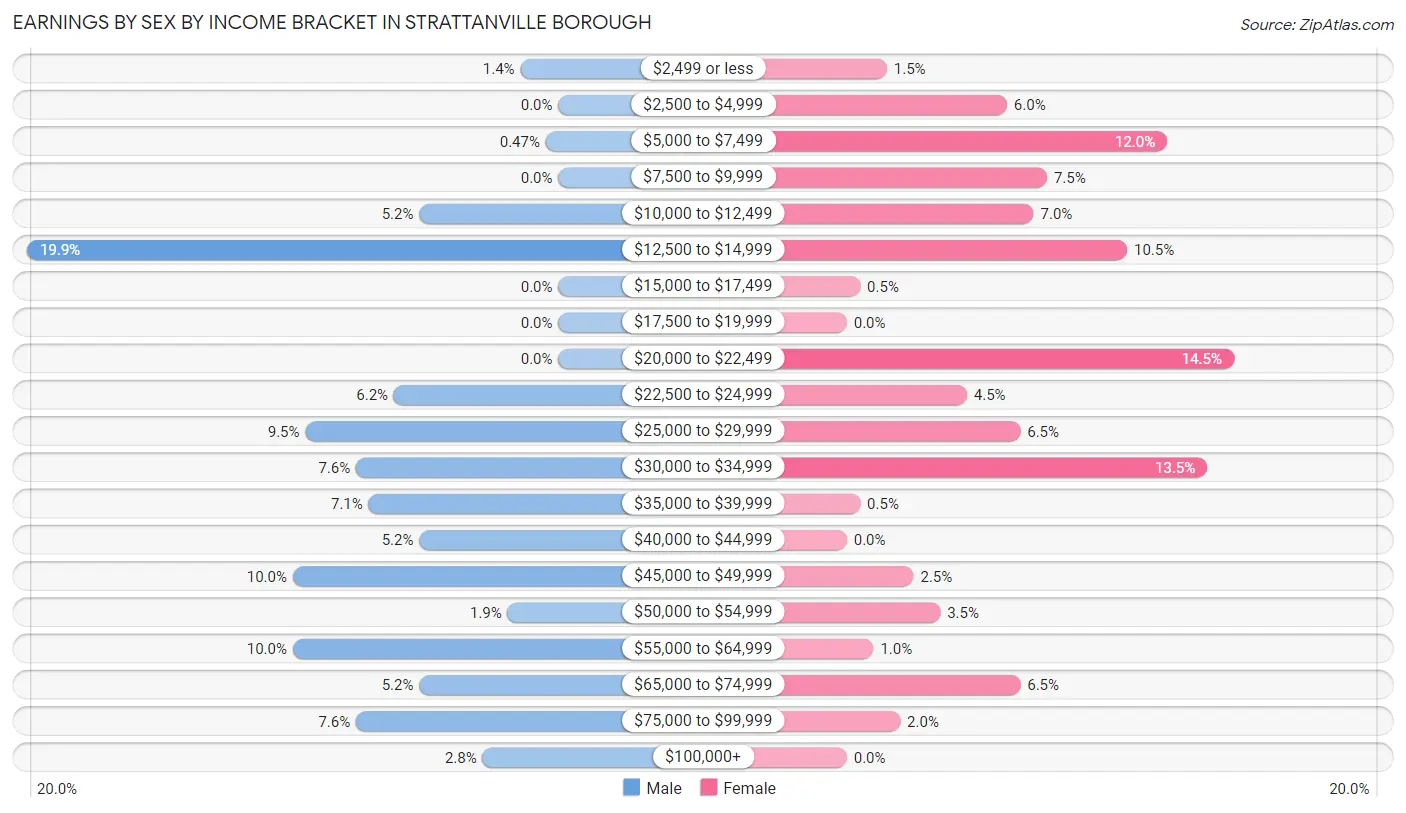
Earnings by Sex by Income Bracket in Strattanville borough
The most common earnings brackets in Strattanville borough are $12,500 to $14,999 for men (42 | 19.9%) and $20,000 to $22,499 for women (29 | 14.5%).
| Income | Male | Female |
| $2,499 or less | 3 (1.4%) | 3 (1.5%) |
| $2,500 to $4,999 | 0 (0.0%) | 12 (6.0%) |
| $5,000 to $7,499 | 1 (0.5%) | 24 (12.0%) |
| $7,500 to $9,999 | 0 (0.0%) | 15 (7.5%) |
| $10,000 to $12,499 | 11 (5.2%) | 14 (7.0%) |
| $12,500 to $14,999 | 42 (19.9%) | 21 (10.5%) |
| $15,000 to $17,499 | 0 (0.0%) | 1 (0.5%) |
| $17,500 to $19,999 | 0 (0.0%) | 0 (0.0%) |
| $20,000 to $22,499 | 0 (0.0%) | 29 (14.5%) |
| $22,500 to $24,999 | 13 (6.2%) | 9 (4.5%) |
| $25,000 to $29,999 | 20 (9.5%) | 13 (6.5%) |
| $30,000 to $34,999 | 16 (7.6%) | 27 (13.5%) |
| $35,000 to $39,999 | 15 (7.1%) | 1 (0.5%) |
| $40,000 to $44,999 | 11 (5.2%) | 0 (0.0%) |
| $45,000 to $49,999 | 21 (10.0%) | 5 (2.5%) |
| $50,000 to $54,999 | 4 (1.9%) | 7 (3.5%) |
| $55,000 to $64,999 | 21 (10.0%) | 2 (1.0%) |
| $65,000 to $74,999 | 11 (5.2%) | 13 (6.5%) |
| $75,000 to $99,999 | 16 (7.6%) | 4 (2.0%) |
| $100,000+ | 6 (2.8%) | 0 (0.0%) |
| Total | 211 (100.0%) | 200 (100.0%) |
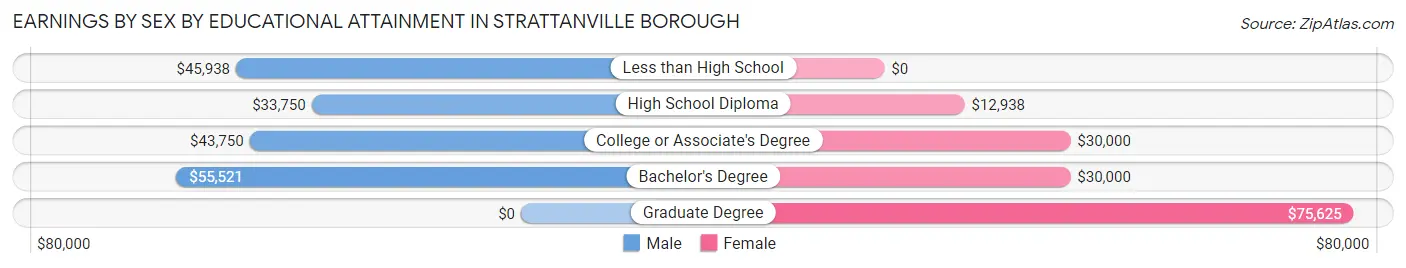
Earnings by Sex by Educational Attainment in Strattanville borough
Average earnings in Strattanville borough are $34,750 for men and $20,511 for women, a difference of 41.0%. Men with an educational attainment of bachelor's degree enjoy the highest average annual earnings of $55,521, while those with high school diploma education earn the least with $33,750. Women with an educational attainment of graduate degree earn the most with the average annual earnings of $75,625, while those with high school diploma education have the smallest earnings of $12,938.
| Educational Attainment | Male Income | Female Income |
| Less than High School | $45,938 | $0 |
| High School Diploma | $33,750 | $12,938 |
| College or Associate's Degree | $43,750 | $30,000 |
| Bachelor's Degree | $55,521 | $30,000 |
| Graduate Degree | - | - |
| Total | $34,750 | $20,511 |
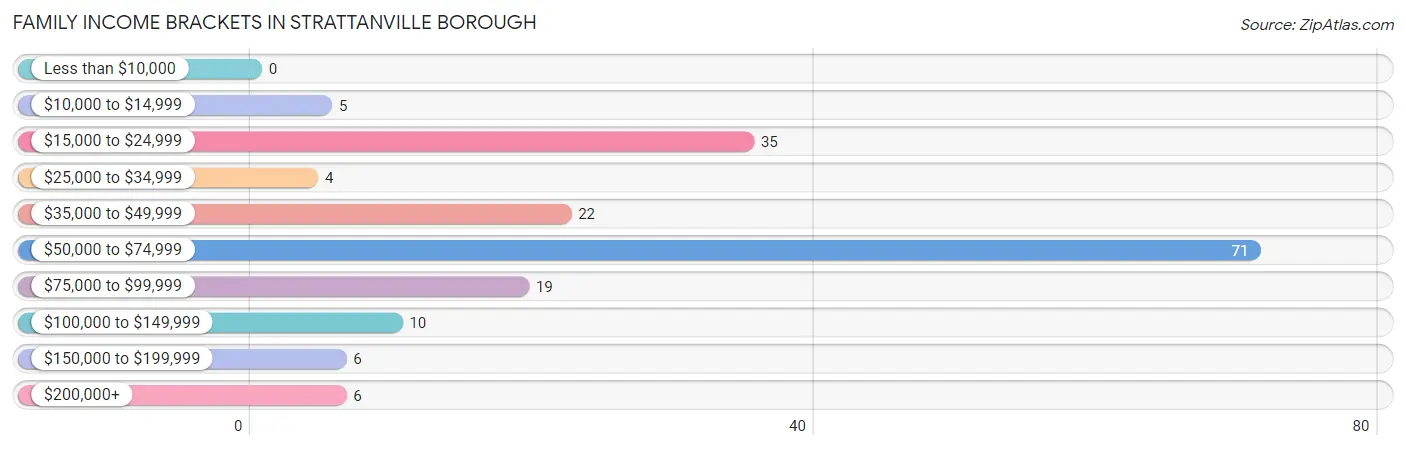
Family Income in Strattanville borough
Family Income Brackets in Strattanville borough
According to the Strattanville borough family income data, there are 71 families falling into the $50,000 to $74,999 income range, which is the most common income bracket and makes up 39.9% of all families.
| Income Bracket | # Families | % Families |
| Less than $10,000 | 0 | 0.0% |
| $10,000 to $14,999 | 5 | 2.8% |
| $15,000 to $24,999 | 35 | 19.7% |
| $25,000 to $34,999 | 4 | 2.2% |
| $35,000 to $49,999 | 22 | 12.4% |
| $50,000 to $74,999 | 71 | 39.9% |
| $75,000 to $99,999 | 19 | 10.7% |
| $100,000 to $149,999 | 10 | 5.6% |
| $150,000 to $199,999 | 6 | 3.4% |
| $200,000+ | 6 | 3.4% |
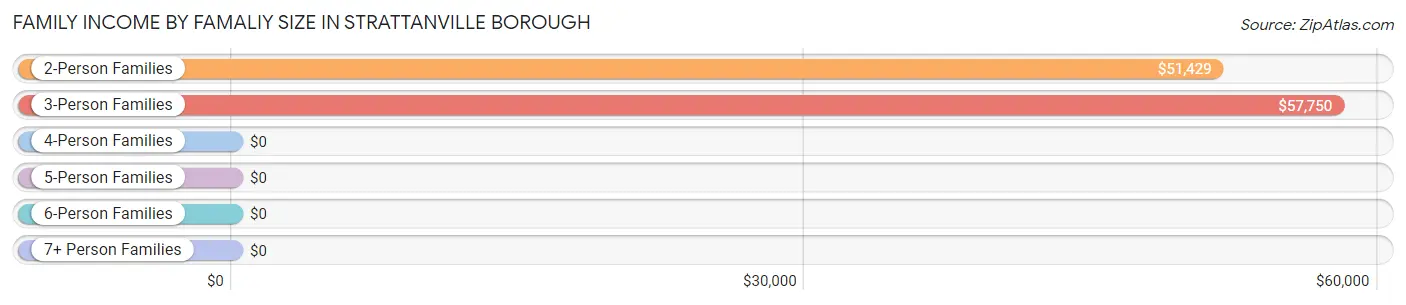
Family Income by Famaliy Size in Strattanville borough
3-person families (36 | 20.2%) account for the highest median family income in Strattanville borough with $57,750 per family, while 2-person families (114 | 64.0%) have the highest median income of $25,714 per family member.
| Income Bracket | # Families | Median Income |
| 2-Person Families | 114 (64.0%) | $51,429 |
| 3-Person Families | 36 (20.2%) | $57,750 |
| 4-Person Families | 24 (13.5%) | $0 |
| 5-Person Families | 0 (0.0%) | $0 |
| 6-Person Families | 4 (2.2%) | $0 |
| 7+ Person Families | 0 (0.0%) | $0 |
| Total | 178 (100.0%) | $52,054 |
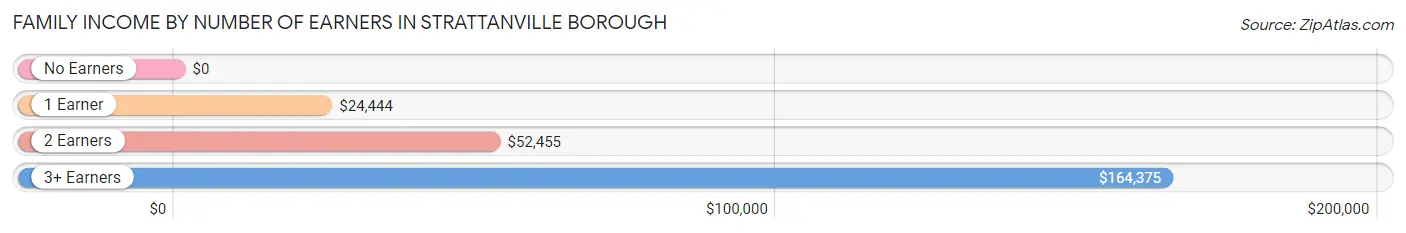
Family Income by Number of Earners in Strattanville borough
| Number of Earners | # Families | Median Income |
| No Earners | 25 (14.0%) | $0 |
| 1 Earner | 42 (23.6%) | $24,444 |
| 2 Earners | 97 (54.5%) | $52,455 |
| 3+ Earners | 14 (7.9%) | $164,375 |
| Total | 178 (100.0%) | $52,054 |
Household Income in Strattanville borough
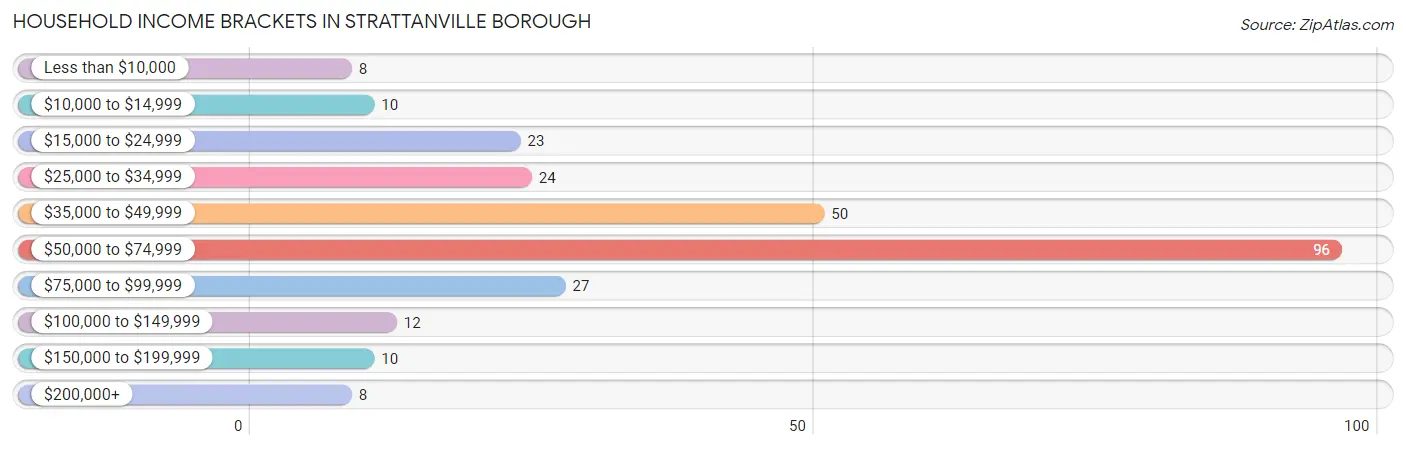
Household Income Brackets in Strattanville borough
With 96 households falling in the category, the $50,000 to $74,999 income range is the most frequent in Strattanville borough, accounting for 35.8% of all households. In contrast, only 8 households (3.0%) fall into the less than $10,000 income bracket, making it the least populous group.
| Income Bracket | # Households | % Households |
| Less than $10,000 | 8 | 3.0% |
| $10,000 to $14,999 | 10 | 3.7% |
| $15,000 to $24,999 | 23 | 8.6% |
| $25,000 to $34,999 | 24 | 9.0% |
| $35,000 to $49,999 | 50 | 18.7% |
| $50,000 to $74,999 | 96 | 35.8% |
| $75,000 to $99,999 | 27 | 10.1% |
| $100,000 to $149,999 | 12 | 4.5% |
| $150,000 to $199,999 | 10 | 3.7% |
| $200,000+ | 8 | 3.0% |
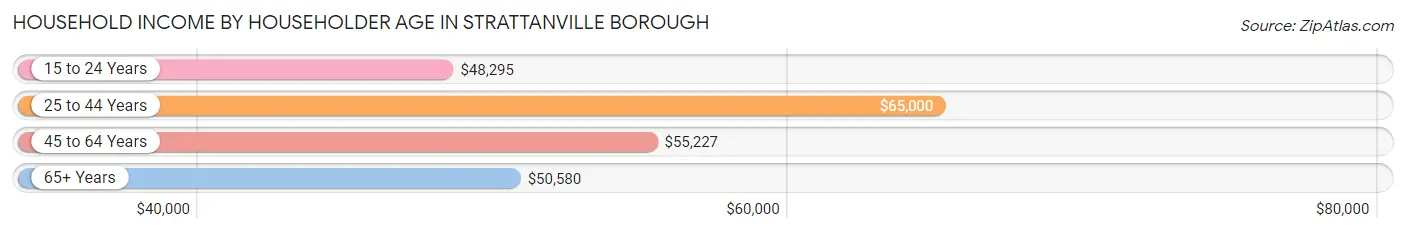
Household Income by Householder Age in Strattanville borough
The median household income in Strattanville borough is $51,250, with the highest median household income of $65,000 found in the 25 to 44 years age bracket for the primary householder. A total of 78 households (29.1%) fall into this category. Meanwhile, the 15 to 24 years age bracket for the primary householder has the lowest median household income of $48,295, with 21 households (7.8%) in this group.
| Income Bracket | # Households | Median Income |
| 15 to 24 Years | 21 (7.8%) | $48,295 |
| 25 to 44 Years | 78 (29.1%) | $65,000 |
| 45 to 64 Years | 88 (32.8%) | $55,227 |
| 65+ Years | 81 (30.2%) | $50,580 |
| Total | 268 (100.0%) | $51,250 |
Poverty in Strattanville borough
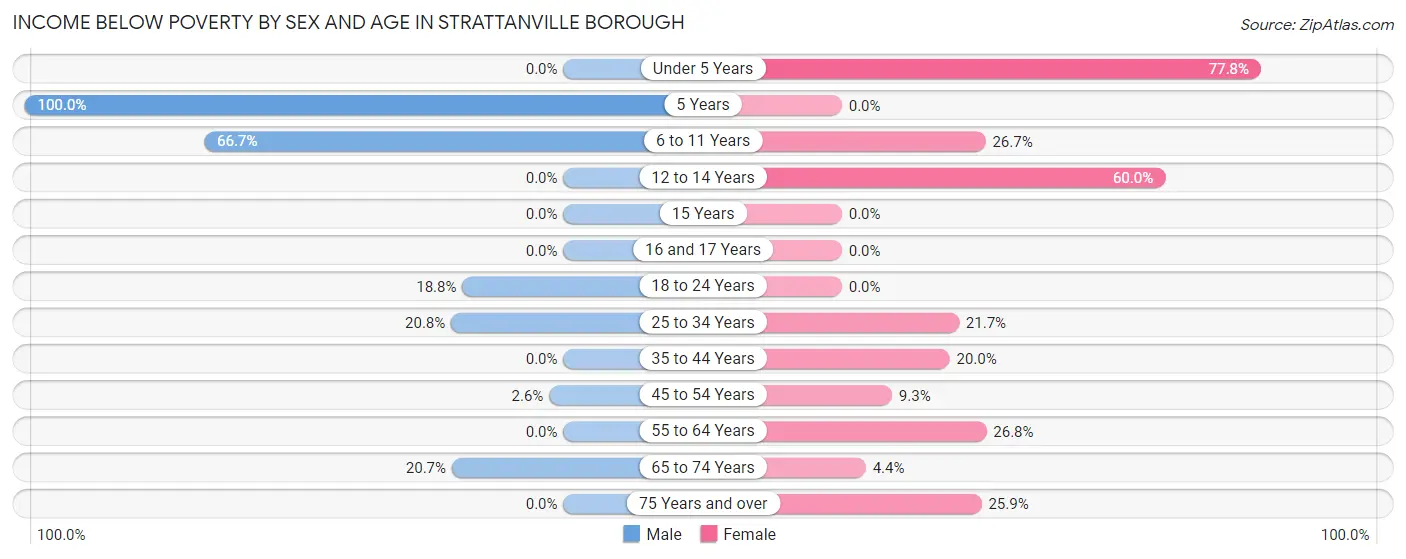
Income Below Poverty by Sex and Age in Strattanville borough
With 10.1% poverty level for males and 17.8% for females among the residents of Strattanville borough, 5 year old males and under 5 year old females are the most vulnerable to poverty, with 6 males (100.0%) and 7 females (77.8%) in their respective age groups living below the poverty level.
| Age Bracket | Male | Female |
| Under 5 Years | 0 (0.0%) | 7 (77.8%) |
| 5 Years | 6 (100.0%) | 0 (0.0%) |
| 6 to 11 Years | 4 (66.7%) | 4 (26.7%) |
| 12 to 14 Years | 0 (0.0%) | 3 (60.0%) |
| 15 Years | 0 (0.0%) | 0 (0.0%) |
| 16 and 17 Years | 0 (0.0%) | 0 (0.0%) |
| 18 to 24 Years | 3 (18.8%) | 0 (0.0%) |
| 25 to 34 Years | 5 (20.8%) | 5 (21.7%) |
| 35 to 44 Years | 0 (0.0%) | 10 (20.0%) |
| 45 to 54 Years | 1 (2.6%) | 4 (9.3%) |
| 55 to 64 Years | 0 (0.0%) | 11 (26.8%) |
| 65 to 74 Years | 12 (20.7%) | 2 (4.4%) |
| 75 Years and over | 0 (0.0%) | 7 (25.9%) |
| Total | 31 (10.1%) | 53 (17.8%) |
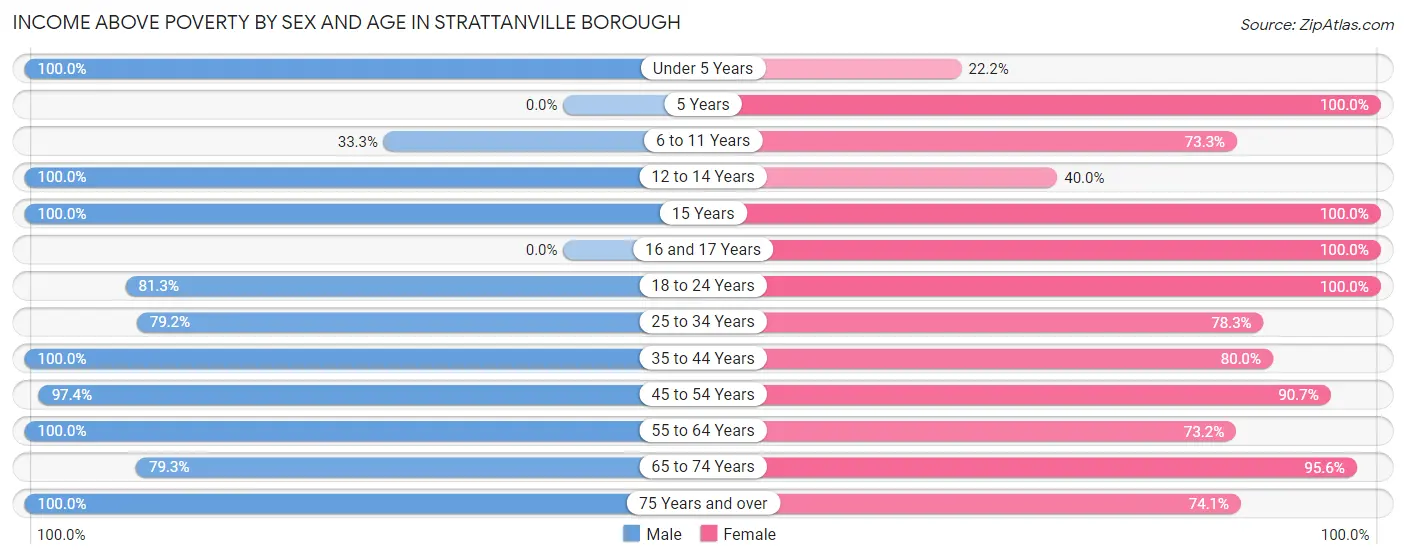
Income Above Poverty by Sex and Age in Strattanville borough
According to the poverty statistics in Strattanville borough, males aged under 5 years and females aged 5 years are the age groups that are most secure financially, with 100.0% of males and 100.0% of females in these age groups living above the poverty line.
| Age Bracket | Male | Female |
| Under 5 Years | 22 (100.0%) | 2 (22.2%) |
| 5 Years | 0 (0.0%) | 1 (100.0%) |
| 6 to 11 Years | 2 (33.3%) | 11 (73.3%) |
| 12 to 14 Years | 5 (100.0%) | 2 (40.0%) |
| 15 Years | 2 (100.0%) | 7 (100.0%) |
| 16 and 17 Years | 0 (0.0%) | 9 (100.0%) |
| 18 to 24 Years | 13 (81.2%) | 22 (100.0%) |
| 25 to 34 Years | 19 (79.2%) | 18 (78.3%) |
| 35 to 44 Years | 71 (100.0%) | 40 (80.0%) |
| 45 to 54 Years | 37 (97.4%) | 39 (90.7%) |
| 55 to 64 Years | 46 (100.0%) | 30 (73.2%) |
| 65 to 74 Years | 46 (79.3%) | 43 (95.6%) |
| 75 Years and over | 12 (100.0%) | 20 (74.1%) |
| Total | 275 (89.9%) | 244 (82.2%) |
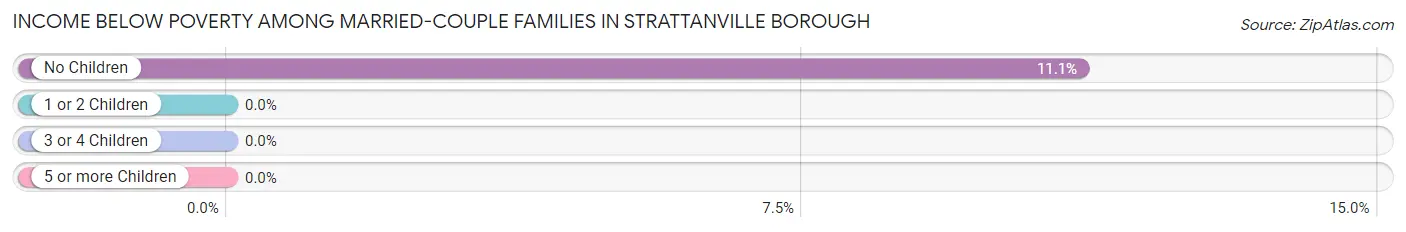
Income Below Poverty Among Married-Couple Families in Strattanville borough
The poverty statistics for married-couple families in Strattanville borough show that 8.9% or 11 of the total 123 families live below the poverty line. Families with no children have the highest poverty rate of 11.1%, comprising of 11 families. On the other hand, families with 1 or 2 children have the lowest poverty rate of 0.0%, which includes 0 families.
| Children | Above Poverty | Below Poverty |
| No Children | 88 (88.9%) | 11 (11.1%) |
| 1 or 2 Children | 20 (100.0%) | 0 (0.0%) |
| 3 or 4 Children | 4 (100.0%) | 0 (0.0%) |
| 5 or more Children | 0 (0.0%) | 0 (0.0%) |
| Total | 112 (91.1%) | 11 (8.9%) |
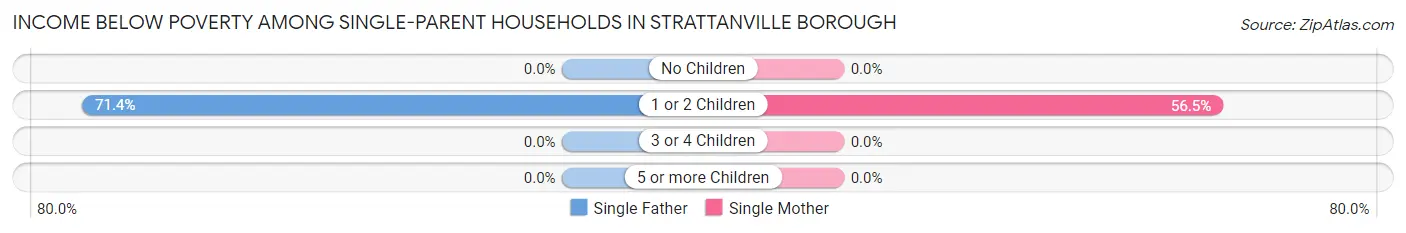
Income Below Poverty Among Single-Parent Households in Strattanville borough
According to the poverty data in Strattanville borough, 23.8% or 5 single-father households and 38.2% or 13 single-mother households are living below the poverty line. Among single-father households, those with 1 or 2 children have the highest poverty rate, with 5 households (71.4%) experiencing poverty. Likewise, among single-mother households, those with 1 or 2 children have the highest poverty rate, with 13 households (56.5%) falling below the poverty line.
| Children | Single Father | Single Mother |
| No Children | 0 (0.0%) | 0 (0.0%) |
| 1 or 2 Children | 5 (71.4%) | 13 (56.5%) |
| 3 or 4 Children | 0 (0.0%) | 0 (0.0%) |
| 5 or more Children | 0 (0.0%) | 0 (0.0%) |
| Total | 5 (23.8%) | 13 (38.2%) |
Income Below Poverty Among Married-Couple vs Single-Parent Households in Strattanville borough
The poverty data for Strattanville borough shows that 11 of the married-couple family households (8.9%) and 18 of the single-parent households (32.7%) are living below the poverty level. Within the married-couple family households, those with no children have the highest poverty rate, with 11 households (11.1%) falling below the poverty line. Among the single-parent households, those with 1 or 2 children have the highest poverty rate, with 18 household (60.0%) living below poverty.
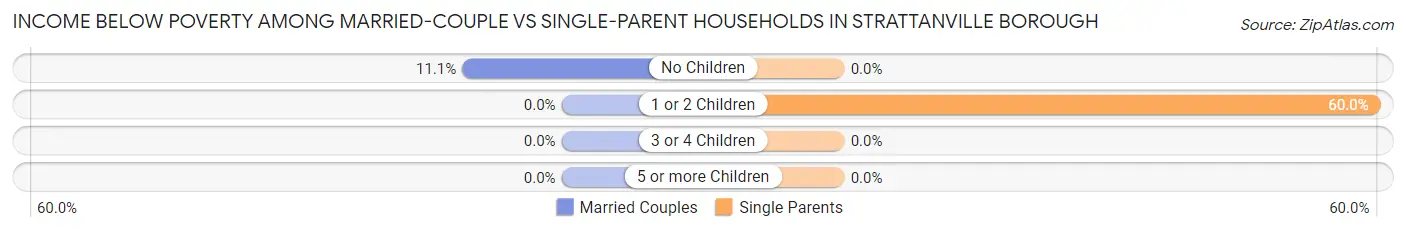
| Children | Married-Couple Families | Single-Parent Households |
| No Children | 11 (11.1%) | 0 (0.0%) |
| 1 or 2 Children | 0 (0.0%) | 18 (60.0%) |
| 3 or 4 Children | 0 (0.0%) | 0 (0.0%) |
| 5 or more Children | 0 (0.0%) | 0 (0.0%) |
| Total | 11 (8.9%) | 18 (32.7%) |
Race in Strattanville borough
The most populous races in Strattanville borough are White / Caucasian (597 | 98.7%), Two or more Races (6 | 1.0%), and Black / African American (2 | 0.3%).
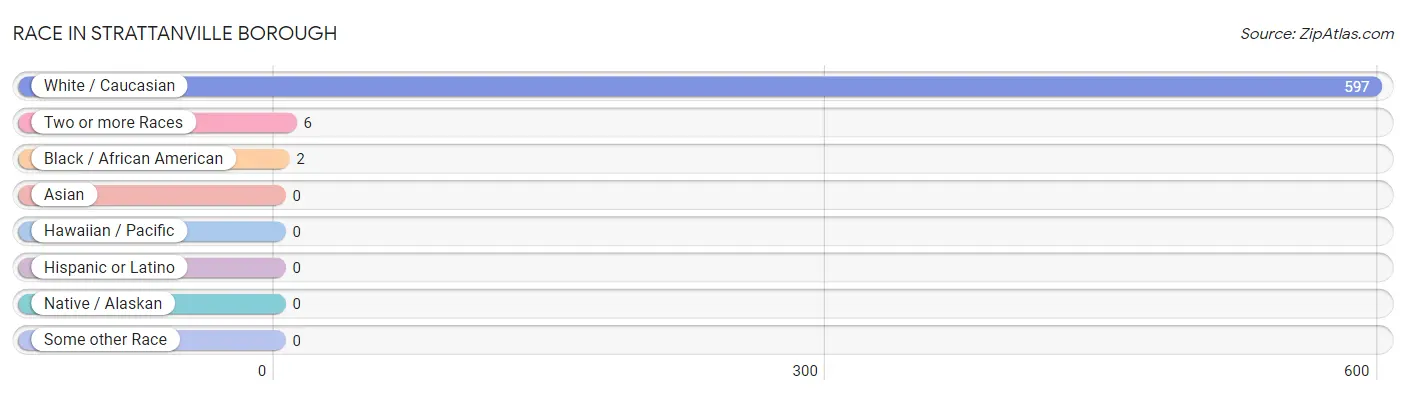
| Race | # Population | % Population |
| Asian | 0 | 0.0% |
| Black / African American | 2 | 0.3% |
| Hawaiian / Pacific | 0 | 0.0% |
| Hispanic or Latino | 0 | 0.0% |
| Native / Alaskan | 0 | 0.0% |
| White / Caucasian | 597 | 98.7% |
| Two or more Races | 6 | 1.0% |
| Some other Race | 0 | 0.0% |
| Total | 605 | 100.0% |
Ancestry in Strattanville borough
The most populous ancestries reported in Strattanville borough are German (196 | 32.4%), Irish (92 | 15.2%), English (62 | 10.2%), Italian (58 | 9.6%), and American (29 | 4.8%), together accounting for 72.2% of all Strattanville borough residents.
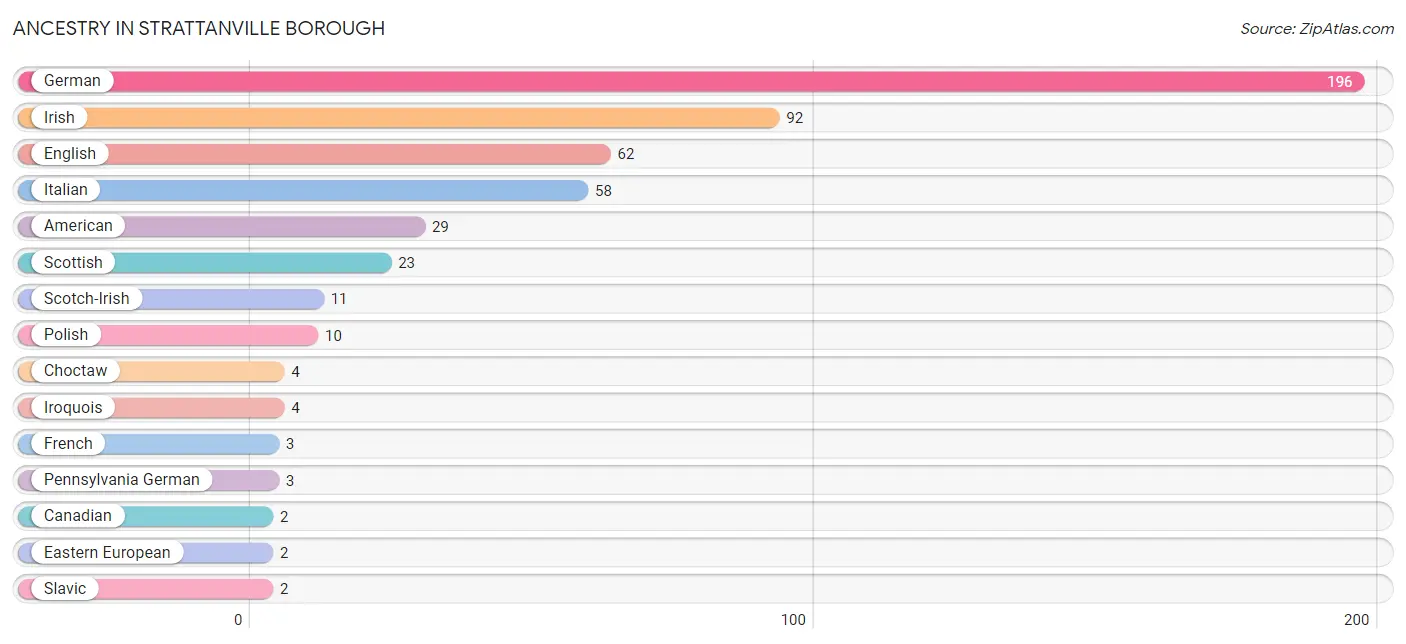
| Ancestry | # Population | % Population |
| African | 1 | 0.2% |
| American | 29 | 4.8% |
| Canadian | 2 | 0.3% |
| Choctaw | 4 | 0.7% |
| Czechoslovakian | 1 | 0.2% |
| Danish | 1 | 0.2% |
| Eastern European | 2 | 0.3% |
| English | 62 | 10.2% |
| French | 3 | 0.5% |
| German | 196 | 32.4% |
| Icelander | 1 | 0.2% |
| Irish | 92 | 15.2% |
| Iroquois | 4 | 0.7% |
| Italian | 58 | 9.6% |
| Pennsylvania German | 3 | 0.5% |
| Polish | 10 | 1.7% |
| Scotch-Irish | 11 | 1.8% |
| Scottish | 23 | 3.8% |
| Slavic | 2 | 0.3% |
| Subsaharan African | 1 | 0.2% | View All 20 Rows |
Immigrants in Strattanville borough

| Immigration Origin | # Population | % Population | View All 0 Rows |
Sex and Age in Strattanville borough
Sex and Age in Strattanville borough
The most populous age groups in Strattanville borough are 35 to 39 Years (38 | 12.4%) for men and 35 to 39 Years (42 | 14.1%) for women.
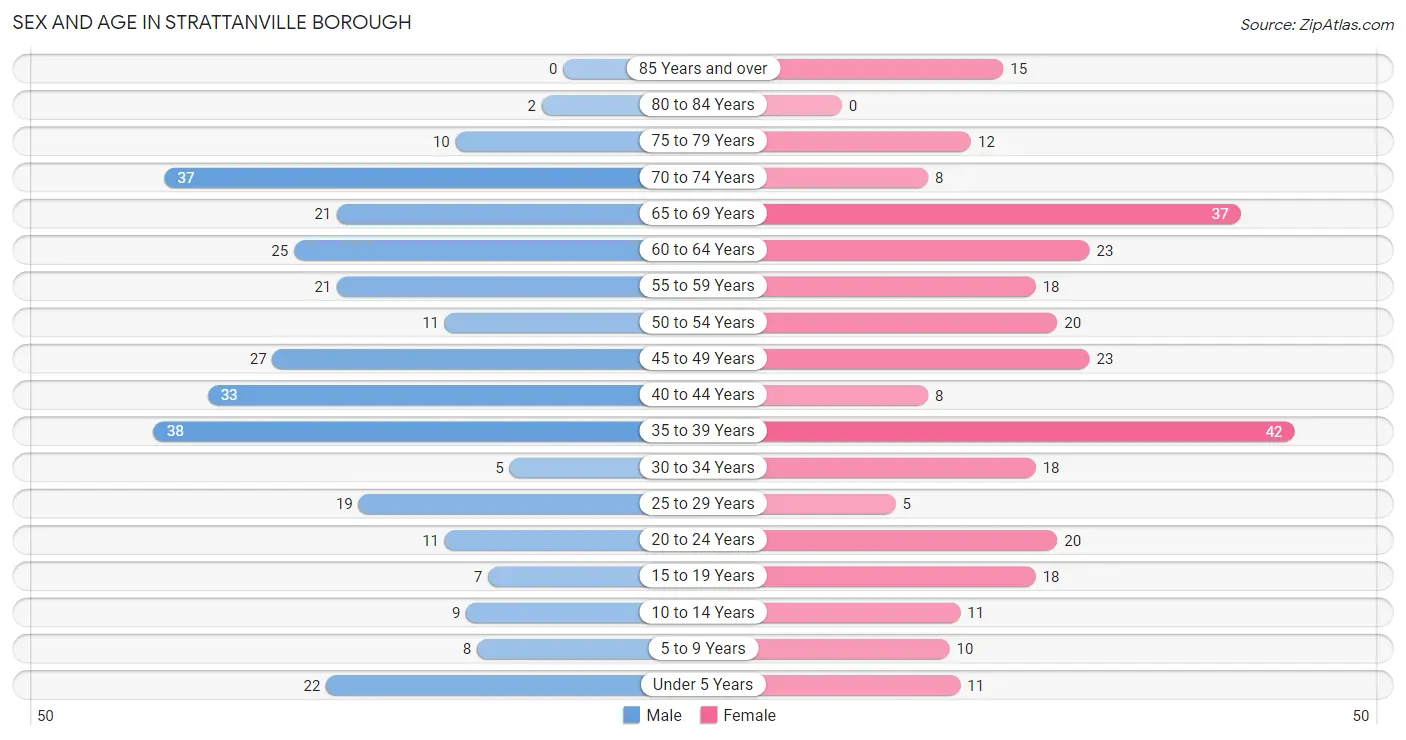
| Age Bracket | Male | Female |
| Under 5 Years | 22 (7.2%) | 11 (3.7%) |
| 5 to 9 Years | 8 (2.6%) | 10 (3.3%) |
| 10 to 14 Years | 9 (2.9%) | 11 (3.7%) |
| 15 to 19 Years | 7 (2.3%) | 18 (6.0%) |
| 20 to 24 Years | 11 (3.6%) | 20 (6.7%) |
| 25 to 29 Years | 19 (6.2%) | 5 (1.7%) |
| 30 to 34 Years | 5 (1.6%) | 18 (6.0%) |
| 35 to 39 Years | 38 (12.4%) | 42 (14.1%) |
| 40 to 44 Years | 33 (10.8%) | 8 (2.7%) |
| 45 to 49 Years | 27 (8.8%) | 23 (7.7%) |
| 50 to 54 Years | 11 (3.6%) | 20 (6.7%) |
| 55 to 59 Years | 21 (6.9%) | 18 (6.0%) |
| 60 to 64 Years | 25 (8.2%) | 23 (7.7%) |
| 65 to 69 Years | 21 (6.9%) | 37 (12.4%) |
| 70 to 74 Years | 37 (12.1%) | 8 (2.7%) |
| 75 to 79 Years | 10 (3.3%) | 12 (4.0%) |
| 80 to 84 Years | 2 (0.6%) | 0 (0.0%) |
| 85 Years and over | 0 (0.0%) | 15 (5.0%) |
| Total | 306 (100.0%) | 299 (100.0%) |
Families and Households in Strattanville borough
Median Family Size in Strattanville borough
The median family size in Strattanville borough is 2.49 persons per family, with married-couple families (123 | 69.1%) accounting for the largest median family size of 2.51 persons per family. On the other hand, single male/father families (21 | 11.8%) represent the smallest median family size with 2.43 persons per family.
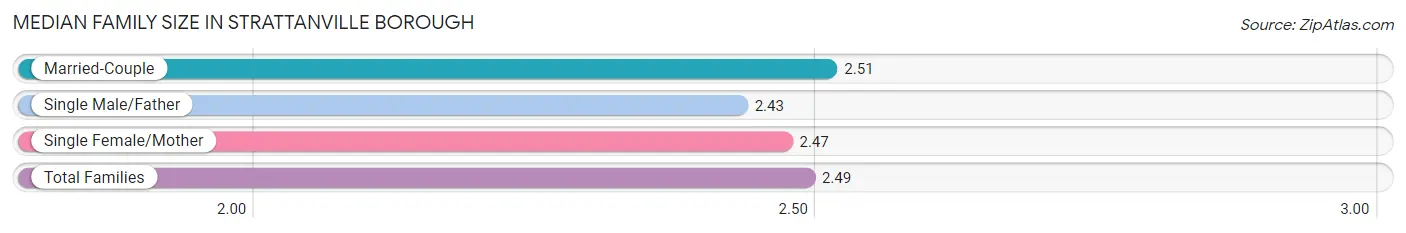
| Family Type | # Families | Family Size |
| Married-Couple | 123 (69.1%) | 2.51 |
| Single Male/Father | 21 (11.8%) | 2.43 |
| Single Female/Mother | 34 (19.1%) | 2.47 |
| Total Families | 178 (100.0%) | 2.49 |
Median Household Size in Strattanville borough
The median household size in Strattanville borough is 2.24 persons per household, with single female/mother households (34 | 12.7%) accounting for the largest median household size of 3.12 persons per household. non-family households (90 | 33.6%) represent the smallest median household size with 1.42 persons per household.
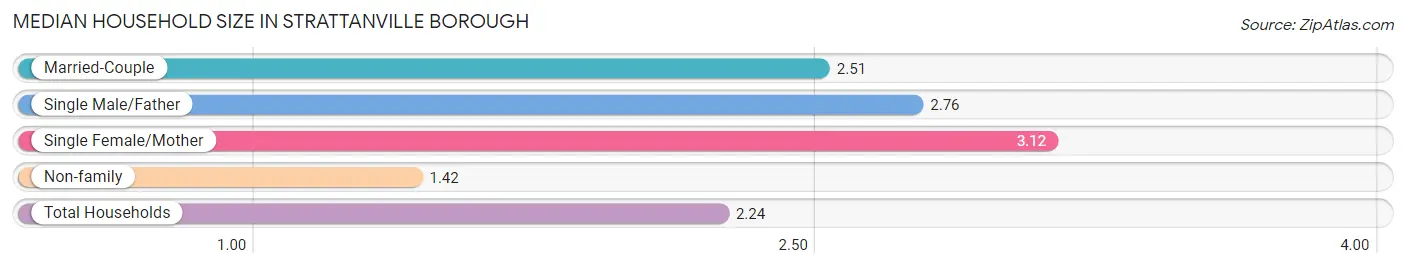
| Household Type | # Households | Household Size |
| Married-Couple | 123 (45.9%) | 2.51 |
| Single Male/Father | 21 (7.8%) | 2.76 |
| Single Female/Mother | 34 (12.7%) | 3.12 |
| Non-family | 90 (33.6%) | 1.42 |
| Total Households | 268 (100.0%) | 2.24 |
Household Size by Marriage Status in Strattanville borough
Out of a total of 268 households in Strattanville borough, 178 (66.4%) are family households, while 90 (33.6%) are nonfamily households. The most numerous type of family households are 2-person households, comprising 98, and the most common type of nonfamily households are 1-person households, comprising 60.
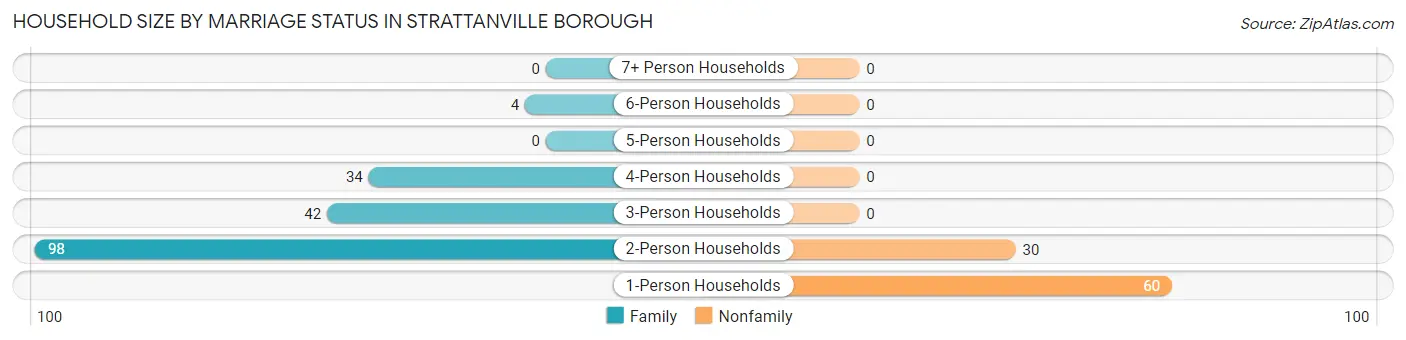
| Household Size | Family Households | Nonfamily Households |
| 1-Person Households | - | 60 (22.4%) |
| 2-Person Households | 98 (36.6%) | 30 (11.2%) |
| 3-Person Households | 42 (15.7%) | 0 (0.0%) |
| 4-Person Households | 34 (12.7%) | 0 (0.0%) |
| 5-Person Households | 0 (0.0%) | 0 (0.0%) |
| 6-Person Households | 4 (1.5%) | 0 (0.0%) |
| 7+ Person Households | 0 (0.0%) | 0 (0.0%) |
| Total | 178 (66.4%) | 90 (33.6%) |
Female Fertility in Strattanville borough
Fertility by Age in Strattanville borough
Average fertility rate in Strattanville borough is 45.0 births per 1,000 women. Women in the age bracket of 35 to 50 years have the highest fertility rate with 82.0 births per 1,000 women. Women in the age bracket of 35 to 50 years acount for 100.0% of all women with births.
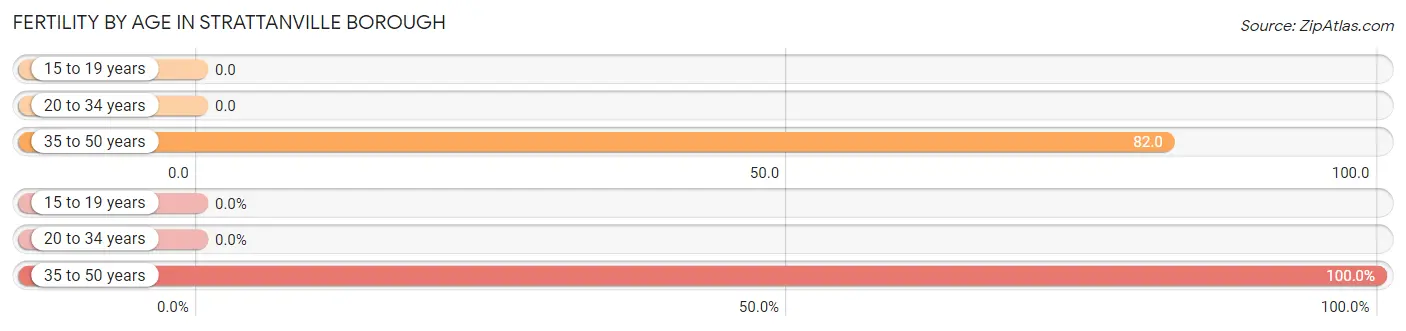
| Age Bracket | Women with Births | Births / 1,000 Women |
| 15 to 19 years | 0 (0.0%) | 0.0 |
| 20 to 34 years | 0 (0.0%) | 0.0 |
| 35 to 50 years | 6 (100.0%) | 82.0 |
| Total | 6 (100.0%) | 45.0 |
Fertility by Age by Marriage Status in Strattanville borough
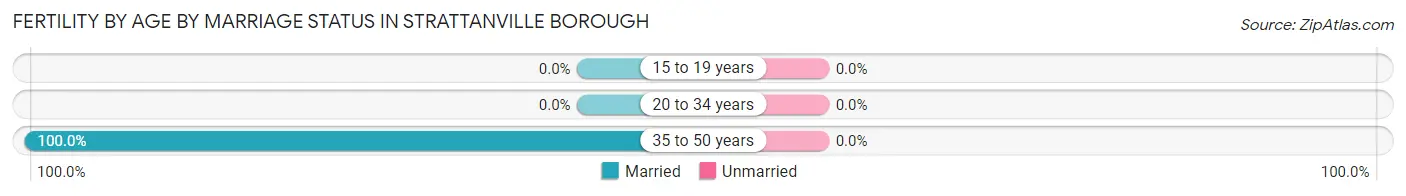
| Age Bracket | Married | Unmarried |
| 15 to 19 years | 0 (0.0%) | 0 (0.0%) |
| 20 to 34 years | 0 (0.0%) | 0 (0.0%) |
| 35 to 50 years | 6 (100.0%) | 0 (0.0%) |
| Total | 6 (100.0%) | 0 (0.0%) |
Fertility by Education in Strattanville borough
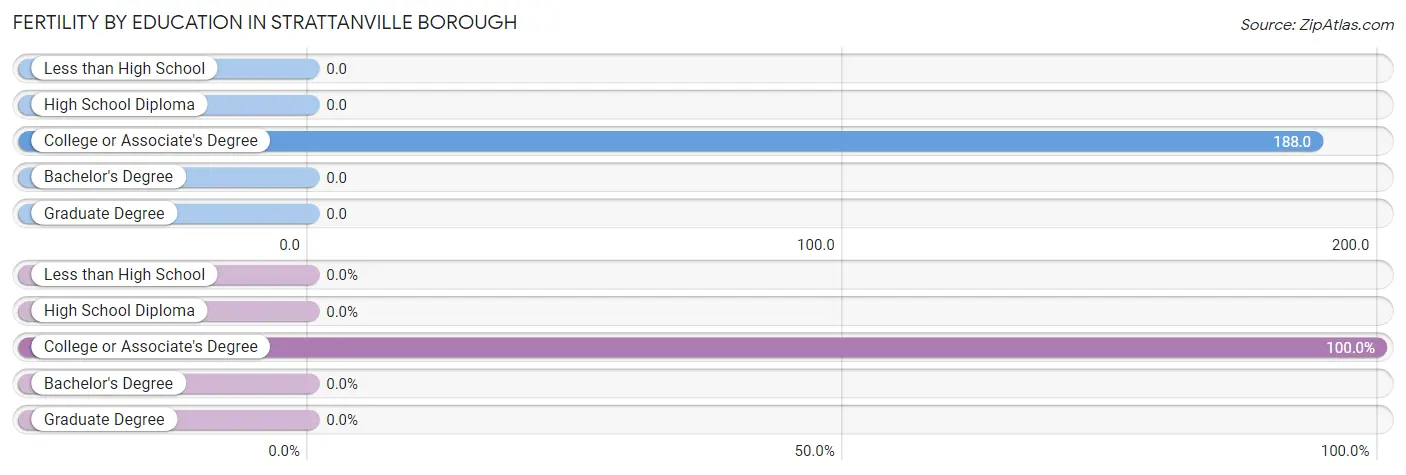
| Educational Attainment | Women with Births | Births / 1,000 Women |
| Less than High School | 0 (0.0%) | 0.0 |
| High School Diploma | 0 (0.0%) | 0.0 |
| College or Associate's Degree | 6 (100.0%) | 188.0 |
| Bachelor's Degree | 0 (0.0%) | 0.0 |
| Graduate Degree | 0 (0.0%) | 0.0 |
| Total | 6 (100.0%) | 45.0 |
Fertility by Education by Marriage Status in Strattanville borough
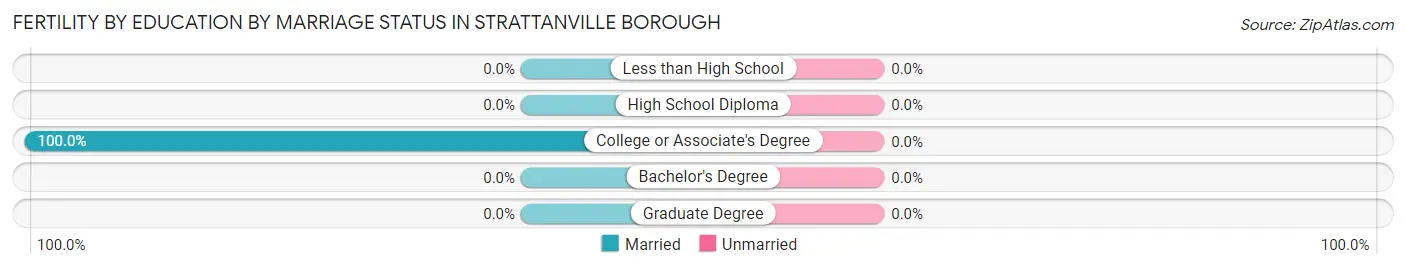
| Educational Attainment | Married | Unmarried |
| Less than High School | 0 (0.0%) | 0 (0.0%) |
| High School Diploma | 0 (0.0%) | 0 (0.0%) |
| College or Associate's Degree | 6 (100.0%) | 0 (0.0%) |
| Bachelor's Degree | 0 (0.0%) | 0 (0.0%) |
| Graduate Degree | 0 (0.0%) | 0 (0.0%) |
| Total | 6 (100.0%) | 0 (0.0%) |
Employment Characteristics in Strattanville borough
Employment by Class of Employer in Strattanville borough
Among the 332 employed individuals in Strattanville borough, private company employees (257 | 77.4%), not-for-profit organizations (32 | 9.6%), and state government employees (13 | 3.9%) make up the most common classes of employment.
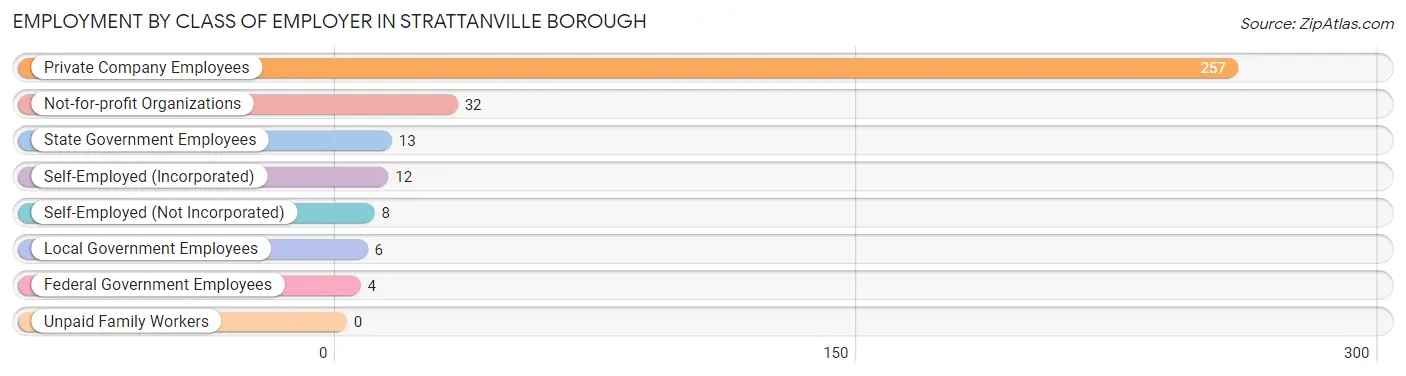
| Employer Class | # Employees | % Employees |
| Private Company Employees | 257 | 77.4% |
| Self-Employed (Incorporated) | 12 | 3.6% |
| Self-Employed (Not Incorporated) | 8 | 2.4% |
| Not-for-profit Organizations | 32 | 9.6% |
| Local Government Employees | 6 | 1.8% |
| State Government Employees | 13 | 3.9% |
| Federal Government Employees | 4 | 1.2% |
| Unpaid Family Workers | 0 | 0.0% |
| Total | 332 | 100.0% |
Employment Status by Age in Strattanville borough
According to the labor force statistics for Strattanville borough, out of the total population over 16 years of age (525), 64.0% or 336 individuals are in the labor force, with 1.2% or 4 of them unemployed. The age group with the highest labor force participation rate is 35 to 44 years, with 100.0% or 121 individuals in the labor force. Within the labor force, the 65 to 74 years age range has the highest percentage of unemployed individuals, with 10.5% or 2 of them being unemployed.
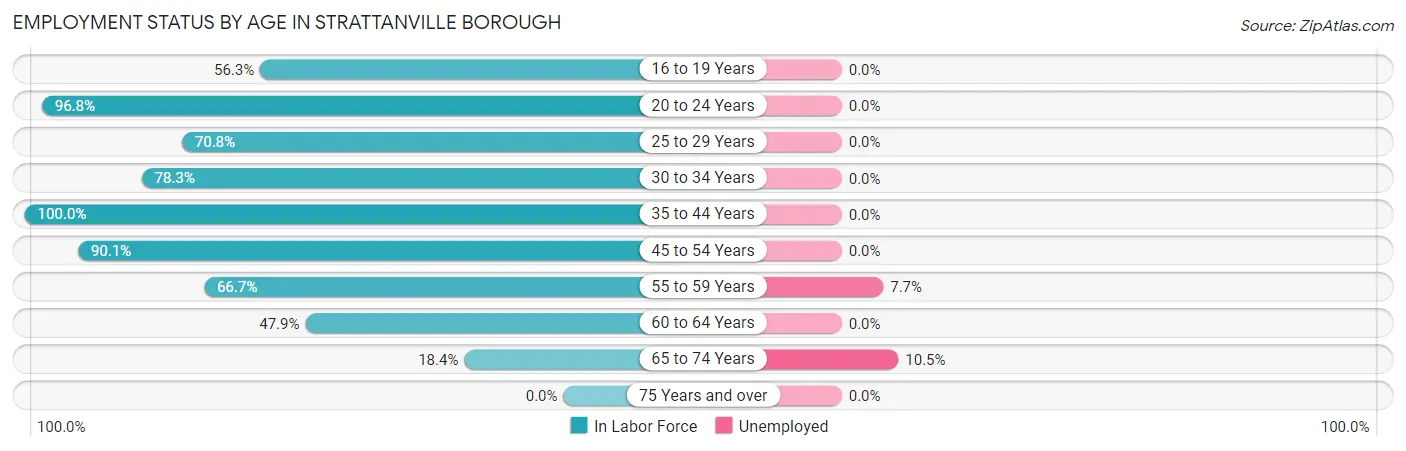
| Age Bracket | In Labor Force | Unemployed |
| 16 to 19 Years | 9 (56.3%) | 0 (0.0%) |
| 20 to 24 Years | 30 (96.8%) | 0 (0.0%) |
| 25 to 29 Years | 17 (70.8%) | 0 (0.0%) |
| 30 to 34 Years | 18 (78.3%) | 0 (0.0%) |
| 35 to 44 Years | 121 (100.0%) | 0 (0.0%) |
| 45 to 54 Years | 73 (90.1%) | 0 (0.0%) |
| 55 to 59 Years | 26 (66.7%) | 2 (7.7%) |
| 60 to 64 Years | 23 (47.9%) | 0 (0.0%) |
| 65 to 74 Years | 19 (18.4%) | 2 (10.5%) |
| 75 Years and over | 0 (0.0%) | 0 (0.0%) |
| Total | 336 (64.0%) | 4 (1.2%) |
Employment Status by Educational Attainment in Strattanville borough
According to labor force statistics for Strattanville borough, 82.7% of individuals (278) out of the total population between 25 and 64 years of age (336) are in the labor force, with 0.7% or 2 of them being unemployed. The group with the highest labor force participation rate are those with the educational attainment of college / associate degree, with 94.4% or 67 individuals in the labor force. Within the labor force, individuals with bachelor's degree or higher education have the highest percentage of unemployment, with 3.8% or 2 of them being unemployed.
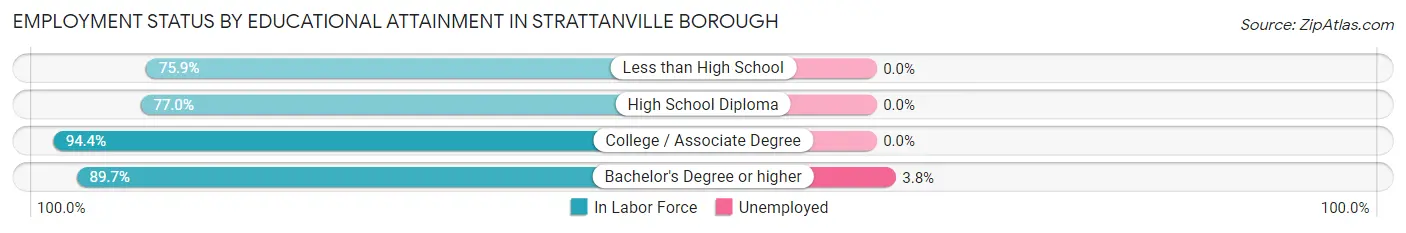
| Educational Attainment | In Labor Force | Unemployed |
| Less than High School | 22 (75.9%) | 0 (0.0%) |
| High School Diploma | 137 (77.0%) | 0 (0.0%) |
| College / Associate Degree | 67 (94.4%) | 0 (0.0%) |
| Bachelor's Degree or higher | 52 (89.7%) | 2 (3.8%) |
| Total | 278 (82.7%) | 2 (0.7%) |
Employment Occupations by Sex in Strattanville borough
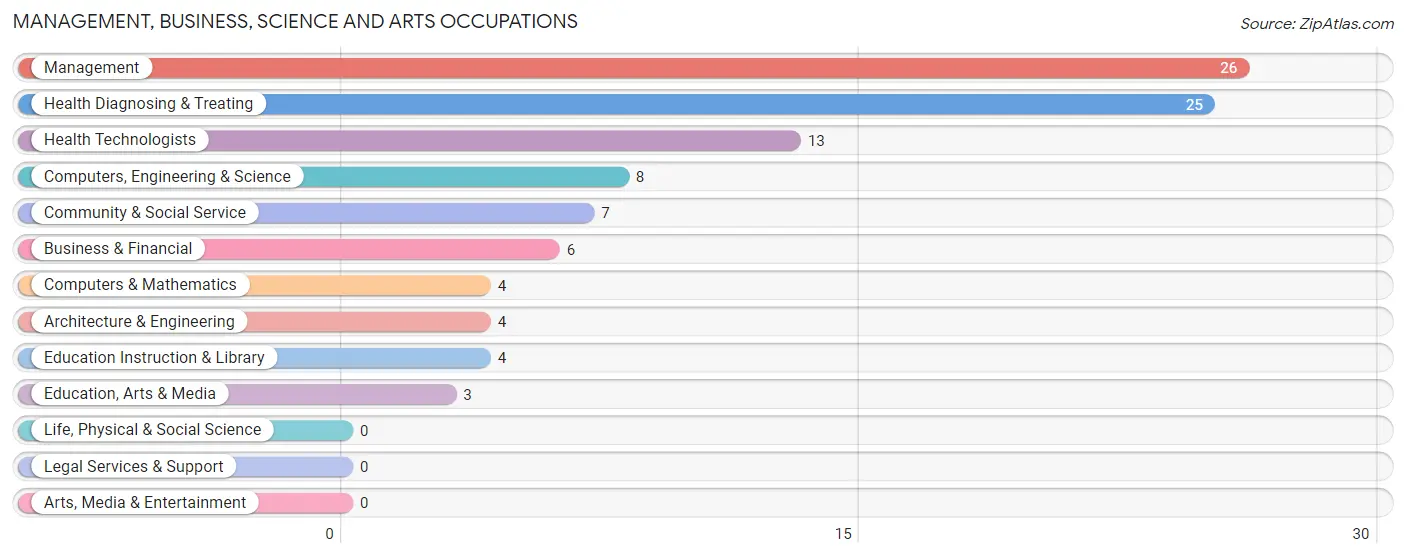
Management, Business, Science and Arts Occupations
The most common Management, Business, Science and Arts occupations in Strattanville borough are Management (26 | 7.8%), Health Diagnosing & Treating (25 | 7.5%), Health Technologists (13 | 3.9%), Computers, Engineering & Science (8 | 2.4%), and Community & Social Service (7 | 2.1%).
Management, Business, Science and Arts Occupations by Sex
Within the Management, Business, Science and Arts occupations in Strattanville borough, the most male-oriented occupations are Business & Financial (66.7%), Management (65.4%), and Computers & Mathematics (50.0%), while the most female-oriented occupations are Architecture & Engineering (100.0%), Education, Arts & Media (100.0%), and Health Diagnosing & Treating (100.0%).
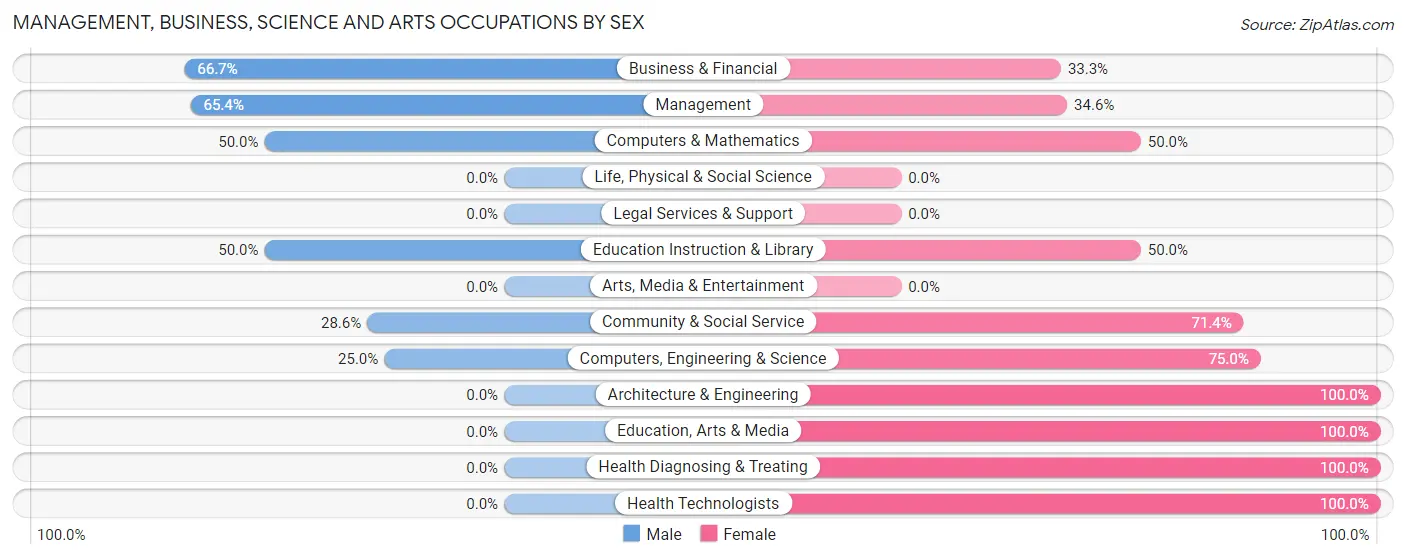
| Occupation | Male | Female |
| Management | 17 (65.4%) | 9 (34.6%) |
| Business & Financial | 4 (66.7%) | 2 (33.3%) |
| Computers, Engineering & Science | 2 (25.0%) | 6 (75.0%) |
| Computers & Mathematics | 2 (50.0%) | 2 (50.0%) |
| Architecture & Engineering | 0 (0.0%) | 4 (100.0%) |
| Life, Physical & Social Science | 0 (0.0%) | 0 (0.0%) |
| Community & Social Service | 2 (28.6%) | 5 (71.4%) |
| Education, Arts & Media | 0 (0.0%) | 3 (100.0%) |
| Legal Services & Support | 0 (0.0%) | 0 (0.0%) |
| Education Instruction & Library | 2 (50.0%) | 2 (50.0%) |
| Arts, Media & Entertainment | 0 (0.0%) | 0 (0.0%) |
| Health Diagnosing & Treating | 0 (0.0%) | 25 (100.0%) |
| Health Technologists | 0 (0.0%) | 13 (100.0%) |
| Total (Category) | 25 (34.7%) | 47 (65.3%) |
| Total (Overall) | 169 (50.9%) | 163 (49.1%) |
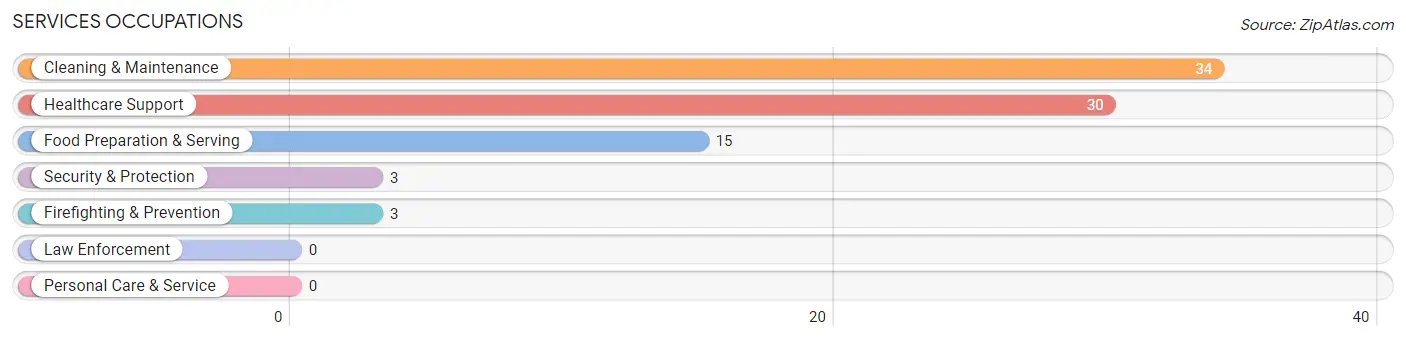
Services Occupations
The most common Services occupations in Strattanville borough are Cleaning & Maintenance (34 | 10.2%), Healthcare Support (30 | 9.0%), Food Preparation & Serving (15 | 4.5%), Security & Protection (3 | 0.9%), and Firefighting & Prevention (3 | 0.9%).
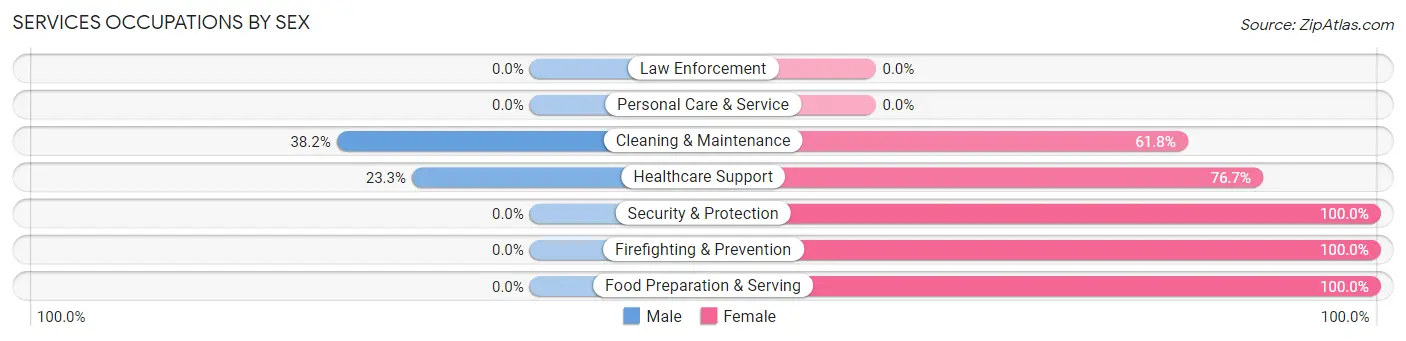
Services Occupations by Sex
Within the Services occupations in Strattanville borough, the most male-oriented occupations are Cleaning & Maintenance (38.2%), and Healthcare Support (23.3%), while the most female-oriented occupations are Security & Protection (100.0%), Firefighting & Prevention (100.0%), and Food Preparation & Serving (100.0%).
| Occupation | Male | Female |
| Healthcare Support | 7 (23.3%) | 23 (76.7%) |
| Security & Protection | 0 (0.0%) | 3 (100.0%) |
| Firefighting & Prevention | 0 (0.0%) | 3 (100.0%) |
| Law Enforcement | 0 (0.0%) | 0 (0.0%) |
| Food Preparation & Serving | 0 (0.0%) | 15 (100.0%) |
| Cleaning & Maintenance | 13 (38.2%) | 21 (61.8%) |
| Personal Care & Service | 0 (0.0%) | 0 (0.0%) |
| Total (Category) | 20 (24.4%) | 62 (75.6%) |
| Total (Overall) | 169 (50.9%) | 163 (49.1%) |
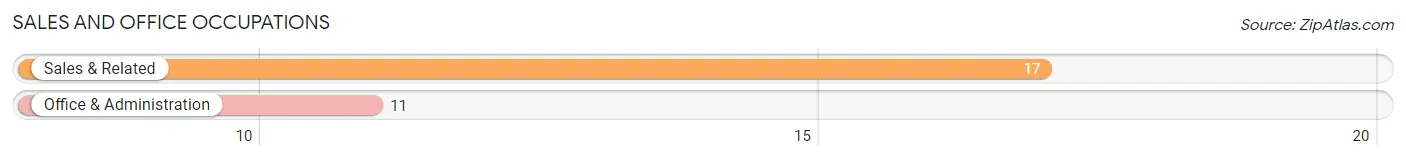
Sales and Office Occupations
The most common Sales and Office occupations in Strattanville borough are Sales & Related (17 | 5.1%), and Office & Administration (11 | 3.3%).
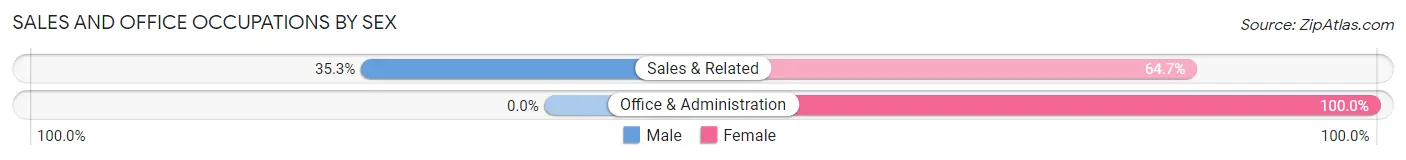
Sales and Office Occupations by Sex
| Occupation | Male | Female |
| Sales & Related | 6 (35.3%) | 11 (64.7%) |
| Office & Administration | 0 (0.0%) | 11 (100.0%) |
| Total (Category) | 6 (21.4%) | 22 (78.6%) |
| Total (Overall) | 169 (50.9%) | 163 (49.1%) |
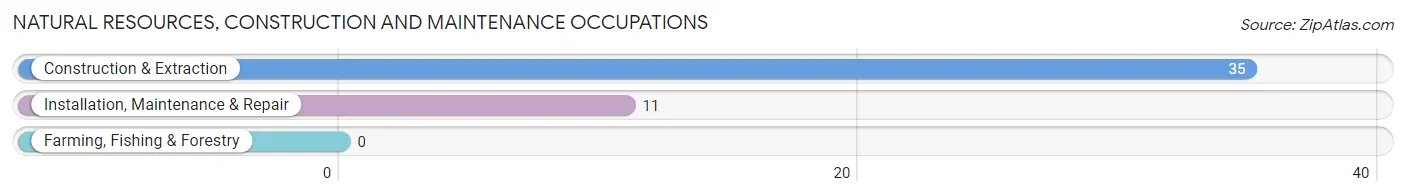
Natural Resources, Construction and Maintenance Occupations
The most common Natural Resources, Construction and Maintenance occupations in Strattanville borough are Construction & Extraction (35 | 10.5%), and Installation, Maintenance & Repair (11 | 3.3%).
Natural Resources, Construction and Maintenance Occupations by Sex
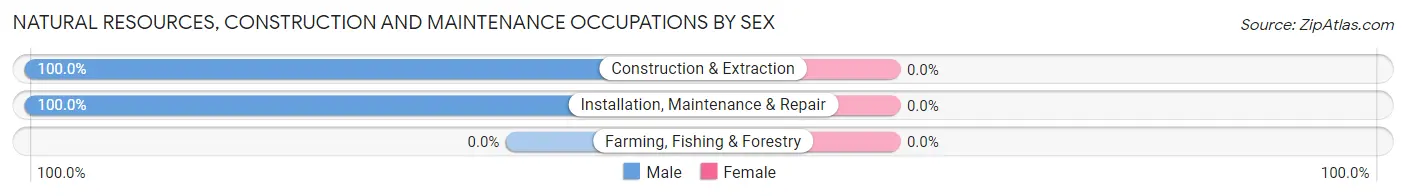
| Occupation | Male | Female |
| Farming, Fishing & Forestry | 0 (0.0%) | 0 (0.0%) |
| Construction & Extraction | 35 (100.0%) | 0 (0.0%) |
| Installation, Maintenance & Repair | 11 (100.0%) | 0 (0.0%) |
| Total (Category) | 46 (100.0%) | 0 (0.0%) |
| Total (Overall) | 169 (50.9%) | 163 (49.1%) |
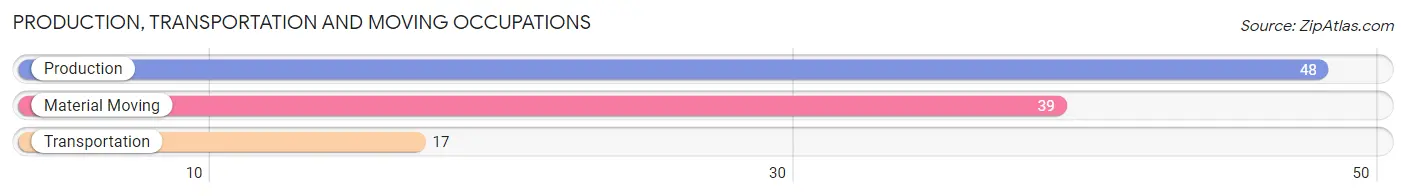
Production, Transportation and Moving Occupations
The most common Production, Transportation and Moving occupations in Strattanville borough are Production (48 | 14.5%), Material Moving (39 | 11.7%), and Transportation (17 | 5.1%).
Production, Transportation and Moving Occupations by Sex
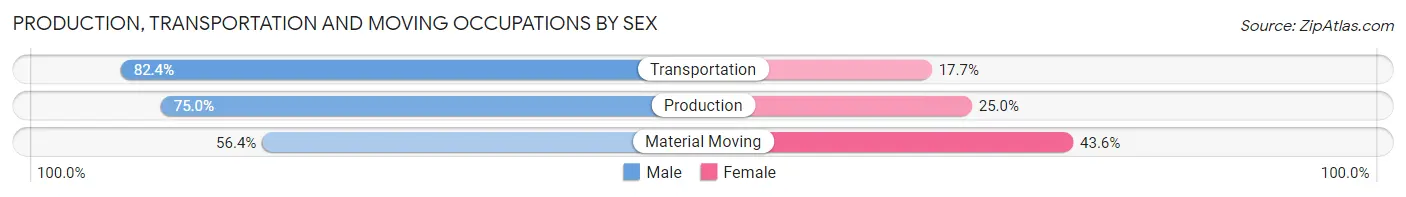
| Occupation | Male | Female |
| Production | 36 (75.0%) | 12 (25.0%) |
| Transportation | 14 (82.4%) | 3 (17.6%) |
| Material Moving | 22 (56.4%) | 17 (43.6%) |
| Total (Category) | 72 (69.2%) | 32 (30.8%) |
| Total (Overall) | 169 (50.9%) | 163 (49.1%) |
Employment Industries by Sex in Strattanville borough
Employment Industries in Strattanville borough
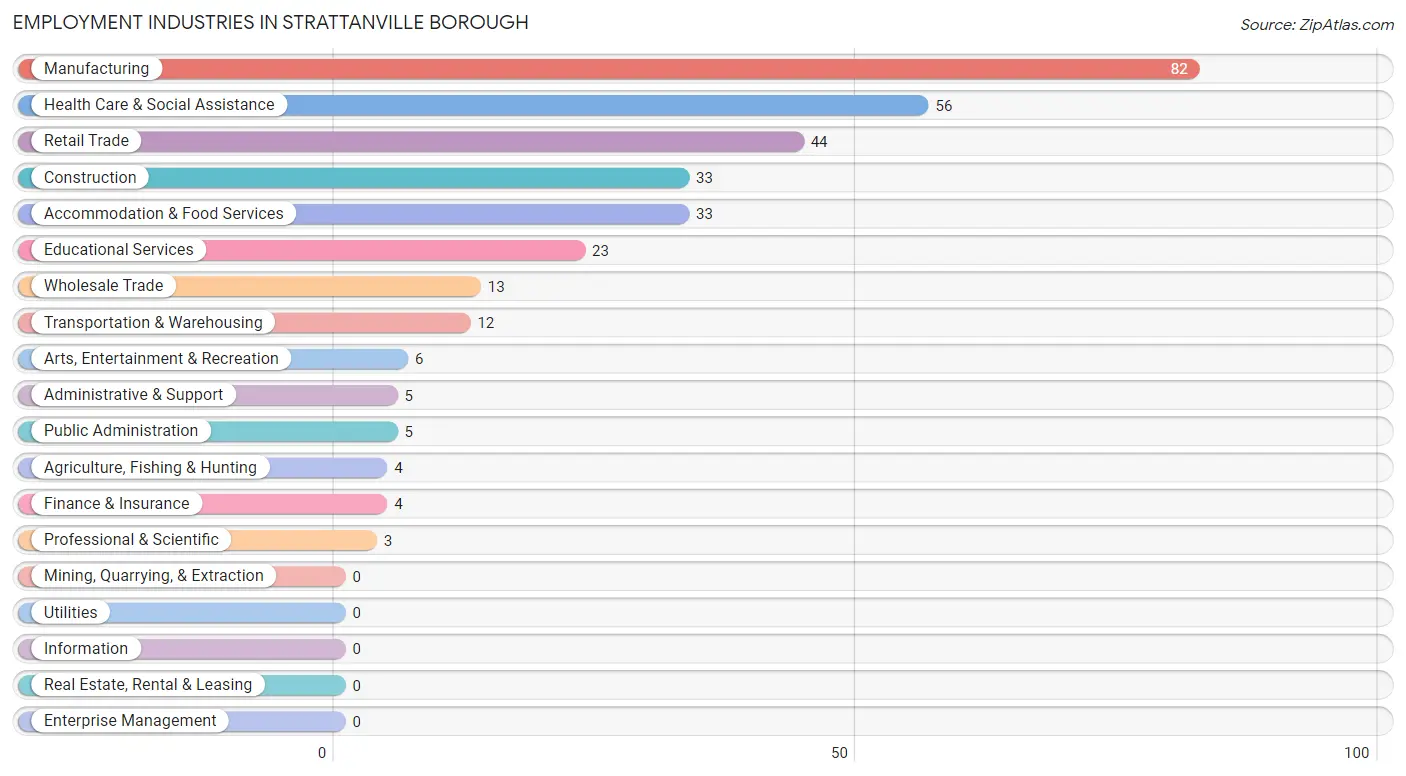
The major employment industries in Strattanville borough include Manufacturing (82 | 24.7%), Health Care & Social Assistance (56 | 16.9%), Retail Trade (44 | 13.3%), Construction (33 | 9.9%), and Accommodation & Food Services (33 | 9.9%).
Employment Industries by Sex in Strattanville borough
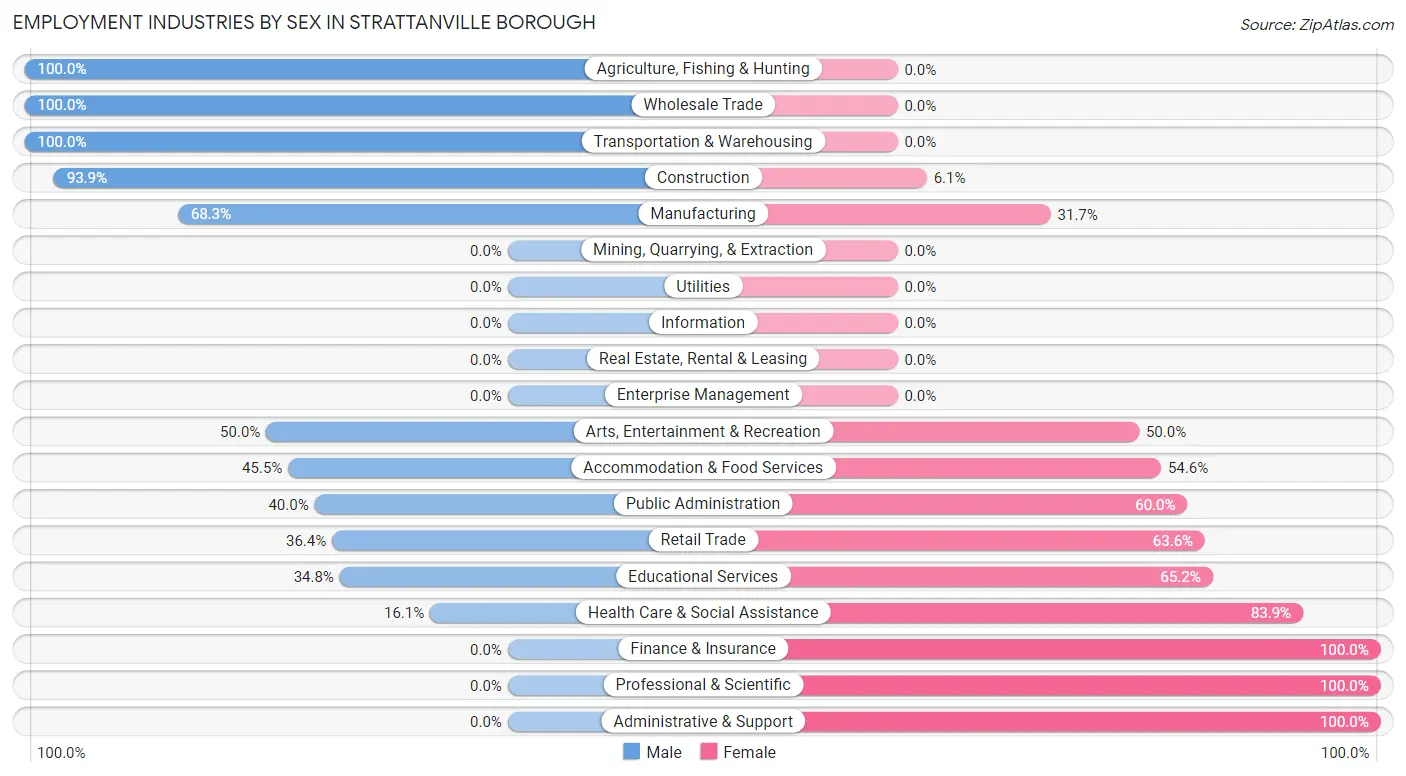
The Strattanville borough industries that see more men than women are Agriculture, Fishing & Hunting (100.0%), Wholesale Trade (100.0%), and Transportation & Warehousing (100.0%), whereas the industries that tend to have a higher number of women are Finance & Insurance (100.0%), Professional & Scientific (100.0%), and Administrative & Support (100.0%).
| Industry | Male | Female |
| Agriculture, Fishing & Hunting | 4 (100.0%) | 0 (0.0%) |
| Mining, Quarrying, & Extraction | 0 (0.0%) | 0 (0.0%) |
| Construction | 31 (93.9%) | 2 (6.1%) |
| Manufacturing | 56 (68.3%) | 26 (31.7%) |
| Wholesale Trade | 13 (100.0%) | 0 (0.0%) |
| Retail Trade | 16 (36.4%) | 28 (63.6%) |
| Transportation & Warehousing | 12 (100.0%) | 0 (0.0%) |
| Utilities | 0 (0.0%) | 0 (0.0%) |
| Information | 0 (0.0%) | 0 (0.0%) |
| Finance & Insurance | 0 (0.0%) | 4 (100.0%) |
| Real Estate, Rental & Leasing | 0 (0.0%) | 0 (0.0%) |
| Professional & Scientific | 0 (0.0%) | 3 (100.0%) |
| Enterprise Management | 0 (0.0%) | 0 (0.0%) |
| Administrative & Support | 0 (0.0%) | 5 (100.0%) |
| Educational Services | 8 (34.8%) | 15 (65.2%) |
| Health Care & Social Assistance | 9 (16.1%) | 47 (83.9%) |
| Arts, Entertainment & Recreation | 3 (50.0%) | 3 (50.0%) |
| Accommodation & Food Services | 15 (45.5%) | 18 (54.5%) |
| Public Administration | 2 (40.0%) | 3 (60.0%) |
| Total | 169 (50.9%) | 163 (49.1%) |
Education in Strattanville borough
School Enrollment in Strattanville borough
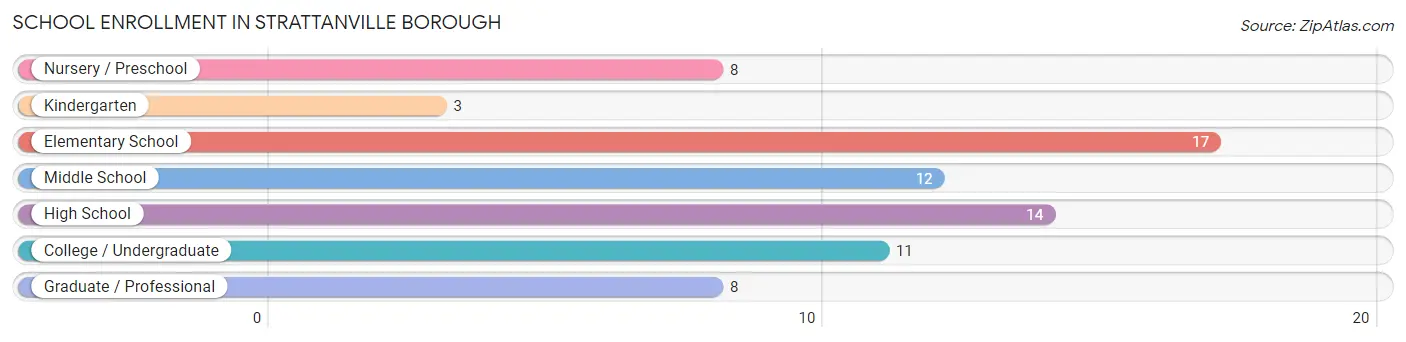
The most common levels of schooling among the 73 students in Strattanville borough are elementary school (17 | 23.3%), high school (14 | 19.2%), and middle school (12 | 16.4%).
| School Level | # Students | % Students |
| Nursery / Preschool | 8 | 11.0% |
| Kindergarten | 3 | 4.1% |
| Elementary School | 17 | 23.3% |
| Middle School | 12 | 16.4% |
| High School | 14 | 19.2% |
| College / Undergraduate | 11 | 15.1% |
| Graduate / Professional | 8 | 11.0% |
| Total | 73 | 100.0% |
School Enrollment by Age by Funding Source in Strattanville borough
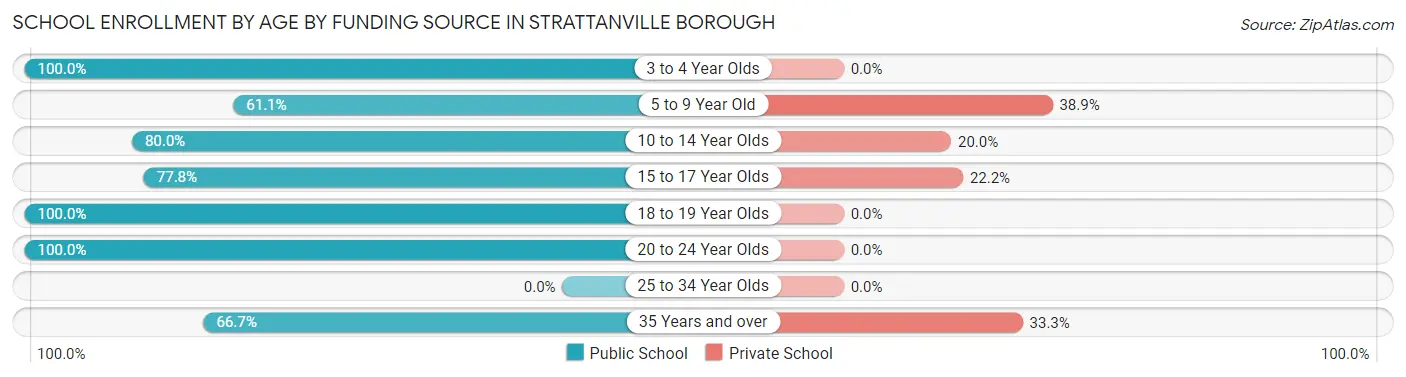
Out of a total of 73 students who are enrolled in schools in Strattanville borough, 17 (23.3%) attend a private institution, while the remaining 56 (76.7%) are enrolled in public schools. The age group of 5 to 9 year old has the highest likelihood of being enrolled in private schools, with 7 (38.9% in the age bracket) enrolled. Conversely, the age group of 3 to 4 year olds has the lowest likelihood of being enrolled in a private school, with 2 (100.0% in the age bracket) attending a public institution.
| Age Bracket | Public School | Private School |
| 3 to 4 Year Olds | 2 (100.0%) | 0 (0.0%) |
| 5 to 9 Year Old | 11 (61.1%) | 7 (38.9%) |
| 10 to 14 Year Olds | 16 (80.0%) | 4 (20.0%) |
| 15 to 17 Year Olds | 14 (77.8%) | 4 (22.2%) |
| 18 to 19 Year Olds | 5 (100.0%) | 0 (0.0%) |
| 20 to 24 Year Olds | 4 (100.0%) | 0 (0.0%) |
| 25 to 34 Year Olds | 0 (0.0%) | 0 (0.0%) |
| 35 Years and over | 4 (66.7%) | 2 (33.3%) |
| Total | 56 (76.7%) | 17 (23.3%) |
Educational Attainment by Field of Study in Strattanville borough
Education (53 | 46.1%), business (41 | 35.6%), visual & performing arts (6 | 5.2%), bio, nature & agricultural (5 | 4.3%), and psychology (4 | 3.5%) are the most common fields of study among 115 individuals in Strattanville borough who have obtained a bachelor's degree or higher.
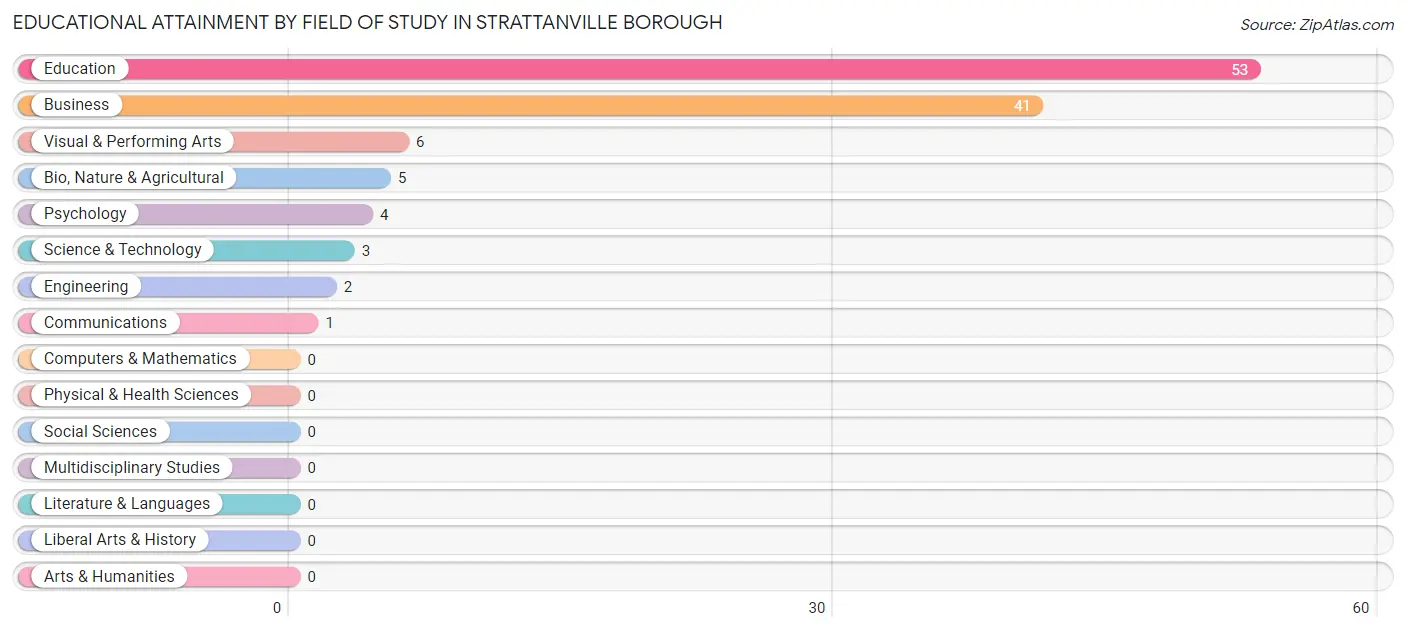
| Field of Study | # Graduates | % Graduates |
| Computers & Mathematics | 0 | 0.0% |
| Bio, Nature & Agricultural | 5 | 4.3% |
| Physical & Health Sciences | 0 | 0.0% |
| Psychology | 4 | 3.5% |
| Social Sciences | 0 | 0.0% |
| Engineering | 2 | 1.7% |
| Multidisciplinary Studies | 0 | 0.0% |
| Science & Technology | 3 | 2.6% |
| Business | 41 | 35.6% |
| Education | 53 | 46.1% |
| Literature & Languages | 0 | 0.0% |
| Liberal Arts & History | 0 | 0.0% |
| Visual & Performing Arts | 6 | 5.2% |
| Communications | 1 | 0.9% |
| Arts & Humanities | 0 | 0.0% |
| Total | 115 | 100.0% |
Transportation & Commute in Strattanville borough
Vehicle Availability by Sex in Strattanville borough
The most prevalent vehicle ownership categories in Strattanville borough are males with 2 vehicles (96, accounting for 57.1%) and females with 2 vehicles (77, making up 58.9%).
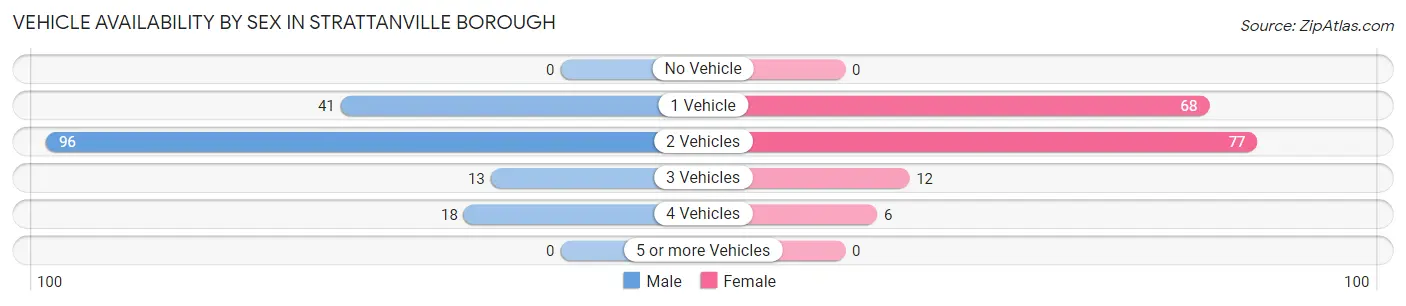
| Vehicles Available | Male | Female |
| No Vehicle | 0 (0.0%) | 0 (0.0%) |
| 1 Vehicle | 41 (24.4%) | 68 (41.7%) |
| 2 Vehicles | 96 (57.1%) | 77 (47.2%) |
| 3 Vehicles | 13 (7.7%) | 12 (7.4%) |
| 4 Vehicles | 18 (10.7%) | 6 (3.7%) |
| 5 or more Vehicles | 0 (0.0%) | 0 (0.0%) |
| Total | 168 (100.0%) | 163 (100.0%) |
Commute Time in Strattanville borough
The most frequently occuring commute durations in Strattanville borough are 5 to 9 minutes (80 commuters, 24.5%), 10 to 14 minutes (72 commuters, 22.0%), and 15 to 19 minutes (52 commuters, 15.9%).
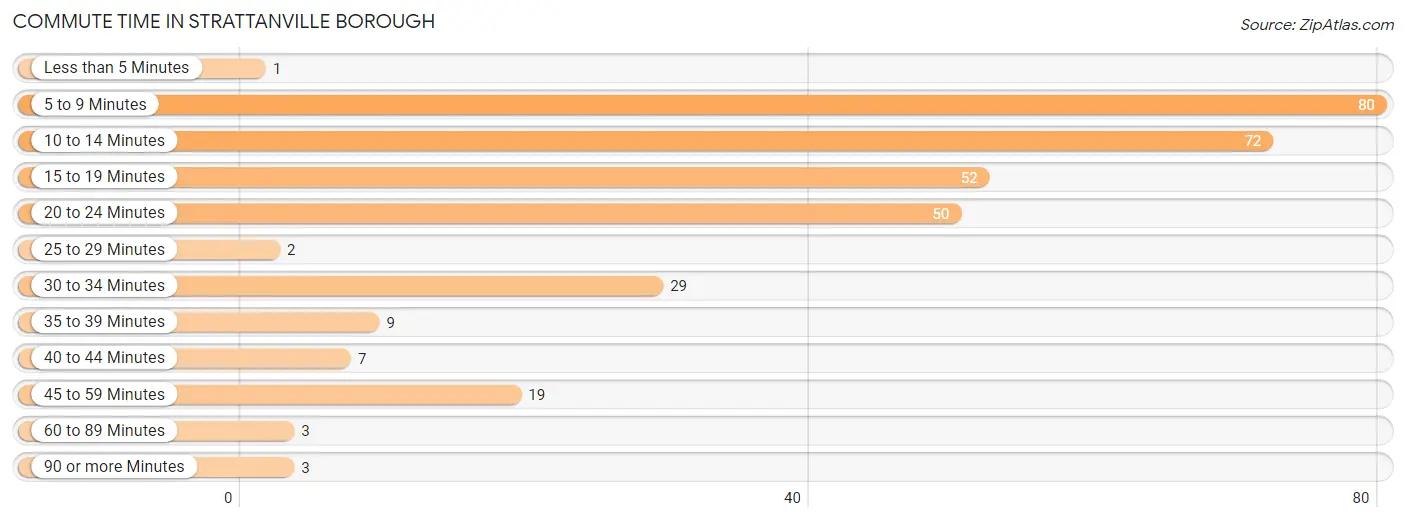
| Commute Time | # Commuters | % Commuters |
| Less than 5 Minutes | 1 | 0.3% |
| 5 to 9 Minutes | 80 | 24.5% |
| 10 to 14 Minutes | 72 | 22.0% |
| 15 to 19 Minutes | 52 | 15.9% |
| 20 to 24 Minutes | 50 | 15.3% |
| 25 to 29 Minutes | 2 | 0.6% |
| 30 to 34 Minutes | 29 | 8.9% |
| 35 to 39 Minutes | 9 | 2.8% |
| 40 to 44 Minutes | 7 | 2.1% |
| 45 to 59 Minutes | 19 | 5.8% |
| 60 to 89 Minutes | 3 | 0.9% |
| 90 or more Minutes | 3 | 0.9% |
Commute Time by Sex in Strattanville borough
The most common commute times in Strattanville borough are 10 to 14 minutes (40 commuters, 24.1%) for males and 5 to 9 minutes (57 commuters, 35.4%) for females.
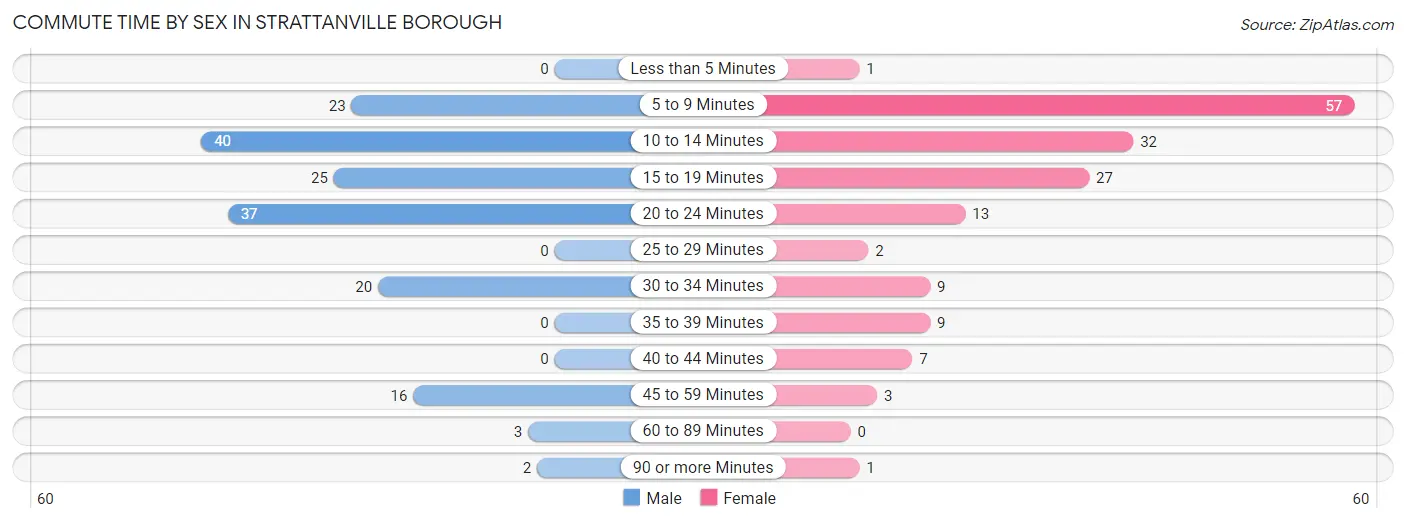
| Commute Time | Male | Female |
| Less than 5 Minutes | 0 (0.0%) | 1 (0.6%) |
| 5 to 9 Minutes | 23 (13.9%) | 57 (35.4%) |
| 10 to 14 Minutes | 40 (24.1%) | 32 (19.9%) |
| 15 to 19 Minutes | 25 (15.1%) | 27 (16.8%) |
| 20 to 24 Minutes | 37 (22.3%) | 13 (8.1%) |
| 25 to 29 Minutes | 0 (0.0%) | 2 (1.2%) |
| 30 to 34 Minutes | 20 (12.0%) | 9 (5.6%) |
| 35 to 39 Minutes | 0 (0.0%) | 9 (5.6%) |
| 40 to 44 Minutes | 0 (0.0%) | 7 (4.3%) |
| 45 to 59 Minutes | 16 (9.6%) | 3 (1.9%) |
| 60 to 89 Minutes | 3 (1.8%) | 0 (0.0%) |
| 90 or more Minutes | 2 (1.2%) | 1 (0.6%) |
Time of Departure to Work by Sex in Strattanville borough
The most frequent times of departure to work in Strattanville borough are 5:00 AM to 5:29 AM (31, 18.7%) for males and 7:30 AM to 7:59 AM (34, 21.1%) for females.
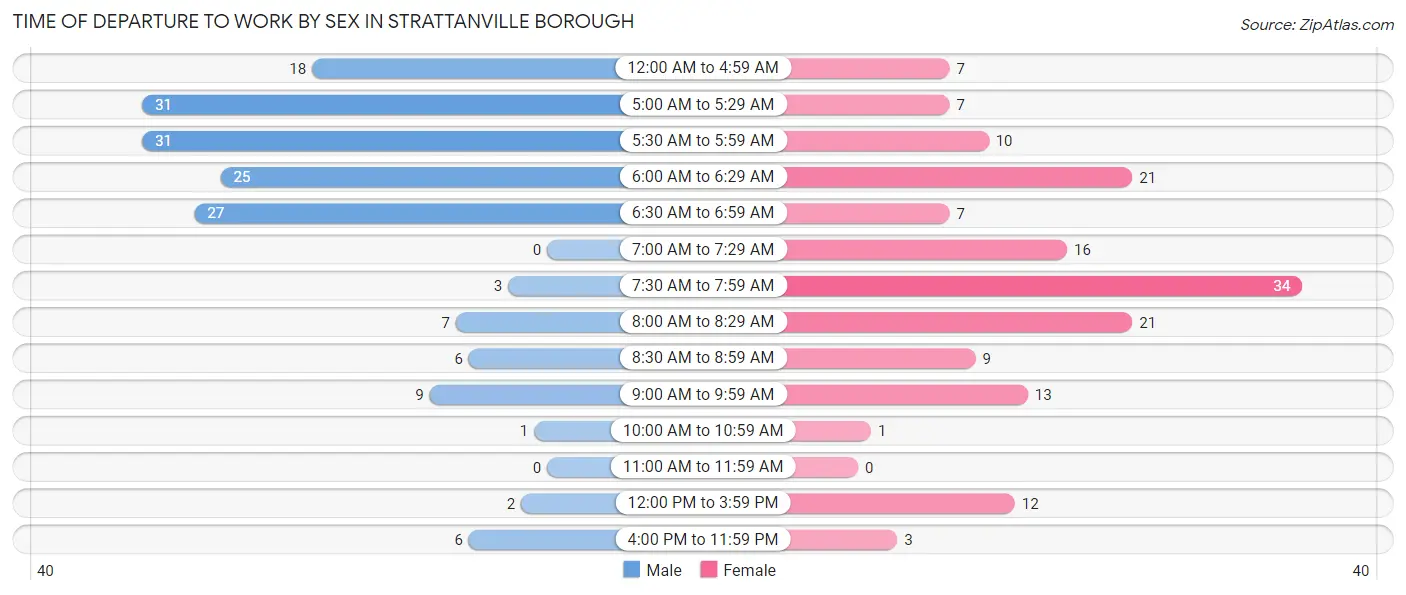
| Time of Departure | Male | Female |
| 12:00 AM to 4:59 AM | 18 (10.8%) | 7 (4.3%) |
| 5:00 AM to 5:29 AM | 31 (18.7%) | 7 (4.3%) |
| 5:30 AM to 5:59 AM | 31 (18.7%) | 10 (6.2%) |
| 6:00 AM to 6:29 AM | 25 (15.1%) | 21 (13.0%) |
| 6:30 AM to 6:59 AM | 27 (16.3%) | 7 (4.3%) |
| 7:00 AM to 7:29 AM | 0 (0.0%) | 16 (9.9%) |
| 7:30 AM to 7:59 AM | 3 (1.8%) | 34 (21.1%) |
| 8:00 AM to 8:29 AM | 7 (4.2%) | 21 (13.0%) |
| 8:30 AM to 8:59 AM | 6 (3.6%) | 9 (5.6%) |
| 9:00 AM to 9:59 AM | 9 (5.4%) | 13 (8.1%) |
| 10:00 AM to 10:59 AM | 1 (0.6%) | 1 (0.6%) |
| 11:00 AM to 11:59 AM | 0 (0.0%) | 0 (0.0%) |
| 12:00 PM to 3:59 PM | 2 (1.2%) | 12 (7.4%) |
| 4:00 PM to 11:59 PM | 6 (3.6%) | 3 (1.9%) |
| Total | 166 (100.0%) | 161 (100.0%) |
Housing Occupancy in Strattanville borough
Occupancy by Ownership in Strattanville borough
Of the total 268 dwellings in Strattanville borough, owner-occupied units account for 172 (64.2%), while renter-occupied units make up 96 (35.8%).
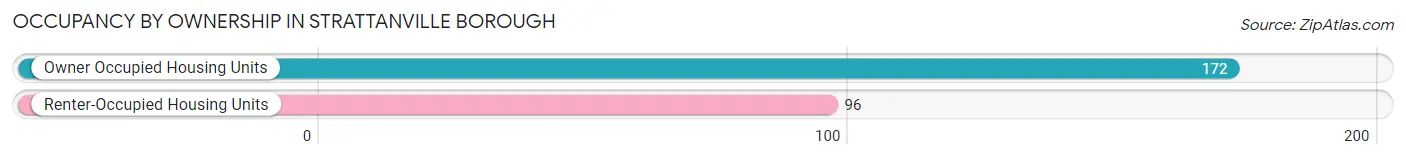
| Occupancy | # Housing Units | % Housing Units |
| Owner Occupied Housing Units | 172 | 64.2% |
| Renter-Occupied Housing Units | 96 | 35.8% |
| Total Occupied Housing Units | 268 | 100.0% |
Occupancy by Household Size in Strattanville borough
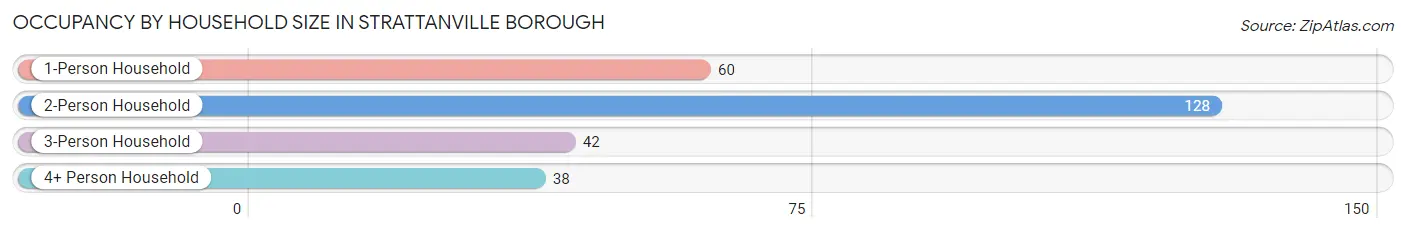
| Household Size | # Housing Units | % Housing Units |
| 1-Person Household | 60 | 22.4% |
| 2-Person Household | 128 | 47.8% |
| 3-Person Household | 42 | 15.7% |
| 4+ Person Household | 38 | 14.2% |
| Total Housing Units | 268 | 100.0% |
Occupancy by Ownership by Household Size in Strattanville borough
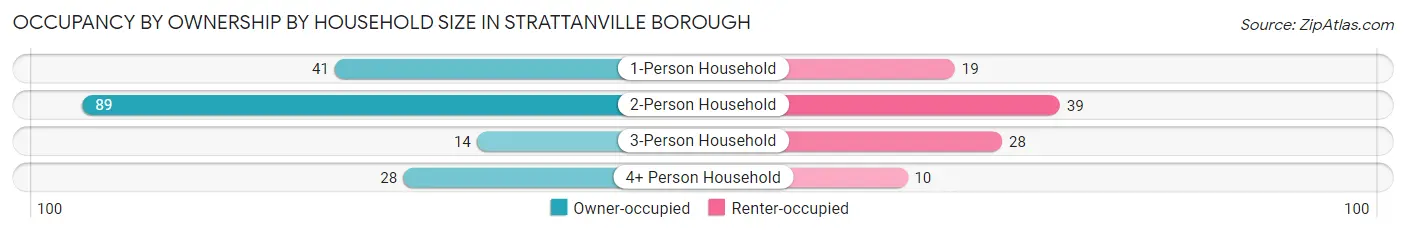
| Household Size | Owner-occupied | Renter-occupied |
| 1-Person Household | 41 (68.3%) | 19 (31.7%) |
| 2-Person Household | 89 (69.5%) | 39 (30.5%) |
| 3-Person Household | 14 (33.3%) | 28 (66.7%) |
| 4+ Person Household | 28 (73.7%) | 10 (26.3%) |
| Total Housing Units | 172 (64.2%) | 96 (35.8%) |
Occupancy by Educational Attainment in Strattanville borough
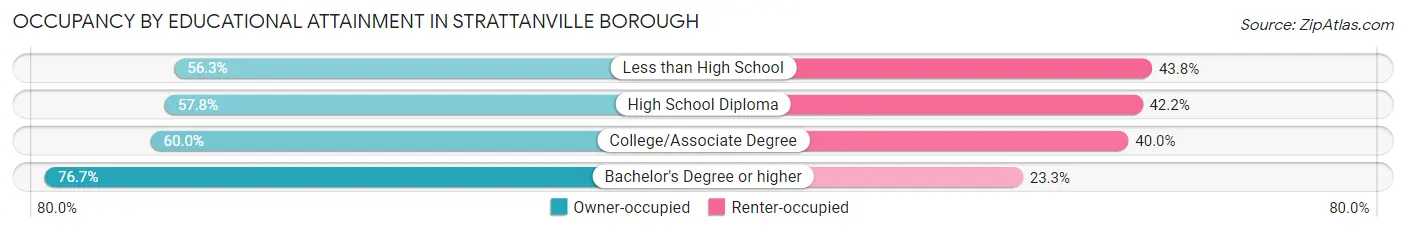
| Household Size | Owner-occupied | Renter-occupied |
| Less than High School | 9 (56.2%) | 7 (43.8%) |
| High School Diploma | 67 (57.8%) | 49 (42.2%) |
| College/Associate Degree | 30 (60.0%) | 20 (40.0%) |
| Bachelor's Degree or higher | 66 (76.7%) | 20 (23.3%) |
Occupancy by Age of Householder in Strattanville borough
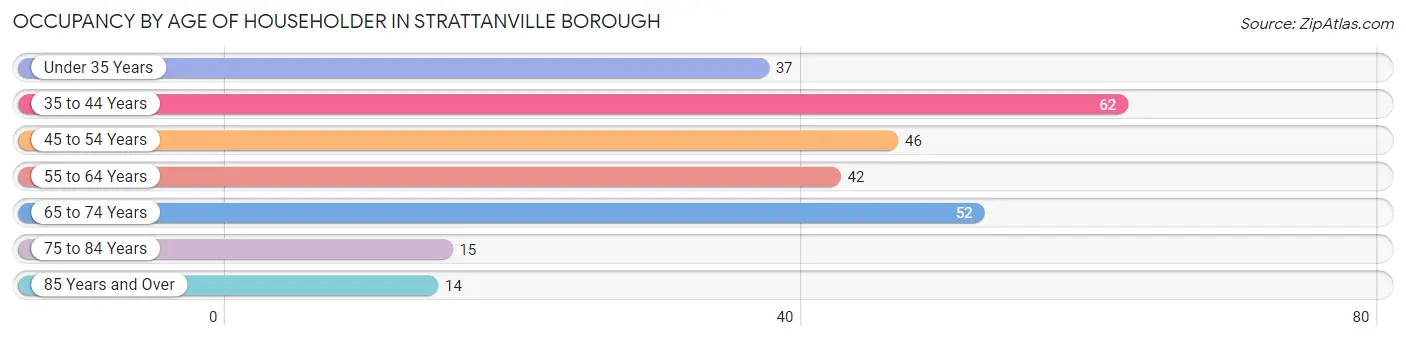
| Age Bracket | # Households | % Households |
| Under 35 Years | 37 | 13.8% |
| 35 to 44 Years | 62 | 23.1% |
| 45 to 54 Years | 46 | 17.2% |
| 55 to 64 Years | 42 | 15.7% |
| 65 to 74 Years | 52 | 19.4% |
| 75 to 84 Years | 15 | 5.6% |
| 85 Years and Over | 14 | 5.2% |
| Total | 268 | 100.0% |
Housing Finances in Strattanville borough
Median Income by Occupancy in Strattanville borough
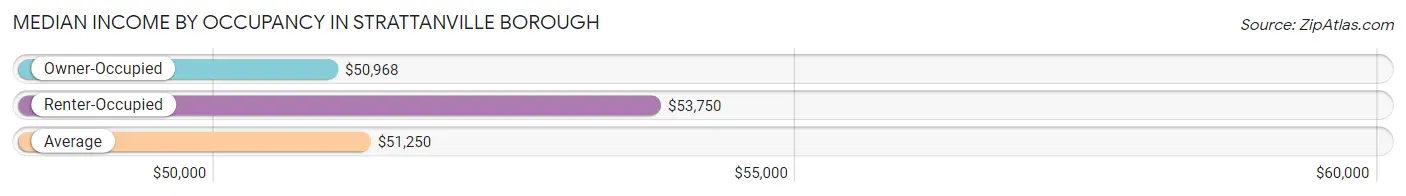
| Occupancy Type | # Households | Median Income |
| Owner-Occupied | 172 (64.2%) | $50,968 |
| Renter-Occupied | 96 (35.8%) | $53,750 |
| Average | 268 (100.0%) | $51,250 |
Occupancy by Householder Income Bracket in Strattanville borough
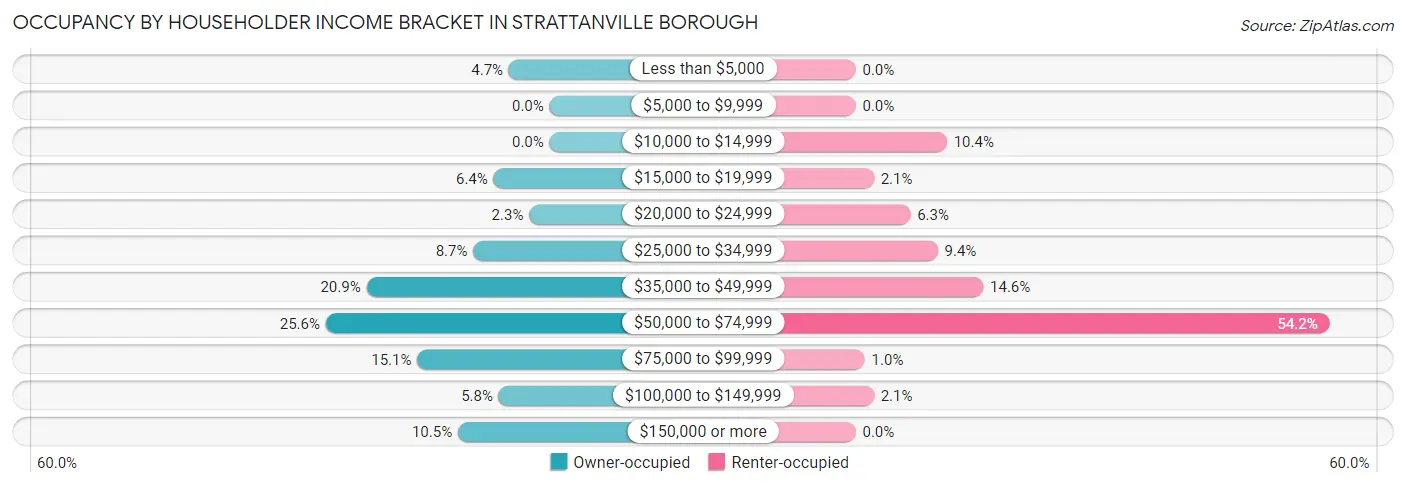
| Income Bracket | Owner-occupied | Renter-occupied |
| Less than $5,000 | 8 (4.6%) | 0 (0.0%) |
| $5,000 to $9,999 | 0 (0.0%) | 0 (0.0%) |
| $10,000 to $14,999 | 0 (0.0%) | 10 (10.4%) |
| $15,000 to $19,999 | 11 (6.4%) | 2 (2.1%) |
| $20,000 to $24,999 | 4 (2.3%) | 6 (6.2%) |
| $25,000 to $34,999 | 15 (8.7%) | 9 (9.4%) |
| $35,000 to $49,999 | 36 (20.9%) | 14 (14.6%) |
| $50,000 to $74,999 | 44 (25.6%) | 52 (54.2%) |
| $75,000 to $99,999 | 26 (15.1%) | 1 (1.0%) |
| $100,000 to $149,999 | 10 (5.8%) | 2 (2.1%) |
| $150,000 or more | 18 (10.5%) | 0 (0.0%) |
| Total | 172 (100.0%) | 96 (100.0%) |
Monthly Housing Cost Tiers in Strattanville borough
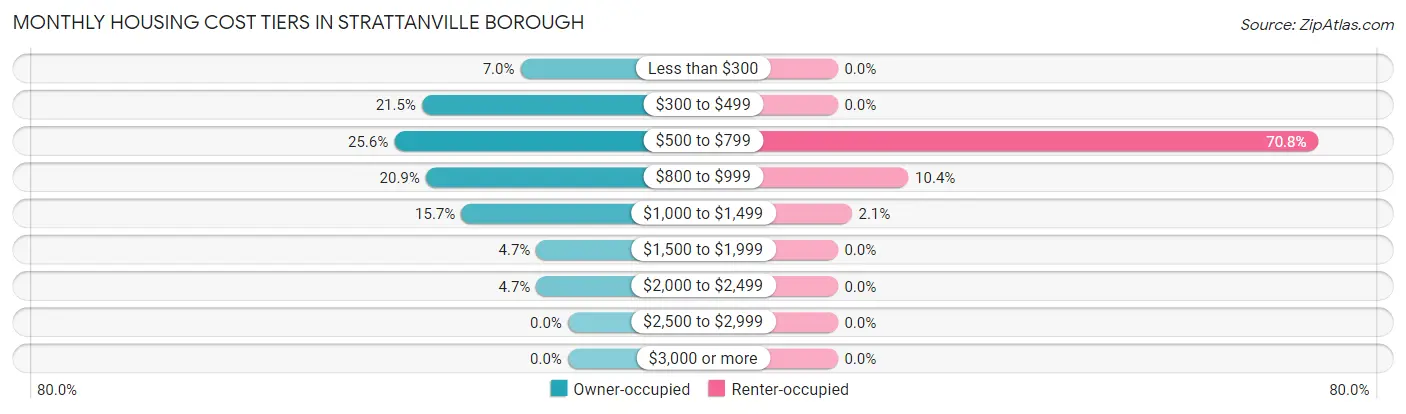
| Monthly Cost | Owner-occupied | Renter-occupied |
| Less than $300 | 12 (7.0%) | 0 (0.0%) |
| $300 to $499 | 37 (21.5%) | 0 (0.0%) |
| $500 to $799 | 44 (25.6%) | 68 (70.8%) |
| $800 to $999 | 36 (20.9%) | 10 (10.4%) |
| $1,000 to $1,499 | 27 (15.7%) | 2 (2.1%) |
| $1,500 to $1,999 | 8 (4.6%) | 0 (0.0%) |
| $2,000 to $2,499 | 8 (4.6%) | 0 (0.0%) |
| $2,500 to $2,999 | 0 (0.0%) | 0 (0.0%) |
| $3,000 or more | 0 (0.0%) | 0 (0.0%) |
| Total | 172 (100.0%) | 96 (100.0%) |
Physical Housing Characteristics in Strattanville borough
Housing Structures in Strattanville borough
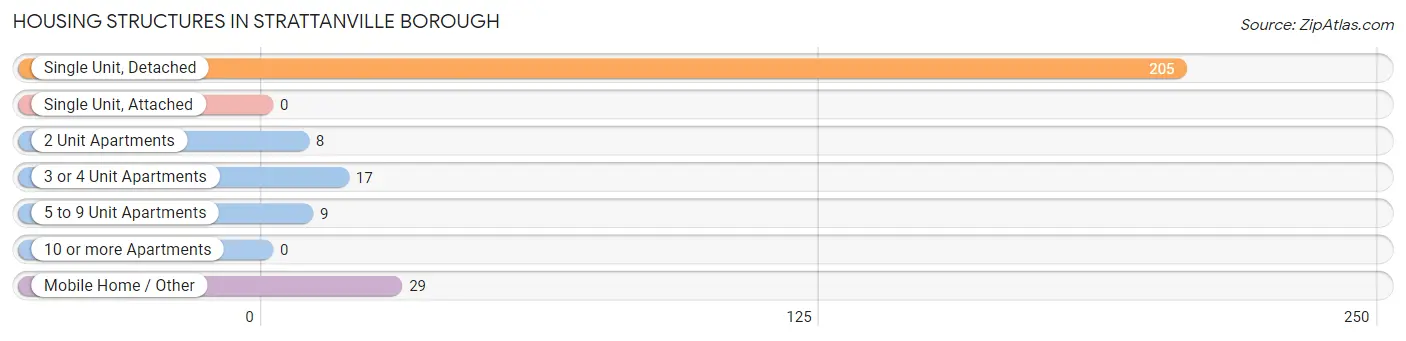
| Structure Type | # Housing Units | % Housing Units |
| Single Unit, Detached | 205 | 76.5% |
| Single Unit, Attached | 0 | 0.0% |
| 2 Unit Apartments | 8 | 3.0% |
| 3 or 4 Unit Apartments | 17 | 6.3% |
| 5 to 9 Unit Apartments | 9 | 3.4% |
| 10 or more Apartments | 0 | 0.0% |
| Mobile Home / Other | 29 | 10.8% |
| Total | 268 | 100.0% |
Housing Structures by Occupancy in Strattanville borough
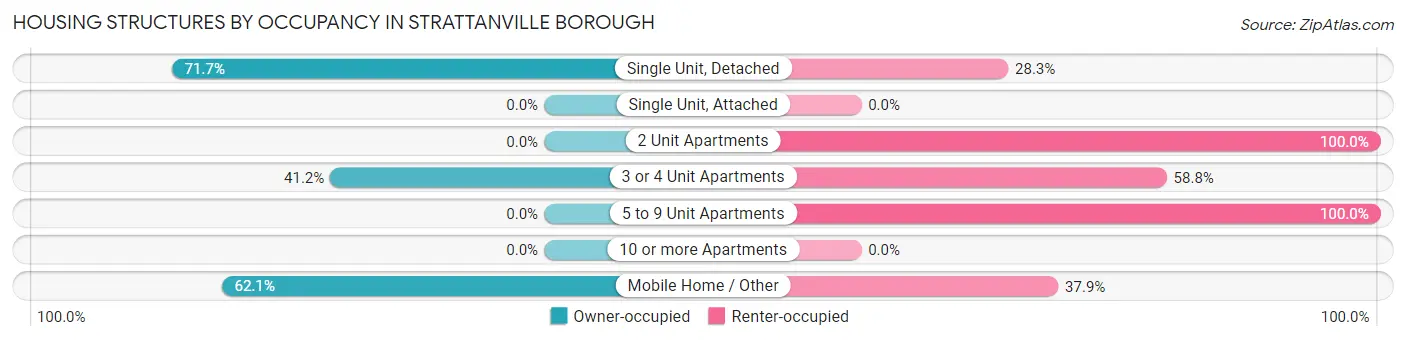
| Structure Type | Owner-occupied | Renter-occupied |
| Single Unit, Detached | 147 (71.7%) | 58 (28.3%) |
| Single Unit, Attached | 0 (0.0%) | 0 (0.0%) |
| 2 Unit Apartments | 0 (0.0%) | 8 (100.0%) |
| 3 or 4 Unit Apartments | 7 (41.2%) | 10 (58.8%) |
| 5 to 9 Unit Apartments | 0 (0.0%) | 9 (100.0%) |
| 10 or more Apartments | 0 (0.0%) | 0 (0.0%) |
| Mobile Home / Other | 18 (62.1%) | 11 (37.9%) |
| Total | 172 (64.2%) | 96 (35.8%) |
Housing Structures by Number of Rooms in Strattanville borough
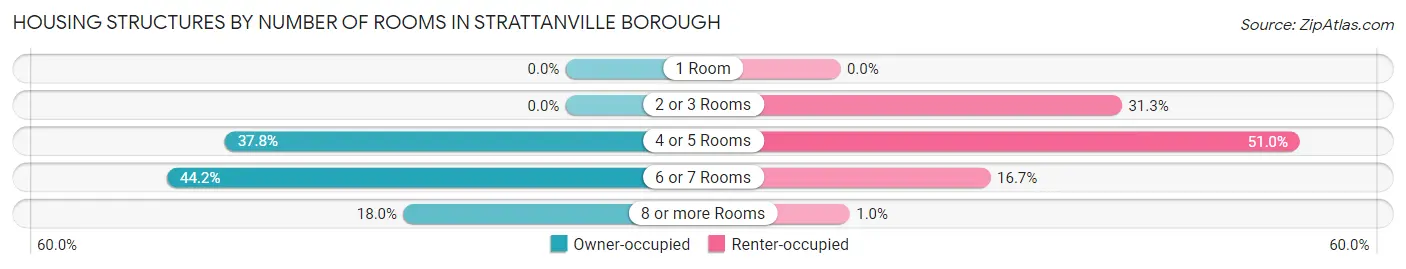
| Number of Rooms | Owner-occupied | Renter-occupied |
| 1 Room | 0 (0.0%) | 0 (0.0%) |
| 2 or 3 Rooms | 0 (0.0%) | 30 (31.2%) |
| 4 or 5 Rooms | 65 (37.8%) | 49 (51.0%) |
| 6 or 7 Rooms | 76 (44.2%) | 16 (16.7%) |
| 8 or more Rooms | 31 (18.0%) | 1 (1.0%) |
| Total | 172 (100.0%) | 96 (100.0%) |
Housing Structure by Heating Type in Strattanville borough
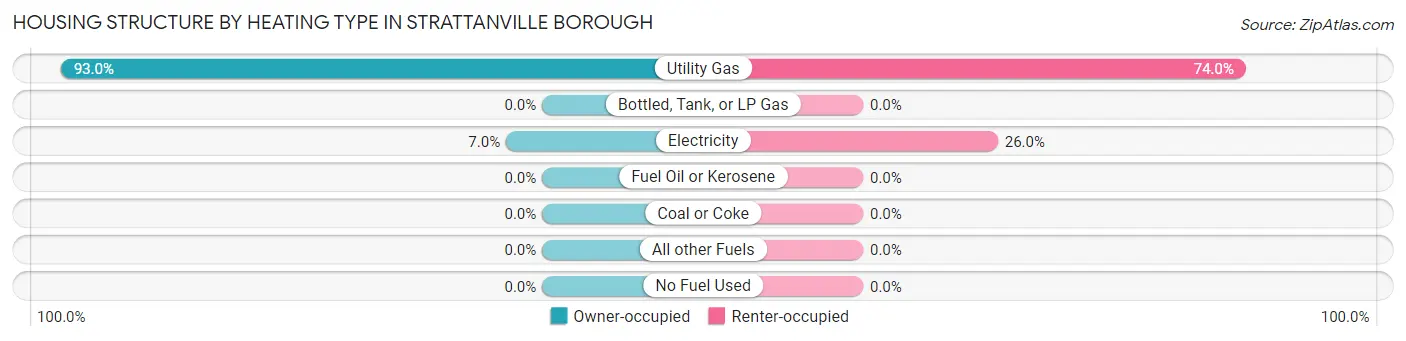
| Heating Type | Owner-occupied | Renter-occupied |
| Utility Gas | 160 (93.0%) | 71 (74.0%) |
| Bottled, Tank, or LP Gas | 0 (0.0%) | 0 (0.0%) |
| Electricity | 12 (7.0%) | 25 (26.0%) |
| Fuel Oil or Kerosene | 0 (0.0%) | 0 (0.0%) |
| Coal or Coke | 0 (0.0%) | 0 (0.0%) |
| All other Fuels | 0 (0.0%) | 0 (0.0%) |
| No Fuel Used | 0 (0.0%) | 0 (0.0%) |
| Total | 172 (100.0%) | 96 (100.0%) |
Household Vehicle Usage in Strattanville borough
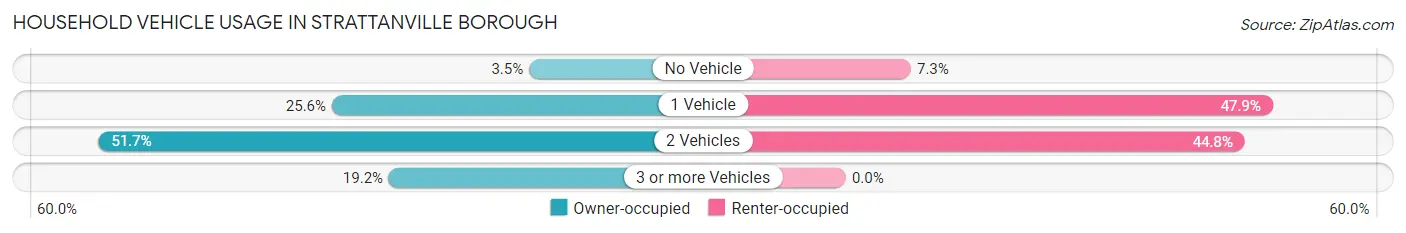
| Vehicles per Household | Owner-occupied | Renter-occupied |
| No Vehicle | 6 (3.5%) | 7 (7.3%) |
| 1 Vehicle | 44 (25.6%) | 46 (47.9%) |
| 2 Vehicles | 89 (51.7%) | 43 (44.8%) |
| 3 or more Vehicles | 33 (19.2%) | 0 (0.0%) |
| Total | 172 (100.0%) | 96 (100.0%) |
Real Estate & Mortgages in Strattanville borough
Real Estate and Mortgage Overview in Strattanville borough
| Characteristic | Without Mortgage | With Mortgage |
| Housing Units | 73 | 99 |
| Median Property Value | $81,700 | $143,100 |
| Median Household Income | $47,917 | $10 |
| Monthly Housing Costs | $454 | $0 |
| Real Estate Taxes | $1,283 | $0 |
Property Value by Mortgage Status in Strattanville borough
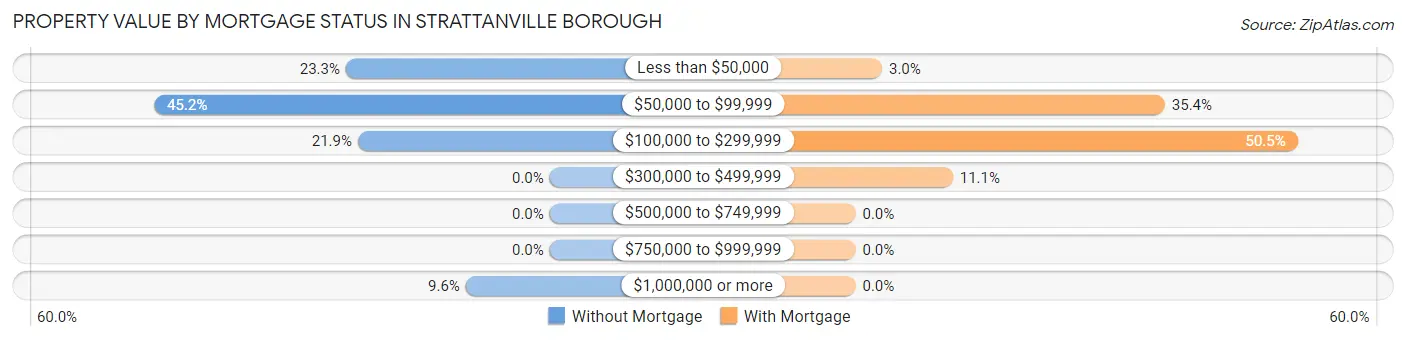
| Property Value | Without Mortgage | With Mortgage |
| Less than $50,000 | 17 (23.3%) | 3 (3.0%) |
| $50,000 to $99,999 | 33 (45.2%) | 35 (35.3%) |
| $100,000 to $299,999 | 16 (21.9%) | 50 (50.5%) |
| $300,000 to $499,999 | 0 (0.0%) | 11 (11.1%) |
| $500,000 to $749,999 | 0 (0.0%) | 0 (0.0%) |
| $750,000 to $999,999 | 0 (0.0%) | 0 (0.0%) |
| $1,000,000 or more | 7 (9.6%) | 0 (0.0%) |
| Total | 73 (100.0%) | 99 (100.0%) |
Household Income by Mortgage Status in Strattanville borough
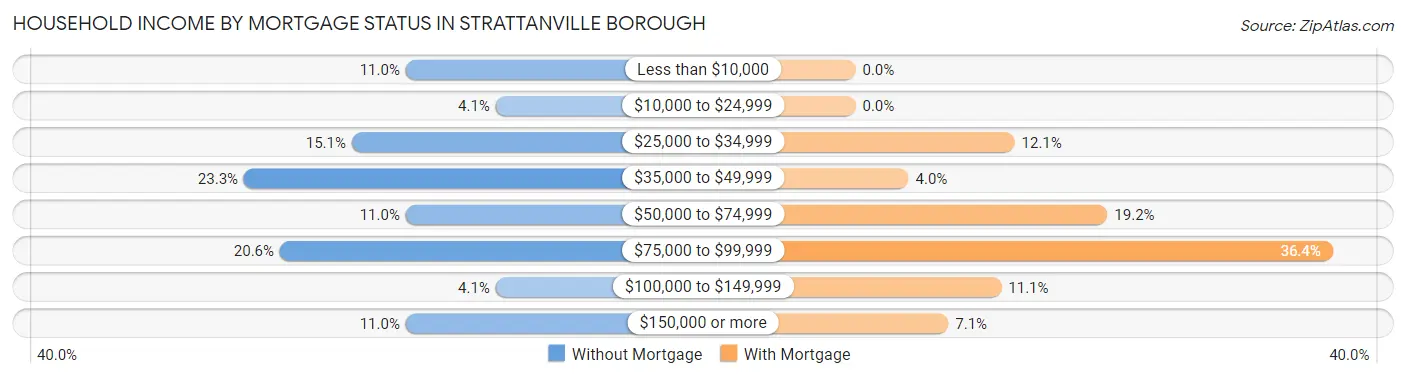
| Household Income | Without Mortgage | With Mortgage |
| Less than $10,000 | 8 (11.0%) | 0 (0.0%) |
| $10,000 to $24,999 | 3 (4.1%) | 0 (0.0%) |
| $25,000 to $34,999 | 11 (15.1%) | 12 (12.1%) |
| $35,000 to $49,999 | 17 (23.3%) | 4 (4.0%) |
| $50,000 to $74,999 | 8 (11.0%) | 19 (19.2%) |
| $75,000 to $99,999 | 15 (20.5%) | 36 (36.4%) |
| $100,000 to $149,999 | 3 (4.1%) | 11 (11.1%) |
| $150,000 or more | 8 (11.0%) | 7 (7.1%) |
| Total | 73 (100.0%) | 99 (100.0%) |
Property Value to Household Income Ratio in Strattanville borough
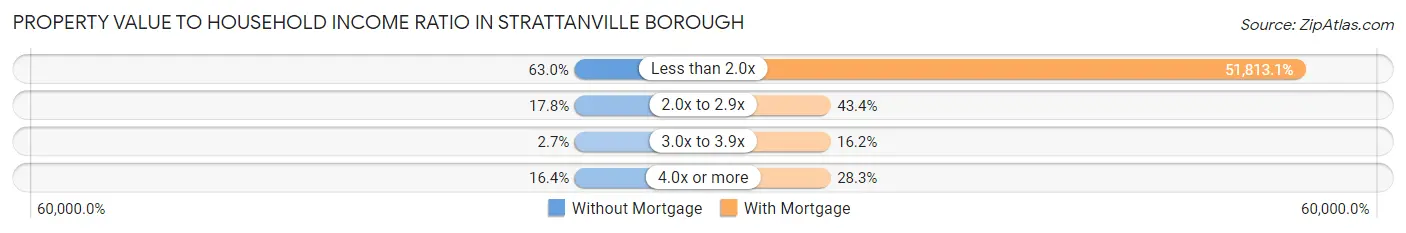
| Value-to-Income Ratio | Without Mortgage | With Mortgage |
| Less than 2.0x | 46 (63.0%) | 51,295 (51,813.1%) |
| 2.0x to 2.9x | 13 (17.8%) | 43 (43.4%) |
| 3.0x to 3.9x | 2 (2.7%) | 16 (16.2%) |
| 4.0x or more | 12 (16.4%) | 28 (28.3%) |
| Total | 73 (100.0%) | 99 (100.0%) |
Real Estate Taxes by Mortgage Status in Strattanville borough
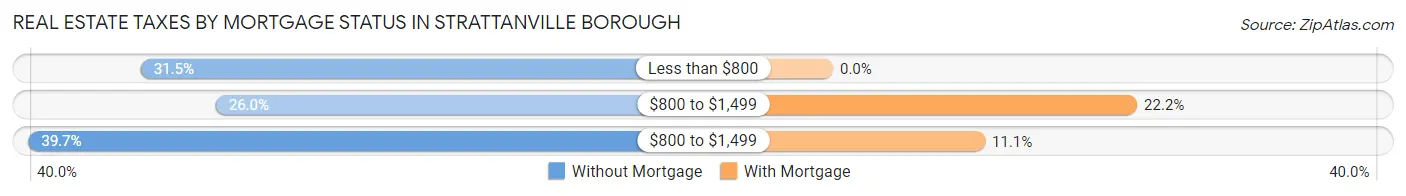
| Property Taxes | Without Mortgage | With Mortgage |
| Less than $800 | 23 (31.5%) | 0 (0.0%) |
| $800 to $1,499 | 19 (26.0%) | 22 (22.2%) |
| $800 to $1,499 | 29 (39.7%) | 11 (11.1%) |
| Total | 73 (100.0%) | 99 (100.0%) |
Health & Disability in Strattanville borough
Health Insurance Coverage by Age in Strattanville borough
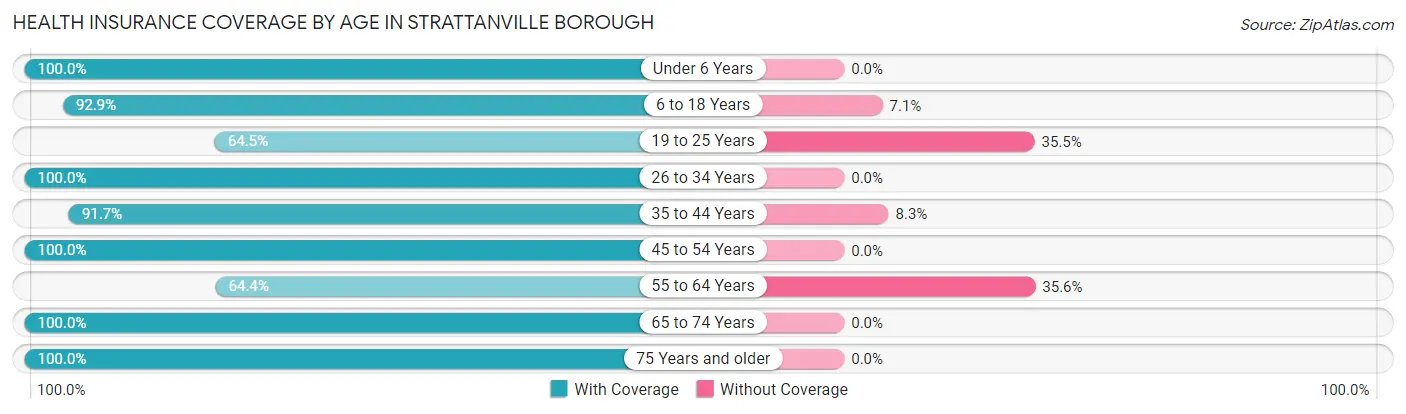
| Age Bracket | With Coverage | Without Coverage |
| Under 6 Years | 40 (100.0%) | 0 (0.0%) |
| 6 to 18 Years | 52 (92.9%) | 4 (7.1%) |
| 19 to 25 Years | 20 (64.5%) | 11 (35.5%) |
| 26 to 34 Years | 47 (100.0%) | 0 (0.0%) |
| 35 to 44 Years | 111 (91.7%) | 10 (8.3%) |
| 45 to 54 Years | 81 (100.0%) | 0 (0.0%) |
| 55 to 64 Years | 56 (64.4%) | 31 (35.6%) |
| 65 to 74 Years | 103 (100.0%) | 0 (0.0%) |
| 75 Years and older | 39 (100.0%) | 0 (0.0%) |
| Total | 549 (90.7%) | 56 (9.3%) |
Health Insurance Coverage by Citizenship Status in Strattanville borough
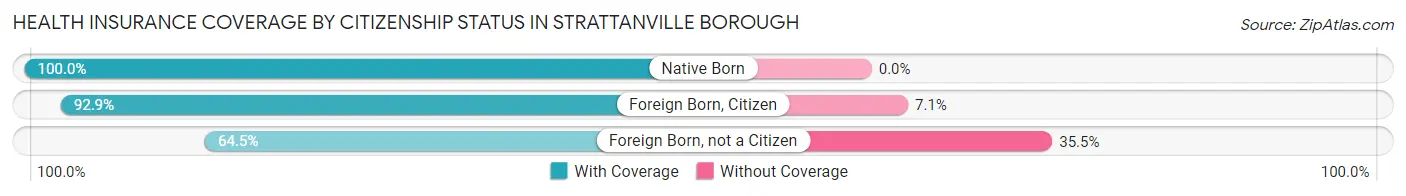
| Citizenship Status | With Coverage | Without Coverage |
| Native Born | 40 (100.0%) | 0 (0.0%) |
| Foreign Born, Citizen | 52 (92.9%) | 4 (7.1%) |
| Foreign Born, not a Citizen | 20 (64.5%) | 11 (35.5%) |
Health Insurance Coverage by Household Income in Strattanville borough
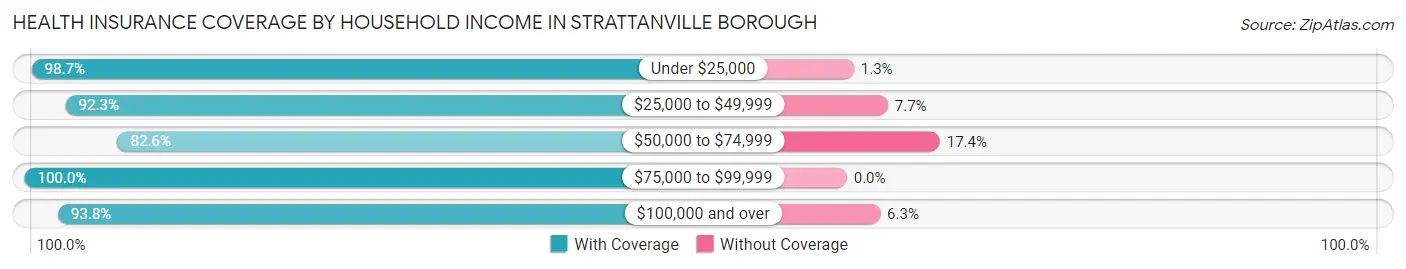
| Household Income | With Coverage | Without Coverage |
| Under $25,000 | 75 (98.7%) | 1 (1.3%) |
| $25,000 to $49,999 | 132 (92.3%) | 11 (7.7%) |
| $50,000 to $74,999 | 180 (82.6%) | 38 (17.4%) |
| $75,000 to $99,999 | 68 (100.0%) | 0 (0.0%) |
| $100,000 and over | 90 (93.8%) | 6 (6.2%) |
Public vs Private Health Insurance Coverage by Age in Strattanville borough
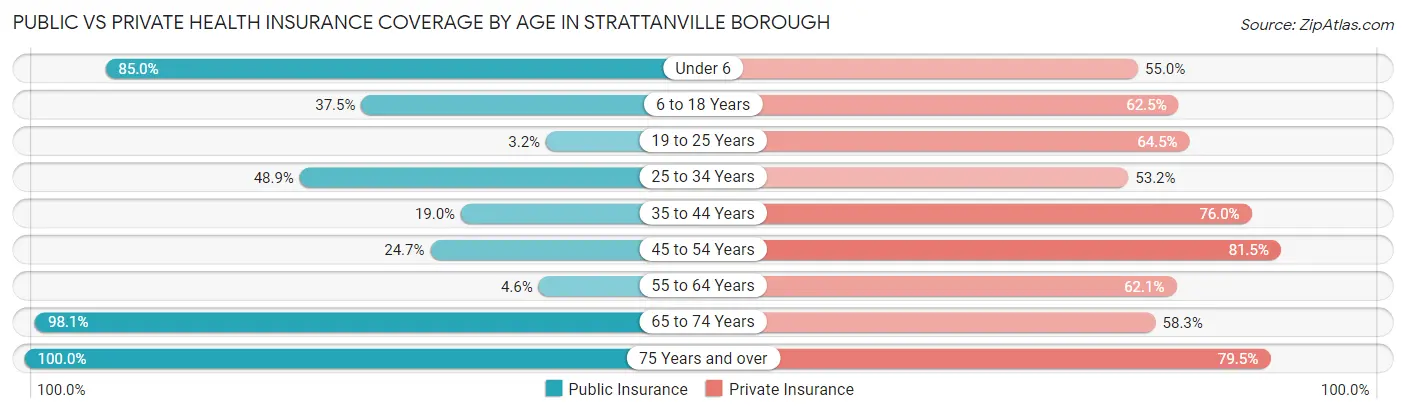
| Age Bracket | Public Insurance | Private Insurance |
| Under 6 | 34 (85.0%) | 22 (55.0%) |
| 6 to 18 Years | 21 (37.5%) | 35 (62.5%) |
| 19 to 25 Years | 1 (3.2%) | 20 (64.5%) |
| 25 to 34 Years | 23 (48.9%) | 25 (53.2%) |
| 35 to 44 Years | 23 (19.0%) | 92 (76.0%) |
| 45 to 54 Years | 20 (24.7%) | 66 (81.5%) |
| 55 to 64 Years | 4 (4.6%) | 54 (62.1%) |
| 65 to 74 Years | 101 (98.1%) | 60 (58.3%) |
| 75 Years and over | 39 (100.0%) | 31 (79.5%) |
| Total | 266 (44.0%) | 405 (66.9%) |
Disability Status by Sex by Age in Strattanville borough
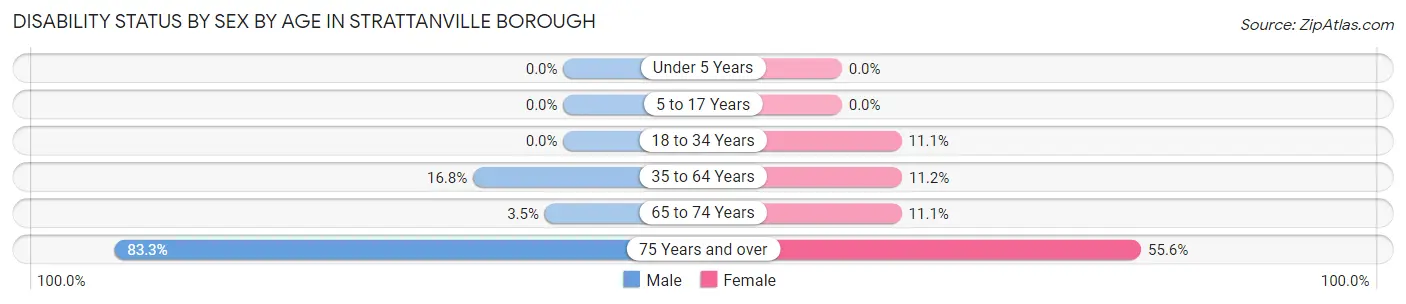
| Age Bracket | Male | Female |
| Under 5 Years | 0 (0.0%) | 0 (0.0%) |
| 5 to 17 Years | 0 (0.0%) | 0 (0.0%) |
| 18 to 34 Years | 0 (0.0%) | 5 (11.1%) |
| 35 to 64 Years | 26 (16.8%) | 15 (11.2%) |
| 65 to 74 Years | 2 (3.5%) | 5 (11.1%) |
| 75 Years and over | 10 (83.3%) | 15 (55.6%) |
Disability Class by Sex by Age in Strattanville borough
Disability Class: Hearing Difficulty
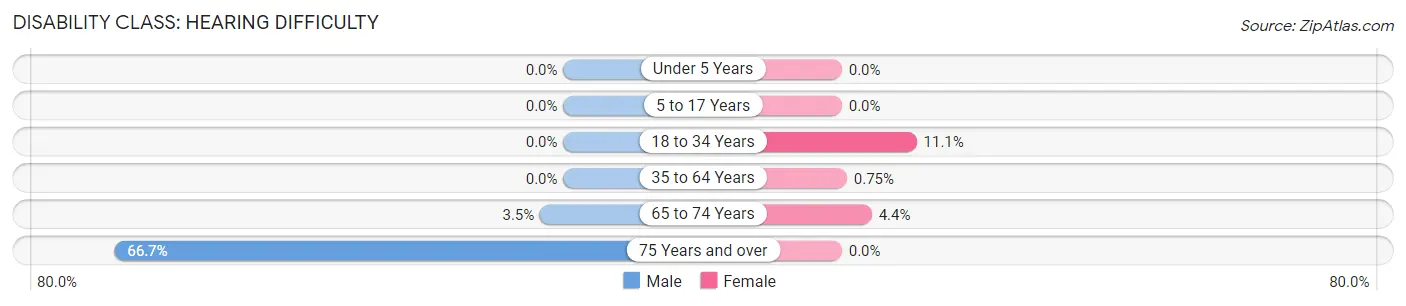
| Age Bracket | Male | Female |
| Under 5 Years | 0 (0.0%) | 0 (0.0%) |
| 5 to 17 Years | 0 (0.0%) | 0 (0.0%) |
| 18 to 34 Years | 0 (0.0%) | 5 (11.1%) |
| 35 to 64 Years | 0 (0.0%) | 1 (0.7%) |
| 65 to 74 Years | 2 (3.5%) | 2 (4.4%) |
| 75 Years and over | 8 (66.7%) | 0 (0.0%) |
Disability Class: Vision Difficulty
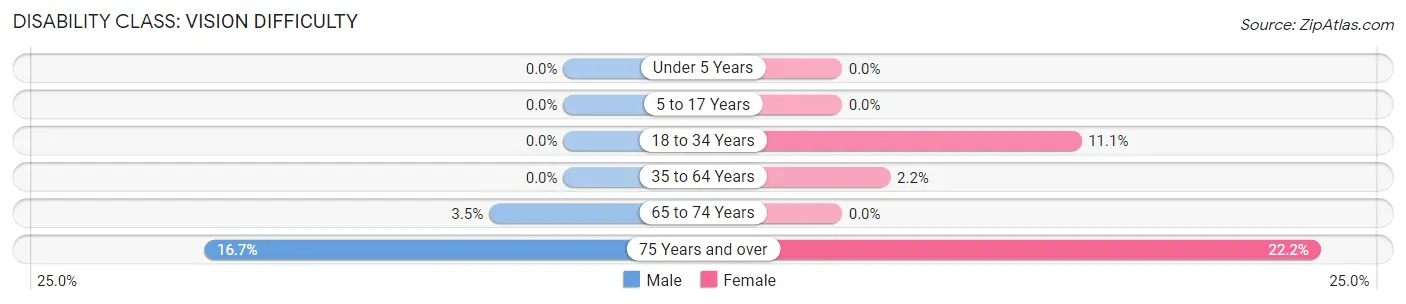
| Age Bracket | Male | Female |
| Under 5 Years | 0 (0.0%) | 0 (0.0%) |
| 5 to 17 Years | 0 (0.0%) | 0 (0.0%) |
| 18 to 34 Years | 0 (0.0%) | 5 (11.1%) |
| 35 to 64 Years | 0 (0.0%) | 3 (2.2%) |
| 65 to 74 Years | 2 (3.5%) | 0 (0.0%) |
| 75 Years and over | 2 (16.7%) | 6 (22.2%) |
Disability Class: Cognitive Difficulty
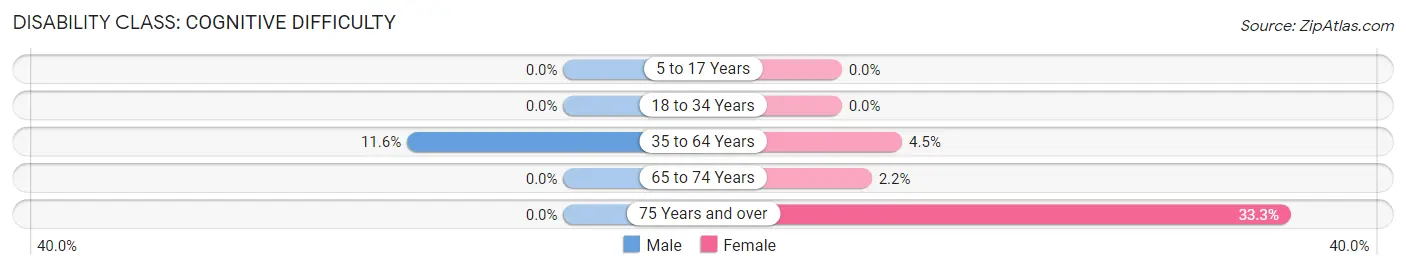
| Age Bracket | Male | Female |
| 5 to 17 Years | 0 (0.0%) | 0 (0.0%) |
| 18 to 34 Years | 0 (0.0%) | 0 (0.0%) |
| 35 to 64 Years | 18 (11.6%) | 6 (4.5%) |
| 65 to 74 Years | 0 (0.0%) | 1 (2.2%) |
| 75 Years and over | 0 (0.0%) | 9 (33.3%) |
Disability Class: Ambulatory Difficulty
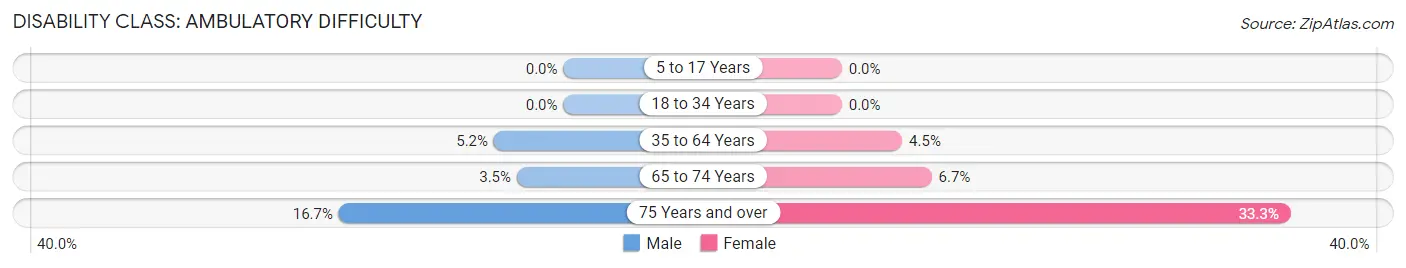
| Age Bracket | Male | Female |
| 5 to 17 Years | 0 (0.0%) | 0 (0.0%) |
| 18 to 34 Years | 0 (0.0%) | 0 (0.0%) |
| 35 to 64 Years | 8 (5.2%) | 6 (4.5%) |
| 65 to 74 Years | 2 (3.5%) | 3 (6.7%) |
| 75 Years and over | 2 (16.7%) | 9 (33.3%) |
Disability Class: Self-Care Difficulty
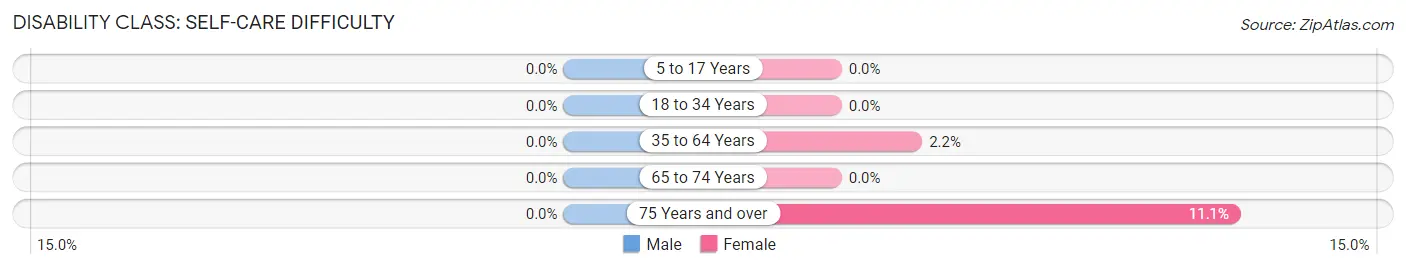
| Age Bracket | Male | Female |
| 5 to 17 Years | 0 (0.0%) | 0 (0.0%) |
| 18 to 34 Years | 0 (0.0%) | 0 (0.0%) |
| 35 to 64 Years | 0 (0.0%) | 3 (2.2%) |
| 65 to 74 Years | 0 (0.0%) | 0 (0.0%) |
| 75 Years and over | 0 (0.0%) | 3 (11.1%) |
Technology Access in Strattanville borough
Computing Device Access in Strattanville borough
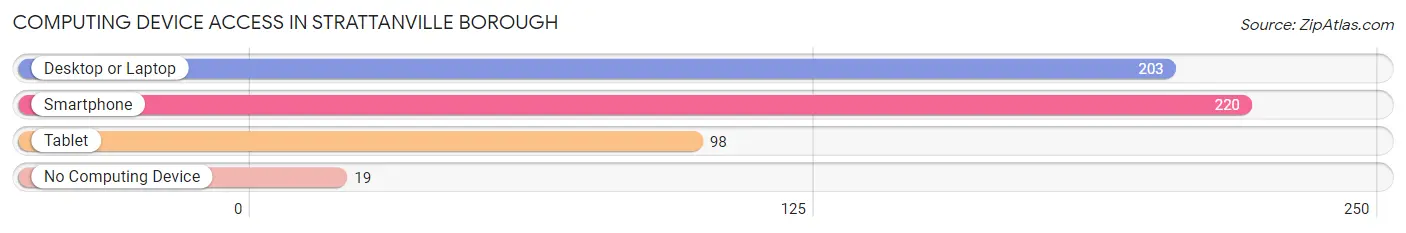
| Device Type | # Households | % Households |
| Desktop or Laptop | 203 | 75.7% |
| Smartphone | 220 | 82.1% |
| Tablet | 98 | 36.6% |
| No Computing Device | 19 | 7.1% |
| Total | 268 | 100.0% |
Internet Access in Strattanville borough
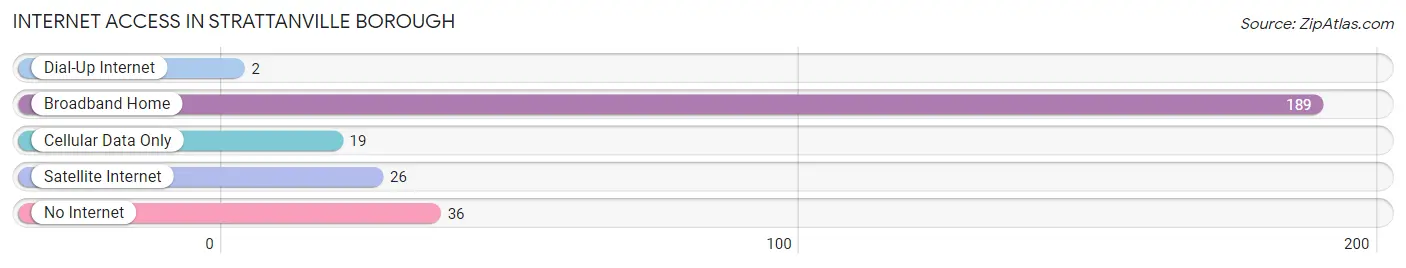
| Internet Type | # Households | % Households |
| Dial-Up Internet | 2 | 0.7% |
| Broadband Home | 189 | 70.5% |
| Cellular Data Only | 19 | 7.1% |
| Satellite Internet | 26 | 9.7% |
| No Internet | 36 | 13.4% |
| Total | 268 | 100.0% |
Strattanville borough Summary
Strattanville Borough is a small borough located in Clarion County, Pennsylvania. It is situated in the northwest corner of the county, and is bordered by Clarion Township to the north, Beaver Township to the east, and Perry Township to the south and west. The population of Strattanville Borough was 545 at the 2010 census.
History
Strattanville Borough was founded in 1876 by William Strattan, a local businessman. The borough was named after him, and he served as its first mayor. Strattanville was incorporated in 1877, and the first borough council was elected in 1878.
The borough was originally a farming community, and the main industry was dairy farming. In the early 1900s, the borough began to grow and develop, and the population increased. The first school was built in 1908, and the first post office was established in 1910.
In the 1920s, the borough began to experience a period of growth and development. The first bank was established in 1921, and the first telephone service was established in 1923. The first fire department was established in 1925, and the first water system was installed in 1926.
Geography
Strattanville Borough is located at 41°14'N 79°37'W (41.2333, -79.6167). It has a total area of 0.6 square miles, all of which is land. The borough is located in the Allegheny Plateau region of Pennsylvania, and is surrounded by rolling hills and forests.
The Clarion River runs through the borough, and there are several small creeks and streams in the area. The borough is located in the Eastern Standard Time Zone, and the elevation is 1,092 feet above sea level.
Economy
The economy of Strattanville Borough is largely based on agriculture and tourism. The borough is home to several small farms, and the main crops grown are corn, soybeans, and hay. The borough also has several small businesses, including a grocery store, a hardware store, and a restaurant.
Tourism is an important part of the economy, as the borough is located near several popular attractions, including Cook Forest State Park, Clarion University, and the Allegheny National Forest. The borough also hosts several annual events, including the Strattanville Summer Festival and the Strattanville Fall Festival.
Demographics
As of the 2010 census, the population of Strattanville Borough was 545. The racial makeup of the borough was 97.3% White, 0.7% African American, 0.2% Native American, 0.2% Asian, and 1.6% from two or more races. Hispanic or Latino of any race were 0.7% of the population.
The median household income in Strattanville Borough was $37,500, and the median family income was $45,000. The per capita income was $18,000. About 11.3% of families and 14.2% of the population were below the poverty line, including 18.2% of those under age 18 and 8.3% of those age 65 or over.
Common Questions
What is Per Capita Income in Strattanville borough?
Per Capita income in Strattanville borough is $28,625.
What is the Median Family Income in Strattanville borough?
Median Family Income in Strattanville borough is $52,054.
What is the Median Household income in Strattanville borough?
Median Household Income in Strattanville borough is $51,250.
What is Income or Wage Gap in Strattanville borough?
Income or Wage Gap in Strattanville borough is 40.0%.
Women in Strattanville borough earn 60.0 cents for every dollar earned by a man.
What is Inequality or Gini Index in Strattanville borough?
Inequality or Gini Index in Strattanville borough is 0.37.
What is the Total Population of Strattanville borough?
Total Population of Strattanville borough is 605.
What is the Total Male Population of Strattanville borough?
Total Male Population of Strattanville borough is 306.
What is the Total Female Population of Strattanville borough?
Total Female Population of Strattanville borough is 299.
What is the Ratio of Males per 100 Females in Strattanville borough?
There are 102.34 Males per 100 Females in Strattanville borough.
What is the Ratio of Females per 100 Males in Strattanville borough?
There are 97.71 Females per 100 Males in Strattanville borough.
What is the Median Population Age in Strattanville borough?
Median Population Age in Strattanville borough is 46.3 Years.
What is the Average Family Size in Strattanville borough
Average Family Size in Strattanville borough is 2.5 People.
What is the Average Household Size in Strattanville borough
Average Household Size in Strattanville borough is 2.2 People.
How Large is the Labor Force in Strattanville borough?
There are 336 People in the Labor Forcein in Strattanville borough.
What is the Percentage of People in the Labor Force in Strattanville borough?
64.0% of People are in the Labor Force in Strattanville borough.
What is the Unemployment Rate in Strattanville borough?
Unemployment Rate in Strattanville borough is 1.2%.