Stonybrook, PA Map & Demographics
Stonybrook Map
Stonybrook Overview
$39,608
PER CAPITA INCOME
$138,125
AVG FAMILY INCOME
$109,650
AVG HOUSEHOLD INCOME
32.8%
WAGE / INCOME GAP [ % ]
67.2¢/ $1
WAGE / INCOME GAP [ $ ]
0.37
INEQUALITY / GINI INDEX
3,577
TOTAL POPULATION
1,883
MALE POPULATION
1,694
FEMALE POPULATION
111.16
MALES / 100 FEMALES
89.96
FEMALES / 100 MALES
39.7
MEDIAN AGE
3.3
AVG FAMILY SIZE
3.0
AVG HOUSEHOLD SIZE
1,580
LABOR FORCE [ PEOPLE ]
62.0%
PERCENT IN LABOR FORCE
Income in Stonybrook
Income Overview in Stonybrook
Per Capita Income in Stonybrook is $39,608, while median incomes of families and households are $138,125 and $109,650 respectively.
| Characteristic | Number | Measure |
| Per Capita Income | 3,577 | $39,608 |
| Median Family Income | 944 | $138,125 |
| Mean Family Income | 944 | $136,982 |
| Median Household Income | 1,207 | $109,650 |
| Mean Household Income | 1,207 | $119,951 |
| Income Deficit | 944 | $0 |
| Wage / Income Gap (%) | 3,577 | 32.84% |
| Wage / Income Gap ($) | 3,577 | 67.16¢ per $1 |
| Gini / Inequality Index | 3,577 | 0.37 |
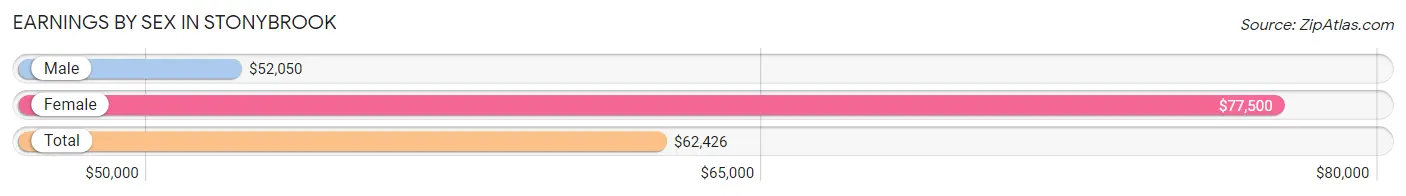
Earnings by Sex in Stonybrook
Average Earnings in Stonybrook are $62,426, $52,050 for men and $77,500 for women, a difference of 32.8%.
| Sex | Number | Average Earnings |
| Male | 937 (56.0%) | $52,050 |
| Female | 736 (44.0%) | $77,500 |
| Total | 1,673 (100.0%) | $62,426 |
Earnings by Sex by Income Bracket in Stonybrook
The most common earnings brackets in Stonybrook are $75,000 to $99,999 for men (205 | 21.9%) and $75,000 to $99,999 for women (260 | 35.3%).
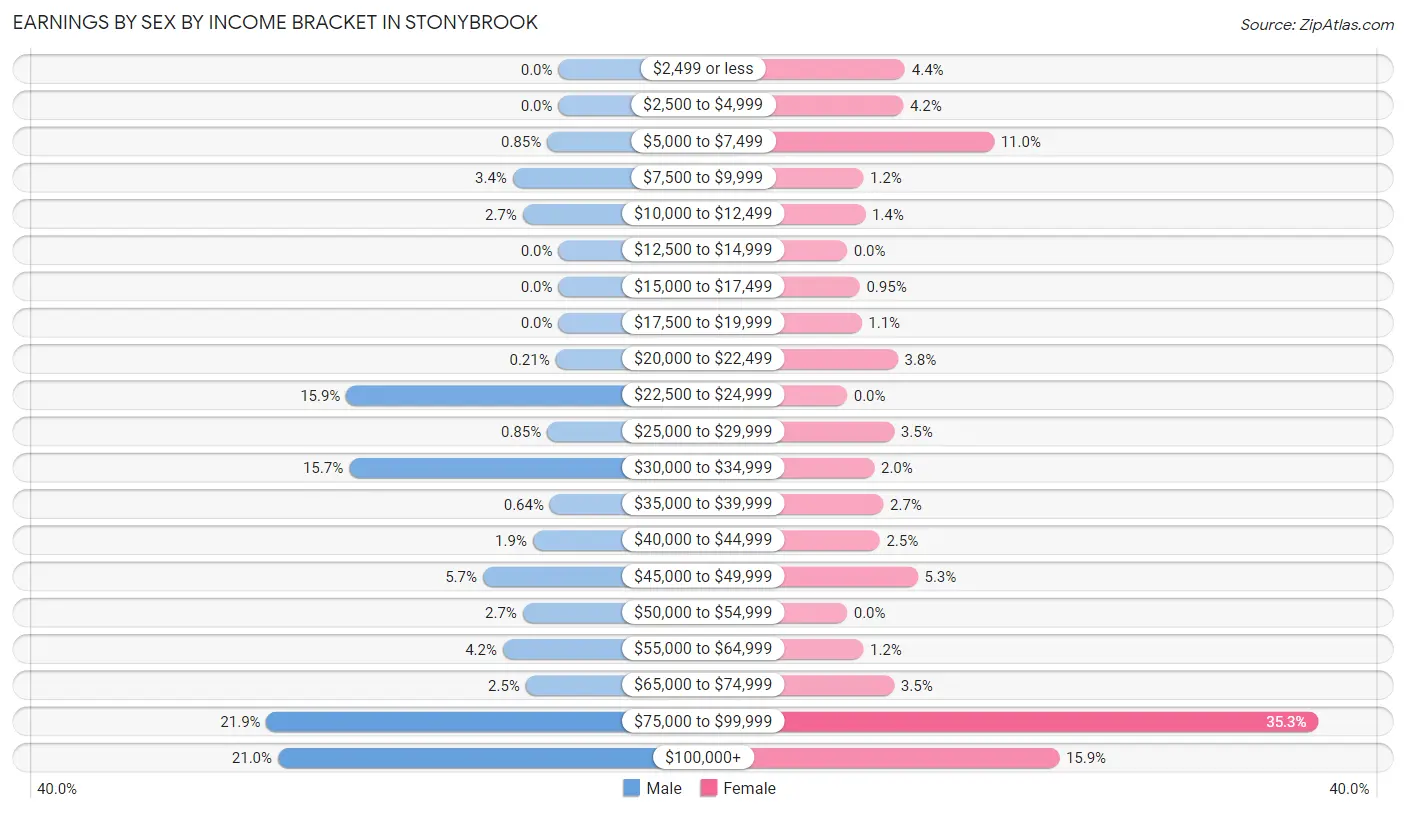
| Income | Male | Female |
| $2,499 or less | 0 (0.0%) | 32 (4.3%) |
| $2,500 to $4,999 | 0 (0.0%) | 31 (4.2%) |
| $5,000 to $7,499 | 8 (0.9%) | 81 (11.0%) |
| $7,500 to $9,999 | 32 (3.4%) | 9 (1.2%) |
| $10,000 to $12,499 | 25 (2.7%) | 10 (1.4%) |
| $12,500 to $14,999 | 0 (0.0%) | 0 (0.0%) |
| $15,000 to $17,499 | 0 (0.0%) | 7 (0.9%) |
| $17,500 to $19,999 | 0 (0.0%) | 8 (1.1%) |
| $20,000 to $22,499 | 2 (0.2%) | 28 (3.8%) |
| $22,500 to $24,999 | 149 (15.9%) | 0 (0.0%) |
| $25,000 to $29,999 | 8 (0.9%) | 26 (3.5%) |
| $30,000 to $34,999 | 147 (15.7%) | 15 (2.0%) |
| $35,000 to $39,999 | 6 (0.6%) | 20 (2.7%) |
| $40,000 to $44,999 | 18 (1.9%) | 18 (2.5%) |
| $45,000 to $49,999 | 53 (5.7%) | 39 (5.3%) |
| $50,000 to $54,999 | 25 (2.7%) | 0 (0.0%) |
| $55,000 to $64,999 | 39 (4.2%) | 9 (1.2%) |
| $65,000 to $74,999 | 23 (2.5%) | 26 (3.5%) |
| $75,000 to $99,999 | 205 (21.9%) | 260 (35.3%) |
| $100,000+ | 197 (21.0%) | 117 (15.9%) |
| Total | 937 (100.0%) | 736 (100.0%) |
Earnings by Sex by Educational Attainment in Stonybrook
Average earnings in Stonybrook are $60,515 for men and $85,022 for women, a difference of 28.8%. Men with an educational attainment of bachelor's degree enjoy the highest average annual earnings of $134,500, while those with high school diploma education earn the least with $34,609. Women with an educational attainment of graduate degree earn the most with the average annual earnings of $94,375, while those with high school diploma education have the smallest earnings of $29,130.
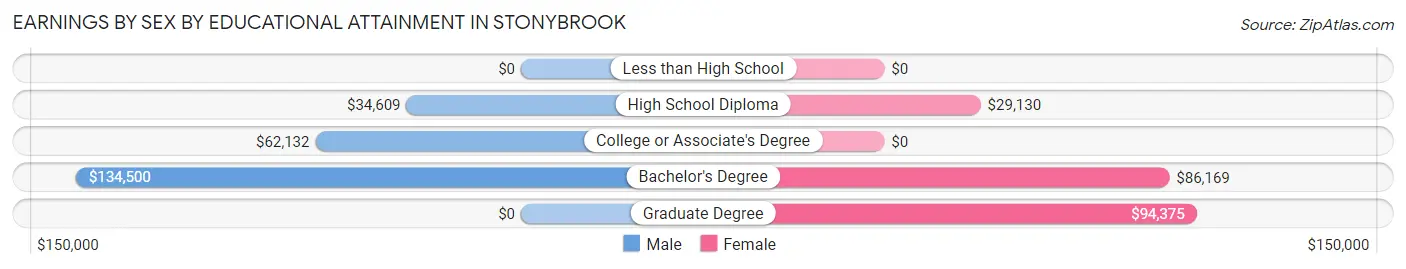
| Educational Attainment | Male Income | Female Income |
| Less than High School | - | - |
| High School Diploma | $34,609 | $29,130 |
| College or Associate's Degree | $62,132 | $0 |
| Bachelor's Degree | $134,500 | $86,169 |
| Graduate Degree | - | - |
| Total | $60,515 | $85,022 |
Family Income in Stonybrook
Family Income Brackets in Stonybrook
According to the Stonybrook family income data, there are 307 families falling into the $150,000 to $199,999 income range, which is the most common income bracket and makes up 32.5% of all families.
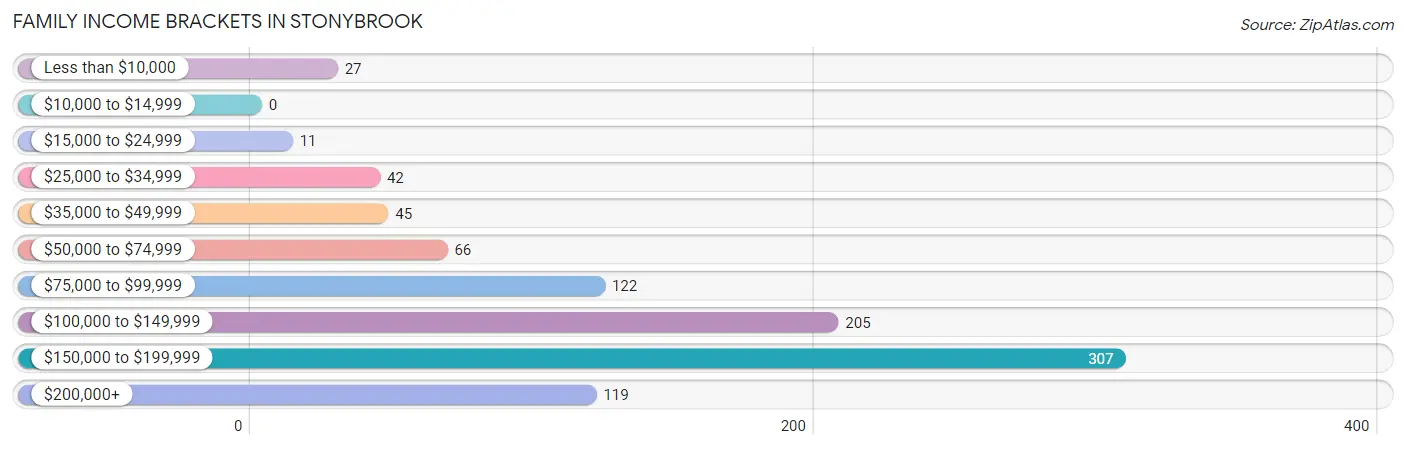
| Income Bracket | # Families | % Families |
| Less than $10,000 | 27 | 2.9% |
| $10,000 to $14,999 | 0 | 0.0% |
| $15,000 to $24,999 | 11 | 1.2% |
| $25,000 to $34,999 | 42 | 4.4% |
| $35,000 to $49,999 | 45 | 4.8% |
| $50,000 to $74,999 | 66 | 7.0% |
| $75,000 to $99,999 | 122 | 12.9% |
| $100,000 to $149,999 | 205 | 21.7% |
| $150,000 to $199,999 | 307 | 32.5% |
| $200,000+ | 119 | 12.6% |
Family Income by Famaliy Size in Stonybrook
3-person families (124 | 13.1%) account for the highest median family income in Stonybrook with $138,125 per family, while 3-person families (124 | 13.1%) have the highest median income of $46,042 per family member.
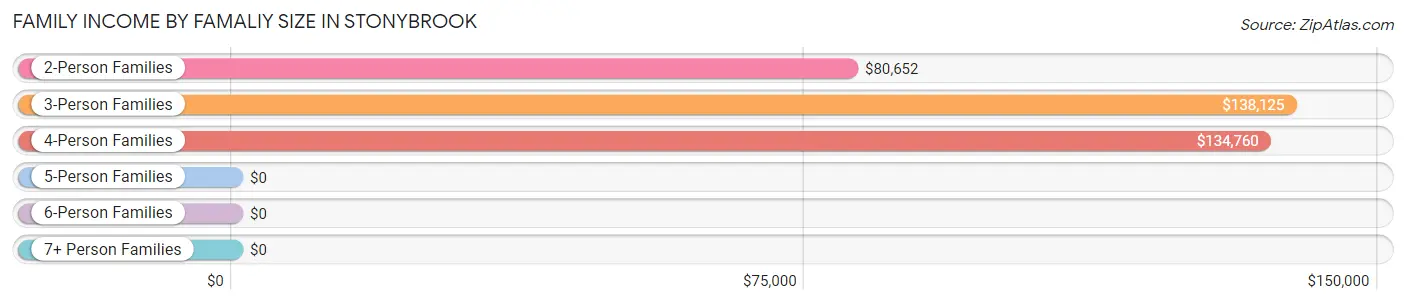
| Income Bracket | # Families | Median Income |
| 2-Person Families | 346 (36.6%) | $80,652 |
| 3-Person Families | 124 (13.1%) | $138,125 |
| 4-Person Families | 165 (17.5%) | $134,760 |
| 5-Person Families | 106 (11.2%) | $0 |
| 6-Person Families | 169 (17.9%) | $0 |
| 7+ Person Families | 34 (3.6%) | $0 |
| Total | 944 (100.0%) | $138,125 |
Family Income by Number of Earners in Stonybrook
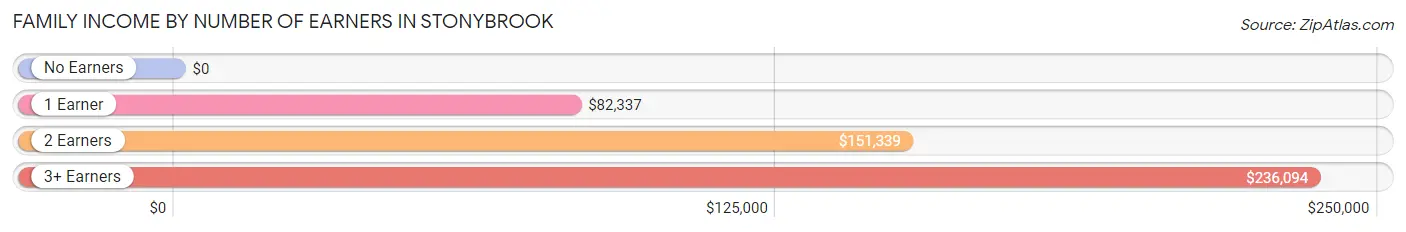
| Number of Earners | # Families | Median Income |
| No Earners | 86 (9.1%) | $0 |
| 1 Earner | 342 (36.2%) | $82,337 |
| 2 Earners | 457 (48.4%) | $151,339 |
| 3+ Earners | 59 (6.2%) | $236,094 |
| Total | 944 (100.0%) | $138,125 |
Household Income in Stonybrook
Household Income Brackets in Stonybrook
With 316 households falling in the category, the $150,000 to $199,999 income range is the most frequent in Stonybrook, accounting for 26.2% of all households. In contrast, only 8 households (0.7%) fall into the $10,000 to $14,999 income bracket, making it the least populous group.
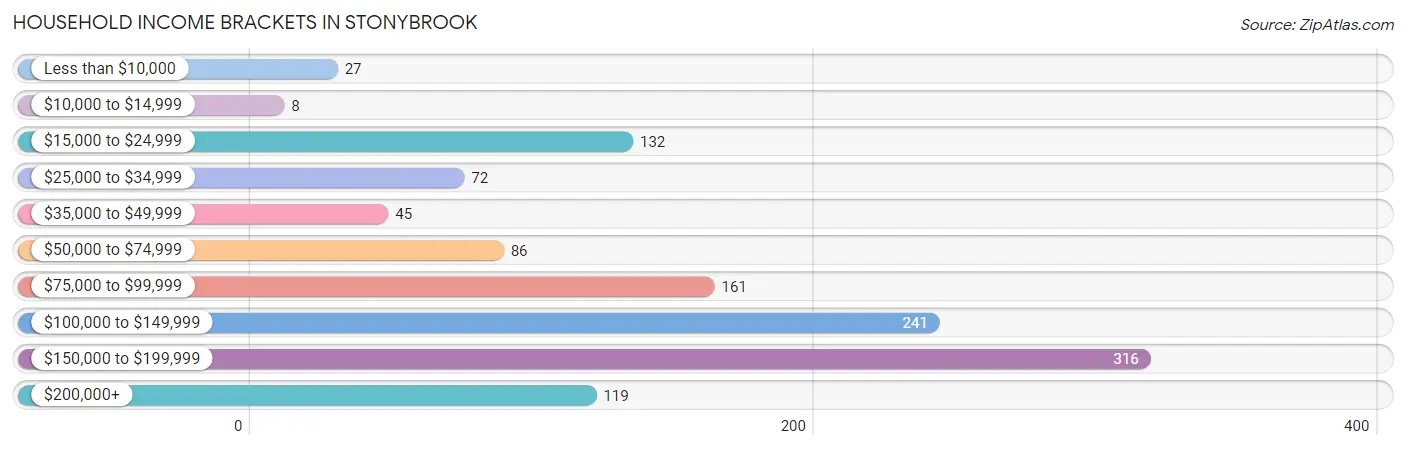
| Income Bracket | # Households | % Households |
| Less than $10,000 | 27 | 2.2% |
| $10,000 to $14,999 | 8 | 0.7% |
| $15,000 to $24,999 | 132 | 10.9% |
| $25,000 to $34,999 | 72 | 6.0% |
| $35,000 to $49,999 | 45 | 3.7% |
| $50,000 to $74,999 | 86 | 7.1% |
| $75,000 to $99,999 | 161 | 13.3% |
| $100,000 to $149,999 | 241 | 20.0% |
| $150,000 to $199,999 | 316 | 26.2% |
| $200,000+ | 119 | 9.9% |
Household Income by Householder Age in Stonybrook
The median household income in Stonybrook is $109,650, with the highest median household income of $150,540 found in the 45 to 64 years age bracket for the primary householder. A total of 393 households (32.6%) fall into this category.
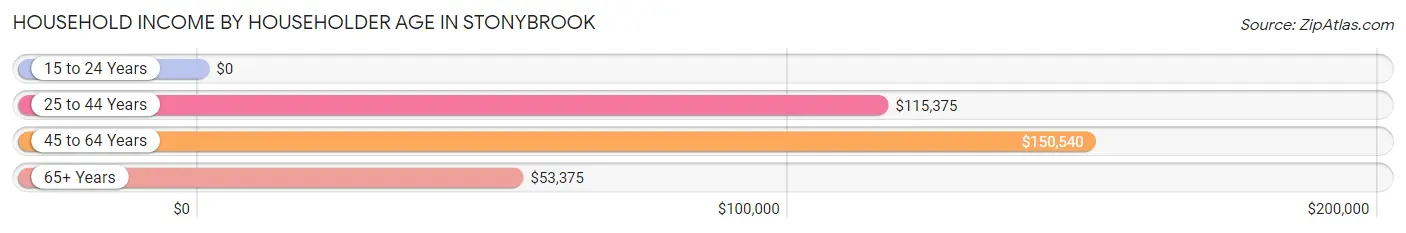
| Income Bracket | # Households | Median Income |
| 15 to 24 Years | 0 (0.0%) | $0 |
| 25 to 44 Years | 481 (39.9%) | $115,375 |
| 45 to 64 Years | 393 (32.6%) | $150,540 |
| 65+ Years | 333 (27.6%) | $53,375 |
| Total | 1,207 (100.0%) | $109,650 |
Poverty in Stonybrook
Income Below Poverty by Sex and Age in Stonybrook
With 1.4% poverty level for males and 7.9% for females among the residents of Stonybrook, 75 year old and over males and 18 to 24 year old females are the most vulnerable to poverty, with 27 males (14.5%) and 50 females (45.9%) in their respective age groups living below the poverty level.
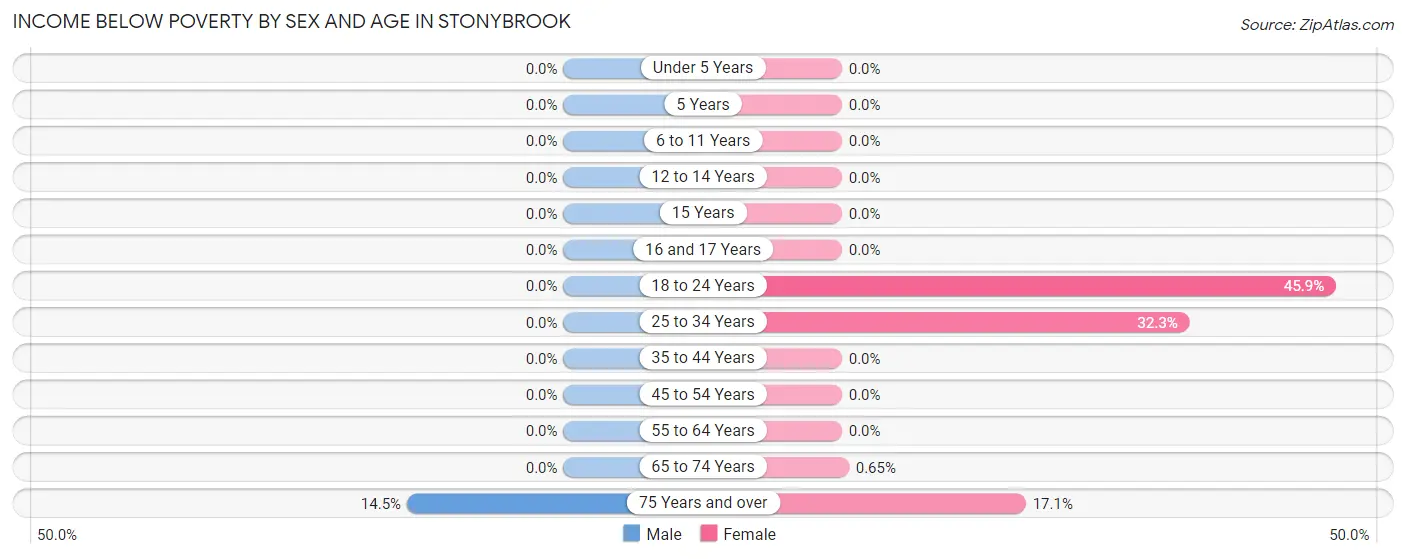
| Age Bracket | Male | Female |
| Under 5 Years | 0 (0.0%) | 0 (0.0%) |
| 5 Years | 0 (0.0%) | 0 (0.0%) |
| 6 to 11 Years | 0 (0.0%) | 0 (0.0%) |
| 12 to 14 Years | 0 (0.0%) | 0 (0.0%) |
| 15 Years | 0 (0.0%) | 0 (0.0%) |
| 16 and 17 Years | 0 (0.0%) | 0 (0.0%) |
| 18 to 24 Years | 0 (0.0%) | 50 (45.9%) |
| 25 to 34 Years | 0 (0.0%) | 51 (32.3%) |
| 35 to 44 Years | 0 (0.0%) | 0 (0.0%) |
| 45 to 54 Years | 0 (0.0%) | 0 (0.0%) |
| 55 to 64 Years | 0 (0.0%) | 0 (0.0%) |
| 65 to 74 Years | 0 (0.0%) | 1 (0.6%) |
| 75 Years and over | 27 (14.5%) | 28 (17.1%) |
| Total | 27 (1.4%) | 130 (7.9%) |
Income Above Poverty by Sex and Age in Stonybrook
According to the poverty statistics in Stonybrook, males aged under 5 years and females aged under 5 years are the age groups that are most secure financially, with 100.0% of males and 100.0% of females in these age groups living above the poverty line.
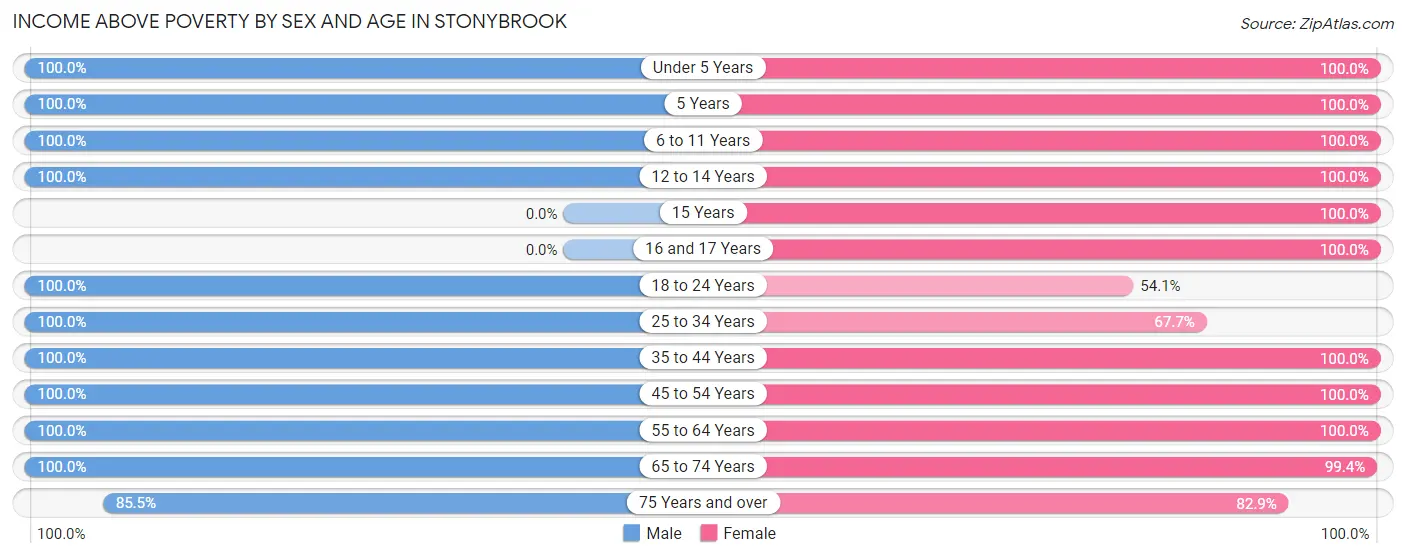
| Age Bracket | Male | Female |
| Under 5 Years | 65 (100.0%) | 81 (100.0%) |
| 5 Years | 17 (100.0%) | 46 (100.0%) |
| 6 to 11 Years | 342 (100.0%) | 150 (100.0%) |
| 12 to 14 Years | 180 (100.0%) | 98 (100.0%) |
| 15 Years | 0 (0.0%) | 10 (100.0%) |
| 16 and 17 Years | 0 (0.0%) | 20 (100.0%) |
| 18 to 24 Years | 44 (100.0%) | 59 (54.1%) |
| 25 to 34 Years | 159 (100.0%) | 107 (67.7%) |
| 35 to 44 Years | 290 (100.0%) | 275 (100.0%) |
| 45 to 54 Years | 288 (100.0%) | 266 (100.0%) |
| 55 to 64 Years | 75 (100.0%) | 123 (100.0%) |
| 65 to 74 Years | 237 (100.0%) | 153 (99.4%) |
| 75 Years and over | 159 (85.5%) | 136 (82.9%) |
| Total | 1,856 (98.6%) | 1,524 (92.1%) |
Income Below Poverty Among Married-Couple Families in Stonybrook
The poverty statistics for married-couple families in Stonybrook show that 3.3% or 27 of the total 818 families live below the poverty line. Families with no children have the highest poverty rate of 9.5%, comprising of 27 families. On the other hand, families with 1 or 2 children have the lowest poverty rate of 0.0%, which includes 0 families.
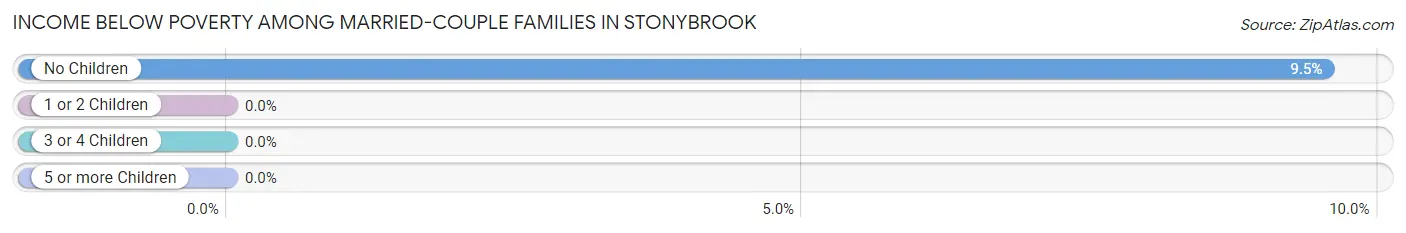
| Children | Above Poverty | Below Poverty |
| No Children | 256 (90.5%) | 27 (9.5%) |
| 1 or 2 Children | 457 (100.0%) | 0 (0.0%) |
| 3 or 4 Children | 78 (100.0%) | 0 (0.0%) |
| 5 or more Children | 0 (0.0%) | 0 (0.0%) |
| Total | 791 (96.7%) | 27 (3.3%) |
Income Below Poverty Among Single-Parent Households in Stonybrook
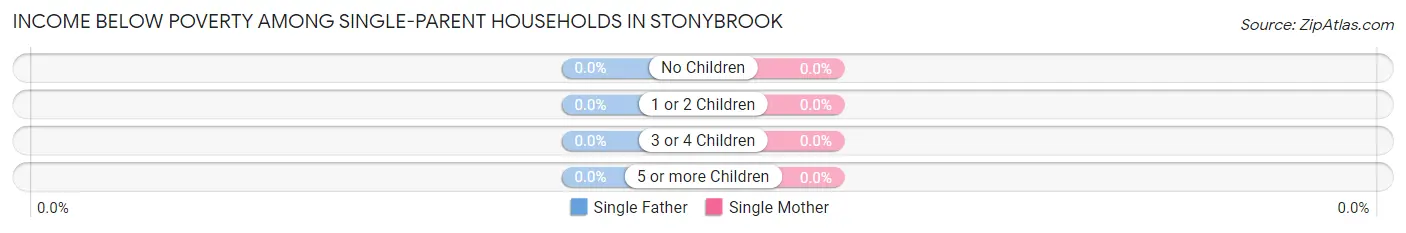
| Children | Single Father | Single Mother |
| No Children | 0 (0.0%) | 0 (0.0%) |
| 1 or 2 Children | 0 (0.0%) | 0 (0.0%) |
| 3 or 4 Children | 0 (0.0%) | 0 (0.0%) |
| 5 or more Children | 0 (0.0%) | 0 (0.0%) |
| Total | 0 (0.0%) | 0 (0.0%) |
Income Below Poverty Among Married-Couple vs Single-Parent Households in Stonybrook
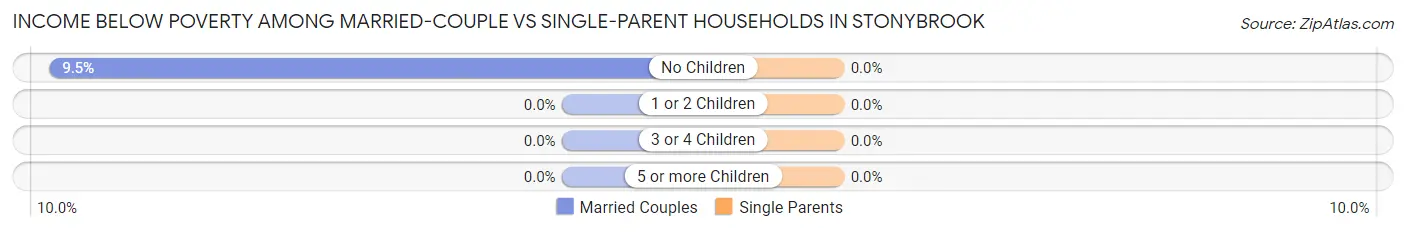
| Children | Married-Couple Families | Single-Parent Households |
| No Children | 27 (9.5%) | 0 (0.0%) |
| 1 or 2 Children | 0 (0.0%) | 0 (0.0%) |
| 3 or 4 Children | 0 (0.0%) | 0 (0.0%) |
| 5 or more Children | 0 (0.0%) | 0 (0.0%) |
| Total | 27 (3.3%) | 0 (0.0%) |
Race in Stonybrook
The most populous races in Stonybrook are White / Caucasian (2,952 | 82.5%), Two or more Races (429 | 12.0%), and Hispanic or Latino (266 | 7.4%).
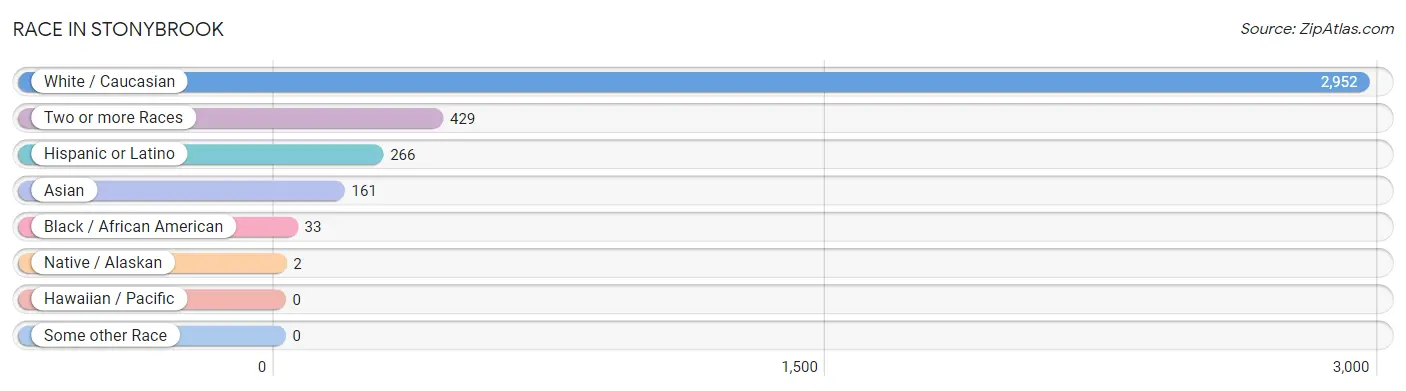
| Race | # Population | % Population |
| Asian | 161 | 4.5% |
| Black / African American | 33 | 0.9% |
| Hawaiian / Pacific | 0 | 0.0% |
| Hispanic or Latino | 266 | 7.4% |
| Native / Alaskan | 2 | 0.1% |
| White / Caucasian | 2,952 | 82.5% |
| Two or more Races | 429 | 12.0% |
| Some other Race | 0 | 0.0% |
| Total | 3,577 | 100.0% |
Ancestry in Stonybrook
The most populous ancestries reported in Stonybrook are Irish (930 | 26.0%), German (899 | 25.1%), Italian (498 | 13.9%), American (245 | 6.9%), and English (234 | 6.5%), together accounting for 78.4% of all Stonybrook residents.
| Ancestry | # Population | % Population |
| African | 102 | 2.9% |
| American | 245 | 6.9% |
| British | 95 | 2.7% |
| Burmese | 9 | 0.3% |
| Cherokee | 2 | 0.1% |
| Creek | 13 | 0.4% |
| Dominican | 96 | 2.7% |
| Dutch | 20 | 0.6% |
| Eastern European | 141 | 3.9% |
| English | 234 | 6.5% |
| European | 159 | 4.4% |
| French | 2 | 0.1% |
| French Canadian | 9 | 0.3% |
| German | 899 | 25.1% |
| Greek | 17 | 0.5% |
| Indian (Asian) | 44 | 1.2% |
| Irish | 930 | 26.0% |
| Italian | 498 | 13.9% |
| Korean | 31 | 0.9% |
| Polish | 192 | 5.4% |
| Portuguese | 102 | 2.9% |
| Puerto Rican | 10 | 0.3% |
| Scotch-Irish | 19 | 0.5% |
| Scottish | 69 | 1.9% |
| Seminole | 13 | 0.4% |
| Slovak | 20 | 0.6% |
| Spaniard | 23 | 0.6% |
| Sri Lankan | 101 | 2.8% |
| Subsaharan African | 102 | 2.9% |
| Swedish | 18 | 0.5% |
| Swiss | 8 | 0.2% |
| Thai | 24 | 0.7% |
| Welsh | 8 | 0.2% | View All 33 Rows |
Immigrants in Stonybrook
The most numerous immigrant groups reported in Stonybrook came from Asia (122 | 3.4%), South Eastern Asia (69 | 1.9%), Eastern Asia (53 | 1.5%), China (44 | 1.2%), and Cambodia (30 | 0.8%), together accounting for 8.9% of all Stonybrook residents.
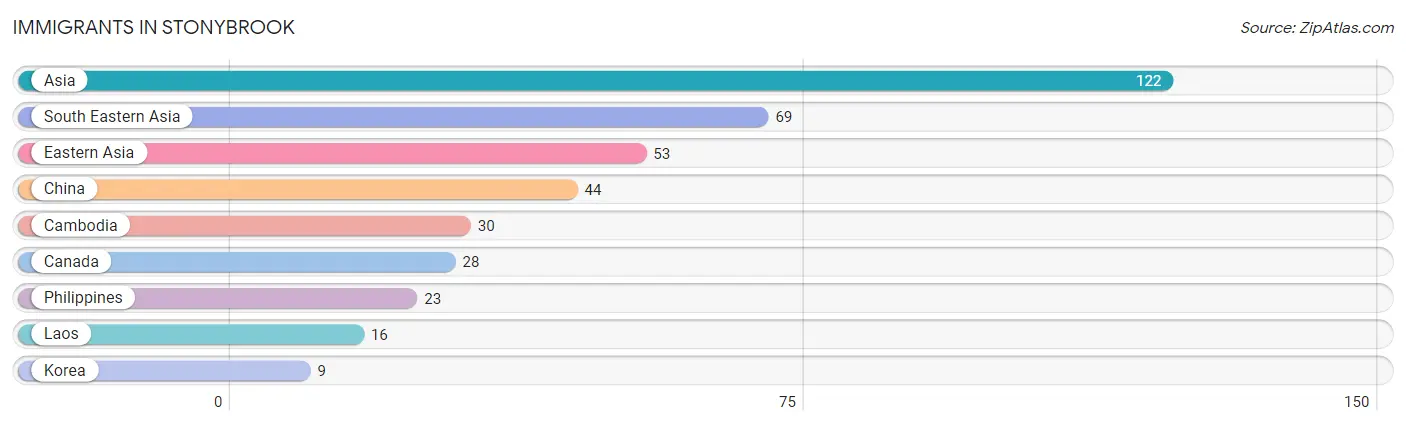
| Immigration Origin | # Population | % Population |
| Asia | 122 | 3.4% |
| Cambodia | 30 | 0.8% |
| Canada | 28 | 0.8% |
| China | 44 | 1.2% |
| Eastern Asia | 53 | 1.5% |
| Korea | 9 | 0.3% |
| Laos | 16 | 0.4% |
| Philippines | 23 | 0.6% |
| South Eastern Asia | 69 | 1.9% | View All 9 Rows |
Sex and Age in Stonybrook
Sex and Age in Stonybrook
The most populous age groups in Stonybrook are 10 to 14 Years (400 | 21.2%) for men and 45 to 49 Years (232 | 13.7%) for women.
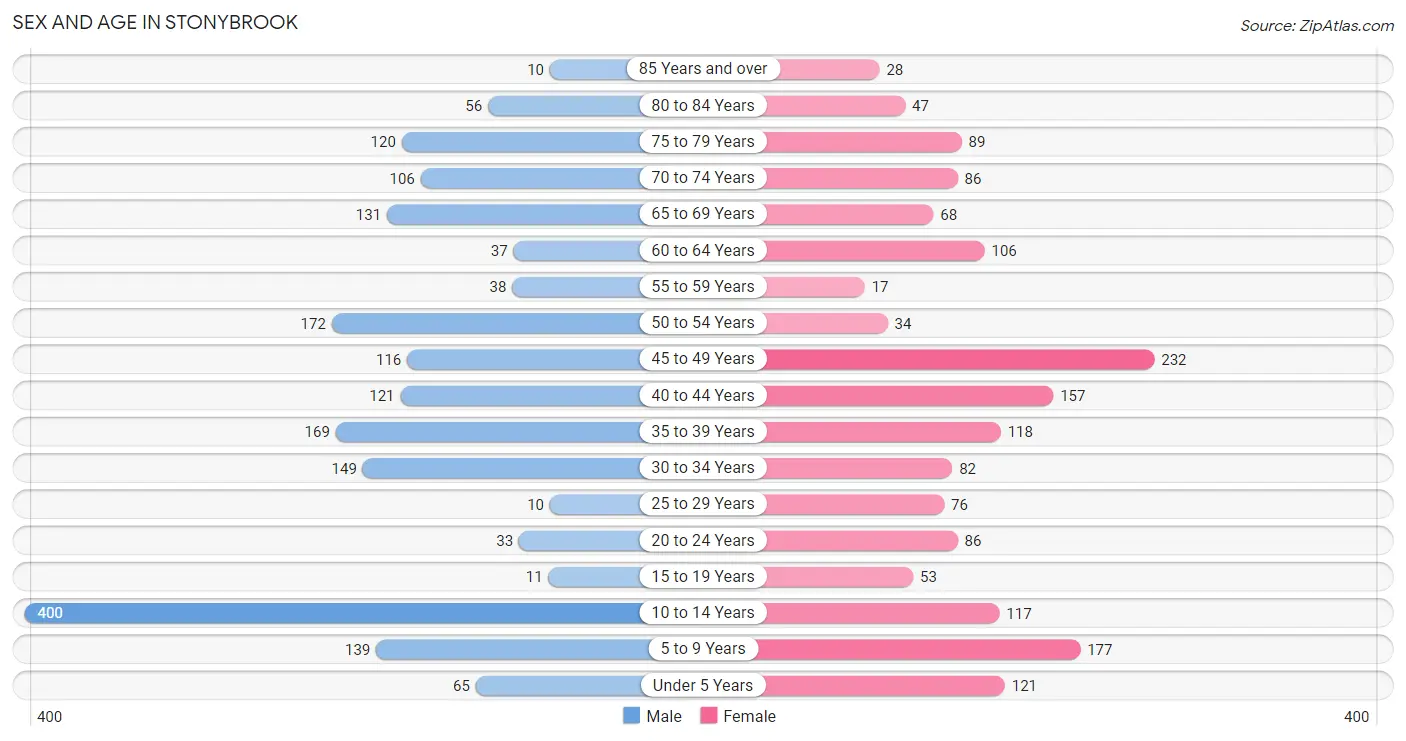
| Age Bracket | Male | Female |
| Under 5 Years | 65 (3.5%) | 121 (7.1%) |
| 5 to 9 Years | 139 (7.4%) | 177 (10.4%) |
| 10 to 14 Years | 400 (21.2%) | 117 (6.9%) |
| 15 to 19 Years | 11 (0.6%) | 53 (3.1%) |
| 20 to 24 Years | 33 (1.8%) | 86 (5.1%) |
| 25 to 29 Years | 10 (0.5%) | 76 (4.5%) |
| 30 to 34 Years | 149 (7.9%) | 82 (4.8%) |
| 35 to 39 Years | 169 (9.0%) | 118 (7.0%) |
| 40 to 44 Years | 121 (6.4%) | 157 (9.3%) |
| 45 to 49 Years | 116 (6.2%) | 232 (13.7%) |
| 50 to 54 Years | 172 (9.1%) | 34 (2.0%) |
| 55 to 59 Years | 38 (2.0%) | 17 (1.0%) |
| 60 to 64 Years | 37 (2.0%) | 106 (6.3%) |
| 65 to 69 Years | 131 (7.0%) | 68 (4.0%) |
| 70 to 74 Years | 106 (5.6%) | 86 (5.1%) |
| 75 to 79 Years | 120 (6.4%) | 89 (5.2%) |
| 80 to 84 Years | 56 (3.0%) | 47 (2.8%) |
| 85 Years and over | 10 (0.5%) | 28 (1.7%) |
| Total | 1,883 (100.0%) | 1,694 (100.0%) |
Families and Households in Stonybrook
Median Family Size in Stonybrook
The median family size in Stonybrook is 3.33 persons per family, with married-couple families (818 | 86.7%) accounting for the largest median family size of 3.45 persons per family. On the other hand, single male/father families (83 | 8.8%) represent the smallest median family size with 2.51 persons per family.
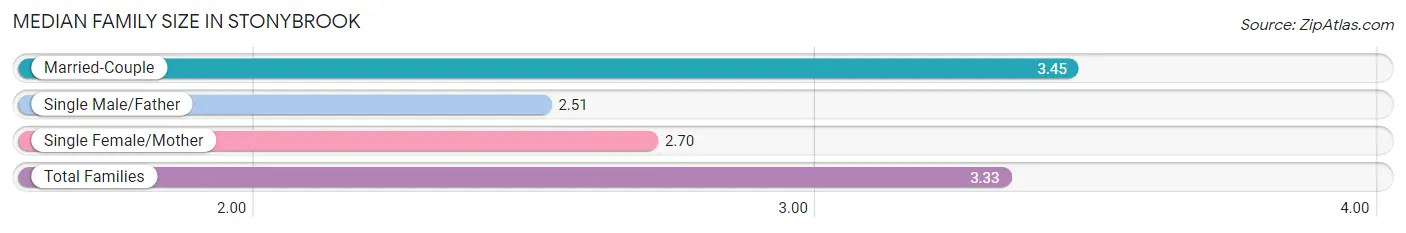
| Family Type | # Families | Family Size |
| Married-Couple | 818 (86.7%) | 3.45 |
| Single Male/Father | 83 (8.8%) | 2.51 |
| Single Female/Mother | 43 (4.6%) | 2.70 |
| Total Families | 944 (100.0%) | 3.33 |
Median Household Size in Stonybrook
The median household size in Stonybrook is 2.96 persons per household, with married-couple households (818 | 67.8%) accounting for the largest median household size of 3.45 persons per household. non-family households (263 | 21.8%) represent the smallest median household size with 1.40 persons per household.
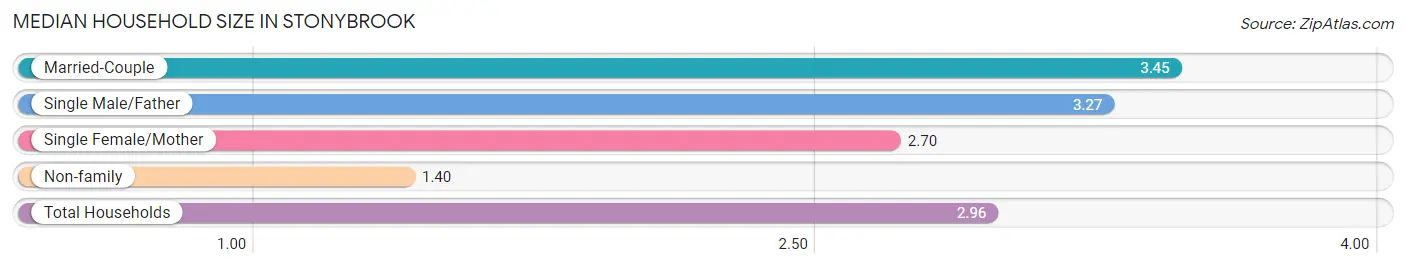
| Household Type | # Households | Household Size |
| Married-Couple | 818 (67.8%) | 3.45 |
| Single Male/Father | 83 (6.9%) | 3.27 |
| Single Female/Mother | 43 (3.6%) | 2.70 |
| Non-family | 263 (21.8%) | 1.40 |
| Total Households | 1,207 (100.0%) | 2.96 |
Household Size by Marriage Status in Stonybrook
Out of a total of 1,207 households in Stonybrook, 944 (78.2%) are family households, while 263 (21.8%) are nonfamily households. The most numerous type of family households are 2-person households, comprising 300, and the most common type of nonfamily households are 1-person households, comprising 152.
| Household Size | Family Households | Nonfamily Households |
| 1-Person Households | - | 152 (12.6%) |
| 2-Person Households | 300 (24.9%) | 15 (1.2%) |
| 3-Person Households | 161 (13.3%) | 96 (8.0%) |
| 4-Person Households | 174 (14.4%) | 0 (0.0%) |
| 5-Person Households | 106 (8.8%) | 0 (0.0%) |
| 6-Person Households | 169 (14.0%) | 0 (0.0%) |
| 7+ Person Households | 34 (2.8%) | 0 (0.0%) |
| Total | 944 (78.2%) | 263 (21.8%) |
Female Fertility in Stonybrook
Fertility by Age in Stonybrook
Average fertility rate in Stonybrook is 63.0 births per 1,000 women. Women in the age bracket of 20 to 34 years have the highest fertility rate with 209.0 births per 1,000 women. Women in the age bracket of 20 to 34 years acount for 100.0% of all women with births.
| Age Bracket | Women with Births | Births / 1,000 Women |
| 15 to 19 years | 0 (0.0%) | 0.0 |
| 20 to 34 years | 51 (100.0%) | 209.0 |
| 35 to 50 years | 0 (0.0%) | 0.0 |
| Total | 51 (100.0%) | 63.0 |
Fertility by Age by Marriage Status in Stonybrook
| Age Bracket | Married | Unmarried |
| 15 to 19 years | 0 (0.0%) | 0 (0.0%) |
| 20 to 34 years | 0 (0.0%) | 51 (100.0%) |
| 35 to 50 years | 0 (0.0%) | 0 (0.0%) |
| Total | 0 (0.0%) | 51 (100.0%) |
Fertility by Education in Stonybrook
| Educational Attainment | Women with Births | Births / 1,000 Women |
| Less than High School | 0 (0.0%) | 0.0 |
| High School Diploma | 0 (0.0%) | 0.0 |
| College or Associate's Degree | 51 (100.0%) | 210.0 |
| Bachelor's Degree | 0 (0.0%) | 0.0 |
| Graduate Degree | 0 (0.0%) | 0.0 |
| Total | 51 (100.0%) | 63.0 |
Fertility by Education by Marriage Status in Stonybrook
| Educational Attainment | Married | Unmarried |
| Less than High School | 0 (0.0%) | 0 (0.0%) |
| High School Diploma | 0 (0.0%) | 0 (0.0%) |
| College or Associate's Degree | 0 (0.0%) | 51 (100.0%) |
| Bachelor's Degree | 0 (0.0%) | 0 (0.0%) |
| Graduate Degree | 0 (0.0%) | 0 (0.0%) |
| Total | 0 (0.0%) | 51 (100.0%) |
Employment Characteristics in Stonybrook
Employment by Class of Employer in Stonybrook
Among the 1,579 employed individuals in Stonybrook, private company employees (942 | 59.7%), not-for-profit organizations (277 | 17.5%), and local government employees (133 | 8.4%) make up the most common classes of employment.
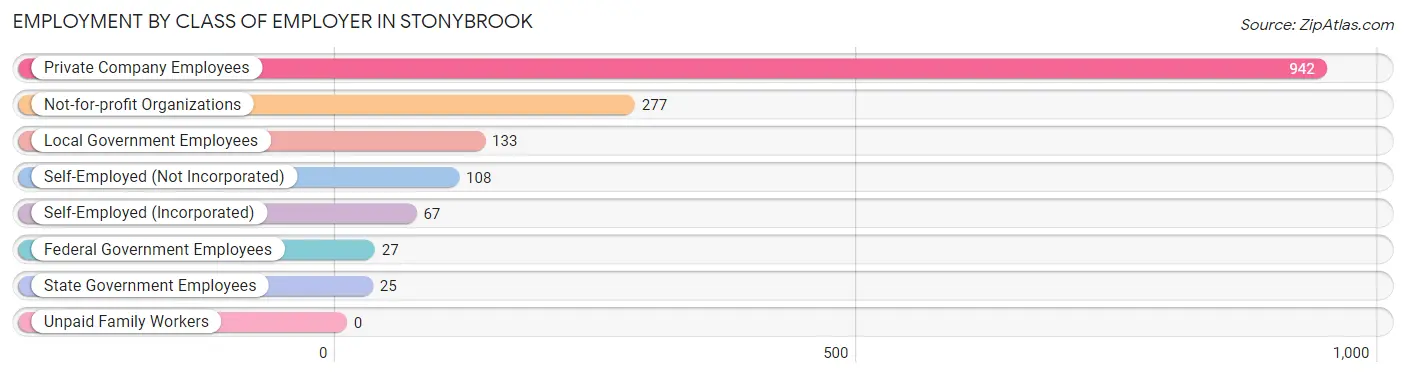
| Employer Class | # Employees | % Employees |
| Private Company Employees | 942 | 59.7% |
| Self-Employed (Incorporated) | 67 | 4.2% |
| Self-Employed (Not Incorporated) | 108 | 6.8% |
| Not-for-profit Organizations | 277 | 17.5% |
| Local Government Employees | 133 | 8.4% |
| State Government Employees | 25 | 1.6% |
| Federal Government Employees | 27 | 1.7% |
| Unpaid Family Workers | 0 | 0.0% |
| Total | 1,579 | 100.0% |
Employment Status by Age in Stonybrook
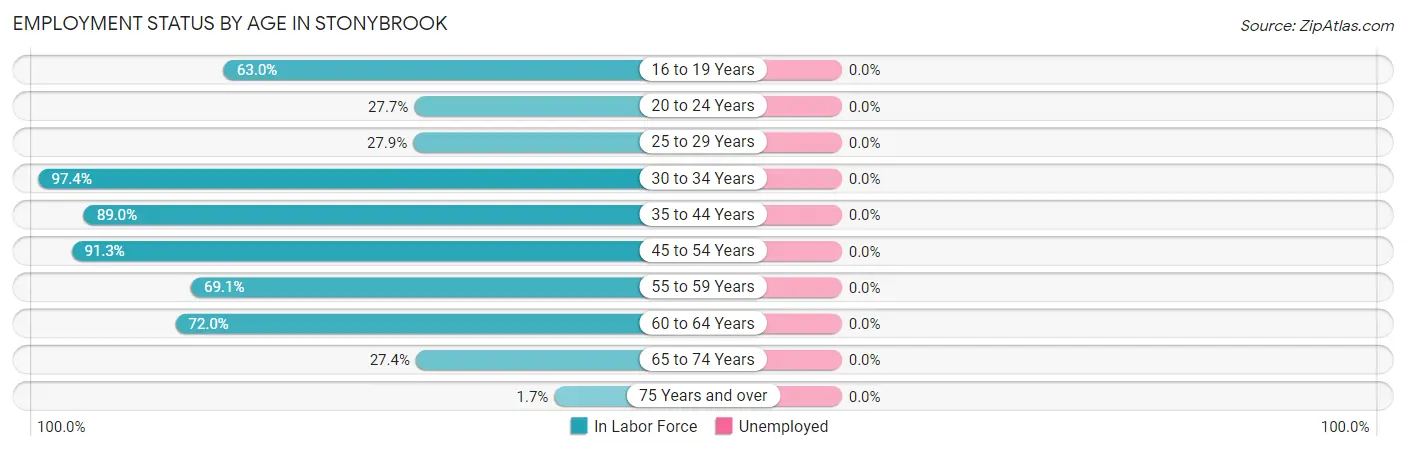
| Age Bracket | In Labor Force | Unemployed |
| 16 to 19 Years | 34 (63.0%) | 0 (0.0%) |
| 20 to 24 Years | 33 (27.7%) | 0 (0.0%) |
| 25 to 29 Years | 24 (27.9%) | 0 (0.0%) |
| 30 to 34 Years | 225 (97.4%) | 0 (0.0%) |
| 35 to 44 Years | 503 (89.0%) | 0 (0.0%) |
| 45 to 54 Years | 506 (91.3%) | 0 (0.0%) |
| 55 to 59 Years | 38 (69.1%) | 0 (0.0%) |
| 60 to 64 Years | 103 (72.0%) | 0 (0.0%) |
| 65 to 74 Years | 107 (27.4%) | 0 (0.0%) |
| 75 Years and over | 6 (1.7%) | 0 (0.0%) |
| Total | 1,580 (62.0%) | 0 (0.0%) |
Employment Status by Educational Attainment in Stonybrook
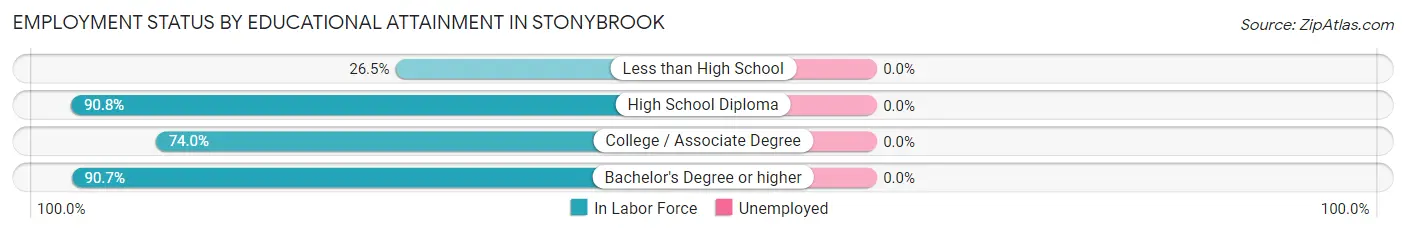
| Educational Attainment | In Labor Force | Unemployed |
| Less than High School | 9 (26.5%) | 0 (0.0%) |
| High School Diploma | 344 (90.8%) | 0 (0.0%) |
| College / Associate Degree | 273 (74.0%) | 0 (0.0%) |
| Bachelor's Degree or higher | 773 (90.7%) | 0 (0.0%) |
| Total | 1,399 (85.6%) | 0 (0.0%) |
Employment Occupations by Sex in Stonybrook
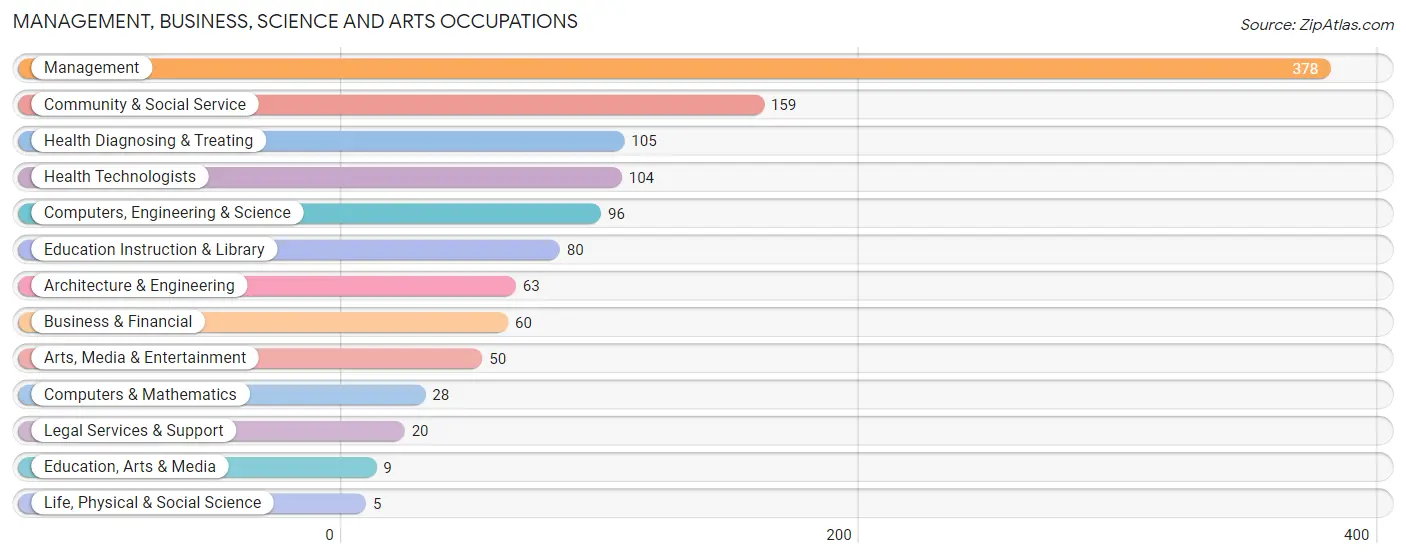
Management, Business, Science and Arts Occupations
The most common Management, Business, Science and Arts occupations in Stonybrook are Management (378 | 23.9%), Community & Social Service (159 | 10.1%), Health Diagnosing & Treating (105 | 6.7%), Health Technologists (104 | 6.6%), and Computers, Engineering & Science (96 | 6.1%).
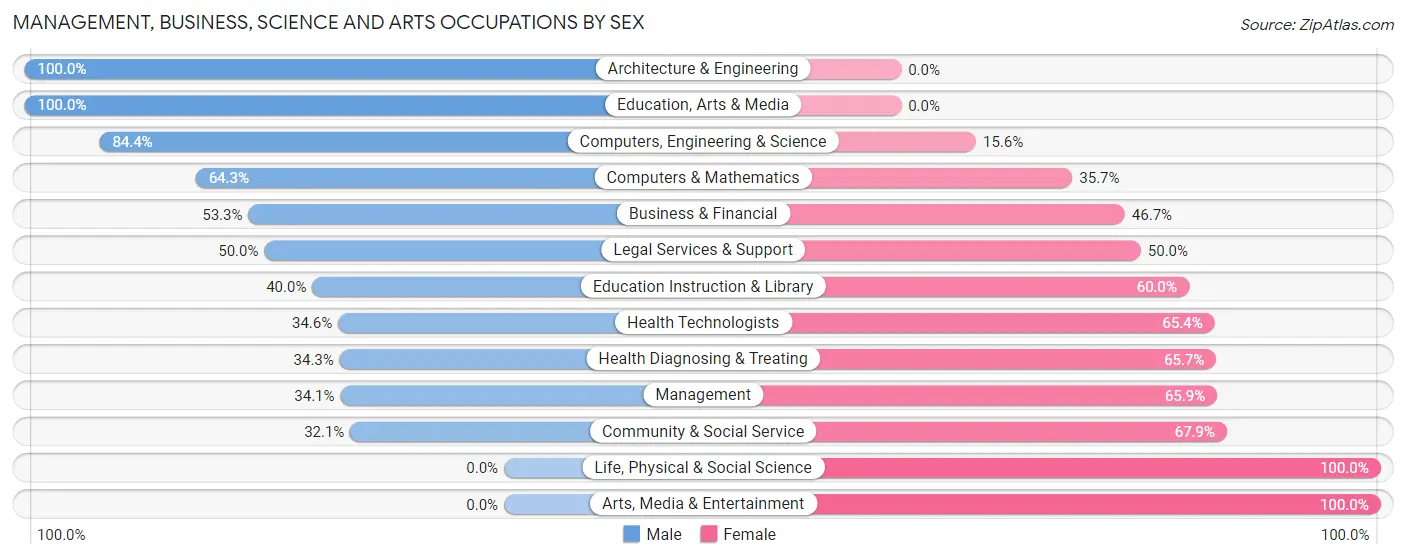
Management, Business, Science and Arts Occupations by Sex
Within the Management, Business, Science and Arts occupations in Stonybrook, the most male-oriented occupations are Architecture & Engineering (100.0%), Education, Arts & Media (100.0%), and Computers, Engineering & Science (84.4%), while the most female-oriented occupations are Life, Physical & Social Science (100.0%), Arts, Media & Entertainment (100.0%), and Community & Social Service (67.9%).
| Occupation | Male | Female |
| Management | 129 (34.1%) | 249 (65.9%) |
| Business & Financial | 32 (53.3%) | 28 (46.7%) |
| Computers, Engineering & Science | 81 (84.4%) | 15 (15.6%) |
| Computers & Mathematics | 18 (64.3%) | 10 (35.7%) |
| Architecture & Engineering | 63 (100.0%) | 0 (0.0%) |
| Life, Physical & Social Science | 0 (0.0%) | 5 (100.0%) |
| Community & Social Service | 51 (32.1%) | 108 (67.9%) |
| Education, Arts & Media | 9 (100.0%) | 0 (0.0%) |
| Legal Services & Support | 10 (50.0%) | 10 (50.0%) |
| Education Instruction & Library | 32 (40.0%) | 48 (60.0%) |
| Arts, Media & Entertainment | 0 (0.0%) | 50 (100.0%) |
| Health Diagnosing & Treating | 36 (34.3%) | 69 (65.7%) |
| Health Technologists | 36 (34.6%) | 68 (65.4%) |
| Total (Category) | 329 (41.2%) | 469 (58.8%) |
| Total (Overall) | 919 (58.2%) | 660 (41.8%) |
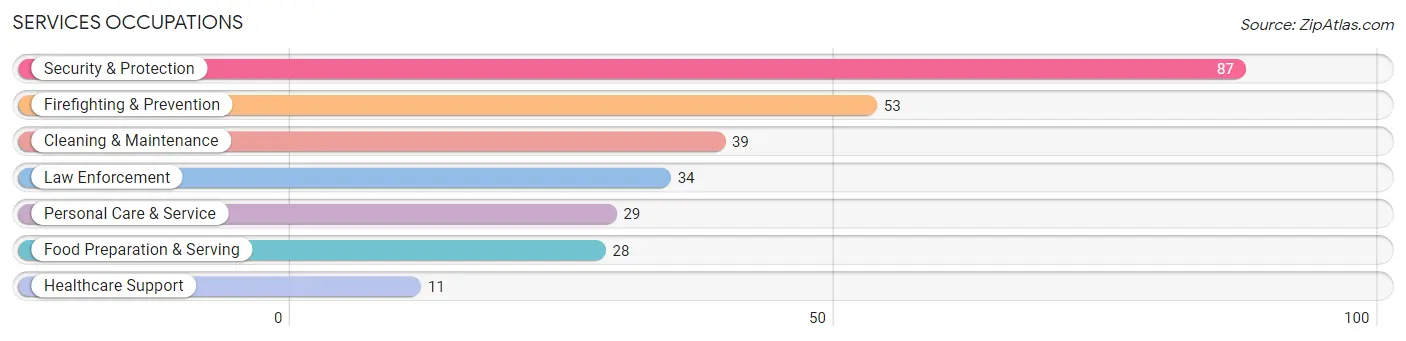
Services Occupations
The most common Services occupations in Stonybrook are Security & Protection (87 | 5.5%), Firefighting & Prevention (53 | 3.4%), Cleaning & Maintenance (39 | 2.5%), Law Enforcement (34 | 2.1%), and Personal Care & Service (29 | 1.8%).
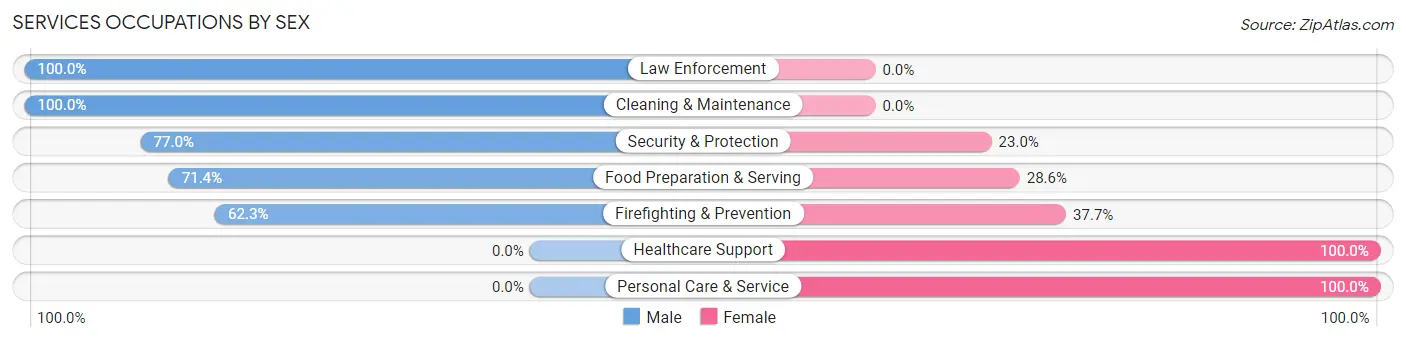
Services Occupations by Sex
Within the Services occupations in Stonybrook, the most male-oriented occupations are Law Enforcement (100.0%), Cleaning & Maintenance (100.0%), and Security & Protection (77.0%), while the most female-oriented occupations are Healthcare Support (100.0%), Personal Care & Service (100.0%), and Firefighting & Prevention (37.7%).
| Occupation | Male | Female |
| Healthcare Support | 0 (0.0%) | 11 (100.0%) |
| Security & Protection | 67 (77.0%) | 20 (23.0%) |
| Firefighting & Prevention | 33 (62.3%) | 20 (37.7%) |
| Law Enforcement | 34 (100.0%) | 0 (0.0%) |
| Food Preparation & Serving | 20 (71.4%) | 8 (28.6%) |
| Cleaning & Maintenance | 39 (100.0%) | 0 (0.0%) |
| Personal Care & Service | 0 (0.0%) | 29 (100.0%) |
| Total (Category) | 126 (64.9%) | 68 (35.0%) |
| Total (Overall) | 919 (58.2%) | 660 (41.8%) |
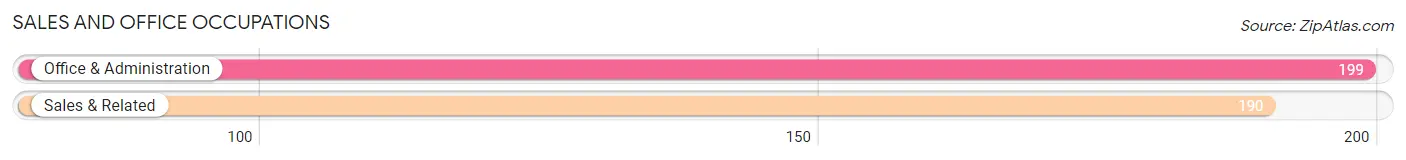
Sales and Office Occupations
The most common Sales and Office occupations in Stonybrook are Office & Administration (199 | 12.6%), and Sales & Related (190 | 12.0%).
Sales and Office Occupations by Sex
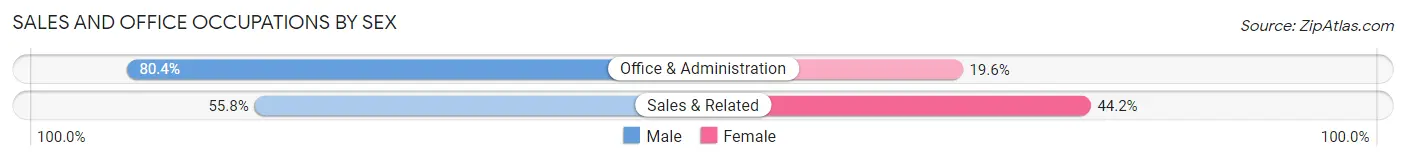
| Occupation | Male | Female |
| Sales & Related | 106 (55.8%) | 84 (44.2%) |
| Office & Administration | 160 (80.4%) | 39 (19.6%) |
| Total (Category) | 266 (68.4%) | 123 (31.6%) |
| Total (Overall) | 919 (58.2%) | 660 (41.8%) |
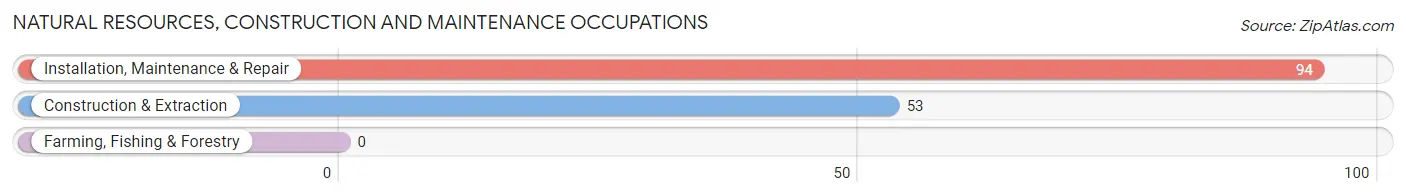
Natural Resources, Construction and Maintenance Occupations
The most common Natural Resources, Construction and Maintenance occupations in Stonybrook are Installation, Maintenance & Repair (94 | 5.9%), and Construction & Extraction (53 | 3.4%).
Natural Resources, Construction and Maintenance Occupations by Sex
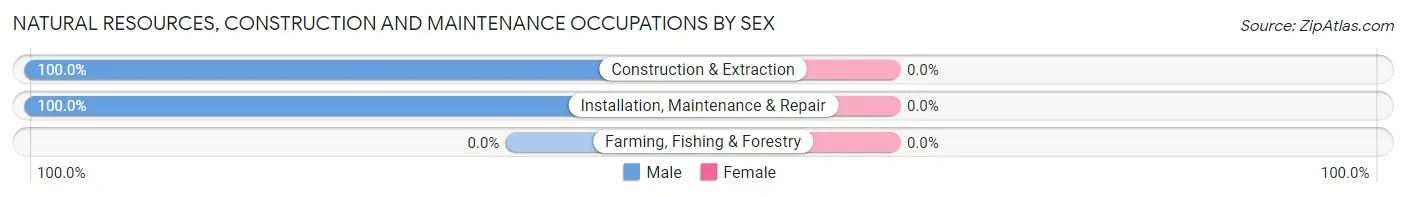
| Occupation | Male | Female |
| Farming, Fishing & Forestry | 0 (0.0%) | 0 (0.0%) |
| Construction & Extraction | 53 (100.0%) | 0 (0.0%) |
| Installation, Maintenance & Repair | 94 (100.0%) | 0 (0.0%) |
| Total (Category) | 147 (100.0%) | 0 (0.0%) |
| Total (Overall) | 919 (58.2%) | 660 (41.8%) |
Production, Transportation and Moving Occupations
The most common Production, Transportation and Moving occupations in Stonybrook are Production (33 | 2.1%), Material Moving (10 | 0.6%), and Transportation (8 | 0.5%).
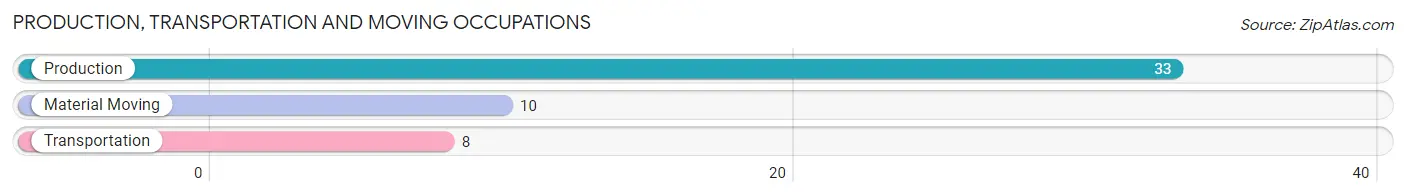
Production, Transportation and Moving Occupations by Sex
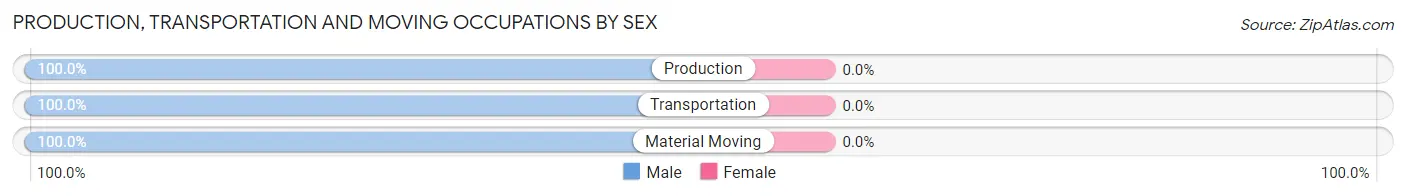
| Occupation | Male | Female |
| Production | 33 (100.0%) | 0 (0.0%) |
| Transportation | 8 (100.0%) | 0 (0.0%) |
| Material Moving | 10 (100.0%) | 0 (0.0%) |
| Total (Category) | 51 (100.0%) | 0 (0.0%) |
| Total (Overall) | 919 (58.2%) | 660 (41.8%) |
Employment Industries by Sex in Stonybrook
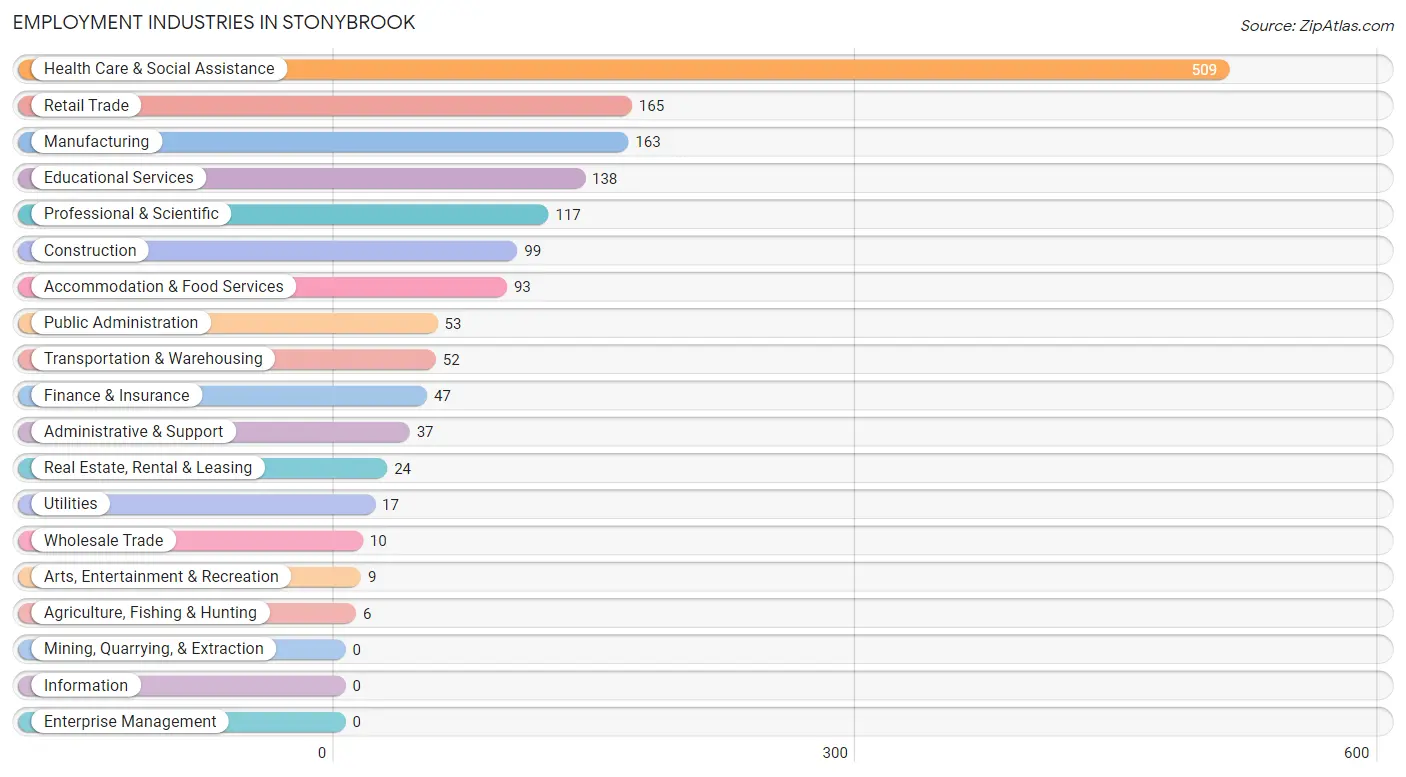
Employment Industries in Stonybrook
The major employment industries in Stonybrook include Health Care & Social Assistance (509 | 32.2%), Retail Trade (165 | 10.4%), Manufacturing (163 | 10.3%), Educational Services (138 | 8.7%), and Professional & Scientific (117 | 7.4%).
Employment Industries by Sex in Stonybrook
The Stonybrook industries that see more men than women are Agriculture, Fishing & Hunting (100.0%), Construction (100.0%), and Wholesale Trade (100.0%), whereas the industries that tend to have a higher number of women are Real Estate, Rental & Leasing (100.0%), Arts, Entertainment & Recreation (100.0%), and Finance & Insurance (80.8%).
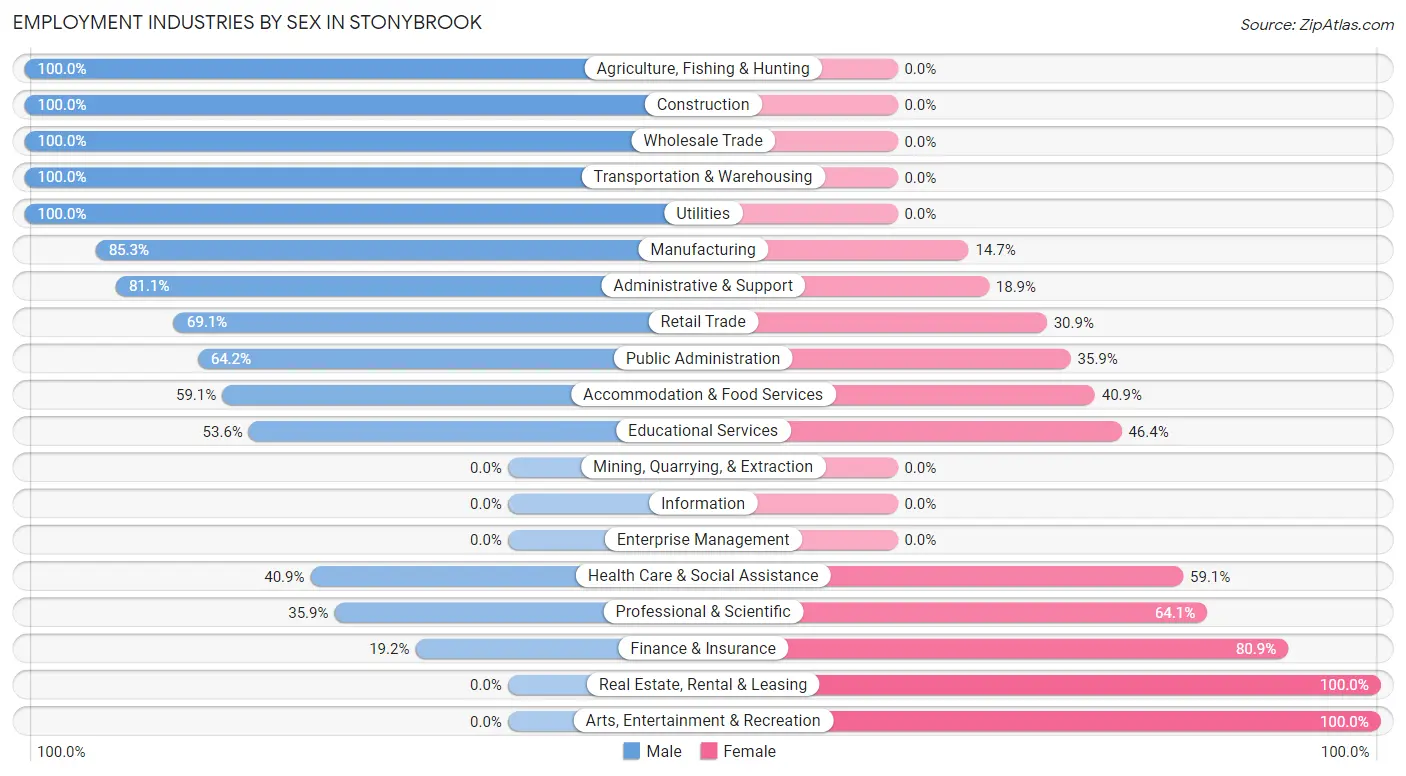
| Industry | Male | Female |
| Agriculture, Fishing & Hunting | 6 (100.0%) | 0 (0.0%) |
| Mining, Quarrying, & Extraction | 0 (0.0%) | 0 (0.0%) |
| Construction | 99 (100.0%) | 0 (0.0%) |
| Manufacturing | 139 (85.3%) | 24 (14.7%) |
| Wholesale Trade | 10 (100.0%) | 0 (0.0%) |
| Retail Trade | 114 (69.1%) | 51 (30.9%) |
| Transportation & Warehousing | 52 (100.0%) | 0 (0.0%) |
| Utilities | 17 (100.0%) | 0 (0.0%) |
| Information | 0 (0.0%) | 0 (0.0%) |
| Finance & Insurance | 9 (19.2%) | 38 (80.8%) |
| Real Estate, Rental & Leasing | 0 (0.0%) | 24 (100.0%) |
| Professional & Scientific | 42 (35.9%) | 75 (64.1%) |
| Enterprise Management | 0 (0.0%) | 0 (0.0%) |
| Administrative & Support | 30 (81.1%) | 7 (18.9%) |
| Educational Services | 74 (53.6%) | 64 (46.4%) |
| Health Care & Social Assistance | 208 (40.9%) | 301 (59.1%) |
| Arts, Entertainment & Recreation | 0 (0.0%) | 9 (100.0%) |
| Accommodation & Food Services | 55 (59.1%) | 38 (40.9%) |
| Public Administration | 34 (64.1%) | 19 (35.8%) |
| Total | 919 (58.2%) | 660 (41.8%) |
Education in Stonybrook
School Enrollment in Stonybrook
The most common levels of schooling among the 934 students in Stonybrook are middle school (410 | 43.9%), elementary school (241 | 25.8%), and kindergarten (100 | 10.7%).
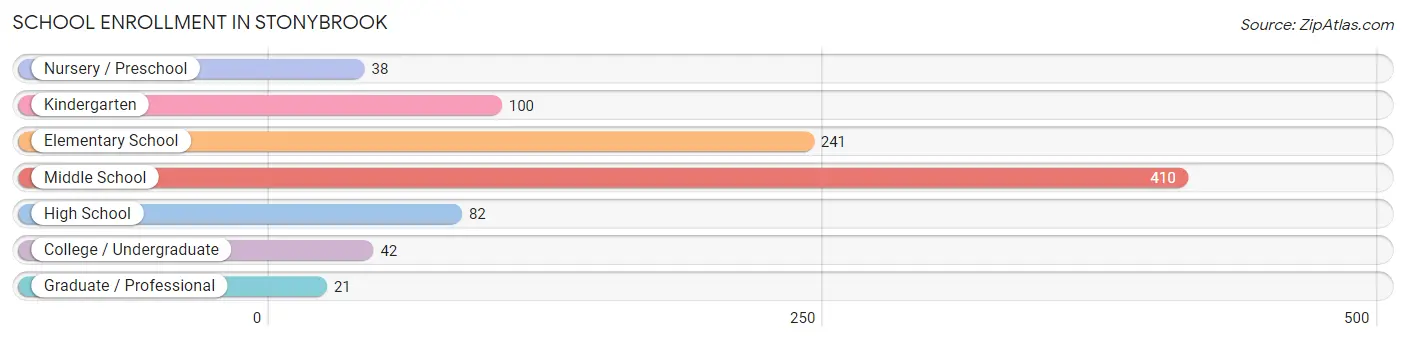
| School Level | # Students | % Students |
| Nursery / Preschool | 38 | 4.1% |
| Kindergarten | 100 | 10.7% |
| Elementary School | 241 | 25.8% |
| Middle School | 410 | 43.9% |
| High School | 82 | 8.8% |
| College / Undergraduate | 42 | 4.5% |
| Graduate / Professional | 21 | 2.2% |
| Total | 934 | 100.0% |
School Enrollment by Age by Funding Source in Stonybrook
Out of a total of 934 students who are enrolled in schools in Stonybrook, 297 (31.8%) attend a private institution, while the remaining 637 (68.2%) are enrolled in public schools. The age group of 20 to 24 year olds has the highest likelihood of being enrolled in private schools, with 36 (100.0% in the age bracket) enrolled. Conversely, the age group of 18 to 19 year olds has the lowest likelihood of being enrolled in a private school, with 26 (100.0% in the age bracket) attending a public institution.
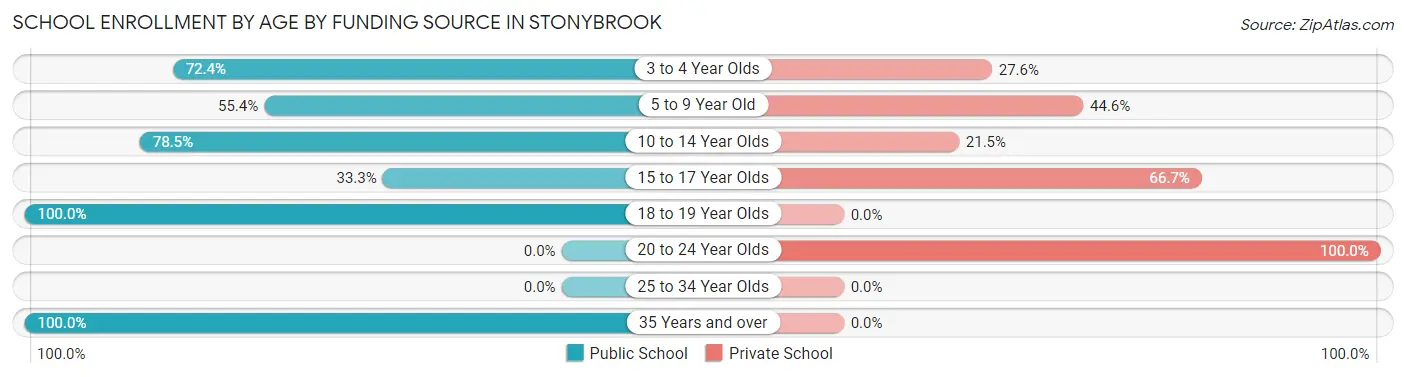
| Age Bracket | Public School | Private School |
| 3 to 4 Year Olds | 21 (72.4%) | 8 (27.6%) |
| 5 to 9 Year Old | 154 (55.4%) | 124 (44.6%) |
| 10 to 14 Year Olds | 399 (78.5%) | 109 (21.5%) |
| 15 to 17 Year Olds | 10 (33.3%) | 20 (66.7%) |
| 18 to 19 Year Olds | 26 (100.0%) | 0 (0.0%) |
| 20 to 24 Year Olds | 0 (0.0%) | 36 (100.0%) |
| 25 to 34 Year Olds | 0 (0.0%) | 0 (0.0%) |
| 35 Years and over | 27 (100.0%) | 0 (0.0%) |
| Total | 637 (68.2%) | 297 (31.8%) |
Educational Attainment by Field of Study in Stonybrook
Education (249 | 24.2%), arts & humanities (207 | 20.2%), business (130 | 12.7%), science & technology (122 | 11.9%), and communications (99 | 9.6%) are the most common fields of study among 1,027 individuals in Stonybrook who have obtained a bachelor's degree or higher.
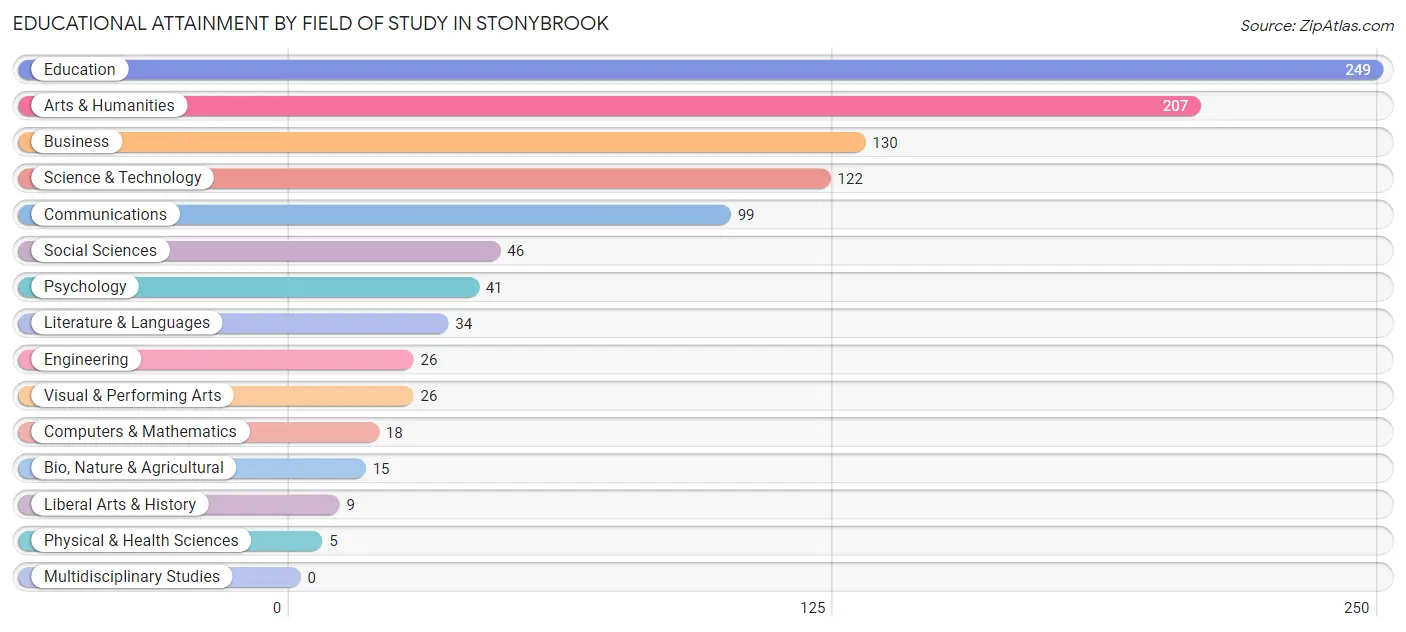
| Field of Study | # Graduates | % Graduates |
| Computers & Mathematics | 18 | 1.8% |
| Bio, Nature & Agricultural | 15 | 1.5% |
| Physical & Health Sciences | 5 | 0.5% |
| Psychology | 41 | 4.0% |
| Social Sciences | 46 | 4.5% |
| Engineering | 26 | 2.5% |
| Multidisciplinary Studies | 0 | 0.0% |
| Science & Technology | 122 | 11.9% |
| Business | 130 | 12.7% |
| Education | 249 | 24.2% |
| Literature & Languages | 34 | 3.3% |
| Liberal Arts & History | 9 | 0.9% |
| Visual & Performing Arts | 26 | 2.5% |
| Communications | 99 | 9.6% |
| Arts & Humanities | 207 | 20.2% |
| Total | 1,027 | 100.0% |
Transportation & Commute in Stonybrook
Vehicle Availability by Sex in Stonybrook
The most prevalent vehicle ownership categories in Stonybrook are males with 2 vehicles (401, accounting for 43.6%) and females with 2 vehicles (281, making up 60.8%).
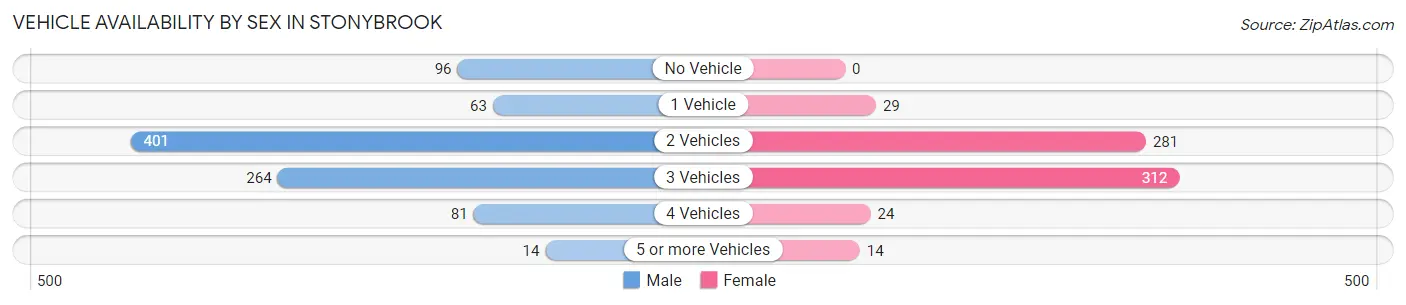
| Vehicles Available | Male | Female |
| No Vehicle | 96 (10.4%) | 0 (0.0%) |
| 1 Vehicle | 63 (6.9%) | 29 (4.4%) |
| 2 Vehicles | 401 (43.6%) | 281 (42.6%) |
| 3 Vehicles | 264 (28.7%) | 312 (47.3%) |
| 4 Vehicles | 81 (8.8%) | 24 (3.6%) |
| 5 or more Vehicles | 14 (1.5%) | 14 (2.1%) |
| Total | 919 (100.0%) | 660 (100.0%) |
Commute Time in Stonybrook
The most frequently occuring commute durations in Stonybrook are 15 to 19 minutes (396 commuters, 27.7%), 20 to 24 minutes (316 commuters, 22.1%), and 10 to 14 minutes (203 commuters, 14.2%).
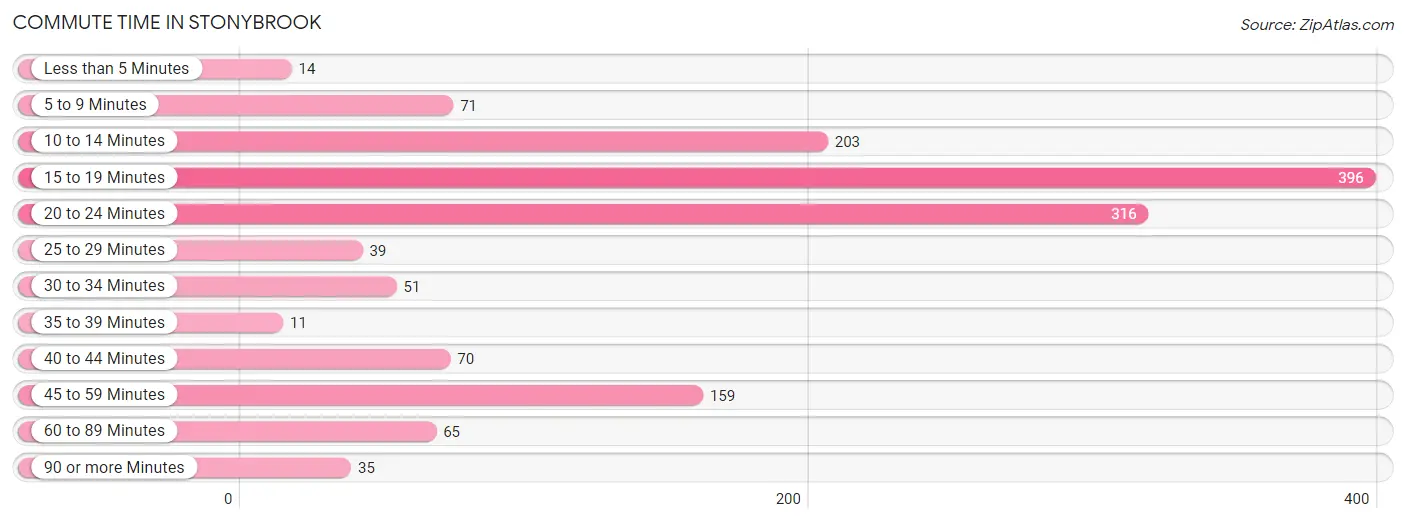
| Commute Time | # Commuters | % Commuters |
| Less than 5 Minutes | 14 | 1.0% |
| 5 to 9 Minutes | 71 | 5.0% |
| 10 to 14 Minutes | 203 | 14.2% |
| 15 to 19 Minutes | 396 | 27.7% |
| 20 to 24 Minutes | 316 | 22.1% |
| 25 to 29 Minutes | 39 | 2.7% |
| 30 to 34 Minutes | 51 | 3.6% |
| 35 to 39 Minutes | 11 | 0.8% |
| 40 to 44 Minutes | 70 | 4.9% |
| 45 to 59 Minutes | 159 | 11.1% |
| 60 to 89 Minutes | 65 | 4.5% |
| 90 or more Minutes | 35 | 2.5% |
Commute Time by Sex in Stonybrook
The most common commute times in Stonybrook are 15 to 19 minutes (283 commuters, 33.6%) for males and 20 to 24 minutes (255 commuters, 43.4%) for females.
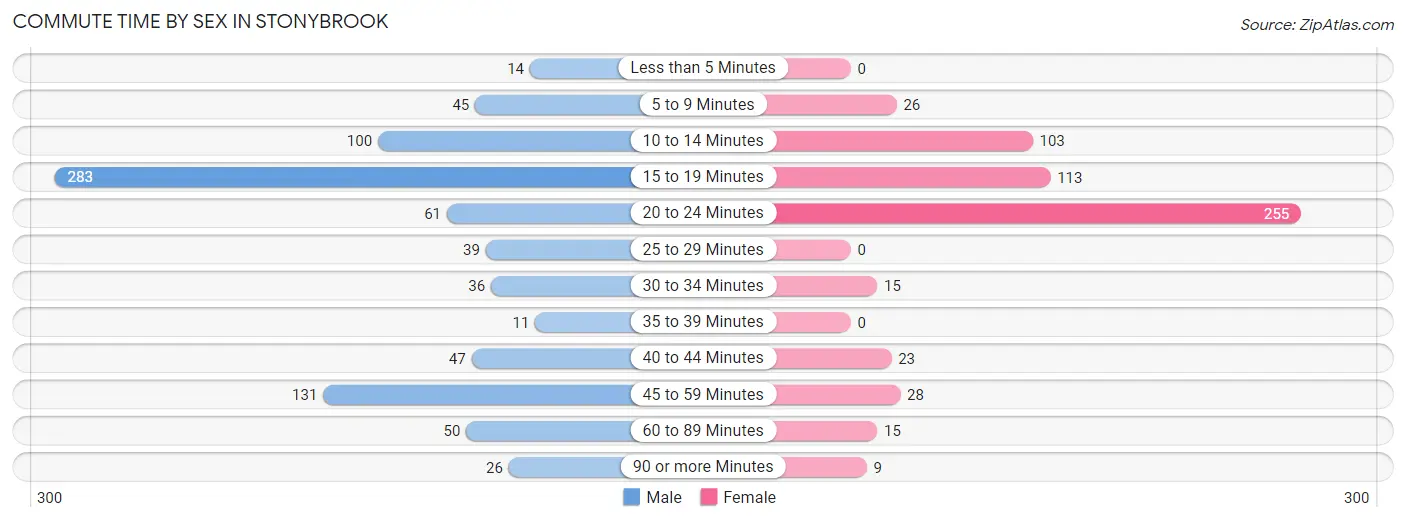
| Commute Time | Male | Female |
| Less than 5 Minutes | 14 (1.7%) | 0 (0.0%) |
| 5 to 9 Minutes | 45 (5.3%) | 26 (4.4%) |
| 10 to 14 Minutes | 100 (11.9%) | 103 (17.5%) |
| 15 to 19 Minutes | 283 (33.6%) | 113 (19.3%) |
| 20 to 24 Minutes | 61 (7.2%) | 255 (43.4%) |
| 25 to 29 Minutes | 39 (4.6%) | 0 (0.0%) |
| 30 to 34 Minutes | 36 (4.3%) | 15 (2.6%) |
| 35 to 39 Minutes | 11 (1.3%) | 0 (0.0%) |
| 40 to 44 Minutes | 47 (5.6%) | 23 (3.9%) |
| 45 to 59 Minutes | 131 (15.5%) | 28 (4.8%) |
| 60 to 89 Minutes | 50 (5.9%) | 15 (2.6%) |
| 90 or more Minutes | 26 (3.1%) | 9 (1.5%) |
Time of Departure to Work by Sex in Stonybrook
The most frequent times of departure to work in Stonybrook are 8:30 AM to 8:59 AM (189, 22.4%) for males and 8:00 AM to 8:29 AM (199, 33.9%) for females.
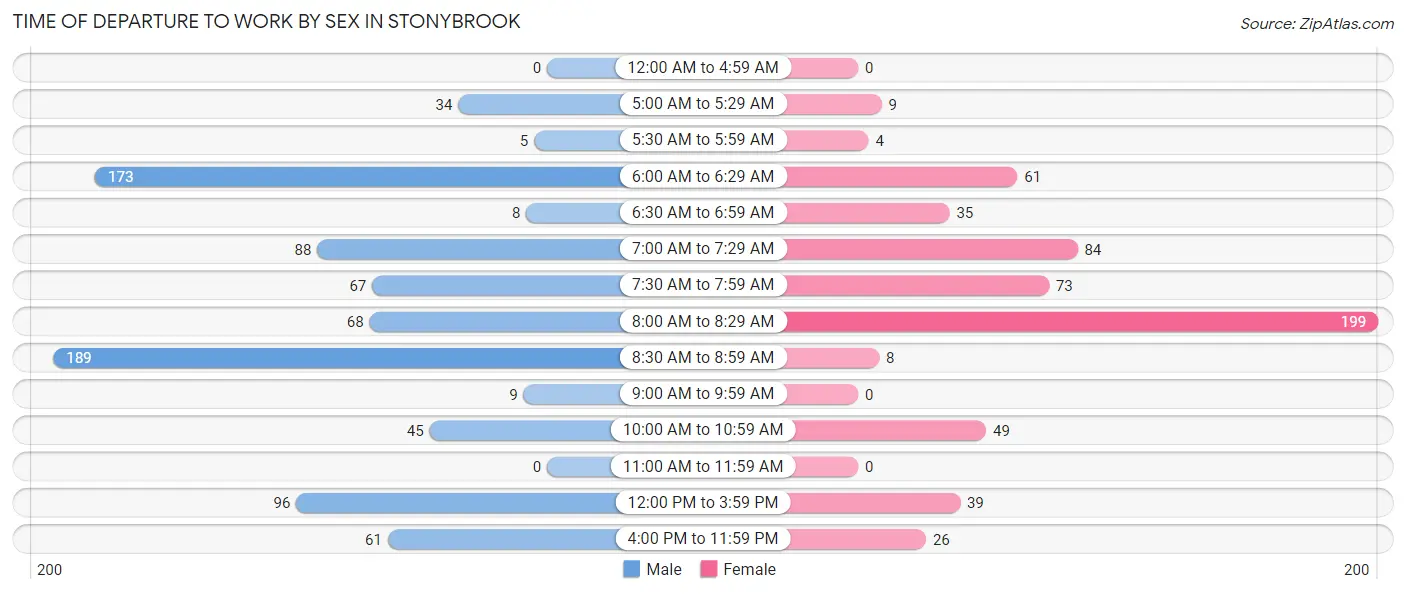
| Time of Departure | Male | Female |
| 12:00 AM to 4:59 AM | 0 (0.0%) | 0 (0.0%) |
| 5:00 AM to 5:29 AM | 34 (4.0%) | 9 (1.5%) |
| 5:30 AM to 5:59 AM | 5 (0.6%) | 4 (0.7%) |
| 6:00 AM to 6:29 AM | 173 (20.5%) | 61 (10.4%) |
| 6:30 AM to 6:59 AM | 8 (0.9%) | 35 (6.0%) |
| 7:00 AM to 7:29 AM | 88 (10.4%) | 84 (14.3%) |
| 7:30 AM to 7:59 AM | 67 (8.0%) | 73 (12.4%) |
| 8:00 AM to 8:29 AM | 68 (8.1%) | 199 (33.9%) |
| 8:30 AM to 8:59 AM | 189 (22.4%) | 8 (1.4%) |
| 9:00 AM to 9:59 AM | 9 (1.1%) | 0 (0.0%) |
| 10:00 AM to 10:59 AM | 45 (5.3%) | 49 (8.4%) |
| 11:00 AM to 11:59 AM | 0 (0.0%) | 0 (0.0%) |
| 12:00 PM to 3:59 PM | 96 (11.4%) | 39 (6.6%) |
| 4:00 PM to 11:59 PM | 61 (7.2%) | 26 (4.4%) |
| Total | 843 (100.0%) | 587 (100.0%) |
Housing Occupancy in Stonybrook
Occupancy by Ownership in Stonybrook
Of the total 1,207 dwellings in Stonybrook, owner-occupied units account for 1,083 (89.7%), while renter-occupied units make up 124 (10.3%).
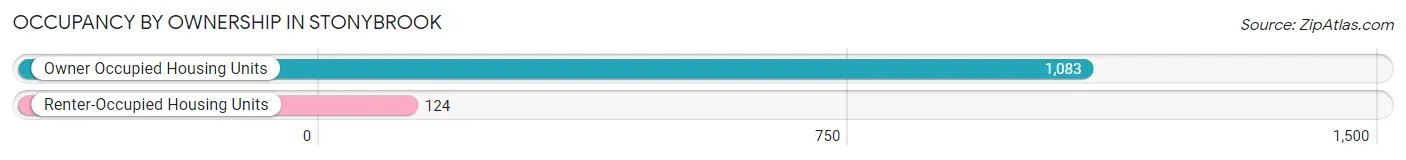
| Occupancy | # Housing Units | % Housing Units |
| Owner Occupied Housing Units | 1,083 | 89.7% |
| Renter-Occupied Housing Units | 124 | 10.3% |
| Total Occupied Housing Units | 1,207 | 100.0% |
Occupancy by Household Size in Stonybrook
| Household Size | # Housing Units | % Housing Units |
| 1-Person Household | 152 | 12.6% |
| 2-Person Household | 315 | 26.1% |
| 3-Person Household | 257 | 21.3% |
| 4+ Person Household | 483 | 40.0% |
| Total Housing Units | 1,207 | 100.0% |
Occupancy by Ownership by Household Size in Stonybrook
| Household Size | Owner-occupied | Renter-occupied |
| 1-Person Household | 143 (94.1%) | 9 (5.9%) |
| 2-Person Household | 315 (100.0%) | 0 (0.0%) |
| 3-Person Household | 152 (59.1%) | 105 (40.9%) |
| 4+ Person Household | 473 (97.9%) | 10 (2.1%) |
| Total Housing Units | 1,083 (89.7%) | 124 (10.3%) |
Occupancy by Educational Attainment in Stonybrook
| Household Size | Owner-occupied | Renter-occupied |
| Less than High School | 8 (47.1%) | 9 (52.9%) |
| High School Diploma | 274 (70.4%) | 115 (29.6%) |
| College/Associate Degree | 260 (100.0%) | 0 (0.0%) |
| Bachelor's Degree or higher | 541 (100.0%) | 0 (0.0%) |
Occupancy by Age of Householder in Stonybrook
| Age Bracket | # Households | % Households |
| Under 35 Years | 160 | 13.3% |
| 35 to 44 Years | 321 | 26.6% |
| 45 to 54 Years | 309 | 25.6% |
| 55 to 64 Years | 84 | 7.0% |
| 65 to 74 Years | 225 | 18.6% |
| 75 to 84 Years | 108 | 8.9% |
| 85 Years and Over | 0 | 0.0% |
| Total | 1,207 | 100.0% |
Housing Finances in Stonybrook
Median Income by Occupancy in Stonybrook
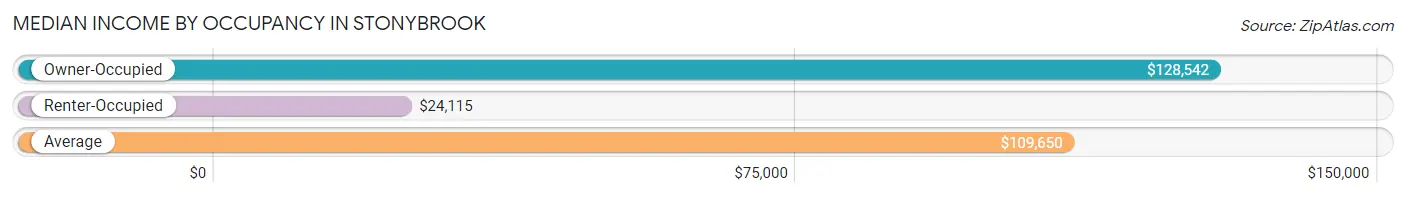
| Occupancy Type | # Households | Median Income |
| Owner-Occupied | 1,083 (89.7%) | $128,542 |
| Renter-Occupied | 124 (10.3%) | $24,115 |
| Average | 1,207 (100.0%) | $109,650 |
Occupancy by Householder Income Bracket in Stonybrook
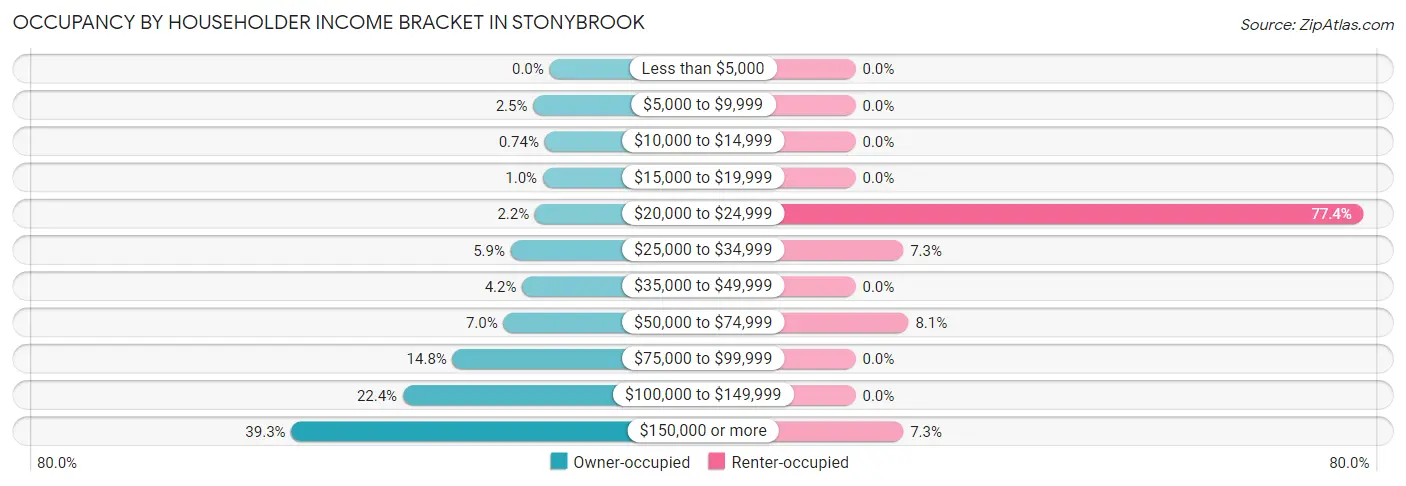
| Income Bracket | Owner-occupied | Renter-occupied |
| Less than $5,000 | 0 (0.0%) | 0 (0.0%) |
| $5,000 to $9,999 | 27 (2.5%) | 0 (0.0%) |
| $10,000 to $14,999 | 8 (0.7%) | 0 (0.0%) |
| $15,000 to $19,999 | 11 (1.0%) | 0 (0.0%) |
| $20,000 to $24,999 | 24 (2.2%) | 96 (77.4%) |
| $25,000 to $34,999 | 64 (5.9%) | 9 (7.3%) |
| $35,000 to $49,999 | 45 (4.2%) | 0 (0.0%) |
| $50,000 to $74,999 | 76 (7.0%) | 10 (8.1%) |
| $75,000 to $99,999 | 160 (14.8%) | 0 (0.0%) |
| $100,000 to $149,999 | 242 (22.4%) | 0 (0.0%) |
| $150,000 or more | 426 (39.3%) | 9 (7.3%) |
| Total | 1,083 (100.0%) | 124 (100.0%) |
Monthly Housing Cost Tiers in Stonybrook
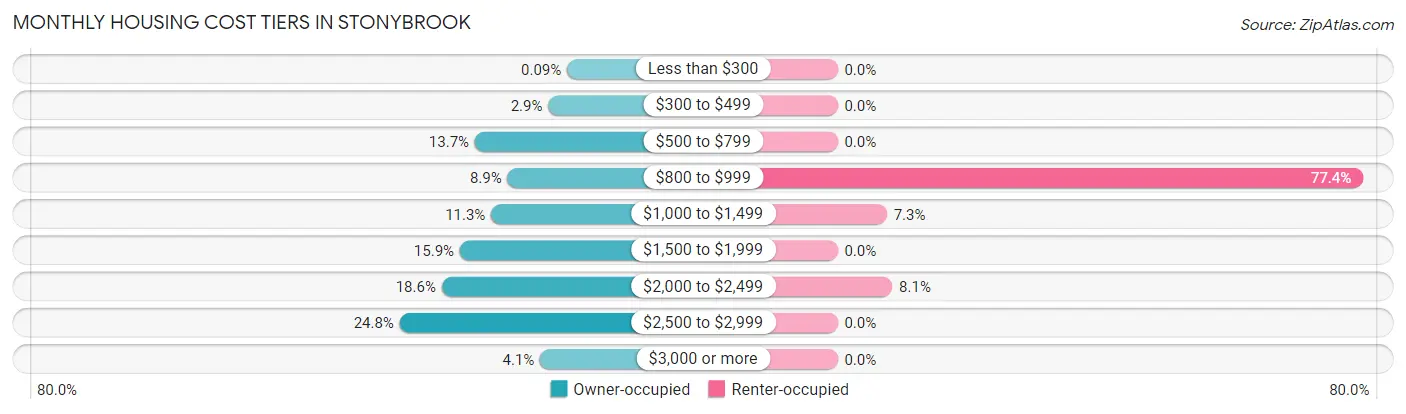
| Monthly Cost | Owner-occupied | Renter-occupied |
| Less than $300 | 1 (0.1%) | 0 (0.0%) |
| $300 to $499 | 31 (2.9%) | 0 (0.0%) |
| $500 to $799 | 148 (13.7%) | 0 (0.0%) |
| $800 to $999 | 96 (8.9%) | 96 (77.4%) |
| $1,000 to $1,499 | 122 (11.3%) | 9 (7.3%) |
| $1,500 to $1,999 | 172 (15.9%) | 0 (0.0%) |
| $2,000 to $2,499 | 201 (18.6%) | 10 (8.1%) |
| $2,500 to $2,999 | 268 (24.7%) | 0 (0.0%) |
| $3,000 or more | 44 (4.1%) | 0 (0.0%) |
| Total | 1,083 (100.0%) | 124 (100.0%) |
Physical Housing Characteristics in Stonybrook
Housing Structures in Stonybrook
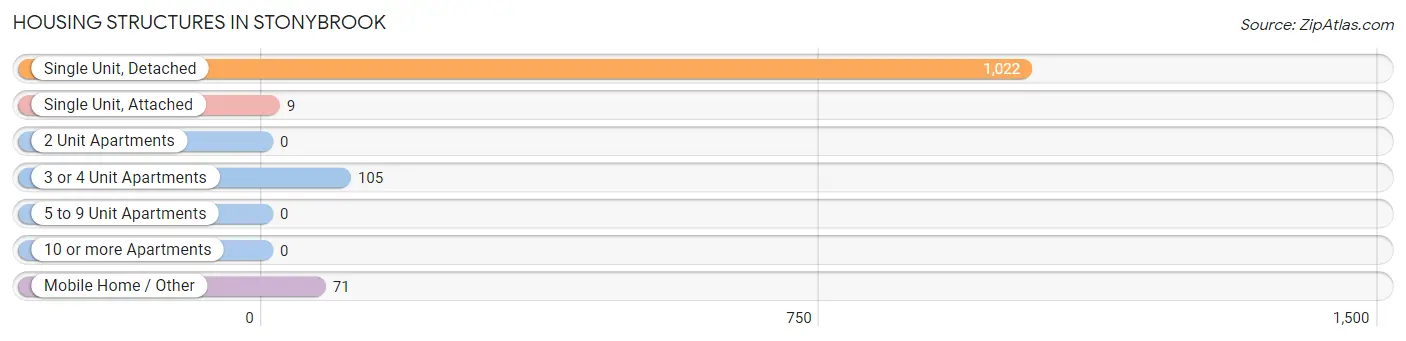
| Structure Type | # Housing Units | % Housing Units |
| Single Unit, Detached | 1,022 | 84.7% |
| Single Unit, Attached | 9 | 0.7% |
| 2 Unit Apartments | 0 | 0.0% |
| 3 or 4 Unit Apartments | 105 | 8.7% |
| 5 to 9 Unit Apartments | 0 | 0.0% |
| 10 or more Apartments | 0 | 0.0% |
| Mobile Home / Other | 71 | 5.9% |
| Total | 1,207 | 100.0% |
Housing Structures by Occupancy in Stonybrook
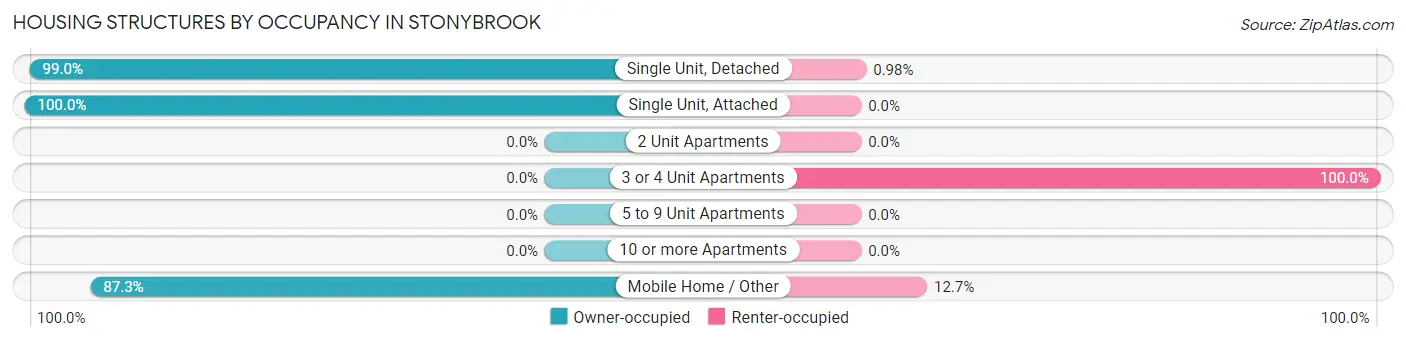
| Structure Type | Owner-occupied | Renter-occupied |
| Single Unit, Detached | 1,012 (99.0%) | 10 (1.0%) |
| Single Unit, Attached | 9 (100.0%) | 0 (0.0%) |
| 2 Unit Apartments | 0 (0.0%) | 0 (0.0%) |
| 3 or 4 Unit Apartments | 0 (0.0%) | 105 (100.0%) |
| 5 to 9 Unit Apartments | 0 (0.0%) | 0 (0.0%) |
| 10 or more Apartments | 0 (0.0%) | 0 (0.0%) |
| Mobile Home / Other | 62 (87.3%) | 9 (12.7%) |
| Total | 1,083 (89.7%) | 124 (10.3%) |
Housing Structures by Number of Rooms in Stonybrook
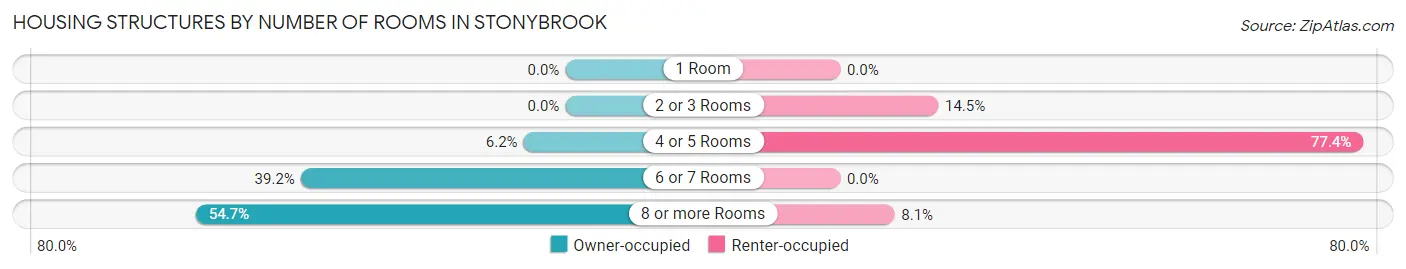
| Number of Rooms | Owner-occupied | Renter-occupied |
| 1 Room | 0 (0.0%) | 0 (0.0%) |
| 2 or 3 Rooms | 0 (0.0%) | 18 (14.5%) |
| 4 or 5 Rooms | 67 (6.2%) | 96 (77.4%) |
| 6 or 7 Rooms | 424 (39.2%) | 0 (0.0%) |
| 8 or more Rooms | 592 (54.7%) | 10 (8.1%) |
| Total | 1,083 (100.0%) | 124 (100.0%) |
Housing Structure by Heating Type in Stonybrook
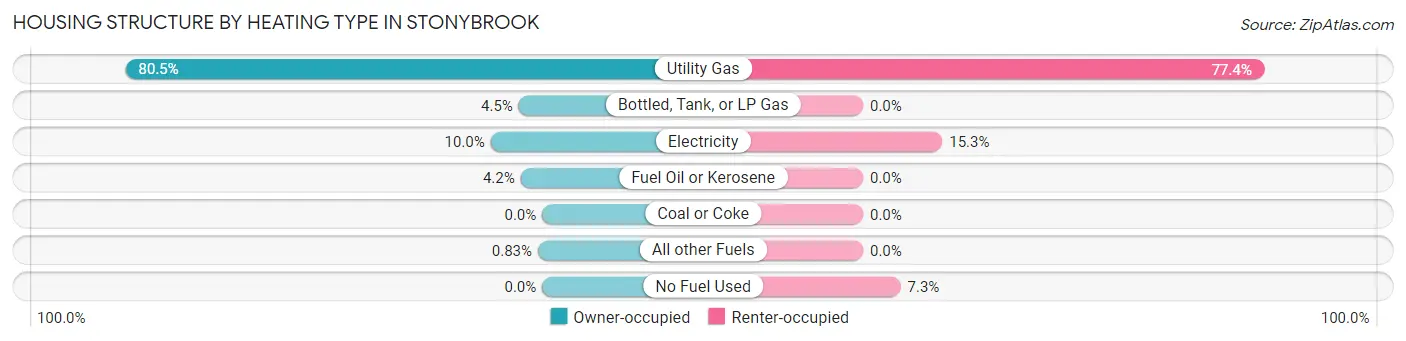
| Heating Type | Owner-occupied | Renter-occupied |
| Utility Gas | 872 (80.5%) | 96 (77.4%) |
| Bottled, Tank, or LP Gas | 49 (4.5%) | 0 (0.0%) |
| Electricity | 108 (10.0%) | 19 (15.3%) |
| Fuel Oil or Kerosene | 45 (4.2%) | 0 (0.0%) |
| Coal or Coke | 0 (0.0%) | 0 (0.0%) |
| All other Fuels | 9 (0.8%) | 0 (0.0%) |
| No Fuel Used | 0 (0.0%) | 9 (7.3%) |
| Total | 1,083 (100.0%) | 124 (100.0%) |
Household Vehicle Usage in Stonybrook
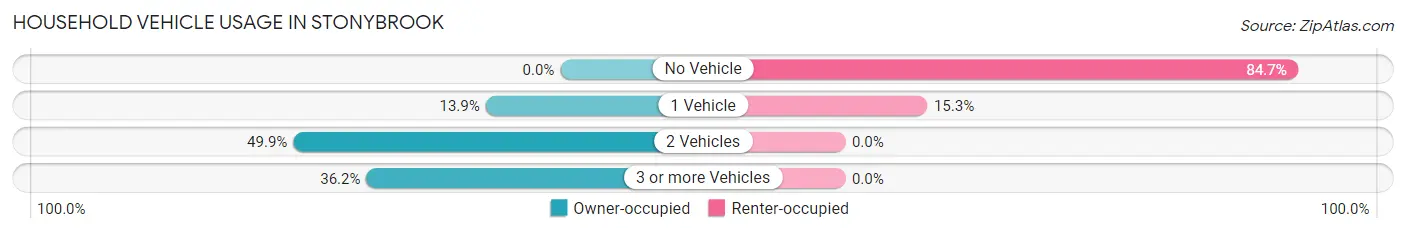
| Vehicles per Household | Owner-occupied | Renter-occupied |
| No Vehicle | 0 (0.0%) | 105 (84.7%) |
| 1 Vehicle | 151 (13.9%) | 19 (15.3%) |
| 2 Vehicles | 540 (49.9%) | 0 (0.0%) |
| 3 or more Vehicles | 392 (36.2%) | 0 (0.0%) |
| Total | 1,083 (100.0%) | 124 (100.0%) |
Real Estate & Mortgages in Stonybrook
Real Estate and Mortgage Overview in Stonybrook
| Characteristic | Without Mortgage | With Mortgage |
| Housing Units | 304 | 779 |
| Median Property Value | $254,400 | $346,100 |
| Median Household Income | $44,762 | $392 |
| Monthly Housing Costs | $787 | $44 |
| Real Estate Taxes | $2,929 | $0 |
Property Value by Mortgage Status in Stonybrook
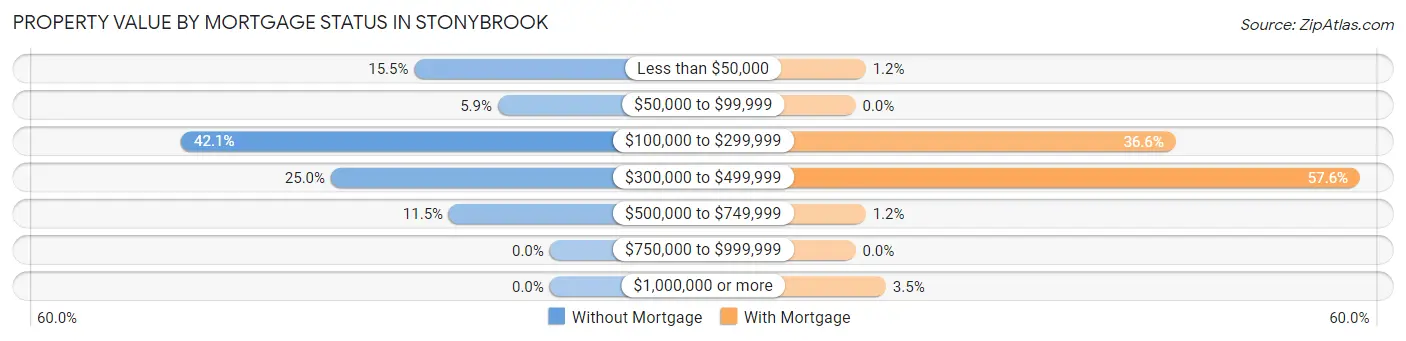
| Property Value | Without Mortgage | With Mortgage |
| Less than $50,000 | 47 (15.5%) | 9 (1.2%) |
| $50,000 to $99,999 | 18 (5.9%) | 0 (0.0%) |
| $100,000 to $299,999 | 128 (42.1%) | 285 (36.6%) |
| $300,000 to $499,999 | 76 (25.0%) | 449 (57.6%) |
| $500,000 to $749,999 | 35 (11.5%) | 9 (1.2%) |
| $750,000 to $999,999 | 0 (0.0%) | 0 (0.0%) |
| $1,000,000 or more | 0 (0.0%) | 27 (3.5%) |
| Total | 304 (100.0%) | 779 (100.0%) |
Household Income by Mortgage Status in Stonybrook
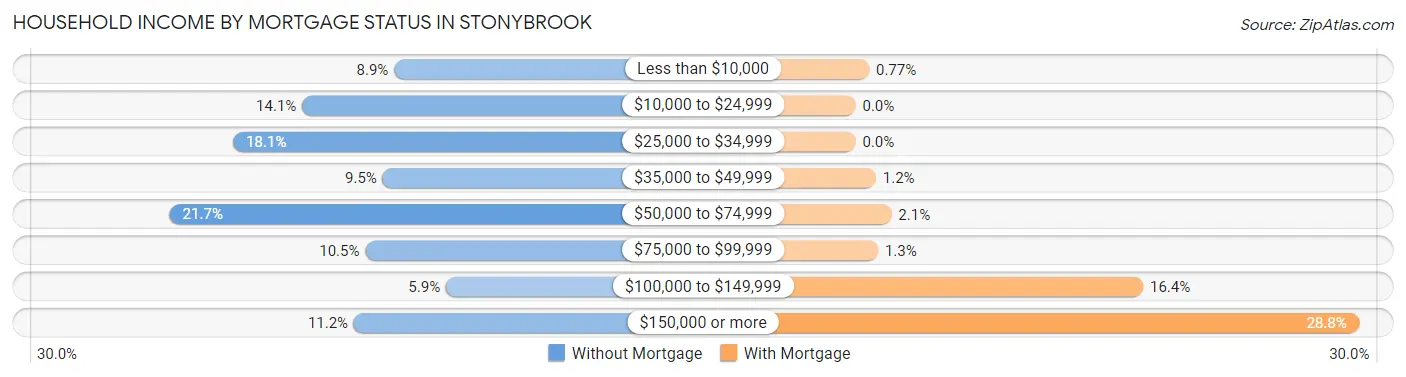
| Household Income | Without Mortgage | With Mortgage |
| Less than $10,000 | 27 (8.9%) | 6 (0.8%) |
| $10,000 to $24,999 | 43 (14.1%) | 0 (0.0%) |
| $25,000 to $34,999 | 55 (18.1%) | 0 (0.0%) |
| $35,000 to $49,999 | 29 (9.5%) | 9 (1.2%) |
| $50,000 to $74,999 | 66 (21.7%) | 16 (2.1%) |
| $75,000 to $99,999 | 32 (10.5%) | 10 (1.3%) |
| $100,000 to $149,999 | 18 (5.9%) | 128 (16.4%) |
| $150,000 or more | 34 (11.2%) | 224 (28.7%) |
| Total | 304 (100.0%) | 779 (100.0%) |
Property Value to Household Income Ratio in Stonybrook
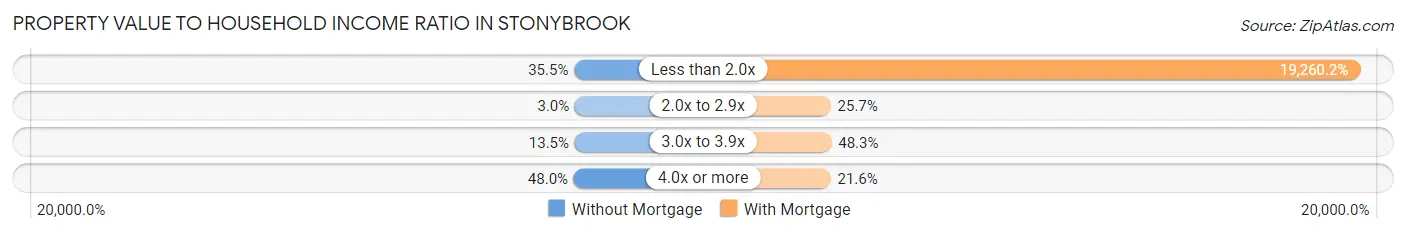
| Value-to-Income Ratio | Without Mortgage | With Mortgage |
| Less than 2.0x | 108 (35.5%) | 150,037 (19,260.2%) |
| 2.0x to 2.9x | 9 (3.0%) | 200 (25.7%) |
| 3.0x to 3.9x | 41 (13.5%) | 376 (48.3%) |
| 4.0x or more | 146 (48.0%) | 168 (21.6%) |
| Total | 304 (100.0%) | 779 (100.0%) |
Real Estate Taxes by Mortgage Status in Stonybrook
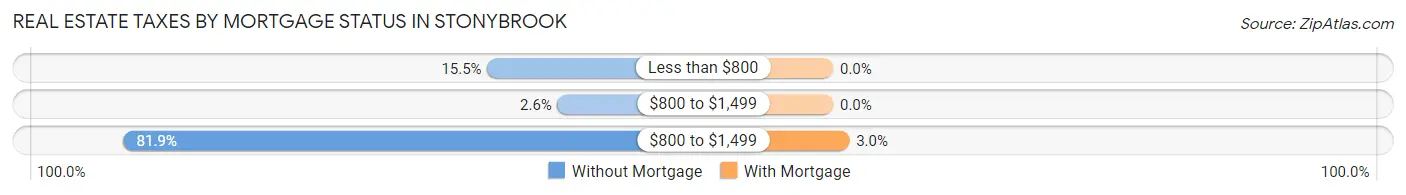
| Property Taxes | Without Mortgage | With Mortgage |
| Less than $800 | 47 (15.5%) | 0 (0.0%) |
| $800 to $1,499 | 8 (2.6%) | 0 (0.0%) |
| $800 to $1,499 | 249 (81.9%) | 23 (2.9%) |
| Total | 304 (100.0%) | 779 (100.0%) |
Health & Disability in Stonybrook
Health Insurance Coverage by Age in Stonybrook
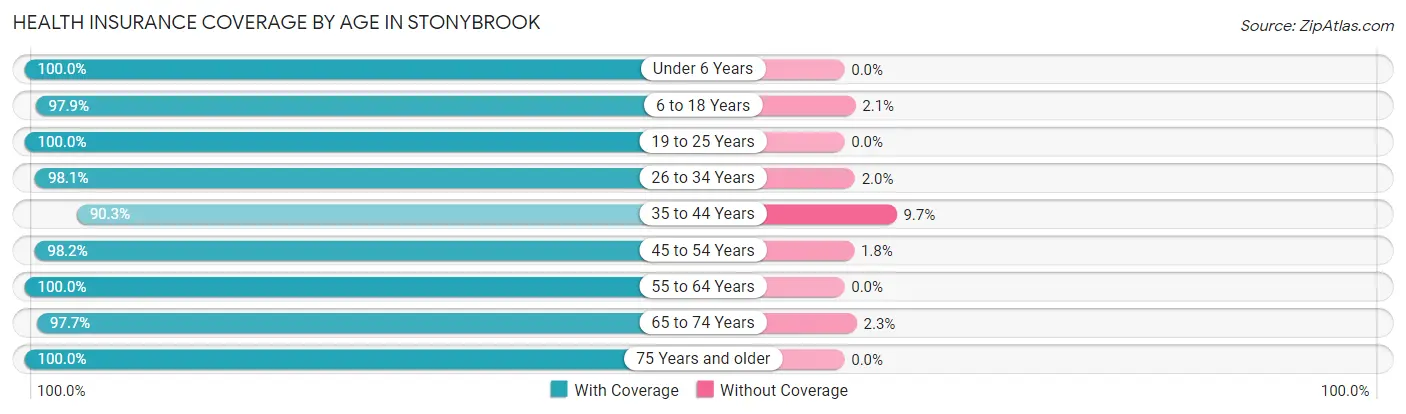
| Age Bracket | With Coverage | Without Coverage |
| Under 6 Years | 249 (100.0%) | 0 (0.0%) |
| 6 to 18 Years | 809 (97.9%) | 17 (2.1%) |
| 19 to 25 Years | 136 (100.0%) | 0 (0.0%) |
| 26 to 34 Years | 302 (98.1%) | 6 (1.9%) |
| 35 to 44 Years | 510 (90.3%) | 55 (9.7%) |
| 45 to 54 Years | 544 (98.2%) | 10 (1.8%) |
| 55 to 64 Years | 198 (100.0%) | 0 (0.0%) |
| 65 to 74 Years | 382 (97.7%) | 9 (2.3%) |
| 75 Years and older | 350 (100.0%) | 0 (0.0%) |
| Total | 3,480 (97.3%) | 97 (2.7%) |
Health Insurance Coverage by Citizenship Status in Stonybrook
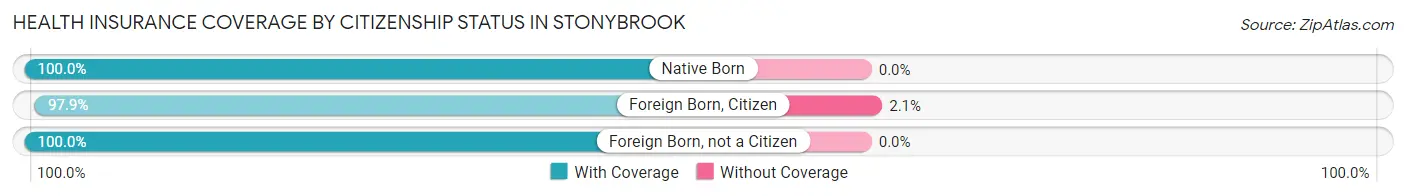
| Citizenship Status | With Coverage | Without Coverage |
| Native Born | 249 (100.0%) | 0 (0.0%) |
| Foreign Born, Citizen | 809 (97.9%) | 17 (2.1%) |
| Foreign Born, not a Citizen | 136 (100.0%) | 0 (0.0%) |
Health Insurance Coverage by Household Income in Stonybrook
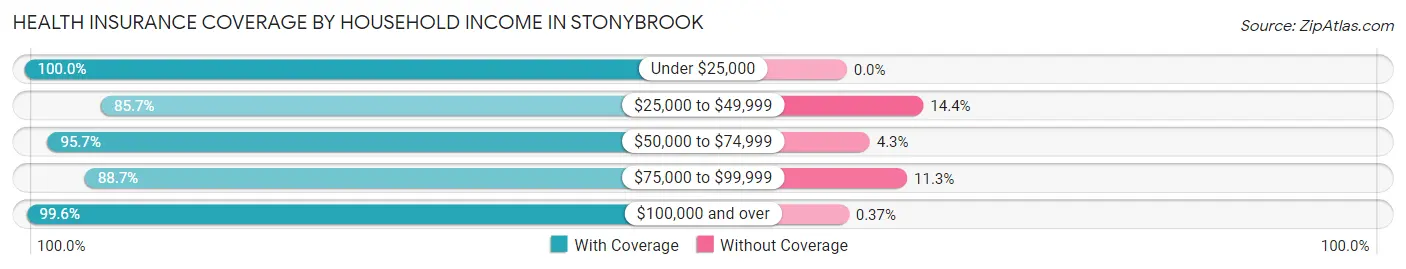
| Household Income | With Coverage | Without Coverage |
| Under $25,000 | 294 (100.0%) | 0 (0.0%) |
| $25,000 to $49,999 | 191 (85.7%) | 32 (14.3%) |
| $50,000 to $74,999 | 222 (95.7%) | 10 (4.3%) |
| $75,000 to $99,999 | 361 (88.7%) | 46 (11.3%) |
| $100,000 and over | 2,410 (99.6%) | 9 (0.4%) |
Public vs Private Health Insurance Coverage by Age in Stonybrook
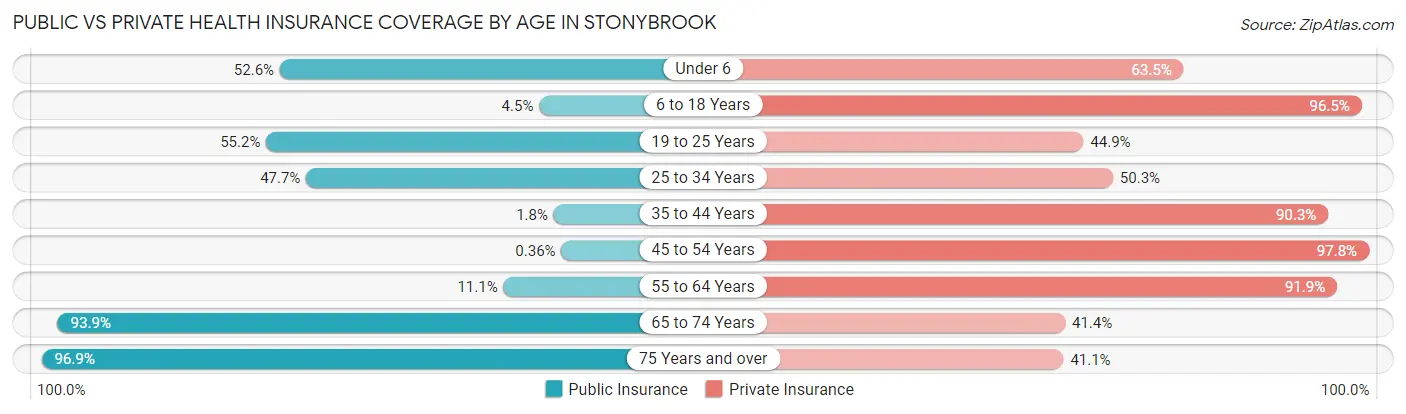
| Age Bracket | Public Insurance | Private Insurance |
| Under 6 | 131 (52.6%) | 158 (63.4%) |
| 6 to 18 Years | 37 (4.5%) | 797 (96.5%) |
| 19 to 25 Years | 75 (55.1%) | 61 (44.9%) |
| 25 to 34 Years | 147 (47.7%) | 155 (50.3%) |
| 35 to 44 Years | 10 (1.8%) | 510 (90.3%) |
| 45 to 54 Years | 2 (0.4%) | 542 (97.8%) |
| 55 to 64 Years | 22 (11.1%) | 182 (91.9%) |
| 65 to 74 Years | 367 (93.9%) | 162 (41.4%) |
| 75 Years and over | 339 (96.9%) | 144 (41.1%) |
| Total | 1,130 (31.6%) | 2,711 (75.8%) |
Disability Status by Sex by Age in Stonybrook
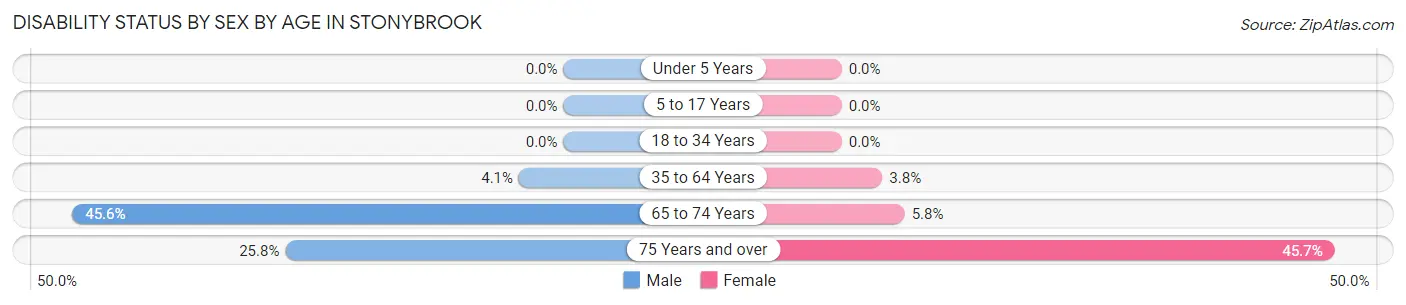
| Age Bracket | Male | Female |
| Under 5 Years | 0 (0.0%) | 0 (0.0%) |
| 5 to 17 Years | 0 (0.0%) | 0 (0.0%) |
| 18 to 34 Years | 0 (0.0%) | 0 (0.0%) |
| 35 to 64 Years | 27 (4.1%) | 25 (3.8%) |
| 65 to 74 Years | 108 (45.6%) | 9 (5.8%) |
| 75 Years and over | 48 (25.8%) | 75 (45.7%) |
Disability Class by Sex by Age in Stonybrook
Disability Class: Hearing Difficulty
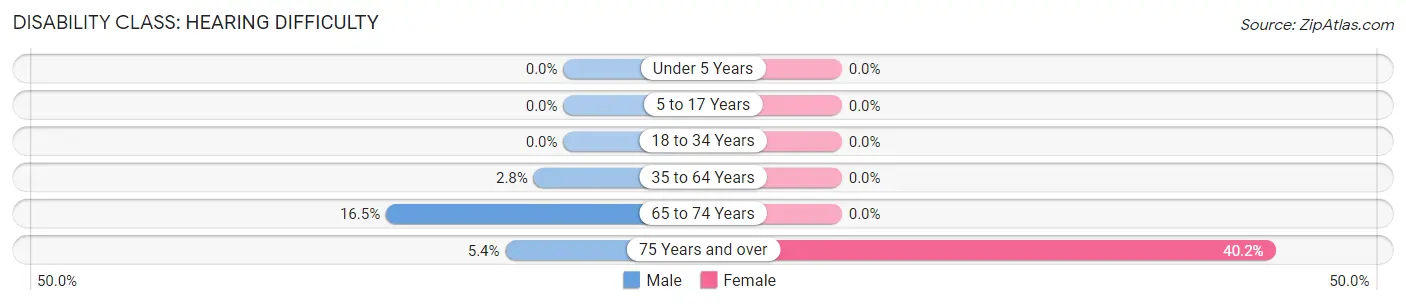
| Age Bracket | Male | Female |
| Under 5 Years | 0 (0.0%) | 0 (0.0%) |
| 5 to 17 Years | 0 (0.0%) | 0 (0.0%) |
| 18 to 34 Years | 0 (0.0%) | 0 (0.0%) |
| 35 to 64 Years | 18 (2.8%) | 0 (0.0%) |
| 65 to 74 Years | 39 (16.5%) | 0 (0.0%) |
| 75 Years and over | 10 (5.4%) | 66 (40.2%) |
Disability Class: Vision Difficulty
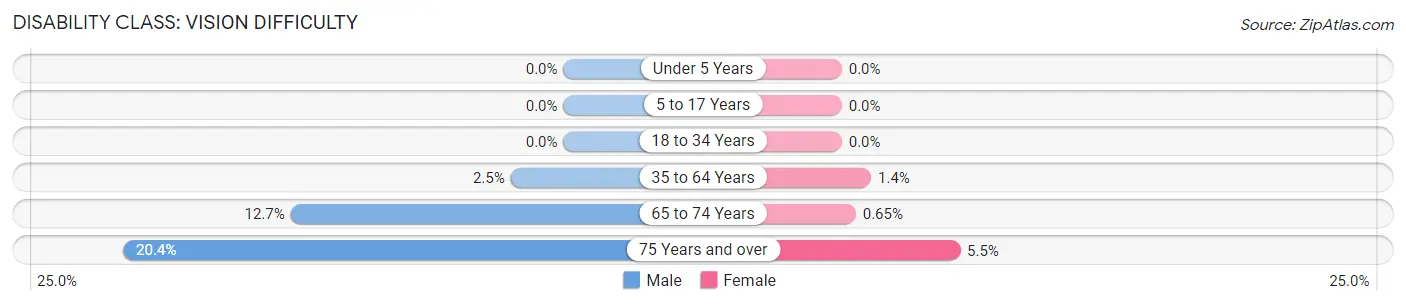
| Age Bracket | Male | Female |
| Under 5 Years | 0 (0.0%) | 0 (0.0%) |
| 5 to 17 Years | 0 (0.0%) | 0 (0.0%) |
| 18 to 34 Years | 0 (0.0%) | 0 (0.0%) |
| 35 to 64 Years | 16 (2.5%) | 9 (1.4%) |
| 65 to 74 Years | 30 (12.7%) | 1 (0.6%) |
| 75 Years and over | 38 (20.4%) | 9 (5.5%) |
Disability Class: Cognitive Difficulty
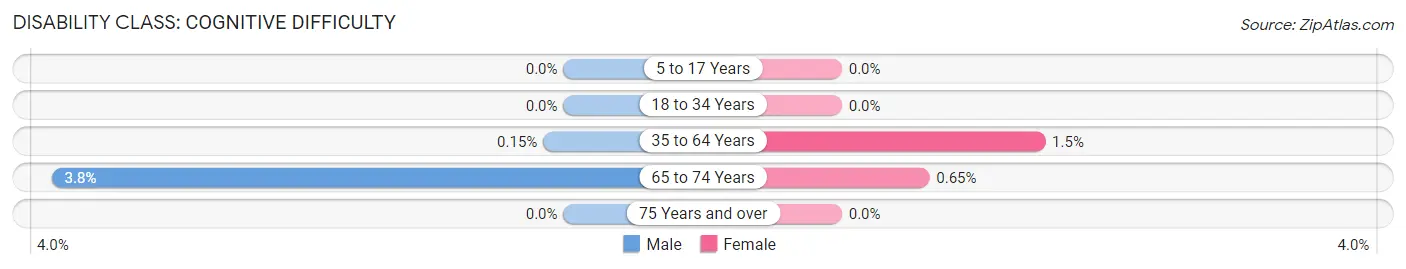
| Age Bracket | Male | Female |
| 5 to 17 Years | 0 (0.0%) | 0 (0.0%) |
| 18 to 34 Years | 0 (0.0%) | 0 (0.0%) |
| 35 to 64 Years | 1 (0.2%) | 10 (1.5%) |
| 65 to 74 Years | 9 (3.8%) | 1 (0.6%) |
| 75 Years and over | 0 (0.0%) | 0 (0.0%) |
Disability Class: Ambulatory Difficulty
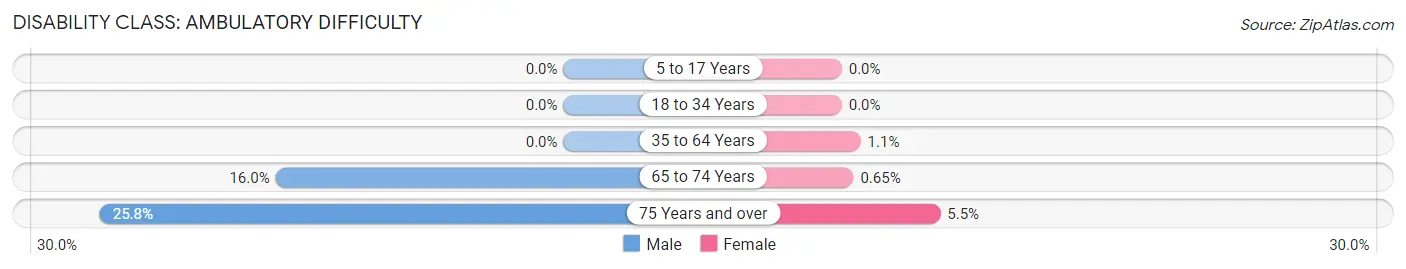
| Age Bracket | Male | Female |
| 5 to 17 Years | 0 (0.0%) | 0 (0.0%) |
| 18 to 34 Years | 0 (0.0%) | 0 (0.0%) |
| 35 to 64 Years | 0 (0.0%) | 7 (1.1%) |
| 65 to 74 Years | 38 (16.0%) | 1 (0.6%) |
| 75 Years and over | 48 (25.8%) | 9 (5.5%) |
Disability Class: Self-Care Difficulty
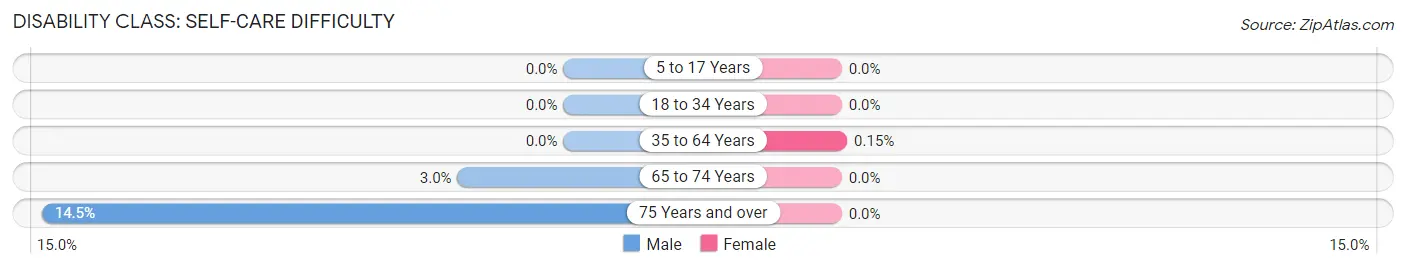
| Age Bracket | Male | Female |
| 5 to 17 Years | 0 (0.0%) | 0 (0.0%) |
| 18 to 34 Years | 0 (0.0%) | 0 (0.0%) |
| 35 to 64 Years | 0 (0.0%) | 1 (0.2%) |
| 65 to 74 Years | 7 (2.9%) | 0 (0.0%) |
| 75 Years and over | 27 (14.5%) | 0 (0.0%) |
Technology Access in Stonybrook
Computing Device Access in Stonybrook
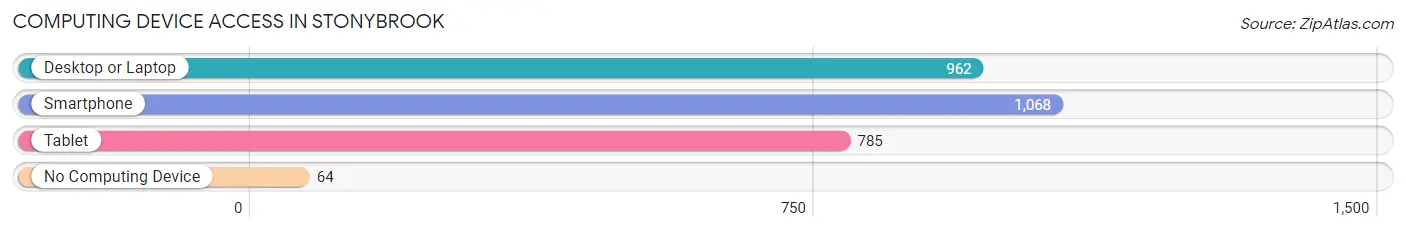
| Device Type | # Households | % Households |
| Desktop or Laptop | 962 | 79.7% |
| Smartphone | 1,068 | 88.5% |
| Tablet | 785 | 65.0% |
| No Computing Device | 64 | 5.3% |
| Total | 1,207 | 100.0% |
Internet Access in Stonybrook
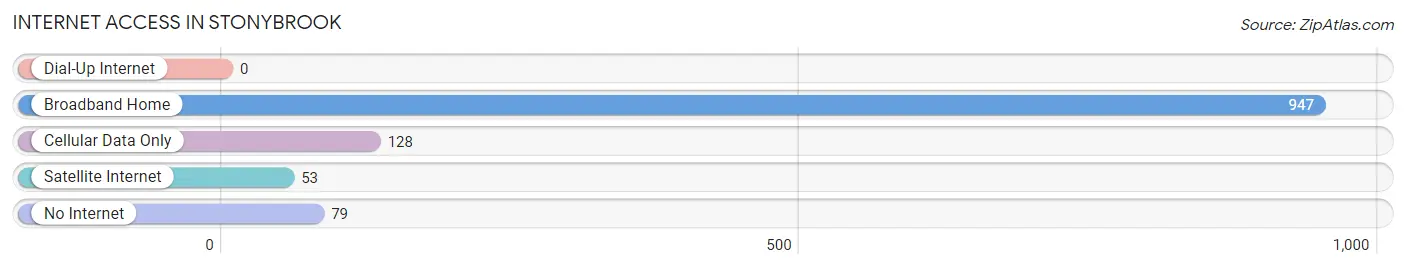
| Internet Type | # Households | % Households |
| Dial-Up Internet | 0 | 0.0% |
| Broadband Home | 947 | 78.5% |
| Cellular Data Only | 128 | 10.6% |
| Satellite Internet | 53 | 4.4% |
| No Internet | 79 | 6.6% |
| Total | 1,207 | 100.0% |
Stonybrook Summary
Stonybrook, Pennsylvania is a small borough located in the southeastern corner of the state. It is situated in the Lehigh Valley region, which is known for its rich history and culture. The borough is home to a population of approximately 1,500 people, and is located in Northampton County.
History
Stonybrook was founded in 1790 by a group of settlers from the nearby town of Bethlehem. The settlers were looking for a place to settle and build a new community. The area was originally known as “Stoney Brook”, and was named after the nearby creek. The creek was used as a source of water for the settlers, and the name was eventually changed to Stonybrook.
The borough was officially incorporated in 1845, and the first mayor was elected in 1846. The town quickly grew and prospered, and by the late 19th century, it had become a popular destination for tourists. The town was known for its picturesque scenery and its many attractions, including a large amusement park.
Geography
Stonybrook is located in the Lehigh Valley region of Pennsylvania. It is situated in the southeastern corner of the state, and is bordered by the towns of Bethlehem, Easton, and Allentown. The borough is situated on the banks of the Lehigh River, and is surrounded by rolling hills and lush forests.
The climate in Stonybrook is typical of the region, with hot summers and cold winters. The average temperature in the summer is around 75 degrees Fahrenheit, and the average temperature in the winter is around 25 degrees Fahrenheit.
Economy
Stonybrook’s economy is largely based on tourism and retail. The borough is home to several small businesses, including restaurants, shops, and galleries. The town is also home to a number of historic sites, including the Stonybrook Mill, which was built in 1845.
The borough is also home to a number of manufacturing companies, including a paper mill and a steel mill. These companies provide employment for many of the residents of Stonybrook.
Demographics
As of the 2010 census, the population of Stonybrook was 1,500. The racial makeup of the borough was 94.2% White, 2.7% African American, 0.2% Native American, 0.7% Asian, and 2.2% from other races. The median household income was $45,000, and the median family income was $50,000.
The population of Stonybrook is largely made up of families, with the majority of households consisting of married couples. The town is also home to a large number of retirees, as well as a growing number of young professionals.
Conclusion
Stonybrook, Pennsylvania is a small borough located in the southeastern corner of the state. It is situated in the Lehigh Valley region, and is home to a population of approximately 1,500 people. The borough has a rich history, and is known for its picturesque scenery and its many attractions. The economy of Stonybrook is largely based on tourism and retail, and the population is largely made up of families and retirees.
Common Questions
What is Per Capita Income in Stonybrook?
Per Capita income in Stonybrook is $39,608.
What is the Median Family Income in Stonybrook?
Median Family Income in Stonybrook is $138,125.
What is the Median Household income in Stonybrook?
Median Household Income in Stonybrook is $109,650.
What is Income or Wage Gap in Stonybrook?
Income or Wage Gap in Stonybrook is 32.8%.
Women in Stonybrook earn 67.2 cents for every dollar earned by a man.
What is Inequality or Gini Index in Stonybrook?
Inequality or Gini Index in Stonybrook is 0.37.
What is the Total Population of Stonybrook?
Total Population of Stonybrook is 3,577.
What is the Total Male Population of Stonybrook?
Total Male Population of Stonybrook is 1,883.
What is the Total Female Population of Stonybrook?
Total Female Population of Stonybrook is 1,694.
What is the Ratio of Males per 100 Females in Stonybrook?
There are 111.16 Males per 100 Females in Stonybrook.
What is the Ratio of Females per 100 Males in Stonybrook?
There are 89.96 Females per 100 Males in Stonybrook.
What is the Median Population Age in Stonybrook?
Median Population Age in Stonybrook is 39.7 Years.
What is the Average Family Size in Stonybrook
Average Family Size in Stonybrook is 3.3 People.
What is the Average Household Size in Stonybrook
Average Household Size in Stonybrook is 3.0 People.
How Large is the Labor Force in Stonybrook?
There are 1,580 People in the Labor Forcein in Stonybrook.
What is the Percentage of People in the Labor Force in Stonybrook?
62.0% of People are in the Labor Force in Stonybrook.