Stevens, PA Map & Demographics
Stevens Map
Stevens Overview
$19,928
PER CAPITA INCOME
$44,692
AVG FAMILY INCOME
$46,250
AVG HOUSEHOLD INCOME
43.3%
WAGE / INCOME GAP [ % ]
56.7¢/ $1
WAGE / INCOME GAP [ $ ]
0.28
INEQUALITY / GINI INDEX
536
TOTAL POPULATION
195
MALE POPULATION
341
FEMALE POPULATION
57.18
MALES / 100 FEMALES
174.87
FEMALES / 100 MALES
22.5
MEDIAN AGE
3.0
AVG FAMILY SIZE
2.7
AVG HOUSEHOLD SIZE
217
LABOR FORCE [ PEOPLE ]
61.1%
PERCENT IN LABOR FORCE
4.6%
UNEMPLOYMENT RATE
Stevens Zip Codes
Stevens Area Codes
Income in Stevens
Income Overview in Stevens
Per Capita Income in Stevens is $19,928, while median incomes of families and households are $44,692 and $46,250 respectively.
| Characteristic | Number | Measure |
| Per Capita Income | 536 | $19,928 |
| Median Family Income | 166 | $44,692 |
| Mean Family Income | 166 | $54,604 |
| Median Household Income | 200 | $46,250 |
| Mean Household Income | 200 | $54,215 |
| Income Deficit | 166 | $0 |
| Wage / Income Gap (%) | 536 | 43.29% |
| Wage / Income Gap ($) | 536 | 56.71¢ per $1 |
| Gini / Inequality Index | 536 | 0.28 |
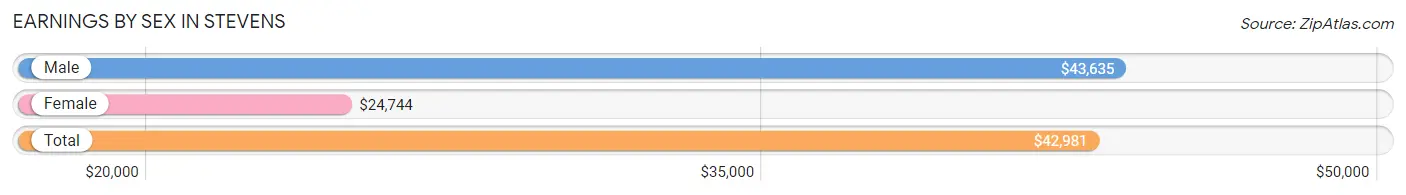
Earnings by Sex in Stevens
Average Earnings in Stevens are $42,981, $43,635 for men and $24,744 for women, a difference of 43.3%.
| Sex | Number | Average Earnings |
| Male | 141 (62.7%) | $43,635 |
| Female | 84 (37.3%) | $24,744 |
| Total | 225 (100.0%) | $42,981 |
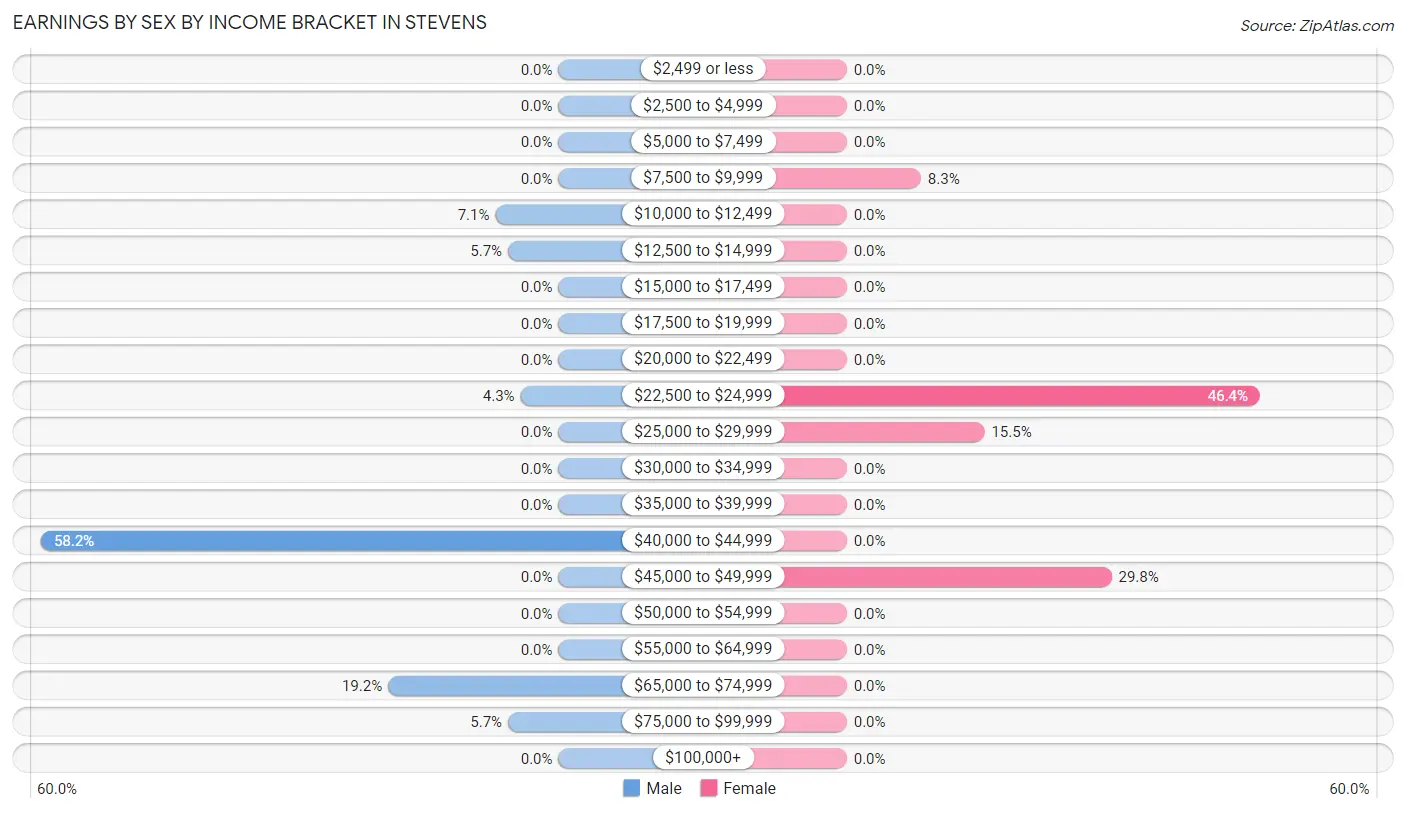
Earnings by Sex by Income Bracket in Stevens
The most common earnings brackets in Stevens are $40,000 to $44,999 for men (82 | 58.2%) and $22,500 to $24,999 for women (39 | 46.4%).
| Income | Male | Female |
| $2,499 or less | 0 (0.0%) | 0 (0.0%) |
| $2,500 to $4,999 | 0 (0.0%) | 0 (0.0%) |
| $5,000 to $7,499 | 0 (0.0%) | 0 (0.0%) |
| $7,500 to $9,999 | 0 (0.0%) | 7 (8.3%) |
| $10,000 to $12,499 | 10 (7.1%) | 0 (0.0%) |
| $12,500 to $14,999 | 8 (5.7%) | 0 (0.0%) |
| $15,000 to $17,499 | 0 (0.0%) | 0 (0.0%) |
| $17,500 to $19,999 | 0 (0.0%) | 0 (0.0%) |
| $20,000 to $22,499 | 0 (0.0%) | 0 (0.0%) |
| $22,500 to $24,999 | 6 (4.3%) | 39 (46.4%) |
| $25,000 to $29,999 | 0 (0.0%) | 13 (15.5%) |
| $30,000 to $34,999 | 0 (0.0%) | 0 (0.0%) |
| $35,000 to $39,999 | 0 (0.0%) | 0 (0.0%) |
| $40,000 to $44,999 | 82 (58.2%) | 0 (0.0%) |
| $45,000 to $49,999 | 0 (0.0%) | 25 (29.8%) |
| $50,000 to $54,999 | 0 (0.0%) | 0 (0.0%) |
| $55,000 to $64,999 | 0 (0.0%) | 0 (0.0%) |
| $65,000 to $74,999 | 27 (19.2%) | 0 (0.0%) |
| $75,000 to $99,999 | 8 (5.7%) | 0 (0.0%) |
| $100,000+ | 0 (0.0%) | 0 (0.0%) |
| Total | 141 (100.0%) | 84 (100.0%) |
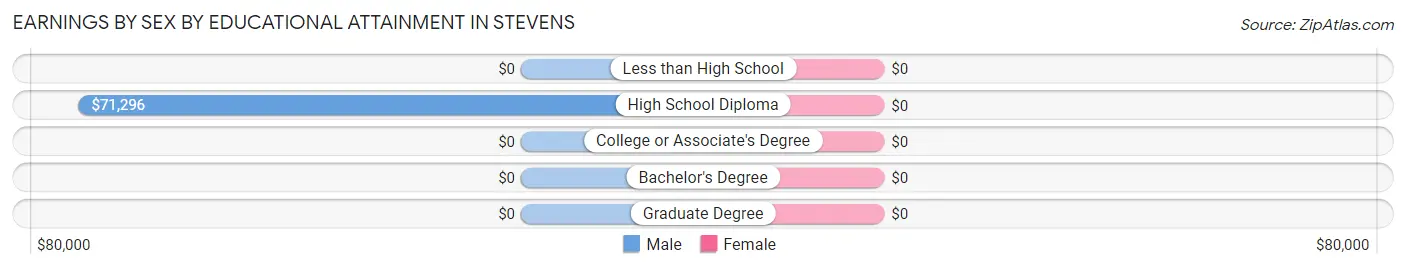
Earnings by Sex by Educational Attainment in Stevens
| Educational Attainment | Male Income | Female Income |
| Less than High School | - | - |
| High School Diploma | $71,296 | $0 |
| College or Associate's Degree | - | - |
| Bachelor's Degree | - | - |
| Graduate Degree | - | - |
| Total | $70,370 | $24,744 |
Family Income in Stevens
Family Income Brackets in Stevens
According to the Stevens family income data, there are 97 families falling into the $35,000 to $49,999 income range, which is the most common income bracket and makes up 58.4% of all families.
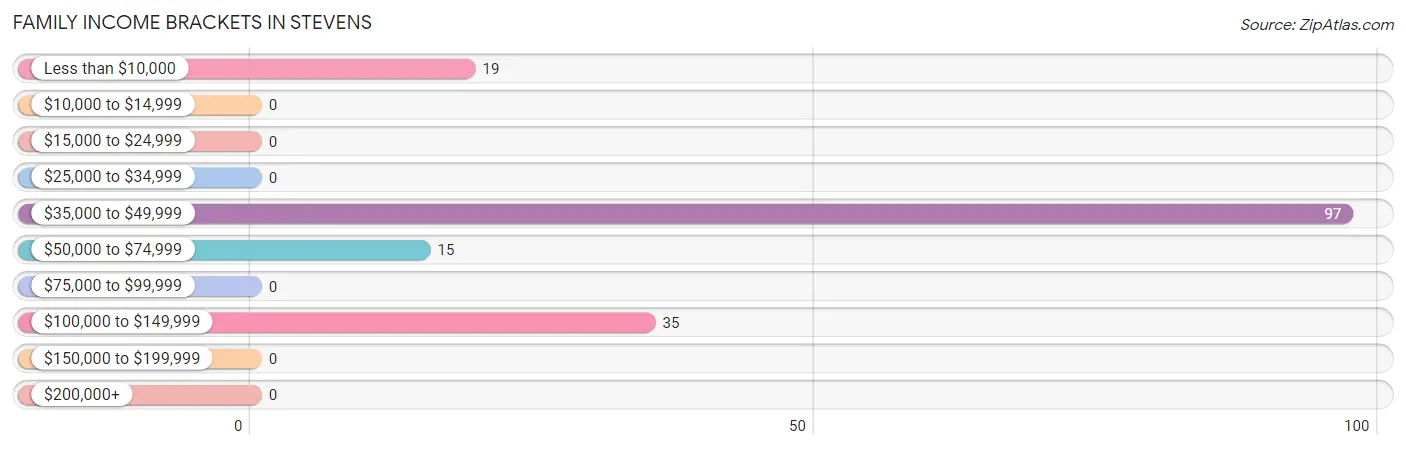
| Income Bracket | # Families | % Families |
| Less than $10,000 | 19 | 11.4% |
| $10,000 to $14,999 | 0 | 0.0% |
| $15,000 to $24,999 | 0 | 0.0% |
| $25,000 to $34,999 | 0 | 0.0% |
| $35,000 to $49,999 | 97 | 58.4% |
| $50,000 to $74,999 | 15 | 9.0% |
| $75,000 to $99,999 | 0 | 0.0% |
| $100,000 to $149,999 | 35 | 21.1% |
| $150,000 to $199,999 | 0 | 0.0% |
| $200,000+ | 0 | 0.0% |
Family Income by Famaliy Size in Stevens
2-person families (22 | 13.3%) account for the highest median family income in Stevens with $53,611 per family, while 2-person families (22 | 13.3%) have the highest median income of $26,806 per family member.
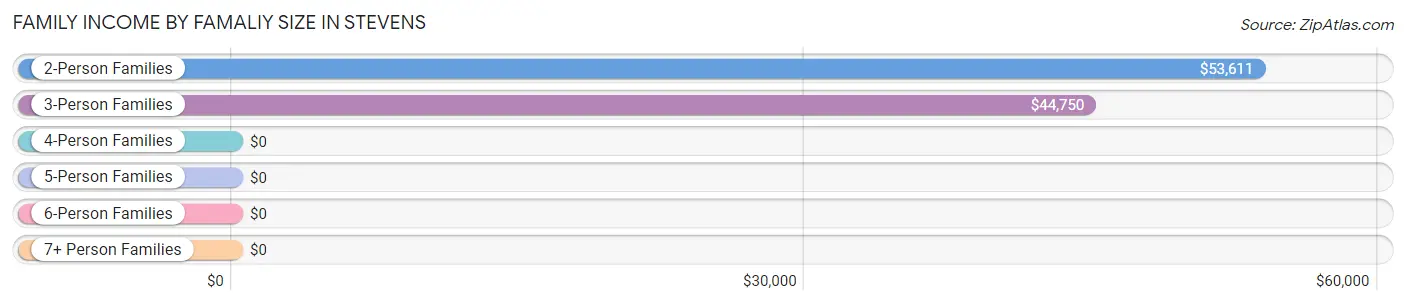
| Income Bracket | # Families | Median Income |
| 2-Person Families | 22 (13.3%) | $53,611 |
| 3-Person Families | 117 (70.5%) | $44,750 |
| 4-Person Families | 21 (12.7%) | $0 |
| 5-Person Families | 0 (0.0%) | $0 |
| 6-Person Families | 0 (0.0%) | $0 |
| 7+ Person Families | 6 (3.6%) | $0 |
| Total | 166 (100.0%) | $44,692 |
Family Income by Number of Earners in Stevens
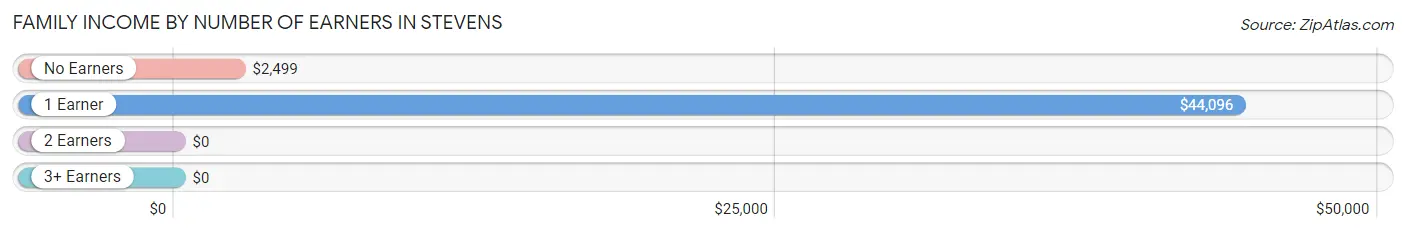
| Number of Earners | # Families | Median Income |
| No Earners | 28 (16.9%) | $2,499 |
| 1 Earner | 97 (58.4%) | $44,096 |
| 2 Earners | 33 (19.9%) | $0 |
| 3+ Earners | 8 (4.8%) | $0 |
| Total | 166 (100.0%) | $44,692 |
Household Income in Stevens
Household Income Brackets in Stevens
With 97 households falling in the category, the $35,000 to $49,999 income range is the most frequent in Stevens, accounting for 48.5% of all households.
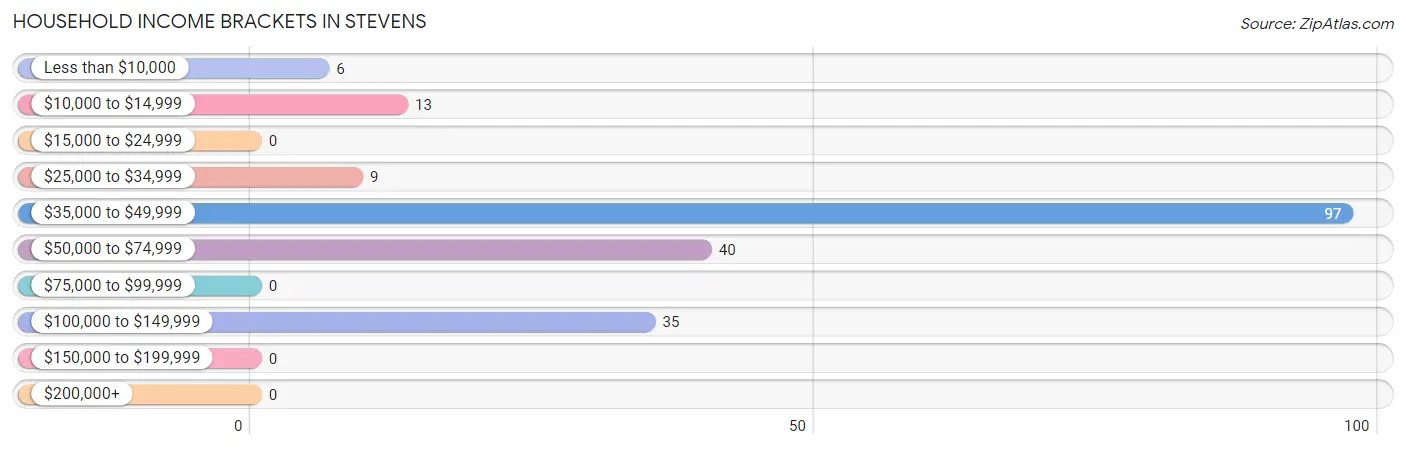
| Income Bracket | # Households | % Households |
| Less than $10,000 | 6 | 3.0% |
| $10,000 to $14,999 | 13 | 6.5% |
| $15,000 to $24,999 | 0 | 0.0% |
| $25,000 to $34,999 | 9 | 4.5% |
| $35,000 to $49,999 | 97 | 48.5% |
| $50,000 to $74,999 | 40 | 20.0% |
| $75,000 to $99,999 | 0 | 0.0% |
| $100,000 to $149,999 | 35 | 17.5% |
| $150,000 to $199,999 | 0 | 0.0% |
| $200,000+ | 0 | 0.0% |
Household Income by Householder Age in Stevens
The median household income in Stevens is $46,250, with the highest median household income of $53,056 found in the 65+ years age bracket for the primary householder. A total of 34 households (17.0%) fall into this category. Meanwhile, the 15 to 24 years age bracket for the primary householder has the lowest median household income of $0, with 65 households (32.5%) in this group.
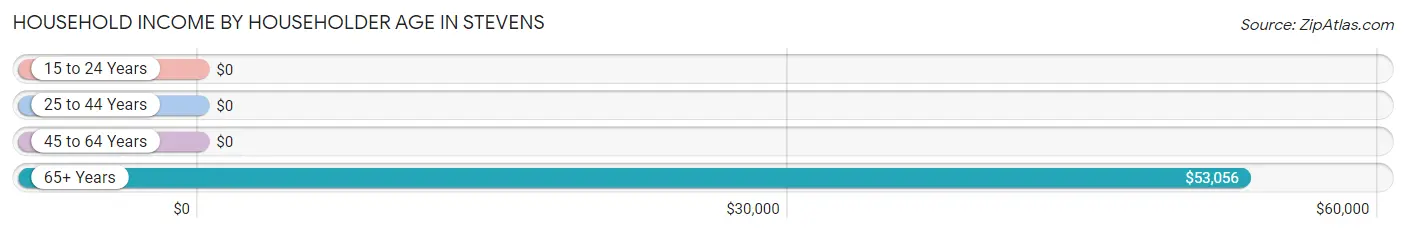
| Income Bracket | # Households | Median Income |
| 15 to 24 Years | 65 (32.5%) | $0 |
| 25 to 44 Years | 65 (32.5%) | $0 |
| 45 to 64 Years | 36 (18.0%) | $0 |
| 65+ Years | 34 (17.0%) | $53,056 |
| Total | 200 (100.0%) | $46,250 |
Poverty in Stevens
Income Below Poverty by Sex and Age in Stevens
With 20.0% poverty level for males and 16.7% for females among the residents of Stevens, under 5 year old males and 16 and 17 year old females are the most vulnerable to poverty, with 5 males (100.0%) and 6 females (100.0%) in their respective age groups living below the poverty level.
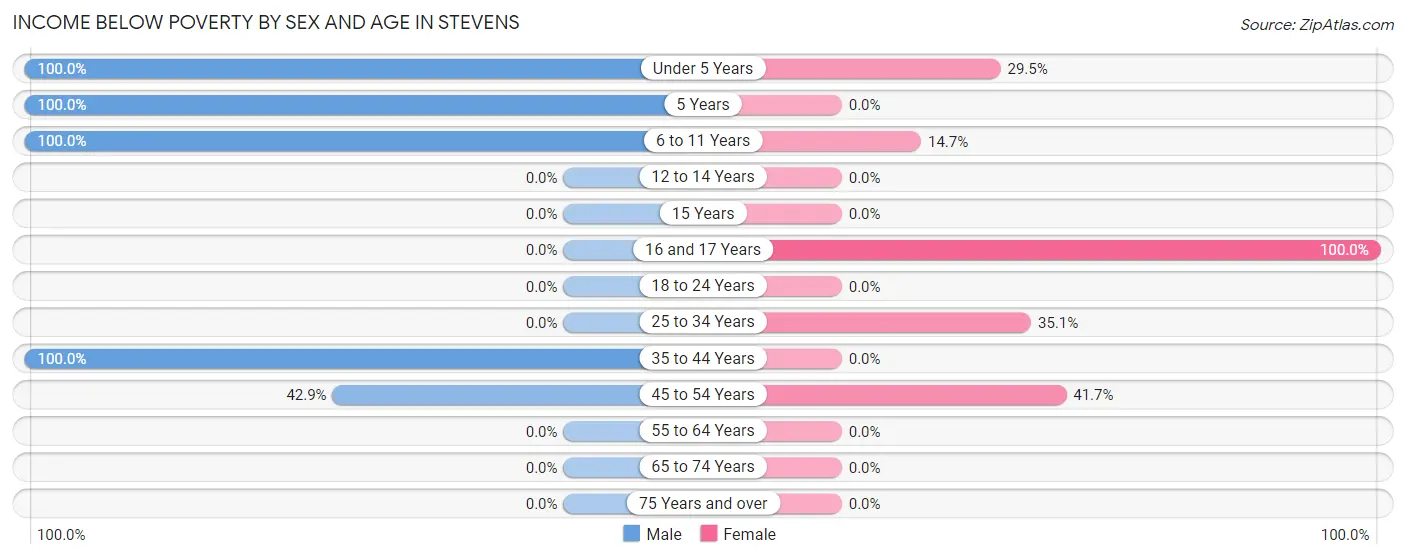
| Age Bracket | Male | Female |
| Under 5 Years | 5 (100.0%) | 28 (29.5%) |
| 5 Years | 4 (100.0%) | 0 (0.0%) |
| 6 to 11 Years | 14 (100.0%) | 5 (14.7%) |
| 12 to 14 Years | 0 (0.0%) | 0 (0.0%) |
| 15 Years | 0 (0.0%) | 0 (0.0%) |
| 16 and 17 Years | 0 (0.0%) | 6 (100.0%) |
| 18 to 24 Years | 0 (0.0%) | 0 (0.0%) |
| 25 to 34 Years | 0 (0.0%) | 13 (35.1%) |
| 35 to 44 Years | 10 (100.0%) | 0 (0.0%) |
| 45 to 54 Years | 6 (42.9%) | 5 (41.7%) |
| 55 to 64 Years | 0 (0.0%) | 0 (0.0%) |
| 65 to 74 Years | 0 (0.0%) | 0 (0.0%) |
| 75 Years and over | 0 (0.0%) | 0 (0.0%) |
| Total | 39 (20.0%) | 57 (16.7%) |
Income Above Poverty by Sex and Age in Stevens
According to the poverty statistics in Stevens, males aged 18 to 24 years and females aged 5 years are the age groups that are most secure financially, with 100.0% of males and 100.0% of females in these age groups living above the poverty line.
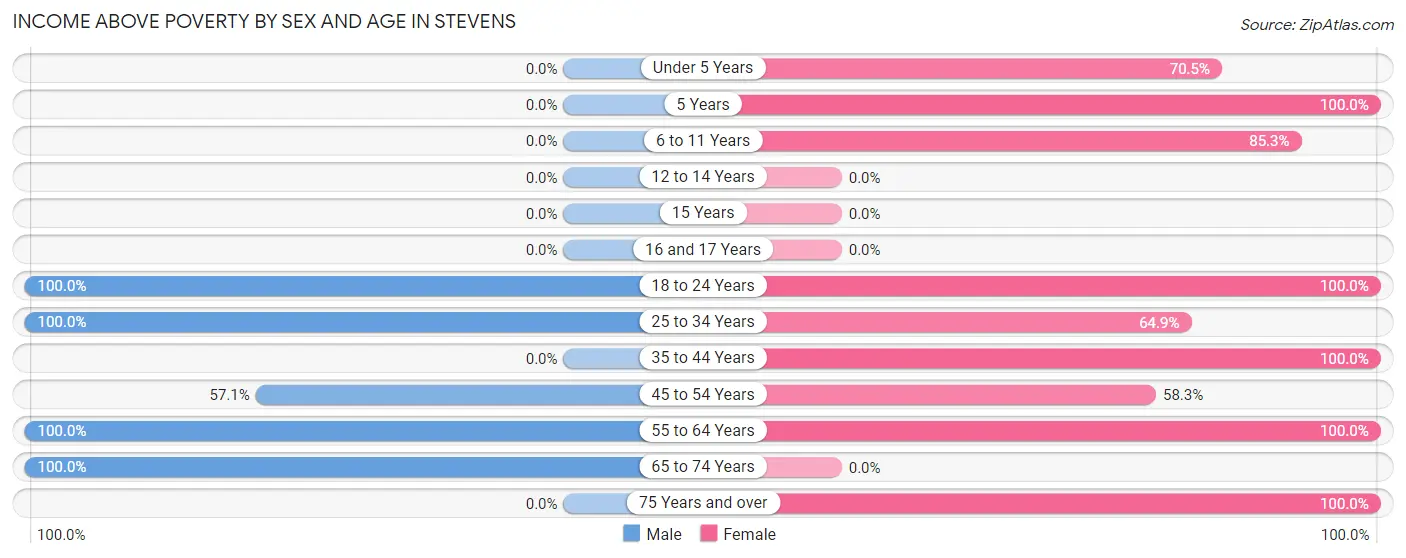
| Age Bracket | Male | Female |
| Under 5 Years | 0 (0.0%) | 67 (70.5%) |
| 5 Years | 0 (0.0%) | 29 (100.0%) |
| 6 to 11 Years | 0 (0.0%) | 29 (85.3%) |
| 12 to 14 Years | 0 (0.0%) | 0 (0.0%) |
| 15 Years | 0 (0.0%) | 0 (0.0%) |
| 16 and 17 Years | 0 (0.0%) | 0 (0.0%) |
| 18 to 24 Years | 79 (100.0%) | 67 (100.0%) |
| 25 to 34 Years | 27 (100.0%) | 24 (64.9%) |
| 35 to 44 Years | 0 (0.0%) | 25 (100.0%) |
| 45 to 54 Years | 8 (57.1%) | 7 (58.3%) |
| 55 to 64 Years | 23 (100.0%) | 21 (100.0%) |
| 65 to 74 Years | 19 (100.0%) | 0 (0.0%) |
| 75 Years and over | 0 (0.0%) | 15 (100.0%) |
| Total | 156 (80.0%) | 284 (83.3%) |
Income Below Poverty Among Married-Couple Families in Stevens
The poverty statistics for married-couple families in Stevens show that 4.7% or 6 of the total 128 families live below the poverty line. Families with 5 or more children have the highest poverty rate of 100.0%, comprising of 6 families. On the other hand, families with no children have the lowest poverty rate of 0.0%, which includes 0 families.

| Children | Above Poverty | Below Poverty |
| No Children | 30 (100.0%) | 0 (0.0%) |
| 1 or 2 Children | 92 (100.0%) | 0 (0.0%) |
| 3 or 4 Children | 0 (0.0%) | 0 (0.0%) |
| 5 or more Children | 0 (0.0%) | 6 (100.0%) |
| Total | 122 (95.3%) | 6 (4.7%) |
Income Below Poverty Among Single-Parent Households in Stevens
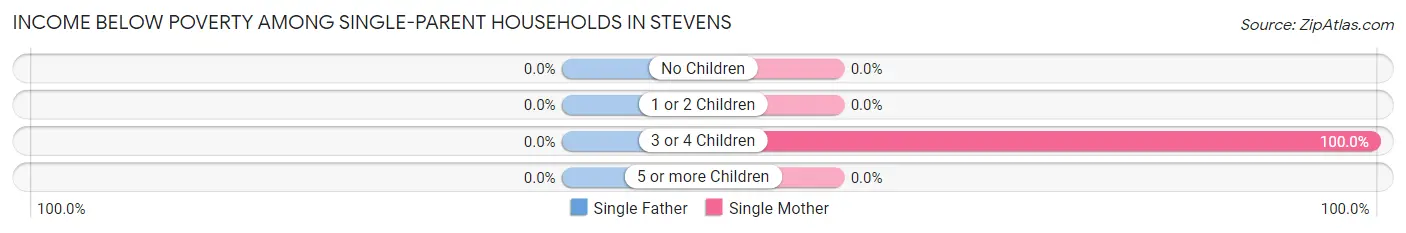
| Children | Single Father | Single Mother |
| No Children | 0 (0.0%) | 0 (0.0%) |
| 1 or 2 Children | 0 (0.0%) | 0 (0.0%) |
| 3 or 4 Children | 0 (0.0%) | 13 (100.0%) |
| 5 or more Children | 0 (0.0%) | 0 (0.0%) |
| Total | 0 (0.0%) | 13 (34.2%) |
Income Below Poverty Among Married-Couple vs Single-Parent Households in Stevens
The poverty data for Stevens shows that 6 of the married-couple family households (4.7%) and 13 of the single-parent households (34.2%) are living below the poverty level. Within the married-couple family households, those with 5 or more children have the highest poverty rate, with 6 households (100.0%) falling below the poverty line. Among the single-parent households, those with 3 or 4 children have the highest poverty rate, with 13 household (100.0%) living below poverty.
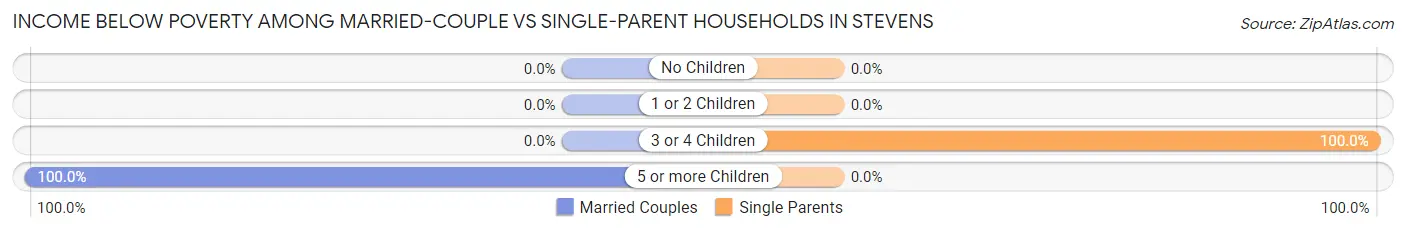
| Children | Married-Couple Families | Single-Parent Households |
| No Children | 0 (0.0%) | 0 (0.0%) |
| 1 or 2 Children | 0 (0.0%) | 0 (0.0%) |
| 3 or 4 Children | 0 (0.0%) | 13 (100.0%) |
| 5 or more Children | 6 (100.0%) | 0 (0.0%) |
| Total | 6 (4.7%) | 13 (34.2%) |
Race in Stevens
The most populous races in Stevens are White / Caucasian (417 | 77.8%), Black / African American (61 | 11.4%), and Two or more Races (58 | 10.8%).
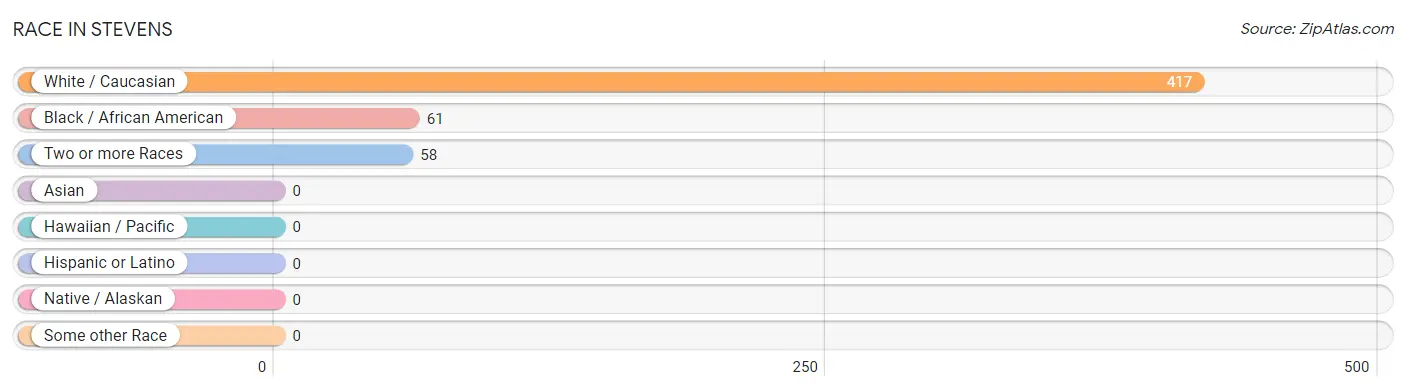
| Race | # Population | % Population |
| Asian | 0 | 0.0% |
| Black / African American | 61 | 11.4% |
| Hawaiian / Pacific | 0 | 0.0% |
| Hispanic or Latino | 0 | 0.0% |
| Native / Alaskan | 0 | 0.0% |
| White / Caucasian | 417 | 77.8% |
| Two or more Races | 58 | 10.8% |
| Some other Race | 0 | 0.0% |
| Total | 536 | 100.0% |
Ancestry in Stevens
The most populous ancestries reported in Stevens are German (39 | 7.3%), Italian (22 | 4.1%), Irish (16 | 3.0%), Polish (9 | 1.7%), and Austrian (8 | 1.5%), together accounting for 17.5% of all Stevens residents.
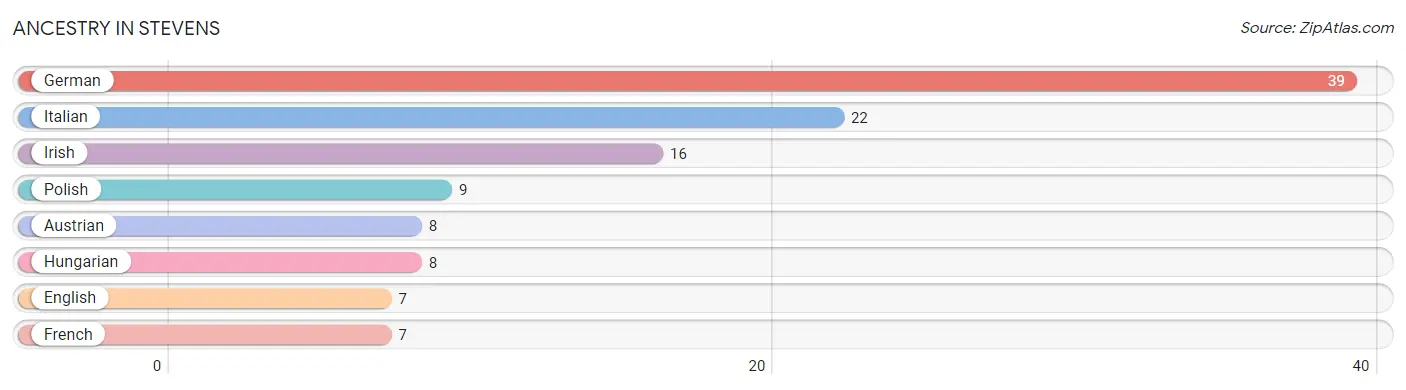
| Ancestry | # Population | % Population |
| Austrian | 8 | 1.5% |
| English | 7 | 1.3% |
| French | 7 | 1.3% |
| German | 39 | 7.3% |
| Hungarian | 8 | 1.5% |
| Irish | 16 | 3.0% |
| Italian | 22 | 4.1% |
| Polish | 9 | 1.7% | View All 8 Rows |
Immigrants in Stevens

| Immigration Origin | # Population | % Population | View All 0 Rows |
Sex and Age in Stevens
Sex and Age in Stevens
The most populous age groups in Stevens are 20 to 24 Years (73 | 37.4%) for men and Under 5 Years (95 | 27.9%) for women.
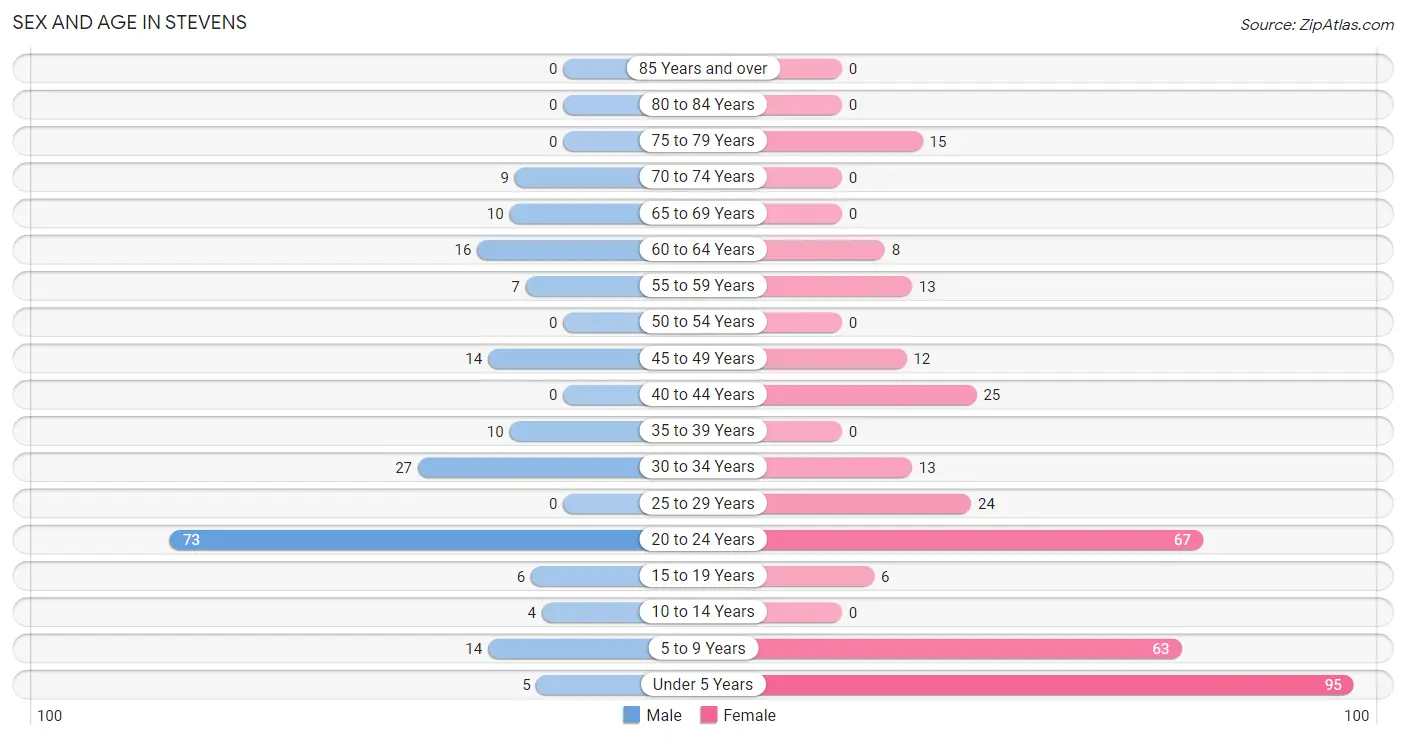
| Age Bracket | Male | Female |
| Under 5 Years | 5 (2.6%) | 95 (27.9%) |
| 5 to 9 Years | 14 (7.2%) | 63 (18.5%) |
| 10 to 14 Years | 4 (2.1%) | 0 (0.0%) |
| 15 to 19 Years | 6 (3.1%) | 6 (1.8%) |
| 20 to 24 Years | 73 (37.4%) | 67 (19.7%) |
| 25 to 29 Years | 0 (0.0%) | 24 (7.0%) |
| 30 to 34 Years | 27 (13.9%) | 13 (3.8%) |
| 35 to 39 Years | 10 (5.1%) | 0 (0.0%) |
| 40 to 44 Years | 0 (0.0%) | 25 (7.3%) |
| 45 to 49 Years | 14 (7.2%) | 12 (3.5%) |
| 50 to 54 Years | 0 (0.0%) | 0 (0.0%) |
| 55 to 59 Years | 7 (3.6%) | 13 (3.8%) |
| 60 to 64 Years | 16 (8.2%) | 8 (2.4%) |
| 65 to 69 Years | 10 (5.1%) | 0 (0.0%) |
| 70 to 74 Years | 9 (4.6%) | 0 (0.0%) |
| 75 to 79 Years | 0 (0.0%) | 15 (4.4%) |
| 80 to 84 Years | 0 (0.0%) | 0 (0.0%) |
| 85 Years and over | 0 (0.0%) | 0 (0.0%) |
| Total | 195 (100.0%) | 341 (100.0%) |
Families and Households in Stevens
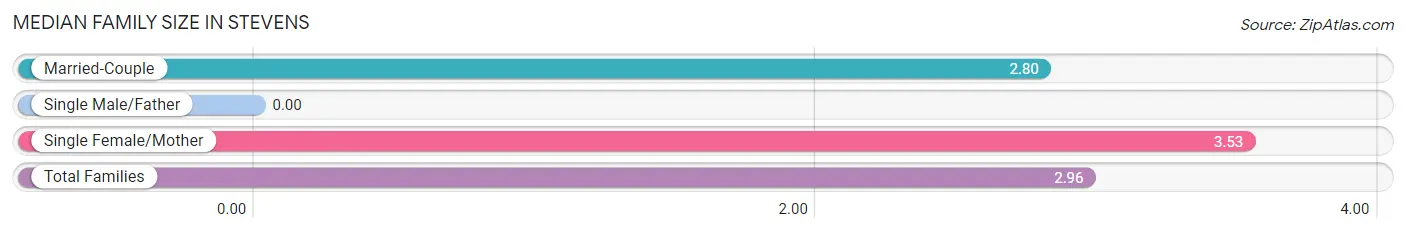
Median Family Size in Stevens
| Family Type | # Families | Family Size |
| Married-Couple | 128 (77.1%) | 2.80 |
| Single Male/Father | 0 (0.0%) | - |
| Single Female/Mother | 38 (22.9%) | 3.53 |
| Total Families | 166 (100.0%) | 2.96 |
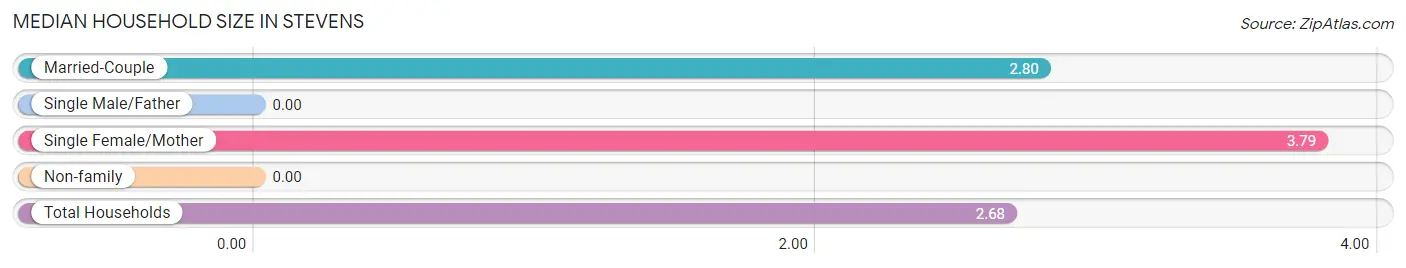
Median Household Size in Stevens
| Household Type | # Households | Household Size |
| Married-Couple | 128 (64.0%) | 2.80 |
| Single Male/Father | 0 (0.0%) | - |
| Single Female/Mother | 38 (19.0%) | 3.79 |
| Non-family | 34 (17.0%) | - |
| Total Households | 200 (100.0%) | 2.68 |
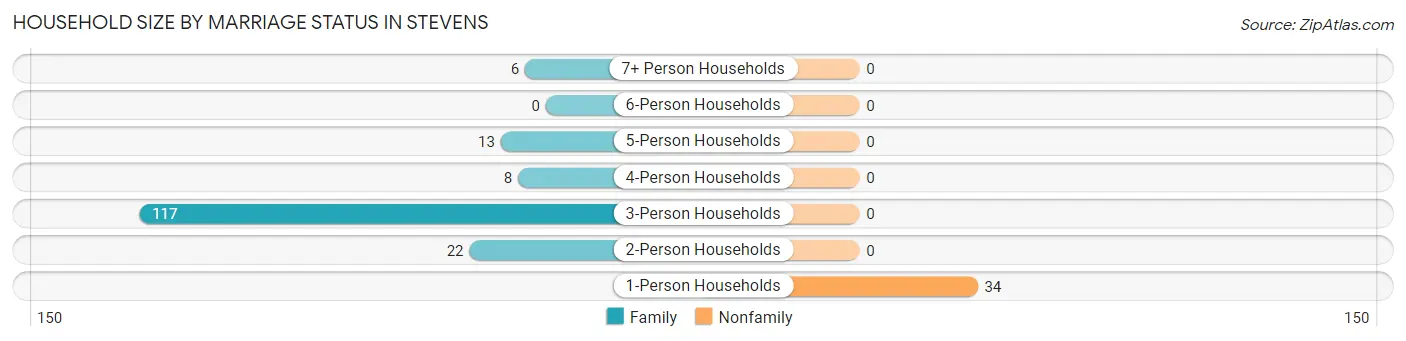
Household Size by Marriage Status in Stevens
Out of a total of 200 households in Stevens, 166 (83.0%) are family households, while 34 (17.0%) are nonfamily households. The most numerous type of family households are 3-person households, comprising 117, and the most common type of nonfamily households are 1-person households, comprising 34.
| Household Size | Family Households | Nonfamily Households |
| 1-Person Households | - | 34 (17.0%) |
| 2-Person Households | 22 (11.0%) | 0 (0.0%) |
| 3-Person Households | 117 (58.5%) | 0 (0.0%) |
| 4-Person Households | 8 (4.0%) | 0 (0.0%) |
| 5-Person Households | 13 (6.5%) | 0 (0.0%) |
| 6-Person Households | 0 (0.0%) | 0 (0.0%) |
| 7+ Person Households | 6 (3.0%) | 0 (0.0%) |
| Total | 166 (83.0%) | 34 (17.0%) |
Female Fertility in Stevens
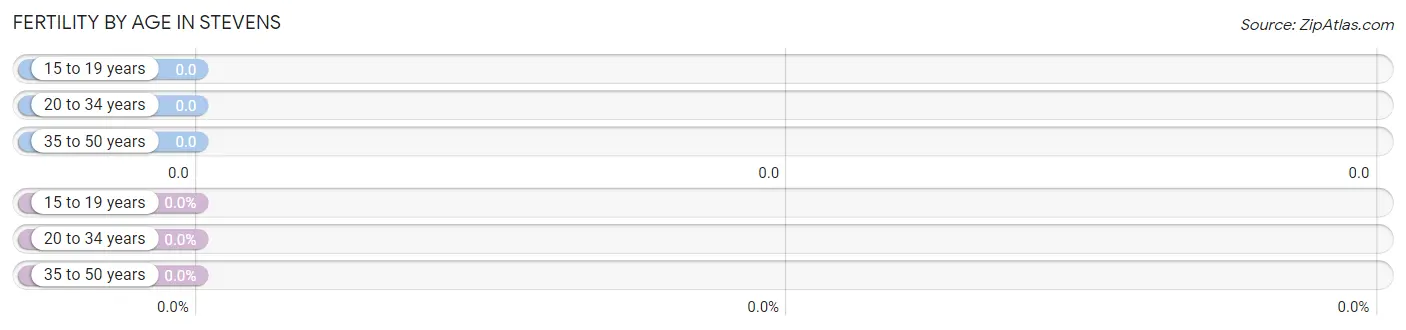
Fertility by Age in Stevens
| Age Bracket | Women with Births | Births / 1,000 Women |
| 15 to 19 years | 0 (0.0%) | 0.0 |
| 20 to 34 years | 0 (0.0%) | 0.0 |
| 35 to 50 years | 0 (0.0%) | 0.0 |
| Total | 0 (0.0%) | 0.0 |
Fertility by Age by Marriage Status in Stevens
| Age Bracket | Married | Unmarried |
| 15 to 19 years | 0 (0.0%) | 0 (0.0%) |
| 20 to 34 years | 0 (0.0%) | 0 (0.0%) |
| 35 to 50 years | 0 (0.0%) | 0 (0.0%) |
| Total | 0 (0.0%) | 0 (0.0%) |
Fertility by Education in Stevens
| Educational Attainment | Women with Births | Births / 1,000 Women |
| Less than High School | 0 (0.0%) | 0.0 |
| High School Diploma | 0 (0.0%) | 0.0 |
| College or Associate's Degree | 0 (0.0%) | 0.0 |
| Bachelor's Degree | 0 (0.0%) | 0.0 |
| Graduate Degree | 0 (0.0%) | 0.0 |
| Total | 0 (0.0%) | 0.0 |
Fertility by Education by Marriage Status in Stevens
| Educational Attainment | Married | Unmarried |
| Less than High School | 0 (0.0%) | 0 (0.0%) |
| High School Diploma | 0 (0.0%) | 0 (0.0%) |
| College or Associate's Degree | 0 (0.0%) | 0 (0.0%) |
| Bachelor's Degree | 0 (0.0%) | 0 (0.0%) |
| Graduate Degree | 0 (0.0%) | 0 (0.0%) |
| Total | 0 (0.0%) | 0 (0.0%) |
Employment Characteristics in Stevens
Employment by Class of Employer in Stevens
Among the 207 employed individuals in Stevens, private company employees (185 | 89.4%), self-employed (not incorporated) (15 | 7.2%), and not-for-profit organizations (7 | 3.4%) make up the most common classes of employment.
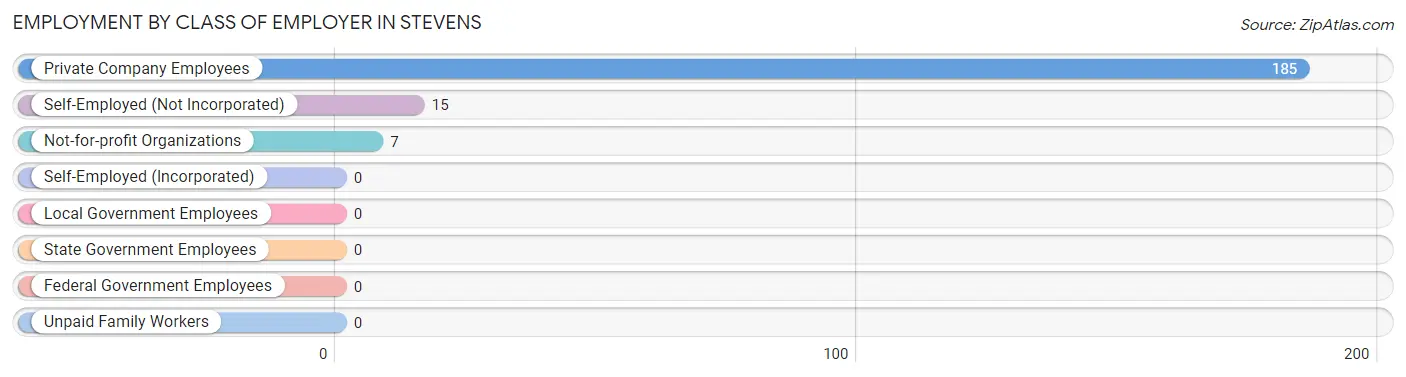
| Employer Class | # Employees | % Employees |
| Private Company Employees | 185 | 89.4% |
| Self-Employed (Incorporated) | 0 | 0.0% |
| Self-Employed (Not Incorporated) | 15 | 7.2% |
| Not-for-profit Organizations | 7 | 3.4% |
| Local Government Employees | 0 | 0.0% |
| State Government Employees | 0 | 0.0% |
| Federal Government Employees | 0 | 0.0% |
| Unpaid Family Workers | 0 | 0.0% |
| Total | 207 | 100.0% |
Employment Status by Age in Stevens
According to the labor force statistics for Stevens, out of the total population over 16 years of age (355), 61.1% or 217 individuals are in the labor force, with 4.6% or 10 of them unemployed. The age group with the highest labor force participation rate is 25 to 29 years, with 100.0% or 24 individuals in the labor force. Within the labor force, the 35 to 44 years age range has the highest percentage of unemployed individuals, with 28.6% or 10 of them being unemployed.
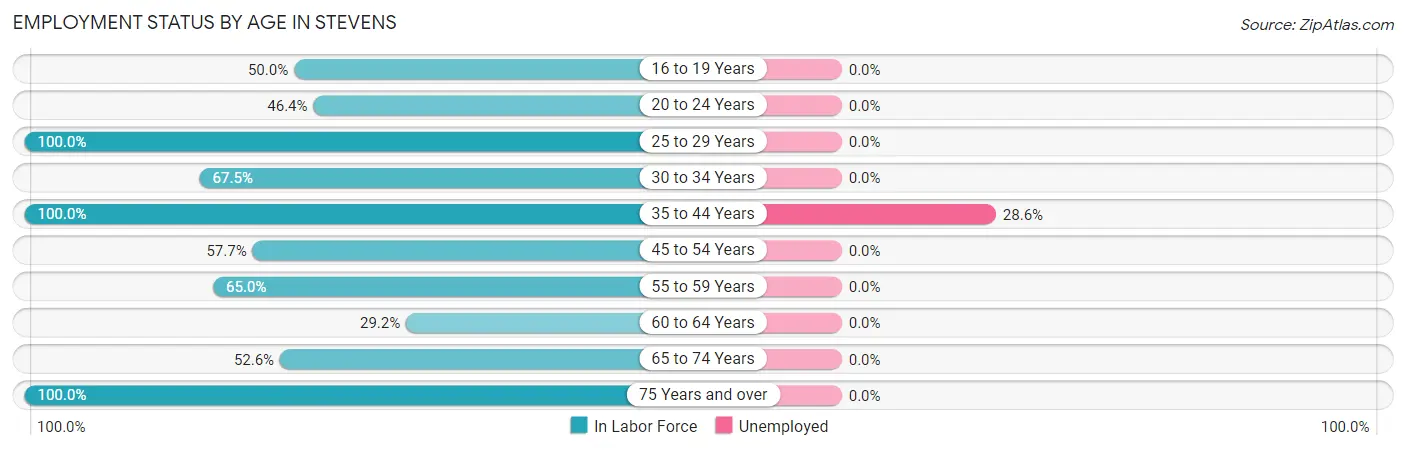
| Age Bracket | In Labor Force | Unemployed |
| 16 to 19 Years | 6 (50.0%) | 0 (0.0%) |
| 20 to 24 Years | 65 (46.4%) | 0 (0.0%) |
| 25 to 29 Years | 24 (100.0%) | 0 (0.0%) |
| 30 to 34 Years | 27 (67.5%) | 0 (0.0%) |
| 35 to 44 Years | 35 (100.0%) | 10 (28.6%) |
| 45 to 54 Years | 15 (57.7%) | 0 (0.0%) |
| 55 to 59 Years | 13 (65.0%) | 0 (0.0%) |
| 60 to 64 Years | 7 (29.2%) | 0 (0.0%) |
| 65 to 74 Years | 10 (52.6%) | 0 (0.0%) |
| 75 Years and over | 15 (100.0%) | 0 (0.0%) |
| Total | 217 (61.1%) | 10 (4.6%) |
Employment Status by Educational Attainment in Stevens
According to labor force statistics for Stevens, 71.6% of individuals (121) out of the total population between 25 and 64 years of age (169) are in the labor force, with 8.3% or 10 of them being unemployed. The group with the highest labor force participation rate are those with the educational attainment of less than high school, with 100.0% or 6 individuals in the labor force. Within the labor force, individuals with college / associate degree education have the highest percentage of unemployment, with 29.4% or 10 of them being unemployed.
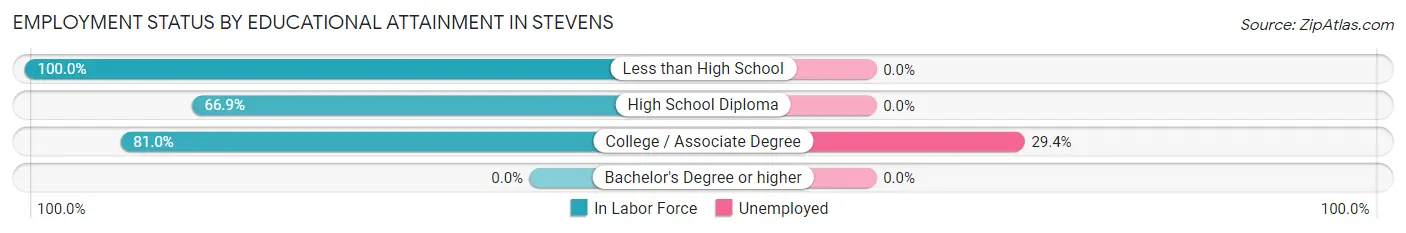
| Educational Attainment | In Labor Force | Unemployed |
| Less than High School | 6 (100.0%) | 0 (0.0%) |
| High School Diploma | 81 (66.9%) | 0 (0.0%) |
| College / Associate Degree | 34 (81.0%) | 12 (29.4%) |
| Bachelor's Degree or higher | 0 (0.0%) | 0 (0.0%) |
| Total | 121 (71.6%) | 14 (8.3%) |
Employment Occupations by Sex in Stevens
Management, Business, Science and Arts Occupations
Management, Business, Science and Arts Occupations by Sex
| Occupation | Male | Female |
| Management | 0 (0.0%) | 0 (0.0%) |
| Business & Financial | 0 (0.0%) | 0 (0.0%) |
| Computers, Engineering & Science | 0 (0.0%) | 0 (0.0%) |
| Computers & Mathematics | 0 (0.0%) | 0 (0.0%) |
| Architecture & Engineering | 0 (0.0%) | 0 (0.0%) |
| Life, Physical & Social Science | 0 (0.0%) | 0 (0.0%) |
| Community & Social Service | 0 (0.0%) | 0 (0.0%) |
| Education, Arts & Media | 0 (0.0%) | 0 (0.0%) |
| Legal Services & Support | 0 (0.0%) | 0 (0.0%) |
| Education Instruction & Library | 0 (0.0%) | 0 (0.0%) |
| Arts, Media & Entertainment | 0 (0.0%) | 0 (0.0%) |
| Health Diagnosing & Treating | 0 (0.0%) | 0 (0.0%) |
| Health Technologists | 0 (0.0%) | 0 (0.0%) |
| Total (Category) | 0 (0.0%) | 0 (0.0%) |
| Total (Overall) | 123 (59.4%) | 84 (40.6%) |
Services Occupations
The most common Services occupations in Stevens are , and Personal Care & Service (7 | 3.4%).
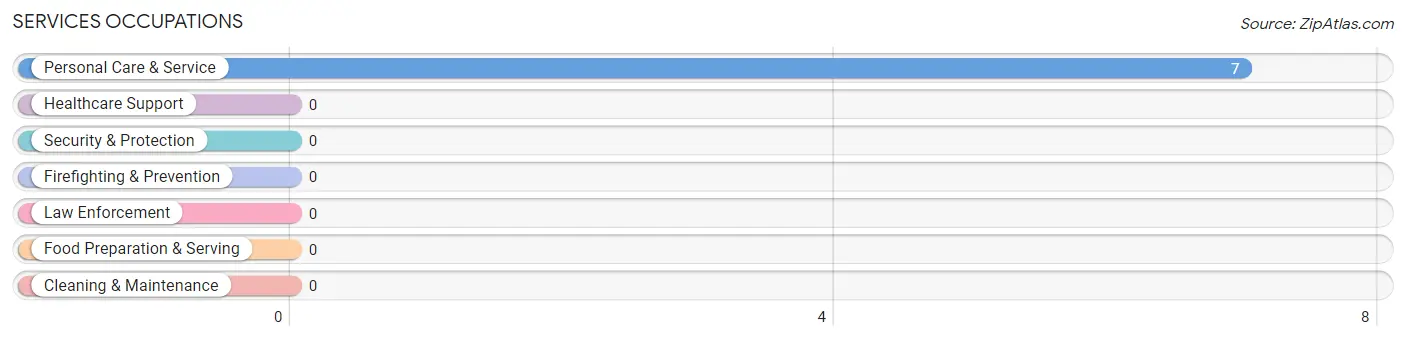
Services Occupations by Sex
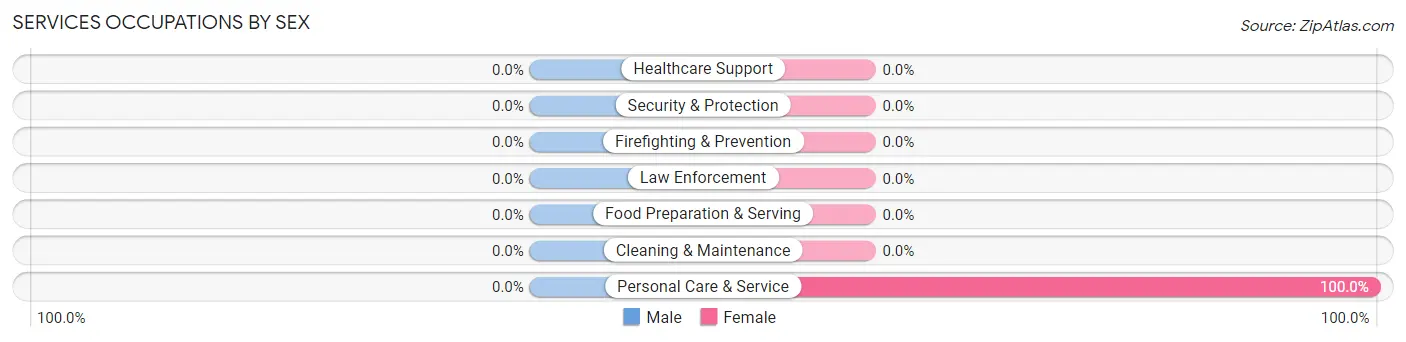
| Occupation | Male | Female |
| Healthcare Support | 0 (0.0%) | 0 (0.0%) |
| Security & Protection | 0 (0.0%) | 0 (0.0%) |
| Firefighting & Prevention | 0 (0.0%) | 0 (0.0%) |
| Law Enforcement | 0 (0.0%) | 0 (0.0%) |
| Food Preparation & Serving | 0 (0.0%) | 0 (0.0%) |
| Cleaning & Maintenance | 0 (0.0%) | 0 (0.0%) |
| Personal Care & Service | 0 (0.0%) | 7 (100.0%) |
| Total (Category) | 0 (0.0%) | 7 (100.0%) |
| Total (Overall) | 123 (59.4%) | 84 (40.6%) |
Sales and Office Occupations
The most common Sales and Office occupations in Stevens are Office & Administration (41 | 19.8%), and Sales & Related (40 | 19.3%).
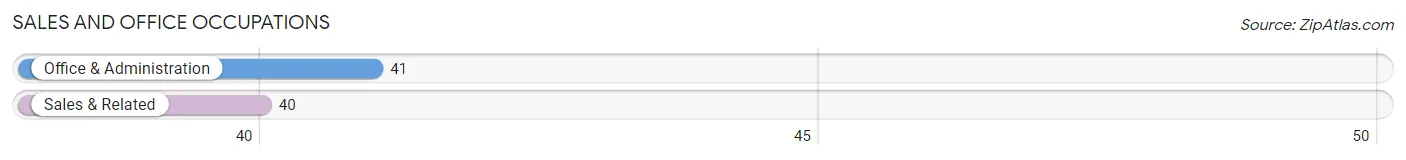
Sales and Office Occupations by Sex
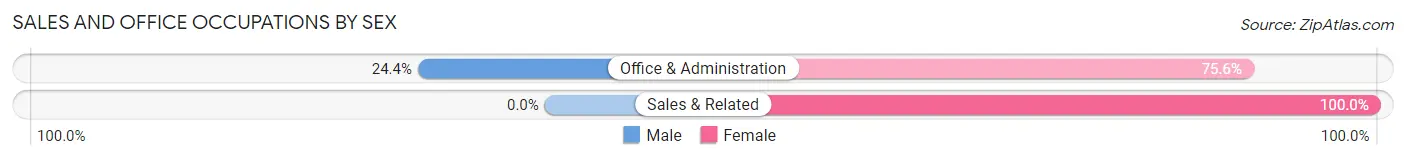
| Occupation | Male | Female |
| Sales & Related | 0 (0.0%) | 40 (100.0%) |
| Office & Administration | 10 (24.4%) | 31 (75.6%) |
| Total (Category) | 10 (12.3%) | 71 (87.6%) |
| Total (Overall) | 123 (59.4%) | 84 (40.6%) |
Natural Resources, Construction and Maintenance Occupations
The most common Natural Resources, Construction and Maintenance occupations in Stevens are Construction & Extraction (100 | 48.3%), and Installation, Maintenance & Repair (6 | 2.9%).
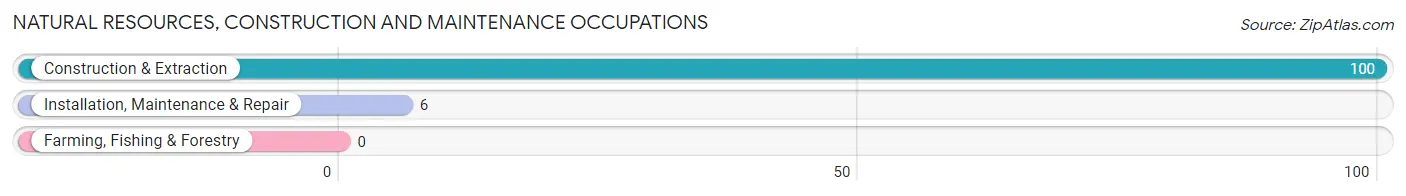
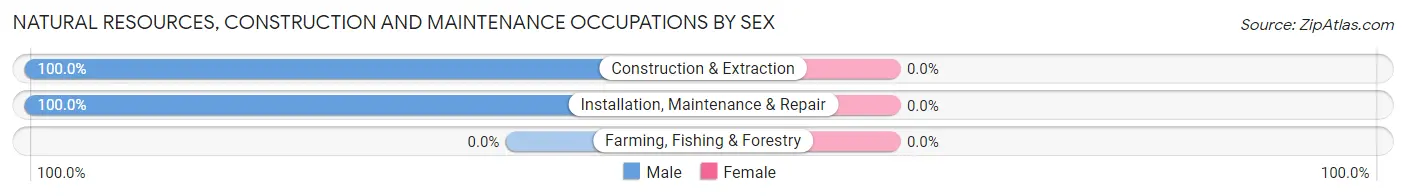
Natural Resources, Construction and Maintenance Occupations by Sex
| Occupation | Male | Female |
| Farming, Fishing & Forestry | 0 (0.0%) | 0 (0.0%) |
| Construction & Extraction | 100 (100.0%) | 0 (0.0%) |
| Installation, Maintenance & Repair | 6 (100.0%) | 0 (0.0%) |
| Total (Category) | 106 (100.0%) | 0 (0.0%) |
| Total (Overall) | 123 (59.4%) | 84 (40.6%) |
Production, Transportation and Moving Occupations
The most common Production, Transportation and Moving occupations in Stevens are , and Production (13 | 6.3%).
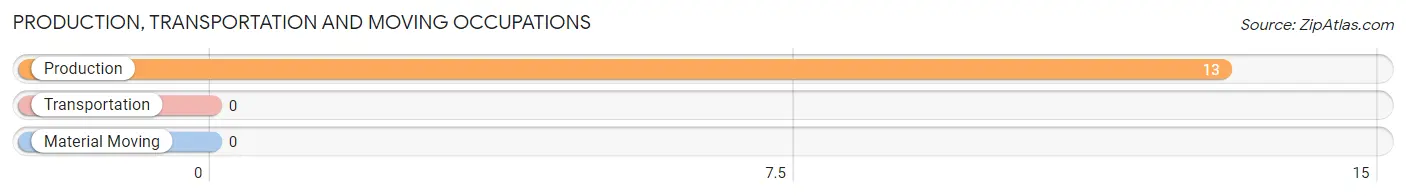
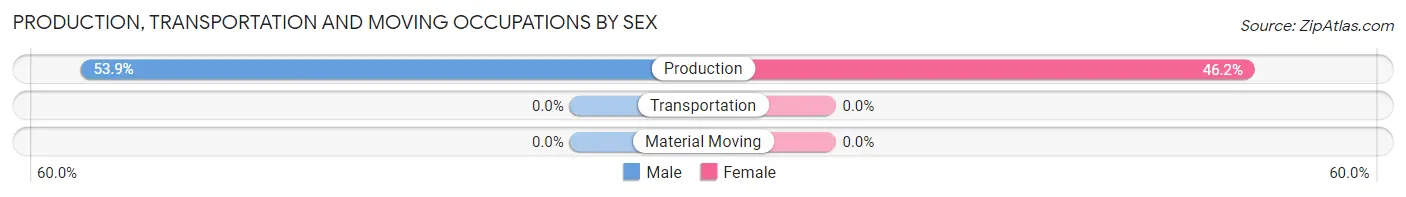
Production, Transportation and Moving Occupations by Sex
| Occupation | Male | Female |
| Production | 7 (53.8%) | 6 (46.2%) |
| Transportation | 0 (0.0%) | 0 (0.0%) |
| Material Moving | 0 (0.0%) | 0 (0.0%) |
| Total (Category) | 7 (53.8%) | 6 (46.2%) |
| Total (Overall) | 123 (59.4%) | 84 (40.6%) |
Employment Industries by Sex in Stevens
Employment Industries in Stevens
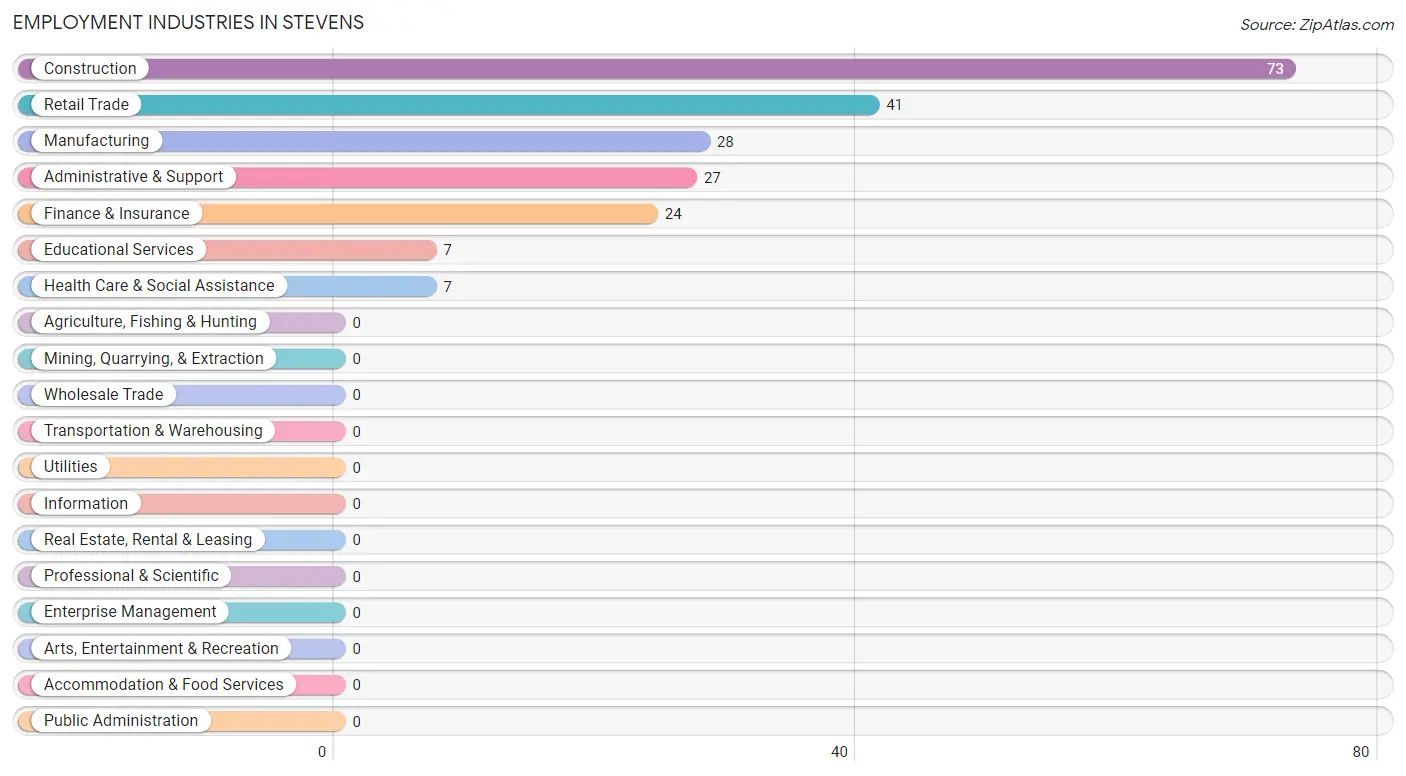
The major employment industries in Stevens include Construction (73 | 35.3%), Retail Trade (41 | 19.8%), Manufacturing (28 | 13.5%), Administrative & Support (27 | 13.0%), and Finance & Insurance (24 | 11.6%).
Employment Industries by Sex in Stevens
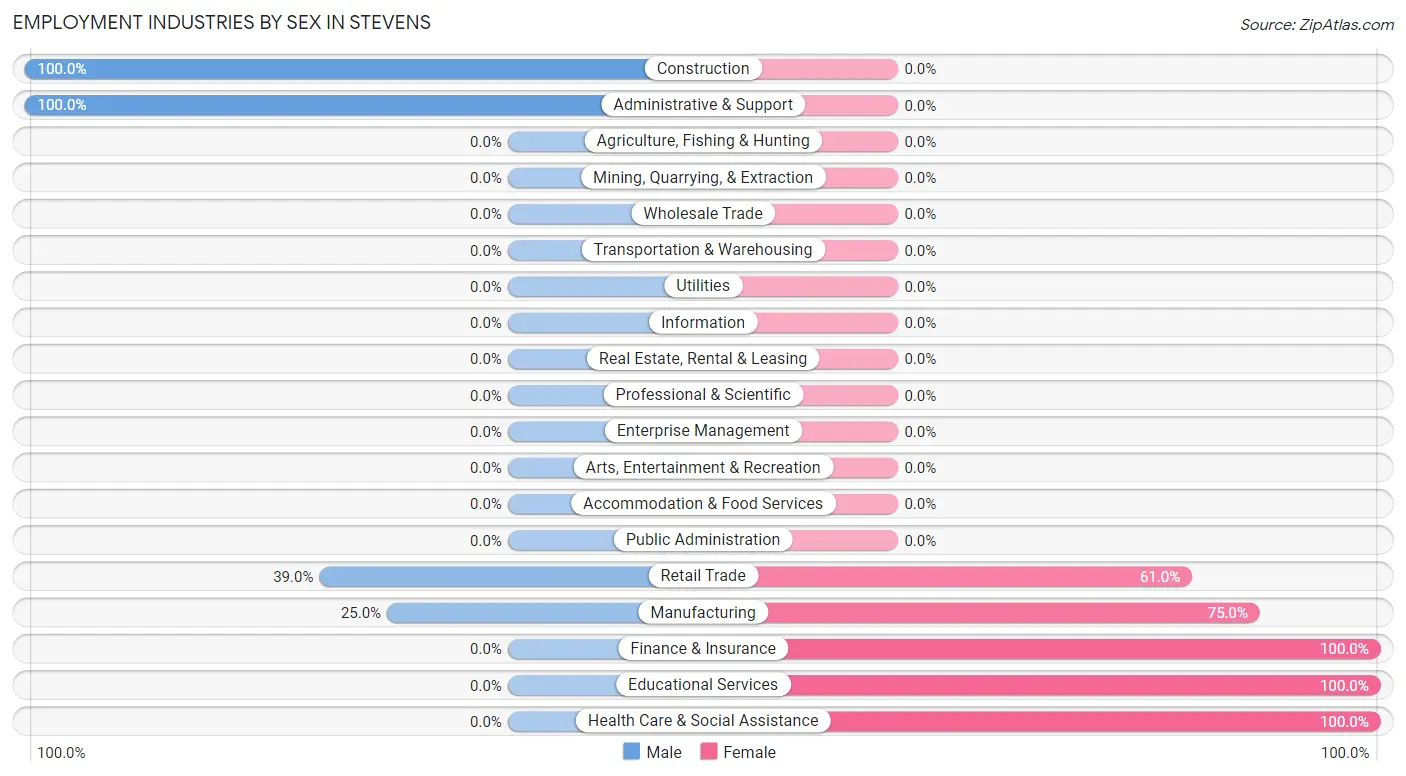
The Stevens industries that see more men than women are Construction (100.0%), Administrative & Support (100.0%), and Retail Trade (39.0%), whereas the industries that tend to have a higher number of women are Finance & Insurance (100.0%), Educational Services (100.0%), and Health Care & Social Assistance (100.0%).
| Industry | Male | Female |
| Agriculture, Fishing & Hunting | 0 (0.0%) | 0 (0.0%) |
| Mining, Quarrying, & Extraction | 0 (0.0%) | 0 (0.0%) |
| Construction | 73 (100.0%) | 0 (0.0%) |
| Manufacturing | 7 (25.0%) | 21 (75.0%) |
| Wholesale Trade | 0 (0.0%) | 0 (0.0%) |
| Retail Trade | 16 (39.0%) | 25 (61.0%) |
| Transportation & Warehousing | 0 (0.0%) | 0 (0.0%) |
| Utilities | 0 (0.0%) | 0 (0.0%) |
| Information | 0 (0.0%) | 0 (0.0%) |
| Finance & Insurance | 0 (0.0%) | 24 (100.0%) |
| Real Estate, Rental & Leasing | 0 (0.0%) | 0 (0.0%) |
| Professional & Scientific | 0 (0.0%) | 0 (0.0%) |
| Enterprise Management | 0 (0.0%) | 0 (0.0%) |
| Administrative & Support | 27 (100.0%) | 0 (0.0%) |
| Educational Services | 0 (0.0%) | 7 (100.0%) |
| Health Care & Social Assistance | 0 (0.0%) | 7 (100.0%) |
| Arts, Entertainment & Recreation | 0 (0.0%) | 0 (0.0%) |
| Accommodation & Food Services | 0 (0.0%) | 0 (0.0%) |
| Public Administration | 0 (0.0%) | 0 (0.0%) |
| Total | 123 (59.4%) | 84 (40.6%) |
Education in Stevens
School Enrollment in Stevens
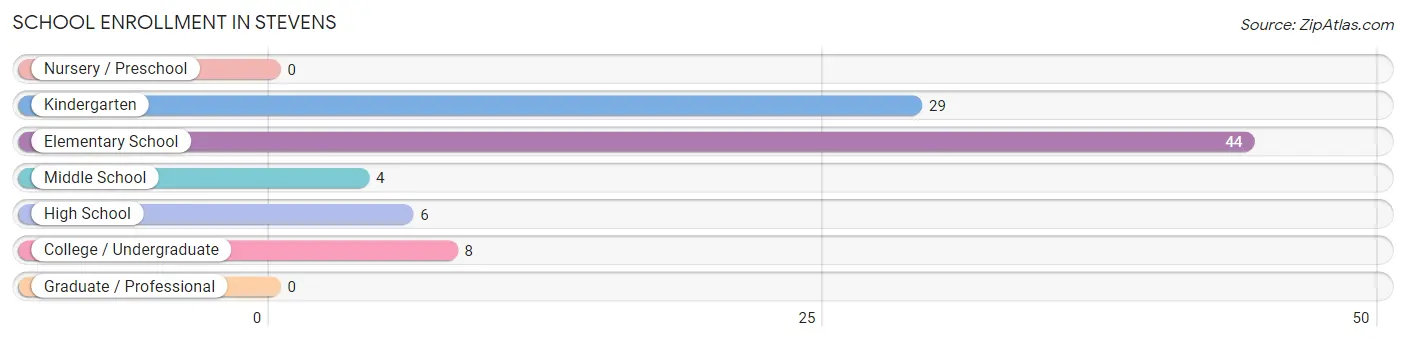
The most common levels of schooling among the 91 students in Stevens are elementary school (44 | 48.3%), kindergarten (29 | 31.9%), and college / undergraduate (8 | 8.8%).
| School Level | # Students | % Students |
| Nursery / Preschool | 0 | 0.0% |
| Kindergarten | 29 | 31.9% |
| Elementary School | 44 | 48.3% |
| Middle School | 4 | 4.4% |
| High School | 6 | 6.6% |
| College / Undergraduate | 8 | 8.8% |
| Graduate / Professional | 0 | 0.0% |
| Total | 91 | 100.0% |
School Enrollment by Age by Funding Source in Stevens
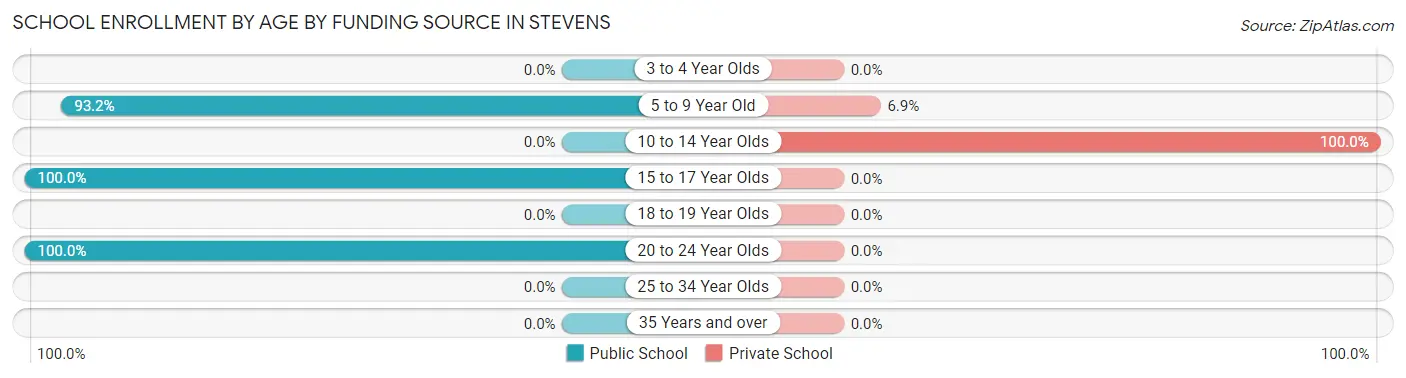
Out of a total of 91 students who are enrolled in schools in Stevens, 9 (9.9%) attend a private institution, while the remaining 82 (90.1%) are enrolled in public schools. The age group of 10 to 14 year olds has the highest likelihood of being enrolled in private schools, with 4 (100.0% in the age bracket) enrolled. Conversely, the age group of 15 to 17 year olds has the lowest likelihood of being enrolled in a private school, with 6 (100.0% in the age bracket) attending a public institution.
| Age Bracket | Public School | Private School |
| 3 to 4 Year Olds | 0 (0.0%) | 0 (0.0%) |
| 5 to 9 Year Old | 68 (93.1%) | 5 (6.9%) |
| 10 to 14 Year Olds | 0 (0.0%) | 4 (100.0%) |
| 15 to 17 Year Olds | 6 (100.0%) | 0 (0.0%) |
| 18 to 19 Year Olds | 0 (0.0%) | 0 (0.0%) |
| 20 to 24 Year Olds | 8 (100.0%) | 0 (0.0%) |
| 25 to 34 Year Olds | 0 (0.0%) | 0 (0.0%) |
| 35 Years and over | 0 (0.0%) | 0 (0.0%) |
| Total | 82 (90.1%) | 9 (9.9%) |
Educational Attainment by Field of Study in Stevens
| Field of Study | # Graduates | % Graduates |
| Computers & Mathematics | 0 | 0.0% |
| Bio, Nature & Agricultural | 0 | 0.0% |
| Physical & Health Sciences | 0 | 0.0% |
| Psychology | 0 | 0.0% |
| Social Sciences | 0 | 0.0% |
| Engineering | 0 | 0.0% |
| Multidisciplinary Studies | 0 | 0.0% |
| Science & Technology | 0 | 0.0% |
| Business | 0 | 0.0% |
| Education | 0 | 0.0% |
| Literature & Languages | 0 | 0.0% |
| Liberal Arts & History | 0 | 0.0% |
| Visual & Performing Arts | 0 | 0.0% |
| Communications | 0 | 0.0% |
| Arts & Humanities | 0 | 0.0% |
| Total | 0 | 0.0% |
Transportation & Commute in Stevens
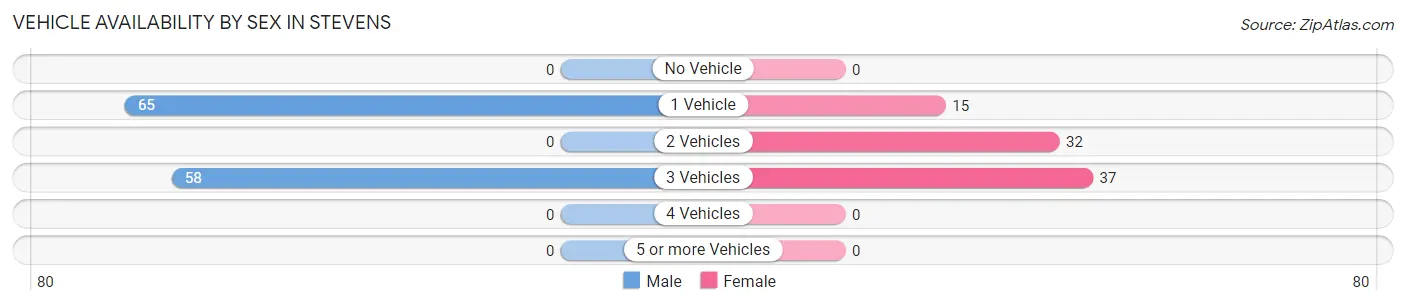
Vehicle Availability by Sex in Stevens
The most prevalent vehicle ownership categories in Stevens are males with 1 vehicle (65, accounting for 52.8%) and females with 1 vehicle (15, making up 77.4%).
| Vehicles Available | Male | Female |
| No Vehicle | 0 (0.0%) | 0 (0.0%) |
| 1 Vehicle | 65 (52.8%) | 15 (17.9%) |
| 2 Vehicles | 0 (0.0%) | 32 (38.1%) |
| 3 Vehicles | 58 (47.1%) | 37 (44.1%) |
| 4 Vehicles | 0 (0.0%) | 0 (0.0%) |
| 5 or more Vehicles | 0 (0.0%) | 0 (0.0%) |
| Total | 123 (100.0%) | 84 (100.0%) |
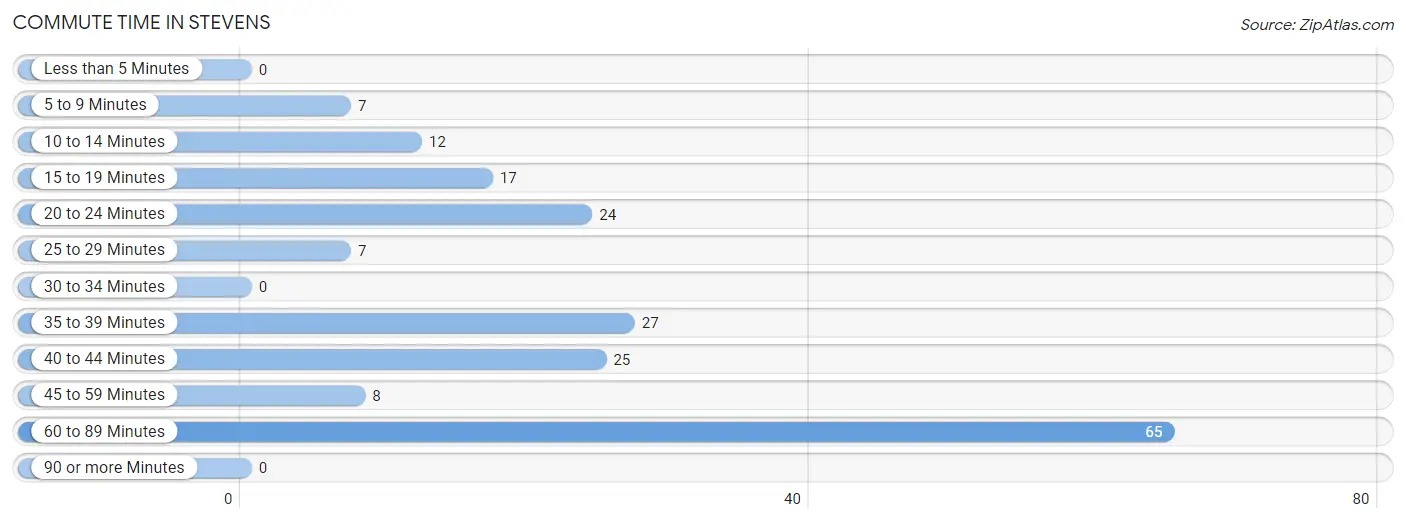
Commute Time in Stevens
The most frequently occuring commute durations in Stevens are 60 to 89 minutes (65 commuters, 33.9%), 35 to 39 minutes (27 commuters, 14.1%), and 40 to 44 minutes (25 commuters, 13.0%).
| Commute Time | # Commuters | % Commuters |
| Less than 5 Minutes | 0 | 0.0% |
| 5 to 9 Minutes | 7 | 3.6% |
| 10 to 14 Minutes | 12 | 6.2% |
| 15 to 19 Minutes | 17 | 8.8% |
| 20 to 24 Minutes | 24 | 12.5% |
| 25 to 29 Minutes | 7 | 3.6% |
| 30 to 34 Minutes | 0 | 0.0% |
| 35 to 39 Minutes | 27 | 14.1% |
| 40 to 44 Minutes | 25 | 13.0% |
| 45 to 59 Minutes | 8 | 4.2% |
| 60 to 89 Minutes | 65 | 33.9% |
| 90 or more Minutes | 0 | 0.0% |
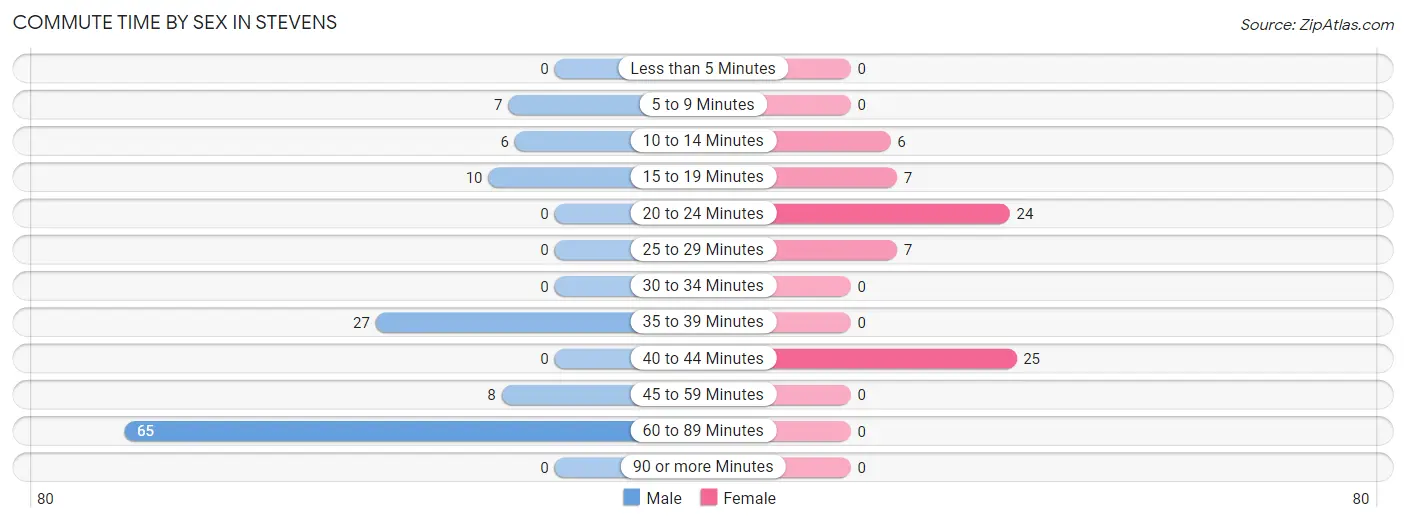
Commute Time by Sex in Stevens
The most common commute times in Stevens are 60 to 89 minutes (65 commuters, 52.8%) for males and 40 to 44 minutes (25 commuters, 36.2%) for females.
| Commute Time | Male | Female |
| Less than 5 Minutes | 0 (0.0%) | 0 (0.0%) |
| 5 to 9 Minutes | 7 (5.7%) | 0 (0.0%) |
| 10 to 14 Minutes | 6 (4.9%) | 6 (8.7%) |
| 15 to 19 Minutes | 10 (8.1%) | 7 (10.1%) |
| 20 to 24 Minutes | 0 (0.0%) | 24 (34.8%) |
| 25 to 29 Minutes | 0 (0.0%) | 7 (10.1%) |
| 30 to 34 Minutes | 0 (0.0%) | 0 (0.0%) |
| 35 to 39 Minutes | 27 (22.0%) | 0 (0.0%) |
| 40 to 44 Minutes | 0 (0.0%) | 25 (36.2%) |
| 45 to 59 Minutes | 8 (6.5%) | 0 (0.0%) |
| 60 to 89 Minutes | 65 (52.8%) | 0 (0.0%) |
| 90 or more Minutes | 0 (0.0%) | 0 (0.0%) |
Time of Departure to Work by Sex in Stevens
The most frequent times of departure to work in Stevens are 6:00 AM to 6:29 AM (65, 52.8%) for males and 7:00 AM to 7:29 AM (25, 36.2%) for females.
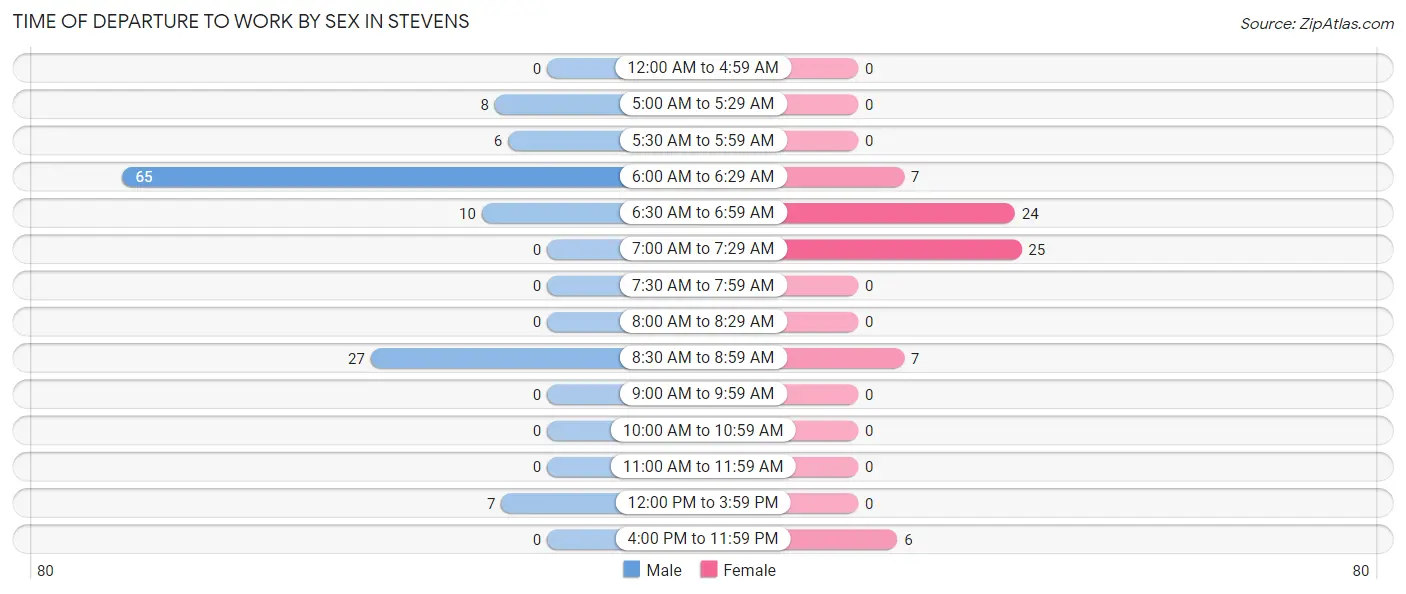
| Time of Departure | Male | Female |
| 12:00 AM to 4:59 AM | 0 (0.0%) | 0 (0.0%) |
| 5:00 AM to 5:29 AM | 8 (6.5%) | 0 (0.0%) |
| 5:30 AM to 5:59 AM | 6 (4.9%) | 0 (0.0%) |
| 6:00 AM to 6:29 AM | 65 (52.8%) | 7 (10.1%) |
| 6:30 AM to 6:59 AM | 10 (8.1%) | 24 (34.8%) |
| 7:00 AM to 7:29 AM | 0 (0.0%) | 25 (36.2%) |
| 7:30 AM to 7:59 AM | 0 (0.0%) | 0 (0.0%) |
| 8:00 AM to 8:29 AM | 0 (0.0%) | 0 (0.0%) |
| 8:30 AM to 8:59 AM | 27 (22.0%) | 7 (10.1%) |
| 9:00 AM to 9:59 AM | 0 (0.0%) | 0 (0.0%) |
| 10:00 AM to 10:59 AM | 0 (0.0%) | 0 (0.0%) |
| 11:00 AM to 11:59 AM | 0 (0.0%) | 0 (0.0%) |
| 12:00 PM to 3:59 PM | 7 (5.7%) | 0 (0.0%) |
| 4:00 PM to 11:59 PM | 0 (0.0%) | 6 (8.7%) |
| Total | 123 (100.0%) | 69 (100.0%) |
Housing Occupancy in Stevens
Occupancy by Ownership in Stevens
Of the total 200 dwellings in Stevens, owner-occupied units account for 160 (80.0%), while renter-occupied units make up 40 (20.0%).
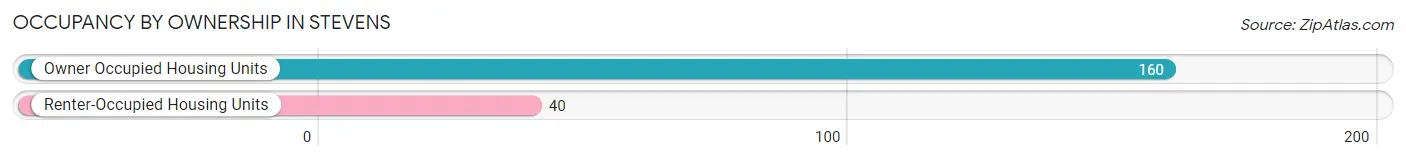
| Occupancy | # Housing Units | % Housing Units |
| Owner Occupied Housing Units | 160 | 80.0% |
| Renter-Occupied Housing Units | 40 | 20.0% |
| Total Occupied Housing Units | 200 | 100.0% |
Occupancy by Household Size in Stevens
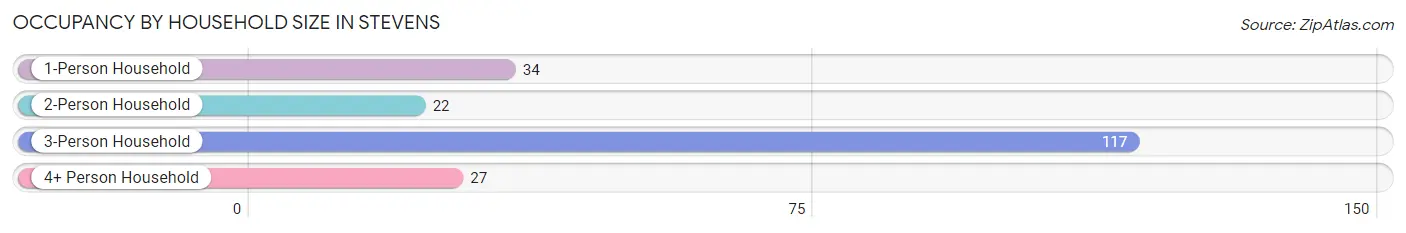
| Household Size | # Housing Units | % Housing Units |
| 1-Person Household | 34 | 17.0% |
| 2-Person Household | 22 | 11.0% |
| 3-Person Household | 117 | 58.5% |
| 4+ Person Household | 27 | 13.5% |
| Total Housing Units | 200 | 100.0% |
Occupancy by Ownership by Household Size in Stevens
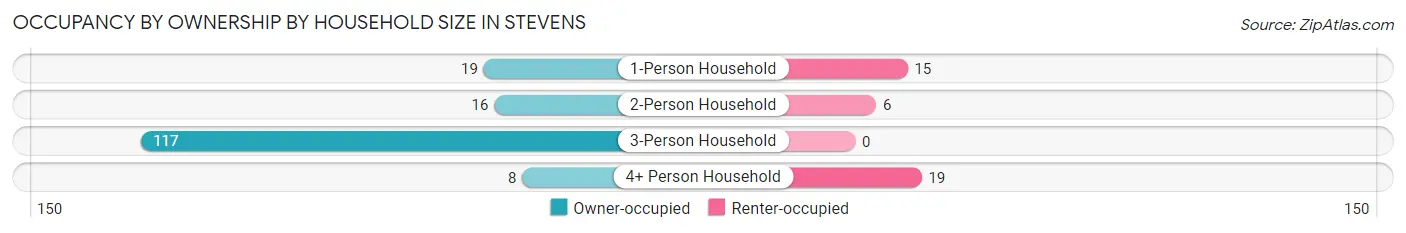
| Household Size | Owner-occupied | Renter-occupied |
| 1-Person Household | 19 (55.9%) | 15 (44.1%) |
| 2-Person Household | 16 (72.7%) | 6 (27.3%) |
| 3-Person Household | 117 (100.0%) | 0 (0.0%) |
| 4+ Person Household | 8 (29.6%) | 19 (70.4%) |
| Total Housing Units | 160 (80.0%) | 40 (20.0%) |
Occupancy by Educational Attainment in Stevens
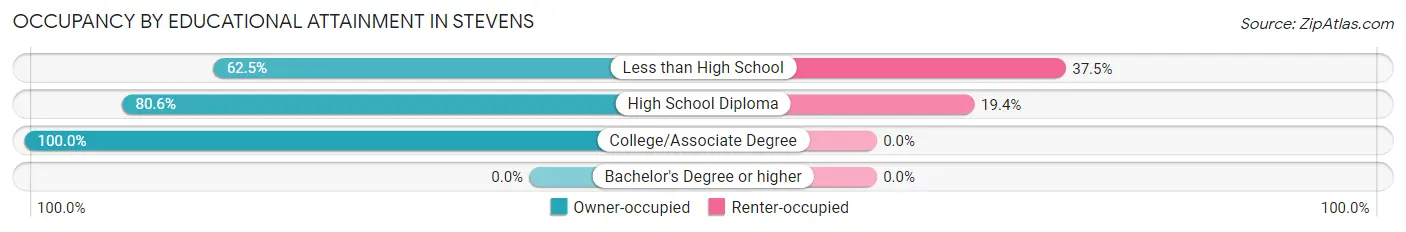
| Household Size | Owner-occupied | Renter-occupied |
| Less than High School | 10 (62.5%) | 6 (37.5%) |
| High School Diploma | 141 (80.6%) | 34 (19.4%) |
| College/Associate Degree | 9 (100.0%) | 0 (0.0%) |
| Bachelor's Degree or higher | 0 (0.0%) | 0 (0.0%) |
Occupancy by Age of Householder in Stevens
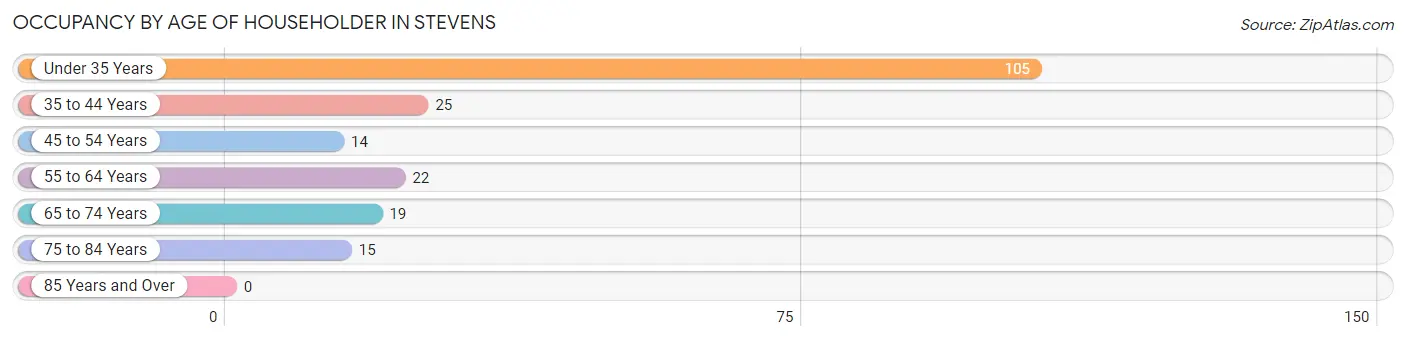
| Age Bracket | # Households | % Households |
| Under 35 Years | 105 | 52.5% |
| 35 to 44 Years | 25 | 12.5% |
| 45 to 54 Years | 14 | 7.0% |
| 55 to 64 Years | 22 | 11.0% |
| 65 to 74 Years | 19 | 9.5% |
| 75 to 84 Years | 15 | 7.5% |
| 85 Years and Over | 0 | 0.0% |
| Total | 200 | 100.0% |
Housing Finances in Stevens
Median Income by Occupancy in Stevens
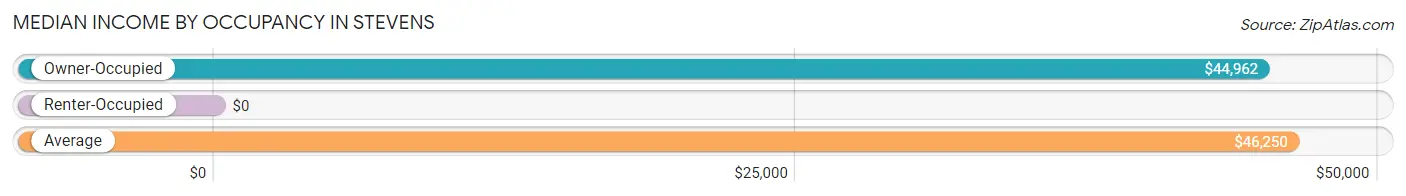
| Occupancy Type | # Households | Median Income |
| Owner-Occupied | 160 (80.0%) | $44,962 |
| Renter-Occupied | 40 (20.0%) | $0 |
| Average | 200 (100.0%) | $46,250 |
Occupancy by Householder Income Bracket in Stevens
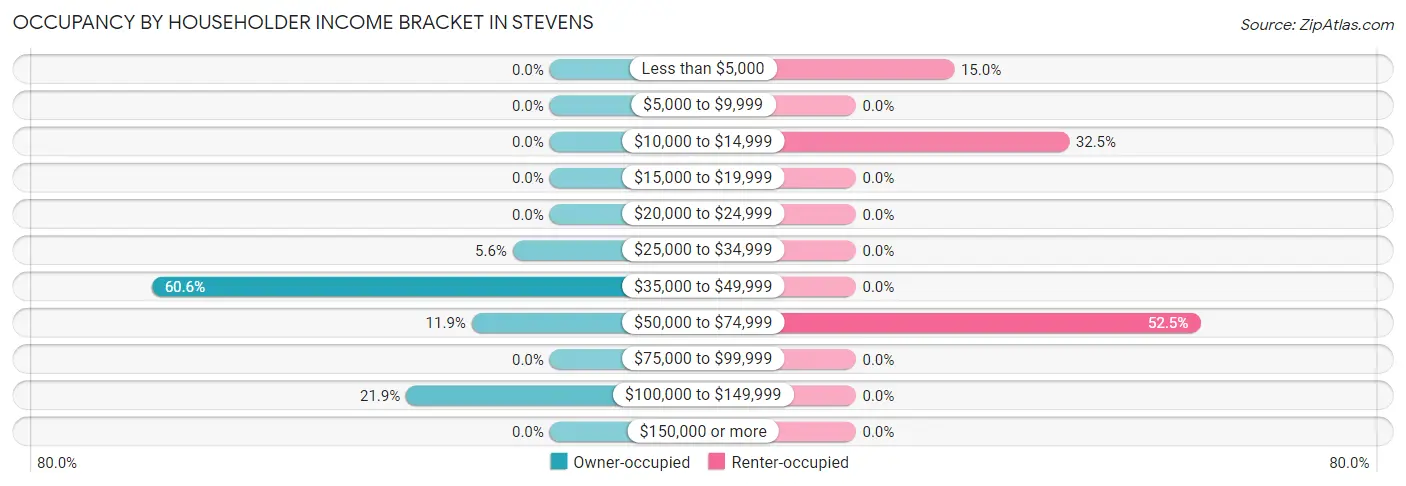
| Income Bracket | Owner-occupied | Renter-occupied |
| Less than $5,000 | 0 (0.0%) | 6 (15.0%) |
| $5,000 to $9,999 | 0 (0.0%) | 0 (0.0%) |
| $10,000 to $14,999 | 0 (0.0%) | 13 (32.5%) |
| $15,000 to $19,999 | 0 (0.0%) | 0 (0.0%) |
| $20,000 to $24,999 | 0 (0.0%) | 0 (0.0%) |
| $25,000 to $34,999 | 9 (5.6%) | 0 (0.0%) |
| $35,000 to $49,999 | 97 (60.6%) | 0 (0.0%) |
| $50,000 to $74,999 | 19 (11.9%) | 21 (52.5%) |
| $75,000 to $99,999 | 0 (0.0%) | 0 (0.0%) |
| $100,000 to $149,999 | 35 (21.9%) | 0 (0.0%) |
| $150,000 or more | 0 (0.0%) | 0 (0.0%) |
| Total | 160 (100.0%) | 40 (100.0%) |
Monthly Housing Cost Tiers in Stevens
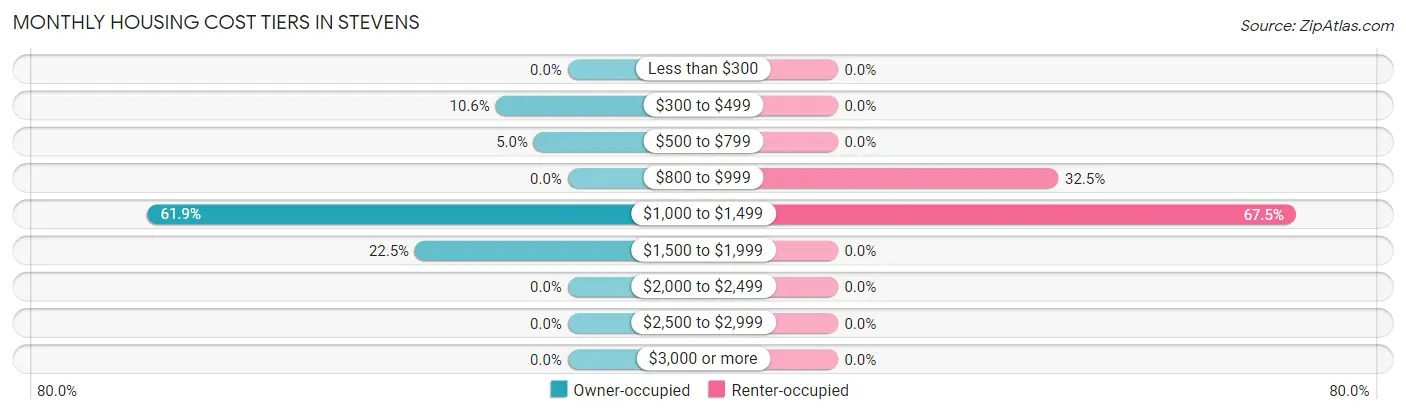
| Monthly Cost | Owner-occupied | Renter-occupied |
| Less than $300 | 0 (0.0%) | 0 (0.0%) |
| $300 to $499 | 17 (10.6%) | 0 (0.0%) |
| $500 to $799 | 8 (5.0%) | 0 (0.0%) |
| $800 to $999 | 0 (0.0%) | 13 (32.5%) |
| $1,000 to $1,499 | 99 (61.9%) | 27 (67.5%) |
| $1,500 to $1,999 | 36 (22.5%) | 0 (0.0%) |
| $2,000 to $2,499 | 0 (0.0%) | 0 (0.0%) |
| $2,500 to $2,999 | 0 (0.0%) | 0 (0.0%) |
| $3,000 or more | 0 (0.0%) | 0 (0.0%) |
| Total | 160 (100.0%) | 40 (100.0%) |
Physical Housing Characteristics in Stevens
Housing Structures in Stevens
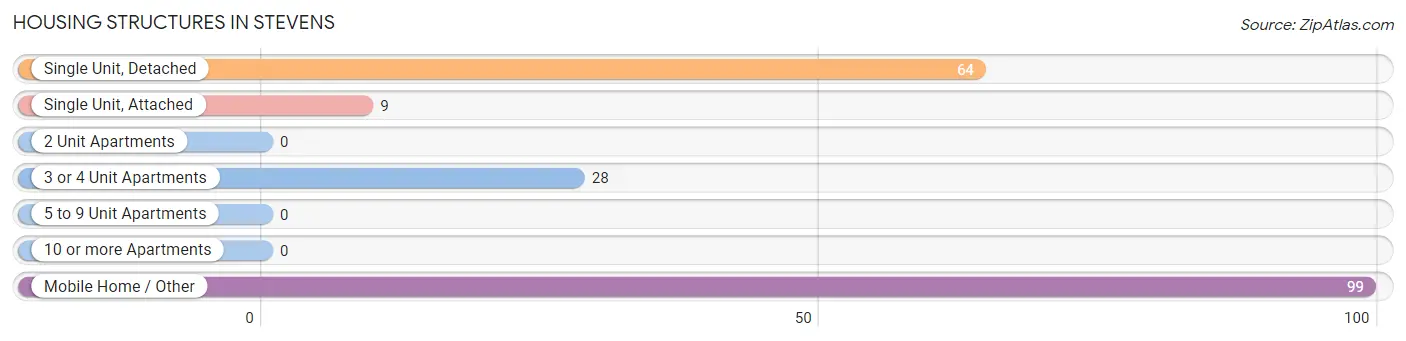
| Structure Type | # Housing Units | % Housing Units |
| Single Unit, Detached | 64 | 32.0% |
| Single Unit, Attached | 9 | 4.5% |
| 2 Unit Apartments | 0 | 0.0% |
| 3 or 4 Unit Apartments | 28 | 14.0% |
| 5 to 9 Unit Apartments | 0 | 0.0% |
| 10 or more Apartments | 0 | 0.0% |
| Mobile Home / Other | 99 | 49.5% |
| Total | 200 | 100.0% |
Housing Structures by Occupancy in Stevens
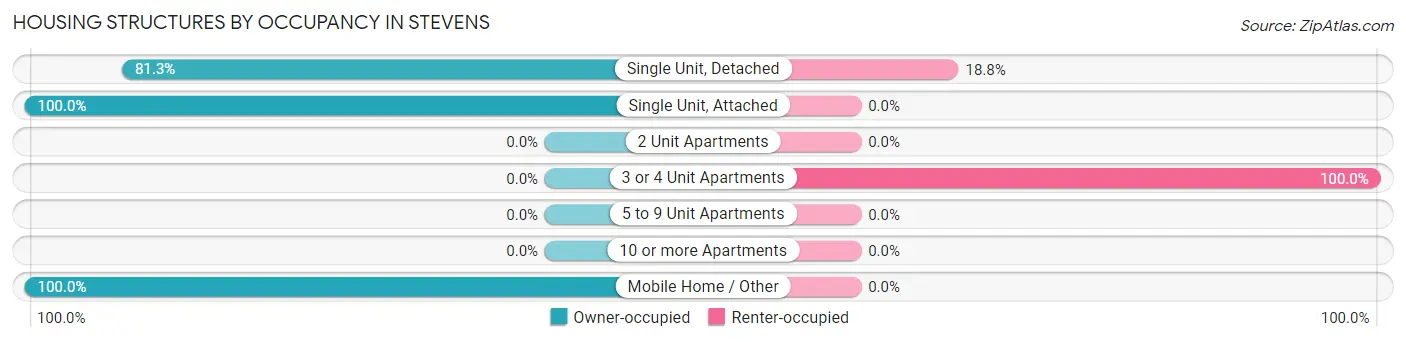
| Structure Type | Owner-occupied | Renter-occupied |
| Single Unit, Detached | 52 (81.2%) | 12 (18.8%) |
| Single Unit, Attached | 9 (100.0%) | 0 (0.0%) |
| 2 Unit Apartments | 0 (0.0%) | 0 (0.0%) |
| 3 or 4 Unit Apartments | 0 (0.0%) | 28 (100.0%) |
| 5 to 9 Unit Apartments | 0 (0.0%) | 0 (0.0%) |
| 10 or more Apartments | 0 (0.0%) | 0 (0.0%) |
| Mobile Home / Other | 99 (100.0%) | 0 (0.0%) |
| Total | 160 (80.0%) | 40 (20.0%) |
Housing Structures by Number of Rooms in Stevens
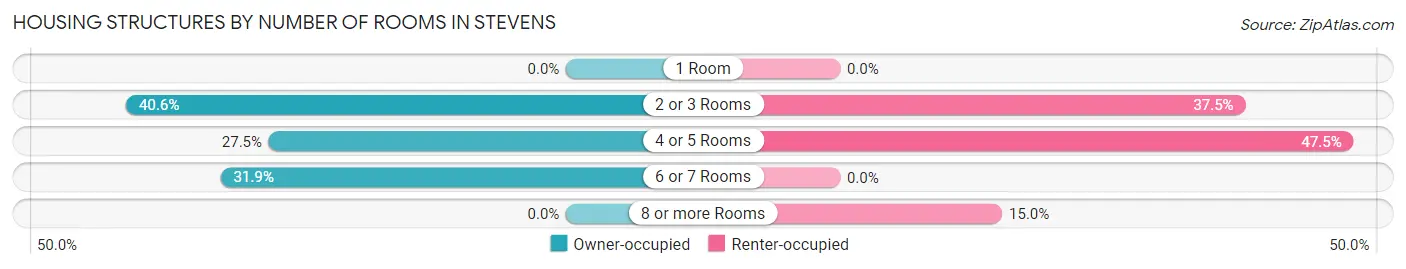
| Number of Rooms | Owner-occupied | Renter-occupied |
| 1 Room | 0 (0.0%) | 0 (0.0%) |
| 2 or 3 Rooms | 65 (40.6%) | 15 (37.5%) |
| 4 or 5 Rooms | 44 (27.5%) | 19 (47.5%) |
| 6 or 7 Rooms | 51 (31.9%) | 0 (0.0%) |
| 8 or more Rooms | 0 (0.0%) | 6 (15.0%) |
| Total | 160 (100.0%) | 40 (100.0%) |
Housing Structure by Heating Type in Stevens
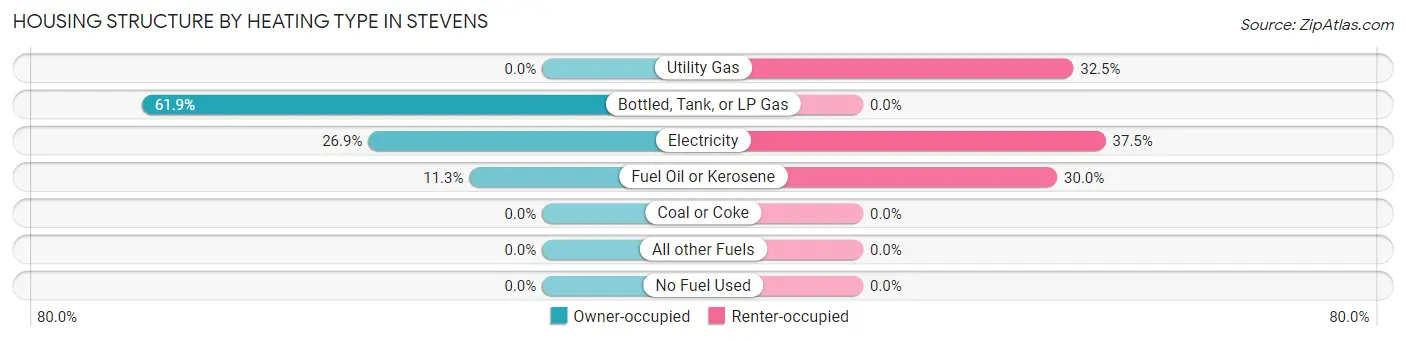
| Heating Type | Owner-occupied | Renter-occupied |
| Utility Gas | 0 (0.0%) | 13 (32.5%) |
| Bottled, Tank, or LP Gas | 99 (61.9%) | 0 (0.0%) |
| Electricity | 43 (26.9%) | 15 (37.5%) |
| Fuel Oil or Kerosene | 18 (11.3%) | 12 (30.0%) |
| Coal or Coke | 0 (0.0%) | 0 (0.0%) |
| All other Fuels | 0 (0.0%) | 0 (0.0%) |
| No Fuel Used | 0 (0.0%) | 0 (0.0%) |
| Total | 160 (100.0%) | 40 (100.0%) |
Household Vehicle Usage in Stevens
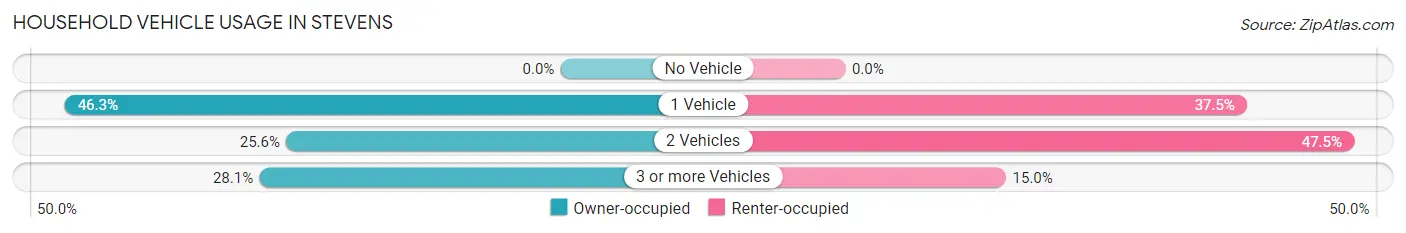
| Vehicles per Household | Owner-occupied | Renter-occupied |
| No Vehicle | 0 (0.0%) | 0 (0.0%) |
| 1 Vehicle | 74 (46.3%) | 15 (37.5%) |
| 2 Vehicles | 41 (25.6%) | 19 (47.5%) |
| 3 or more Vehicles | 45 (28.1%) | 6 (15.0%) |
| Total | 160 (100.0%) | 40 (100.0%) |
Real Estate & Mortgages in Stevens
Real Estate and Mortgage Overview in Stevens
| Characteristic | Without Mortgage | With Mortgage |
| Housing Units | 59 | 101 |
| Median Property Value | - | - |
| Median Household Income | $49,750 | $0 |
| Monthly Housing Costs | $1,050 | $0 |
| Real Estate Taxes | - | - |
Property Value by Mortgage Status in Stevens
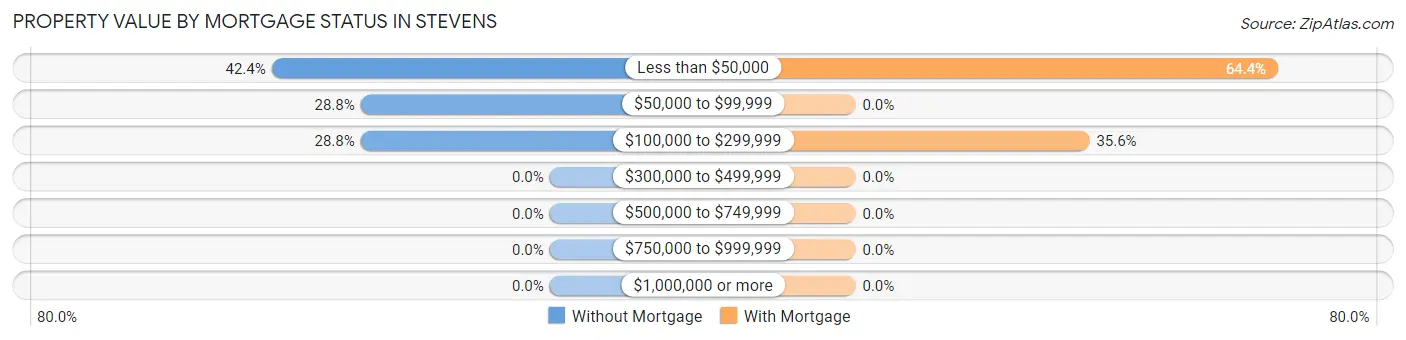
| Property Value | Without Mortgage | With Mortgage |
| Less than $50,000 | 25 (42.4%) | 65 (64.4%) |
| $50,000 to $99,999 | 17 (28.8%) | 0 (0.0%) |
| $100,000 to $299,999 | 17 (28.8%) | 36 (35.6%) |
| $300,000 to $499,999 | 0 (0.0%) | 0 (0.0%) |
| $500,000 to $749,999 | 0 (0.0%) | 0 (0.0%) |
| $750,000 to $999,999 | 0 (0.0%) | 0 (0.0%) |
| $1,000,000 or more | 0 (0.0%) | 0 (0.0%) |
| Total | 59 (100.0%) | 101 (100.0%) |
Household Income by Mortgage Status in Stevens
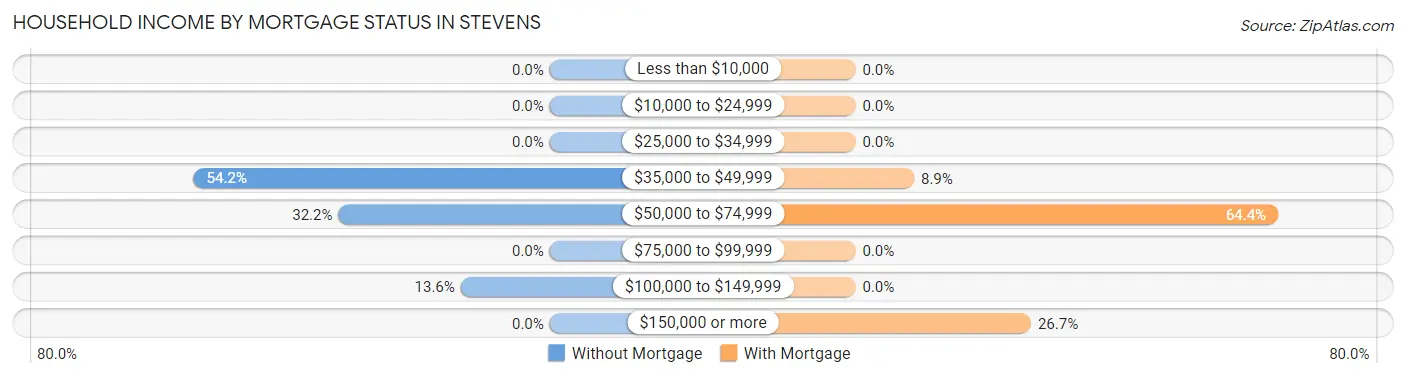
| Household Income | Without Mortgage | With Mortgage |
| Less than $10,000 | 0 (0.0%) | 0 (0.0%) |
| $10,000 to $24,999 | 0 (0.0%) | 0 (0.0%) |
| $25,000 to $34,999 | 0 (0.0%) | 0 (0.0%) |
| $35,000 to $49,999 | 32 (54.2%) | 9 (8.9%) |
| $50,000 to $74,999 | 19 (32.2%) | 65 (64.4%) |
| $75,000 to $99,999 | 0 (0.0%) | 0 (0.0%) |
| $100,000 to $149,999 | 8 (13.6%) | 0 (0.0%) |
| $150,000 or more | 0 (0.0%) | 27 (26.7%) |
| Total | 59 (100.0%) | 101 (100.0%) |
Property Value to Household Income Ratio in Stevens
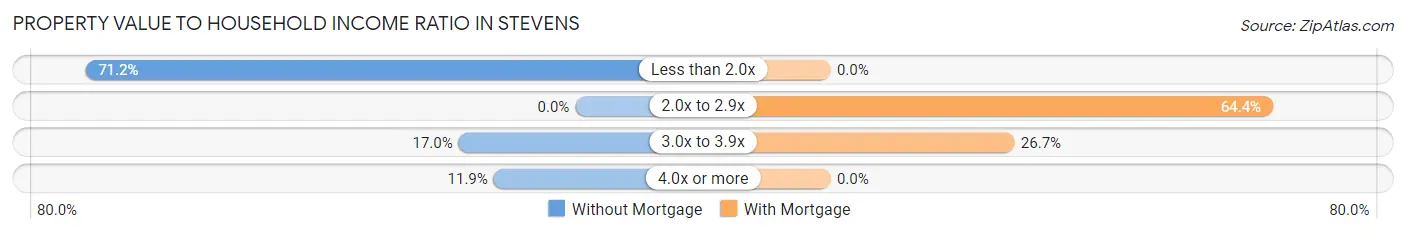
| Value-to-Income Ratio | Without Mortgage | With Mortgage |
| Less than 2.0x | 42 (71.2%) | 0 (0.0%) |
| 2.0x to 2.9x | 0 (0.0%) | 65 (64.4%) |
| 3.0x to 3.9x | 10 (17.0%) | 27 (26.7%) |
| 4.0x or more | 7 (11.9%) | 0 (0.0%) |
| Total | 59 (100.0%) | 101 (100.0%) |
Real Estate Taxes by Mortgage Status in Stevens
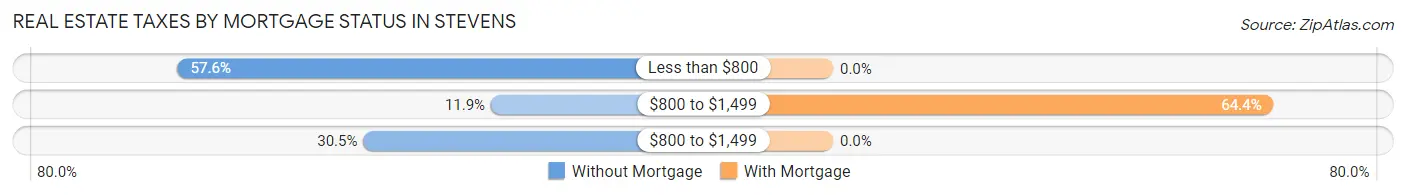
| Property Taxes | Without Mortgage | With Mortgage |
| Less than $800 | 34 (57.6%) | 0 (0.0%) |
| $800 to $1,499 | 7 (11.9%) | 65 (64.4%) |
| $800 to $1,499 | 18 (30.5%) | 0 (0.0%) |
| Total | 59 (100.0%) | 101 (100.0%) |
Health & Disability in Stevens
Health Insurance Coverage by Age in Stevens
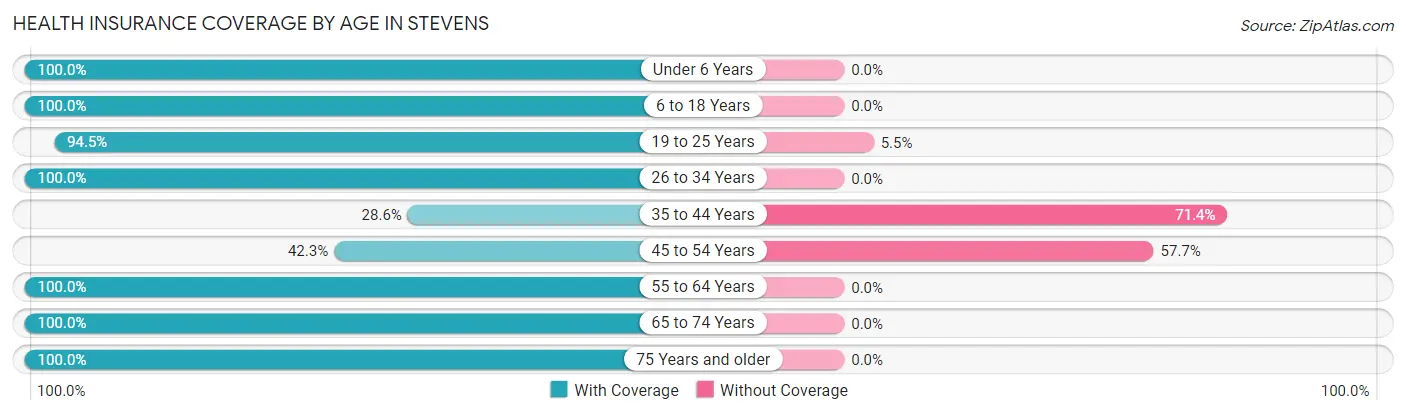
| Age Bracket | With Coverage | Without Coverage |
| Under 6 Years | 133 (100.0%) | 0 (0.0%) |
| 6 to 18 Years | 54 (100.0%) | 0 (0.0%) |
| 19 to 25 Years | 138 (94.5%) | 8 (5.5%) |
| 26 to 34 Years | 64 (100.0%) | 0 (0.0%) |
| 35 to 44 Years | 10 (28.6%) | 25 (71.4%) |
| 45 to 54 Years | 11 (42.3%) | 15 (57.7%) |
| 55 to 64 Years | 44 (100.0%) | 0 (0.0%) |
| 65 to 74 Years | 19 (100.0%) | 0 (0.0%) |
| 75 Years and older | 15 (100.0%) | 0 (0.0%) |
| Total | 488 (91.0%) | 48 (9.0%) |
Health Insurance Coverage by Citizenship Status in Stevens
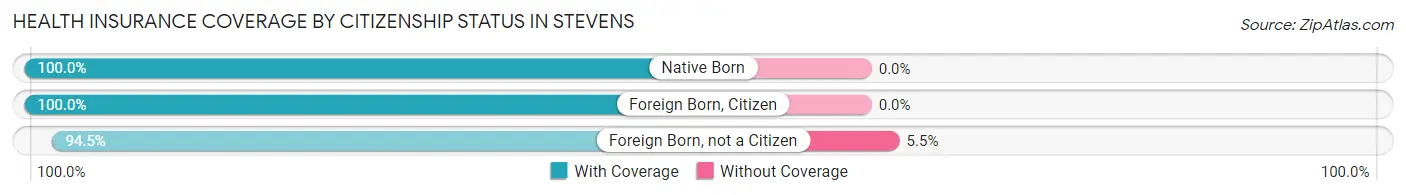
| Citizenship Status | With Coverage | Without Coverage |
| Native Born | 133 (100.0%) | 0 (0.0%) |
| Foreign Born, Citizen | 54 (100.0%) | 0 (0.0%) |
| Foreign Born, not a Citizen | 138 (94.5%) | 8 (5.5%) |
Health Insurance Coverage by Household Income in Stevens
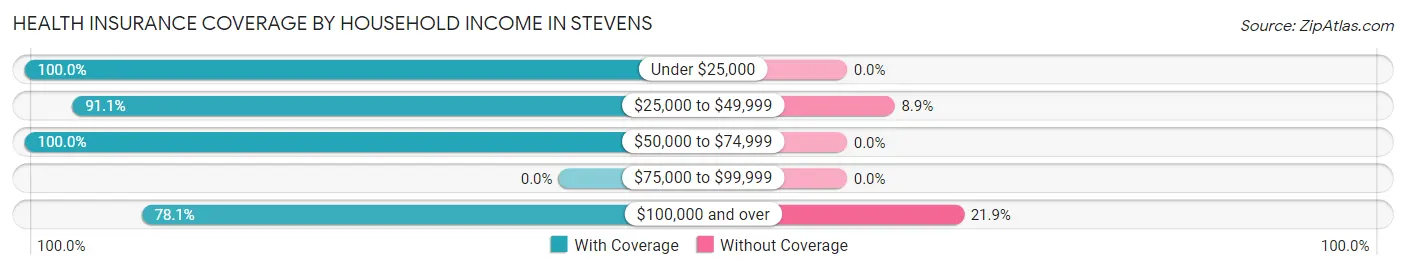
| Household Income | With Coverage | Without Coverage |
| Under $25,000 | 96 (100.0%) | 0 (0.0%) |
| $25,000 to $49,999 | 255 (91.1%) | 25 (8.9%) |
| $50,000 to $74,999 | 55 (100.0%) | 0 (0.0%) |
| $75,000 to $99,999 | 0 (0.0%) | 0 (0.0%) |
| $100,000 and over | 82 (78.1%) | 23 (21.9%) |
Public vs Private Health Insurance Coverage by Age in Stevens
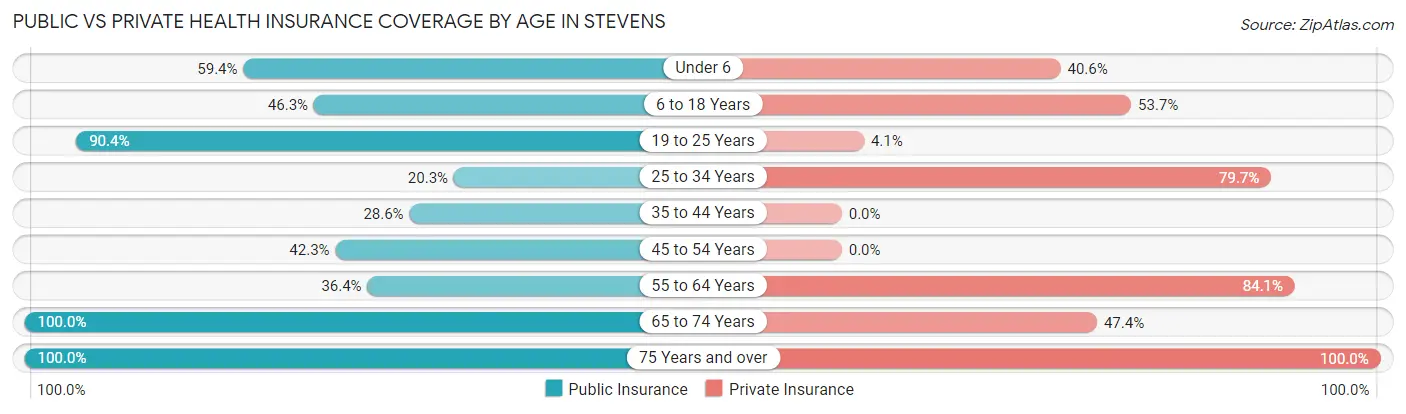
| Age Bracket | Public Insurance | Private Insurance |
| Under 6 | 79 (59.4%) | 54 (40.6%) |
| 6 to 18 Years | 25 (46.3%) | 29 (53.7%) |
| 19 to 25 Years | 132 (90.4%) | 6 (4.1%) |
| 25 to 34 Years | 13 (20.3%) | 51 (79.7%) |
| 35 to 44 Years | 10 (28.6%) | 0 (0.0%) |
| 45 to 54 Years | 11 (42.3%) | 0 (0.0%) |
| 55 to 64 Years | 16 (36.4%) | 37 (84.1%) |
| 65 to 74 Years | 19 (100.0%) | 9 (47.4%) |
| 75 Years and over | 15 (100.0%) | 15 (100.0%) |
| Total | 320 (59.7%) | 201 (37.5%) |
Disability Status by Sex by Age in Stevens
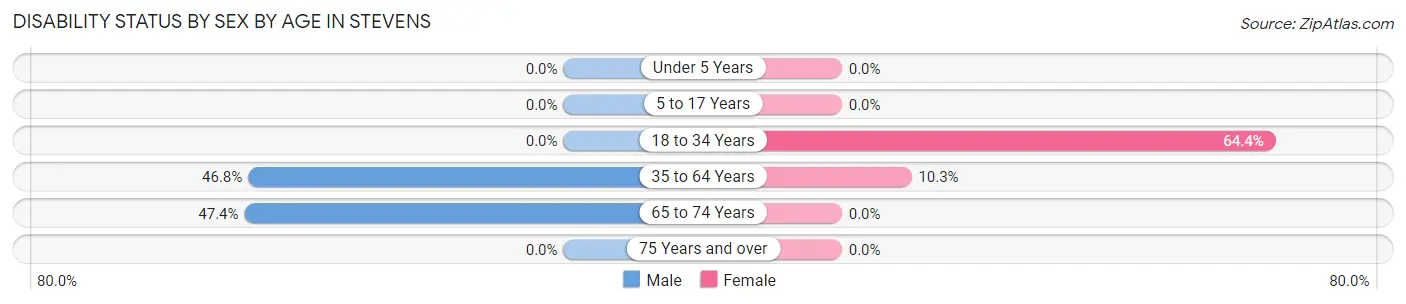
| Age Bracket | Male | Female |
| Under 5 Years | 0 (0.0%) | 0 (0.0%) |
| 5 to 17 Years | 0 (0.0%) | 0 (0.0%) |
| 18 to 34 Years | 0 (0.0%) | 67 (64.4%) |
| 35 to 64 Years | 22 (46.8%) | 6 (10.3%) |
| 65 to 74 Years | 9 (47.4%) | 0 (0.0%) |
| 75 Years and over | 0 (0.0%) | 0 (0.0%) |
Disability Class by Sex by Age in Stevens
Disability Class: Hearing Difficulty
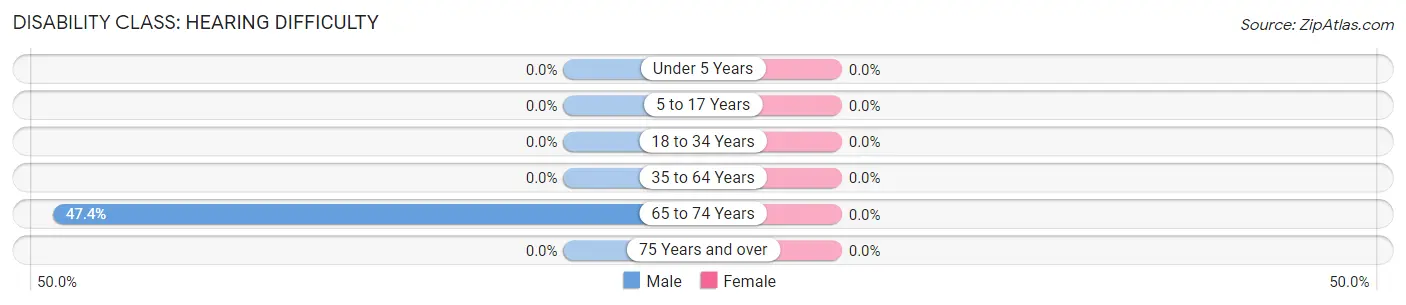
| Age Bracket | Male | Female |
| Under 5 Years | 0 (0.0%) | 0 (0.0%) |
| 5 to 17 Years | 0 (0.0%) | 0 (0.0%) |
| 18 to 34 Years | 0 (0.0%) | 0 (0.0%) |
| 35 to 64 Years | 0 (0.0%) | 0 (0.0%) |
| 65 to 74 Years | 9 (47.4%) | 0 (0.0%) |
| 75 Years and over | 0 (0.0%) | 0 (0.0%) |
Disability Class: Vision Difficulty
| Age Bracket | Male | Female |
| Under 5 Years | 0 (0.0%) | 0 (0.0%) |
| 5 to 17 Years | 0 (0.0%) | 0 (0.0%) |
| 18 to 34 Years | 0 (0.0%) | 0 (0.0%) |
| 35 to 64 Years | 0 (0.0%) | 0 (0.0%) |
| 65 to 74 Years | 0 (0.0%) | 0 (0.0%) |
| 75 Years and over | 0 (0.0%) | 0 (0.0%) |
Disability Class: Cognitive Difficulty
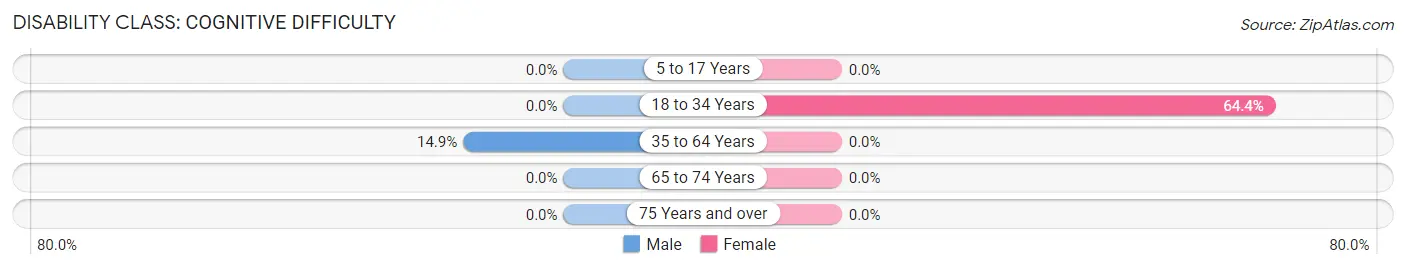
| Age Bracket | Male | Female |
| 5 to 17 Years | 0 (0.0%) | 0 (0.0%) |
| 18 to 34 Years | 0 (0.0%) | 67 (64.4%) |
| 35 to 64 Years | 7 (14.9%) | 0 (0.0%) |
| 65 to 74 Years | 0 (0.0%) | 0 (0.0%) |
| 75 Years and over | 0 (0.0%) | 0 (0.0%) |
Disability Class: Ambulatory Difficulty
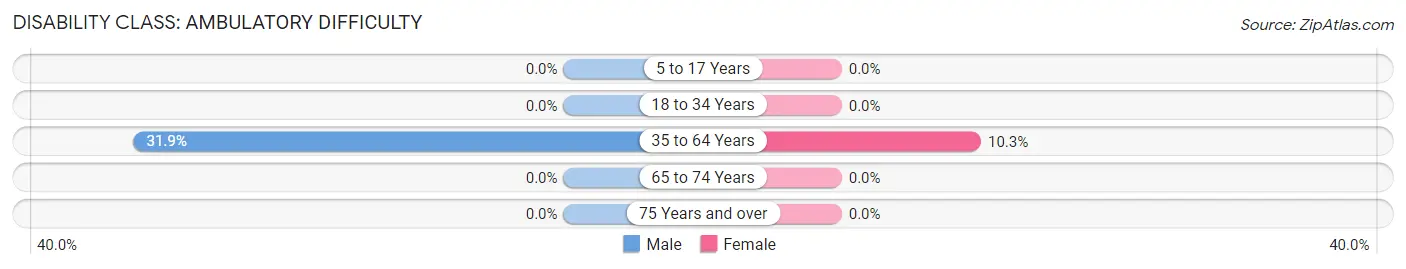
| Age Bracket | Male | Female |
| 5 to 17 Years | 0 (0.0%) | 0 (0.0%) |
| 18 to 34 Years | 0 (0.0%) | 0 (0.0%) |
| 35 to 64 Years | 15 (31.9%) | 6 (10.3%) |
| 65 to 74 Years | 0 (0.0%) | 0 (0.0%) |
| 75 Years and over | 0 (0.0%) | 0 (0.0%) |
Disability Class: Self-Care Difficulty
| Age Bracket | Male | Female |
| 5 to 17 Years | 0 (0.0%) | 0 (0.0%) |
| 18 to 34 Years | 0 (0.0%) | 0 (0.0%) |
| 35 to 64 Years | 0 (0.0%) | 0 (0.0%) |
| 65 to 74 Years | 0 (0.0%) | 0 (0.0%) |
| 75 Years and over | 0 (0.0%) | 0 (0.0%) |
Technology Access in Stevens
Computing Device Access in Stevens
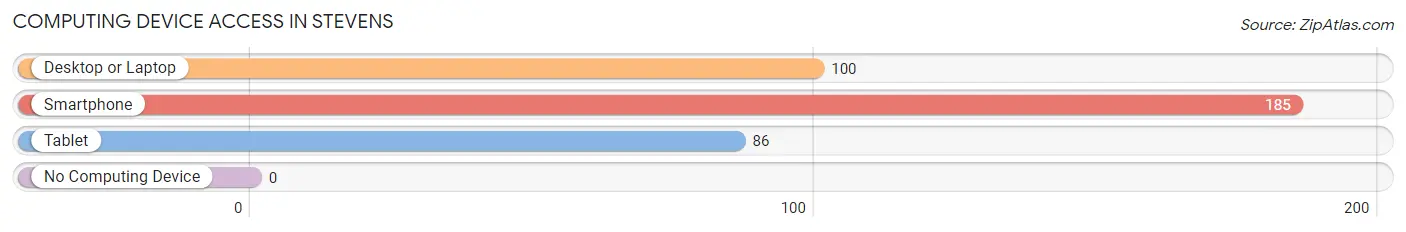
| Device Type | # Households | % Households |
| Desktop or Laptop | 100 | 50.0% |
| Smartphone | 185 | 92.5% |
| Tablet | 86 | 43.0% |
| No Computing Device | 0 | 0.0% |
| Total | 200 | 100.0% |
Internet Access in Stevens
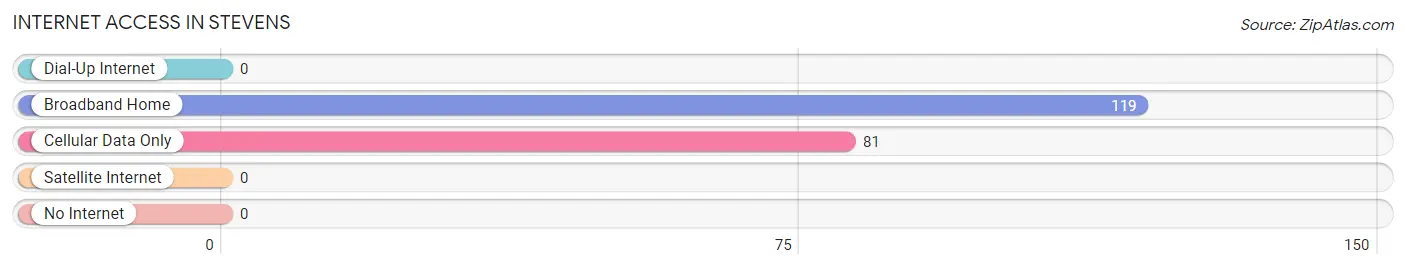
| Internet Type | # Households | % Households |
| Dial-Up Internet | 0 | 0.0% |
| Broadband Home | 119 | 59.5% |
| Cellular Data Only | 81 | 40.5% |
| Satellite Internet | 0 | 0.0% |
| No Internet | 0 | 0.0% |
| Total | 200 | 100.0% |
Stevens Summary
Stevens, Pennsylvania is a borough located in Lancaster County, Pennsylvania. It is situated in the southeastern part of the state, approximately 20 miles east of the city of Lancaster. The population of Stevens was 2,845 as of the 2010 census.
History
The area that is now Stevens was first settled in 1730 by a group of Mennonites from Germany. The town was originally known as “Mennonite Town” and was later renamed “Stevens” in honor of the first settler, John Stevens. The town was officially incorporated in 1867.
In the late 19th century, Stevens was a major center for the production of cigars. The town was home to several cigar factories, including the Stevens Cigar Company, which was founded in 1876. The company was one of the largest cigar manufacturers in the United States and employed hundreds of people in the town.
Geography
Stevens is located in southeastern Lancaster County, approximately 20 miles east of the city of Lancaster. The borough is situated in the Conestoga Valley, which is part of the larger Susquehanna River Valley. The borough is bordered by the townships of East Cocalico, West Cocalico, and East Earl.
The borough covers an area of 1.2 square miles and is located at an elevation of 463 feet above sea level. The terrain is mostly flat, with some rolling hills in the northern part of the borough. The borough is drained by the Conestoga River, which flows through the center of town.
Economy
The economy of Stevens is largely based on agriculture and manufacturing. The town is home to several farms, which produce a variety of crops, including corn, soybeans, and hay. The town is also home to several manufacturing companies, including a furniture factory, a printing company, and a plastics factory.
The town is also home to several small businesses, including restaurants, retail stores, and service providers. The town is also home to several tourist attractions, including the Stevens Historical Museum and the Stevens Railroad Museum.
Demographics
As of the 2010 census, the population of Stevens was 2,845. The racial makeup of the town was 95.3% White, 0.7% African American, 0.2% Native American, 0.7% Asian, 0.1% Pacific Islander, 1.2% from other races, and 1.9% from two or more races. Hispanic or Latino of any race were 3.2% of the population.
The median household income in Stevens was $45,938, and the median family income was $54,844. The per capita income was $21,945. About 8.2% of families and 10.2% of the population were below the poverty line, including 14.2% of those under age 18 and 5.2% of those age 65 or over.
The population of Stevens is largely Christian, with the majority of residents belonging to the Mennonite faith. The town is also home to a small Jewish community. The town is served by the Stevens Area School District, which includes two elementary schools, a middle school, and a high school.
Common Questions
What is Per Capita Income in Stevens?
Per Capita income in Stevens is $19,928.
What is the Median Family Income in Stevens?
Median Family Income in Stevens is $44,692.
What is the Median Household income in Stevens?
Median Household Income in Stevens is $46,250.
What is Income or Wage Gap in Stevens?
Income or Wage Gap in Stevens is 43.3%.
Women in Stevens earn 56.7 cents for every dollar earned by a man.
What is Inequality or Gini Index in Stevens?
Inequality or Gini Index in Stevens is 0.28.
What is the Total Population of Stevens?
Total Population of Stevens is 536.
What is the Total Male Population of Stevens?
Total Male Population of Stevens is 195.
What is the Total Female Population of Stevens?
Total Female Population of Stevens is 341.
What is the Ratio of Males per 100 Females in Stevens?
There are 57.18 Males per 100 Females in Stevens.
What is the Ratio of Females per 100 Males in Stevens?
There are 174.87 Females per 100 Males in Stevens.
What is the Median Population Age in Stevens?
Median Population Age in Stevens is 22.5 Years.
What is the Average Family Size in Stevens
Average Family Size in Stevens is 3.0 People.
What is the Average Household Size in Stevens
Average Household Size in Stevens is 2.7 People.
How Large is the Labor Force in Stevens?
There are 217 People in the Labor Forcein in Stevens.
What is the Percentage of People in the Labor Force in Stevens?
61.1% of People are in the Labor Force in Stevens.
What is the Unemployment Rate in Stevens?
Unemployment Rate in Stevens is 4.6%.