Star Junction, PA Map & Demographics
Star Junction Map
Star Junction Overview
$34,915
PER CAPITA INCOME
$51,705
AVG FAMILY INCOME
$38,478
AVG HOUSEHOLD INCOME
0.36
INEQUALITY / GINI INDEX
311
TOTAL POPULATION
123
MALE POPULATION
188
FEMALE POPULATION
65.43
MALES / 100 FEMALES
152.85
FEMALES / 100 MALES
56.7
MEDIAN AGE
2.8
AVG FAMILY SIZE
1.6
AVG HOUSEHOLD SIZE
174
LABOR FORCE [ PEOPLE ]
61.7%
PERCENT IN LABOR FORCE
3.4%
UNEMPLOYMENT RATE
Star Junction Zip Codes
Star Junction Area Codes
Income in Star Junction
Income Overview in Star Junction
Per Capita Income in Star Junction is $34,915, while median incomes of families and households are $51,705 and $38,478 respectively.
| Characteristic | Number | Measure |
| Per Capita Income | 311 | $34,915 |
| Median Family Income | 57 | $51,705 |
| Mean Family Income | 57 | $82,360 |
| Median Household Income | 196 | $38,478 |
| Mean Household Income | 196 | $56,466 |
| Income Deficit | 57 | $0 |
| Wage / Income Gap (%) | 311 | 0.00% |
| Wage / Income Gap ($) | 311 | 100.00¢ per $1 |
| Gini / Inequality Index | 311 | 0.36 |
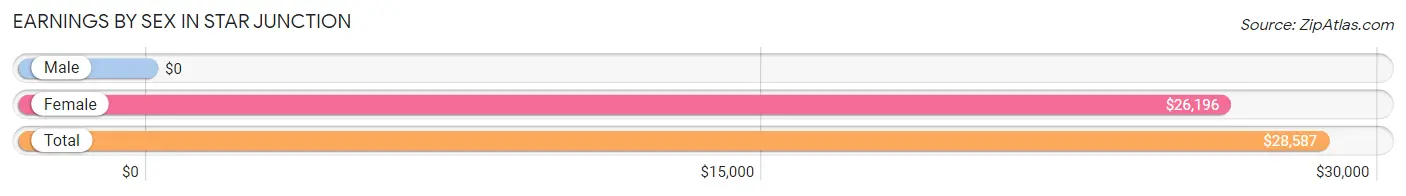
Earnings by Sex in Star Junction
| Sex | Number | Average Earnings |
| Male | 60 (35.7%) | $0 |
| Female | 108 (64.3%) | $26,196 |
| Total | 168 (100.0%) | $28,587 |
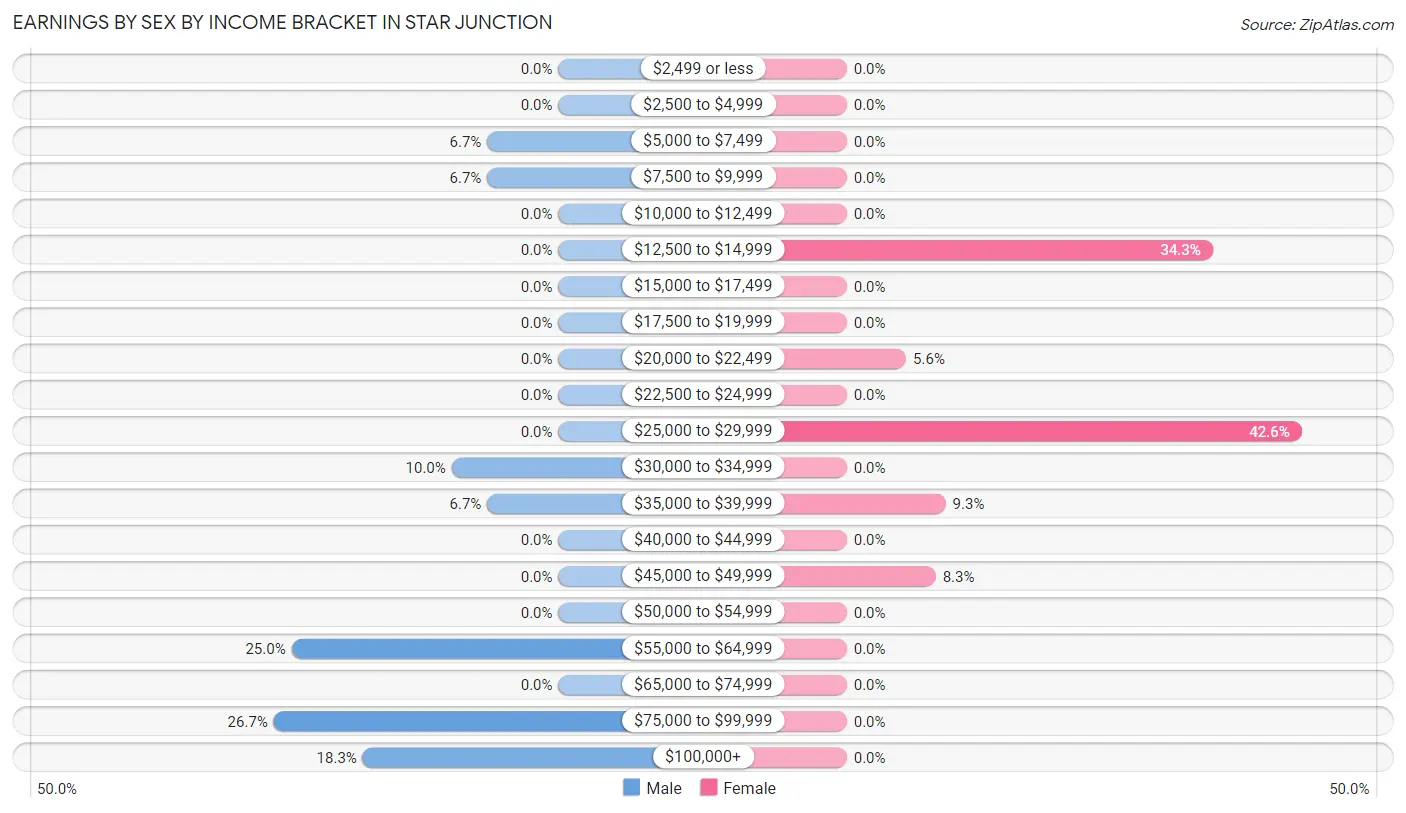
Earnings by Sex by Income Bracket in Star Junction
The most common earnings brackets in Star Junction are $75,000 to $99,999 for men (16 | 26.7%) and $25,000 to $29,999 for women (46 | 42.6%).
| Income | Male | Female |
| $2,499 or less | 0 (0.0%) | 0 (0.0%) |
| $2,500 to $4,999 | 0 (0.0%) | 0 (0.0%) |
| $5,000 to $7,499 | 4 (6.7%) | 0 (0.0%) |
| $7,500 to $9,999 | 4 (6.7%) | 0 (0.0%) |
| $10,000 to $12,499 | 0 (0.0%) | 0 (0.0%) |
| $12,500 to $14,999 | 0 (0.0%) | 37 (34.3%) |
| $15,000 to $17,499 | 0 (0.0%) | 0 (0.0%) |
| $17,500 to $19,999 | 0 (0.0%) | 0 (0.0%) |
| $20,000 to $22,499 | 0 (0.0%) | 6 (5.6%) |
| $22,500 to $24,999 | 0 (0.0%) | 0 (0.0%) |
| $25,000 to $29,999 | 0 (0.0%) | 46 (42.6%) |
| $30,000 to $34,999 | 6 (10.0%) | 0 (0.0%) |
| $35,000 to $39,999 | 4 (6.7%) | 10 (9.3%) |
| $40,000 to $44,999 | 0 (0.0%) | 0 (0.0%) |
| $45,000 to $49,999 | 0 (0.0%) | 9 (8.3%) |
| $50,000 to $54,999 | 0 (0.0%) | 0 (0.0%) |
| $55,000 to $64,999 | 15 (25.0%) | 0 (0.0%) |
| $65,000 to $74,999 | 0 (0.0%) | 0 (0.0%) |
| $75,000 to $99,999 | 16 (26.7%) | 0 (0.0%) |
| $100,000+ | 11 (18.3%) | 0 (0.0%) |
| Total | 60 (100.0%) | 108 (100.0%) |
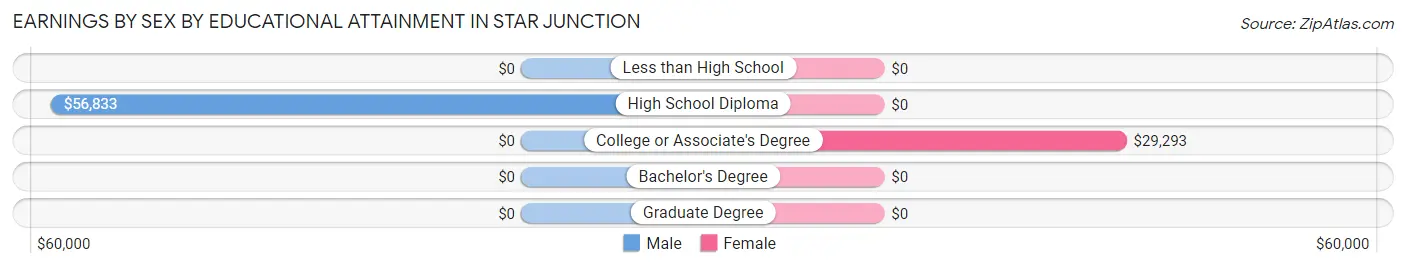
Earnings by Sex by Educational Attainment in Star Junction
| Educational Attainment | Male Income | Female Income |
| Less than High School | - | - |
| High School Diploma | $56,833 | $0 |
| College or Associate's Degree | - | - |
| Bachelor's Degree | - | - |
| Graduate Degree | - | - |
| Total | - | - |
Family Income in Star Junction
Family Income Brackets in Star Junction
According to the Star Junction family income data, there are 16 families falling into the $50,000 to $74,999 income range, which is the most common income bracket and makes up 28.1% of all families.
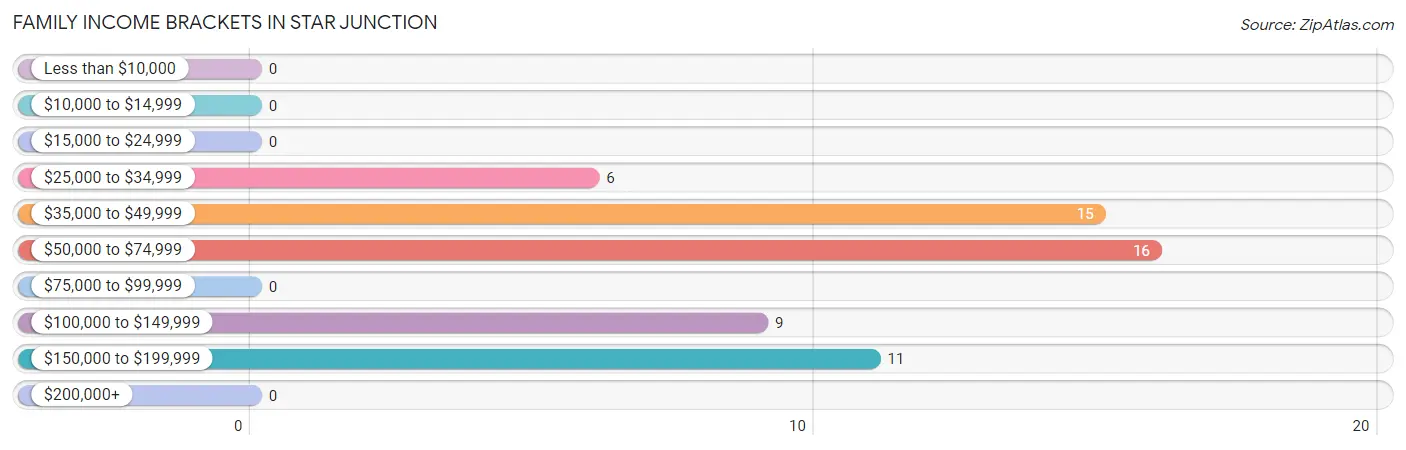
| Income Bracket | # Families | % Families |
| Less than $10,000 | 0 | 0.0% |
| $10,000 to $14,999 | 0 | 0.0% |
| $15,000 to $24,999 | 0 | 0.0% |
| $25,000 to $34,999 | 6 | 10.5% |
| $35,000 to $49,999 | 15 | 26.3% |
| $50,000 to $74,999 | 16 | 28.1% |
| $75,000 to $99,999 | 0 | 0.0% |
| $100,000 to $149,999 | 9 | 15.8% |
| $150,000 to $199,999 | 11 | 19.3% |
| $200,000+ | 0 | 0.0% |
Family Income by Famaliy Size in Star Junction
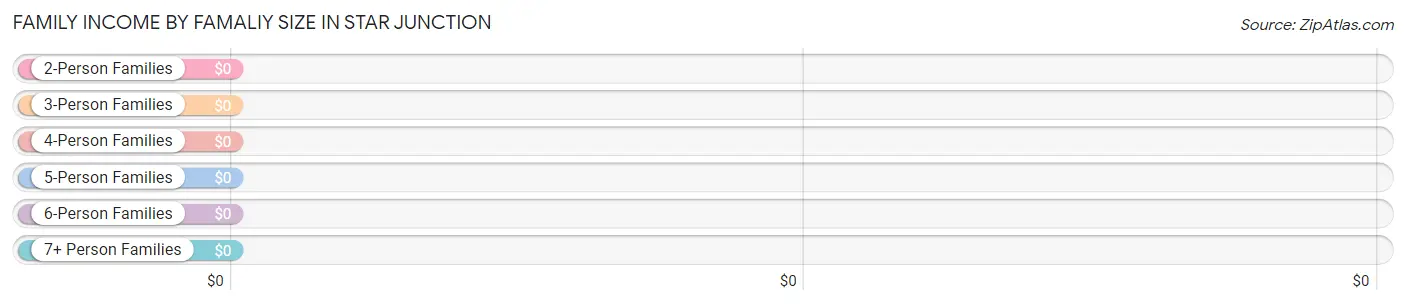
| Income Bracket | # Families | Median Income |
| 2-Person Families | 36 (63.2%) | $0 |
| 3-Person Families | 11 (19.3%) | $0 |
| 4-Person Families | 0 (0.0%) | $0 |
| 5-Person Families | 10 (17.5%) | $0 |
| 6-Person Families | 0 (0.0%) | $0 |
| 7+ Person Families | 0 (0.0%) | $0 |
| Total | 57 (100.0%) | $51,705 |
Family Income by Number of Earners in Star Junction
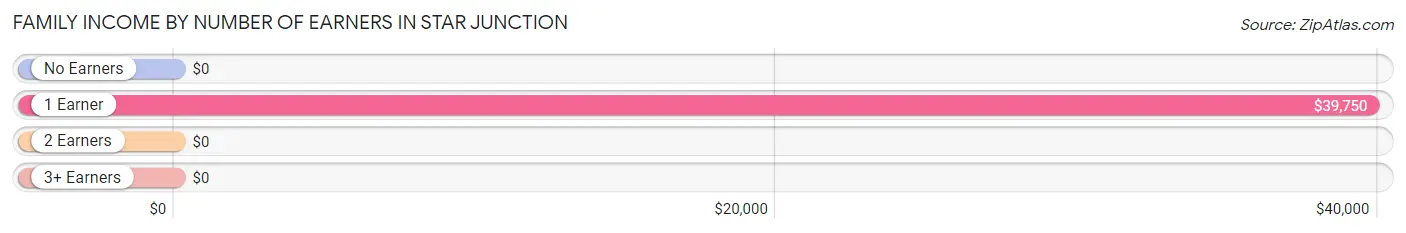
| Number of Earners | # Families | Median Income |
| No Earners | 16 (28.1%) | $0 |
| 1 Earner | 30 (52.6%) | $39,750 |
| 2 Earners | 6 (10.5%) | $0 |
| 3+ Earners | 5 (8.8%) | $0 |
| Total | 57 (100.0%) | $51,705 |
Household Income in Star Junction
Household Income Brackets in Star Junction
With 71 households falling in the category, the $25,000 to $34,999 income range is the most frequent in Star Junction, accounting for 36.2% of all households.
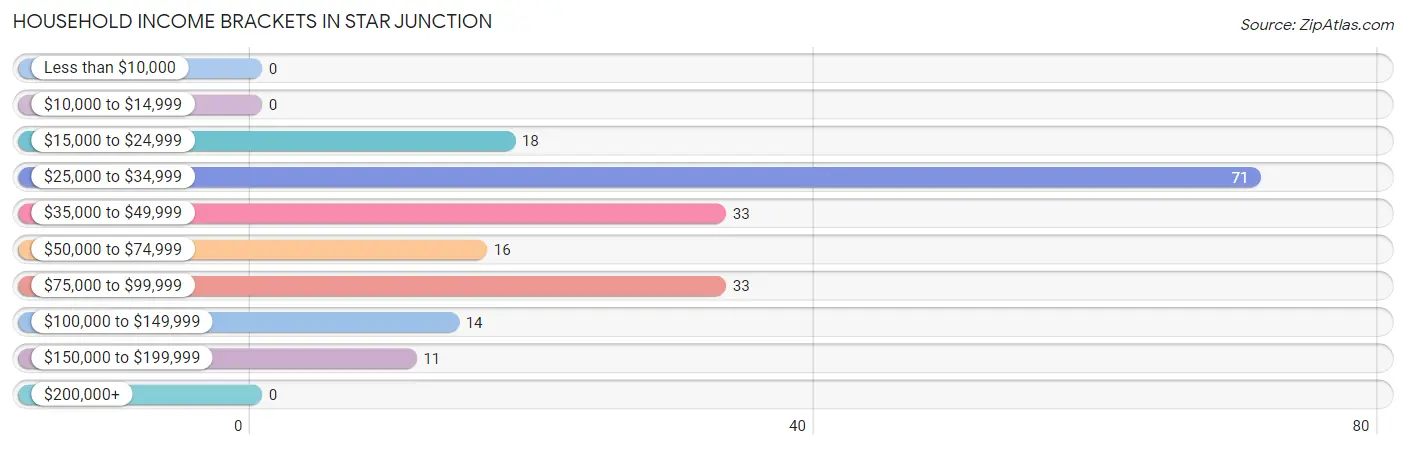
| Income Bracket | # Households | % Households |
| Less than $10,000 | 0 | 0.0% |
| $10,000 to $14,999 | 0 | 0.0% |
| $15,000 to $24,999 | 18 | 9.2% |
| $25,000 to $34,999 | 71 | 36.2% |
| $35,000 to $49,999 | 33 | 16.8% |
| $50,000 to $74,999 | 16 | 8.2% |
| $75,000 to $99,999 | 33 | 16.8% |
| $100,000 to $149,999 | 14 | 7.1% |
| $150,000 to $199,999 | 11 | 5.6% |
| $200,000+ | 0 | 0.0% |
Household Income by Householder Age in Star Junction
The median household income in Star Junction is $38,478, with the highest median household income of $86,471 found in the 45 to 64 years age bracket for the primary householder. A total of 42 households (21.4%) fall into this category.
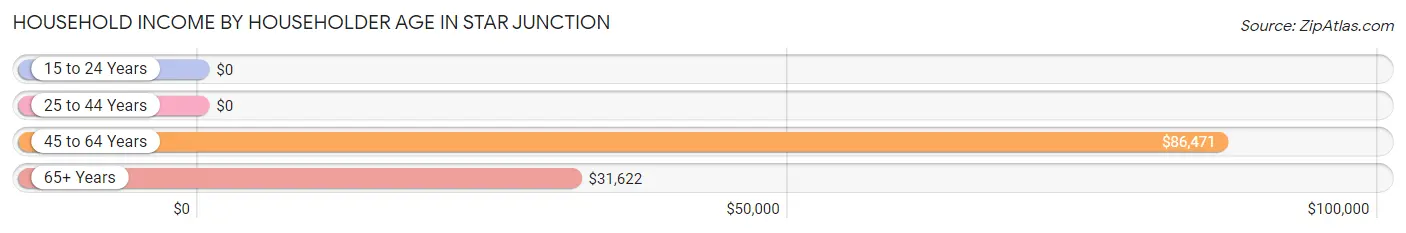
| Income Bracket | # Households | Median Income |
| 15 to 24 Years | 0 (0.0%) | $0 |
| 25 to 44 Years | 60 (30.6%) | $0 |
| 45 to 64 Years | 42 (21.4%) | $86,471 |
| 65+ Years | 94 (48.0%) | $31,622 |
| Total | 196 (100.0%) | $38,478 |
Poverty in Star Junction
Income Below Poverty by Sex and Age in Star Junction
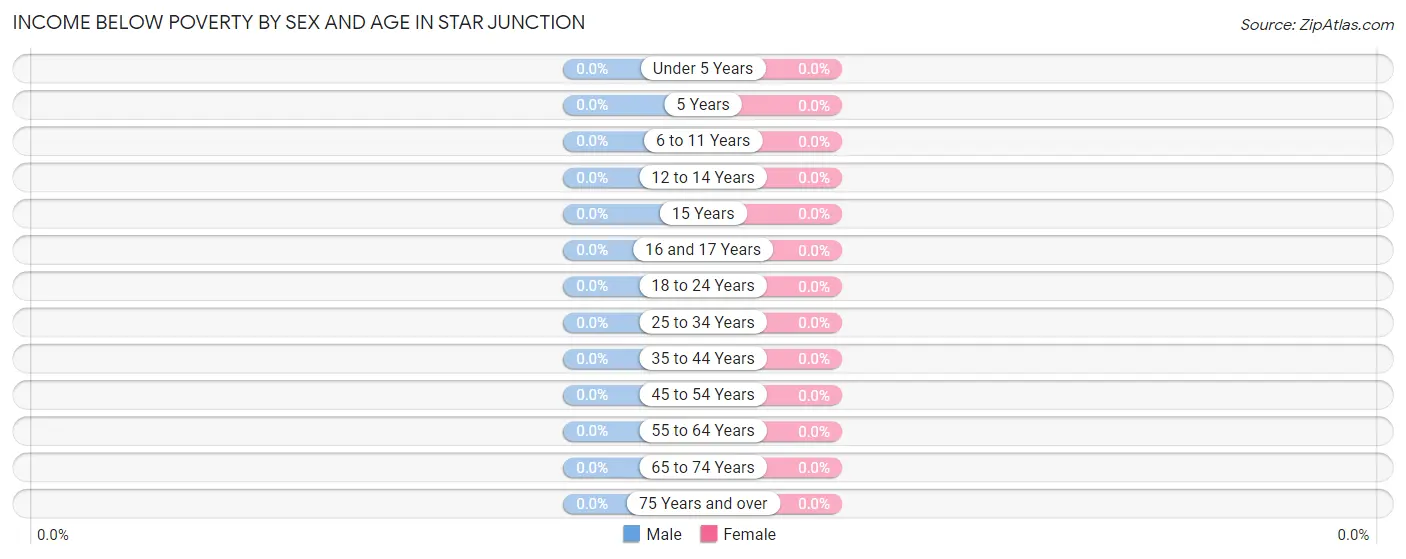
| Age Bracket | Male | Female |
| Under 5 Years | 0 (0.0%) | 0 (0.0%) |
| 5 Years | 0 (0.0%) | 0 (0.0%) |
| 6 to 11 Years | 0 (0.0%) | 0 (0.0%) |
| 12 to 14 Years | 0 (0.0%) | 0 (0.0%) |
| 15 Years | 0 (0.0%) | 0 (0.0%) |
| 16 and 17 Years | 0 (0.0%) | 0 (0.0%) |
| 18 to 24 Years | 0 (0.0%) | 0 (0.0%) |
| 25 to 34 Years | 0 (0.0%) | 0 (0.0%) |
| 35 to 44 Years | 0 (0.0%) | 0 (0.0%) |
| 45 to 54 Years | 0 (0.0%) | 0 (0.0%) |
| 55 to 64 Years | 0 (0.0%) | 0 (0.0%) |
| 65 to 74 Years | 0 (0.0%) | 0 (0.0%) |
| 75 Years and over | 0 (0.0%) | 0 (0.0%) |
| Total | 0 (0.0%) | 0 (0.0%) |
Income Above Poverty by Sex and Age in Star Junction
According to the poverty statistics in Star Junction, males aged 6 to 11 years and females aged 6 to 11 years are the age groups that are most secure financially, with 100.0% of males and 100.0% of females in these age groups living above the poverty line.
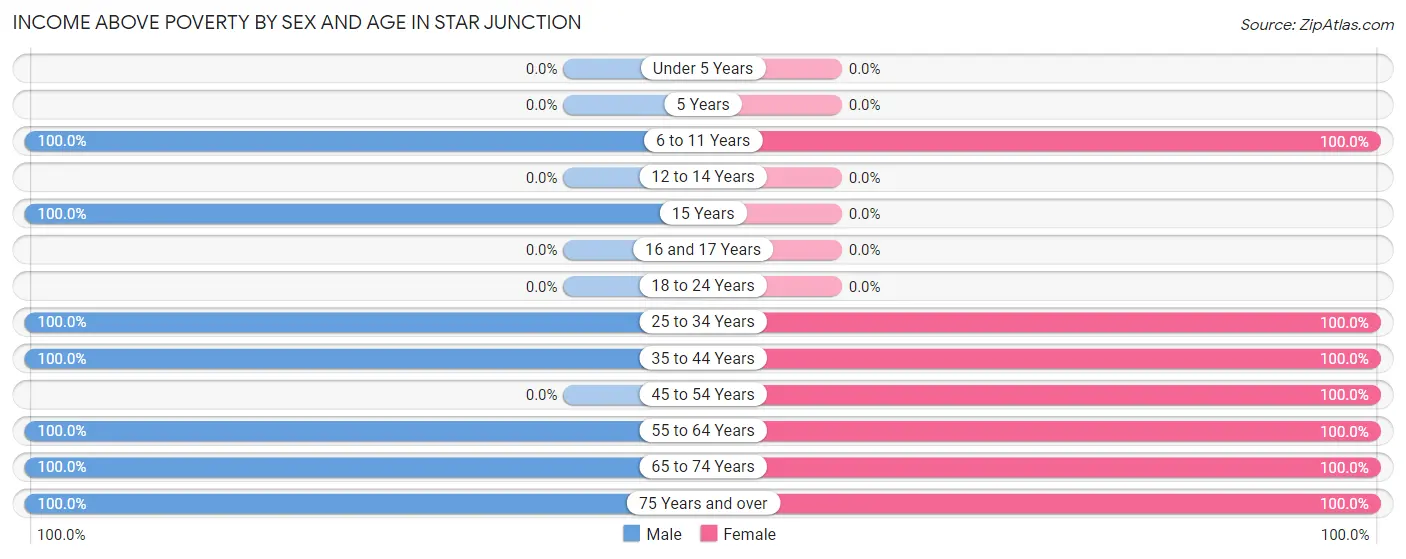
| Age Bracket | Male | Female |
| Under 5 Years | 0 (0.0%) | 0 (0.0%) |
| 5 Years | 0 (0.0%) | 0 (0.0%) |
| 6 to 11 Years | 6 (100.0%) | 13 (100.0%) |
| 12 to 14 Years | 0 (0.0%) | 0 (0.0%) |
| 15 Years | 10 (100.0%) | 0 (0.0%) |
| 16 and 17 Years | 0 (0.0%) | 0 (0.0%) |
| 18 to 24 Years | 0 (0.0%) | 0 (0.0%) |
| 25 to 34 Years | 30 (100.0%) | 47 (100.0%) |
| 35 to 44 Years | 11 (100.0%) | 10 (100.0%) |
| 45 to 54 Years | 0 (0.0%) | 17 (100.0%) |
| 55 to 64 Years | 39 (100.0%) | 30 (100.0%) |
| 65 to 74 Years | 23 (100.0%) | 21 (100.0%) |
| 75 Years and over | 4 (100.0%) | 50 (100.0%) |
| Total | 123 (100.0%) | 188 (100.0%) |
Income Below Poverty Among Married-Couple Families in Star Junction
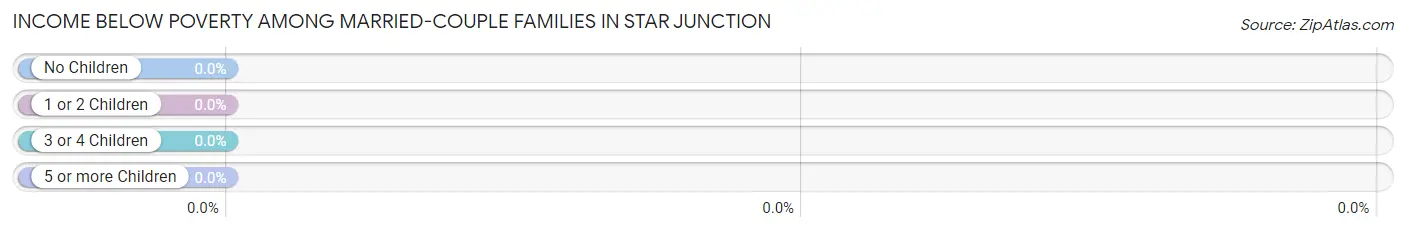
| Children | Above Poverty | Below Poverty |
| No Children | 31 (100.0%) | 0 (0.0%) |
| 1 or 2 Children | 5 (100.0%) | 0 (0.0%) |
| 3 or 4 Children | 0 (0.0%) | 0 (0.0%) |
| 5 or more Children | 0 (0.0%) | 0 (0.0%) |
| Total | 36 (100.0%) | 0 (0.0%) |
Income Below Poverty Among Single-Parent Households in Star Junction
| Children | Single Father | Single Mother |
| No Children | 0 (0.0%) | 0 (0.0%) |
| 1 or 2 Children | 0 (0.0%) | 0 (0.0%) |
| 3 or 4 Children | 0 (0.0%) | 0 (0.0%) |
| 5 or more Children | 0 (0.0%) | 0 (0.0%) |
| Total | 0 (0.0%) | 0 (0.0%) |
Income Below Poverty Among Married-Couple vs Single-Parent Households in Star Junction
| Children | Married-Couple Families | Single-Parent Households |
| No Children | 0 (0.0%) | 0 (0.0%) |
| 1 or 2 Children | 0 (0.0%) | 0 (0.0%) |
| 3 or 4 Children | 0 (0.0%) | 0 (0.0%) |
| 5 or more Children | 0 (0.0%) | 0 (0.0%) |
| Total | 0 (0.0%) | 0 (0.0%) |
Race in Star Junction
The most populous races in Star Junction are White / Caucasian (269 | 86.5%), and Two or more Races (42 | 13.5%).
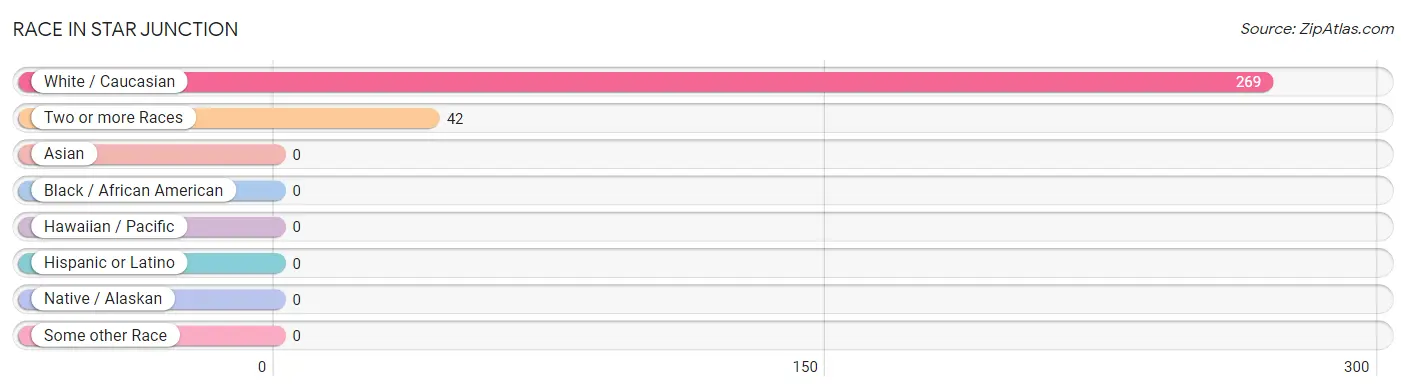
| Race | # Population | % Population |
| Asian | 0 | 0.0% |
| Black / African American | 0 | 0.0% |
| Hawaiian / Pacific | 0 | 0.0% |
| Hispanic or Latino | 0 | 0.0% |
| Native / Alaskan | 0 | 0.0% |
| White / Caucasian | 269 | 86.5% |
| Two or more Races | 42 | 13.5% |
| Some other Race | 0 | 0.0% |
| Total | 311 | 100.0% |
Ancestry in Star Junction
The most populous ancestries reported in Star Junction are English (67 | 21.5%), Italian (67 | 21.5%), Irish (54 | 17.4%), German (44 | 14.1%), and Polish (44 | 14.1%), together accounting for 88.7% of all Star Junction residents.
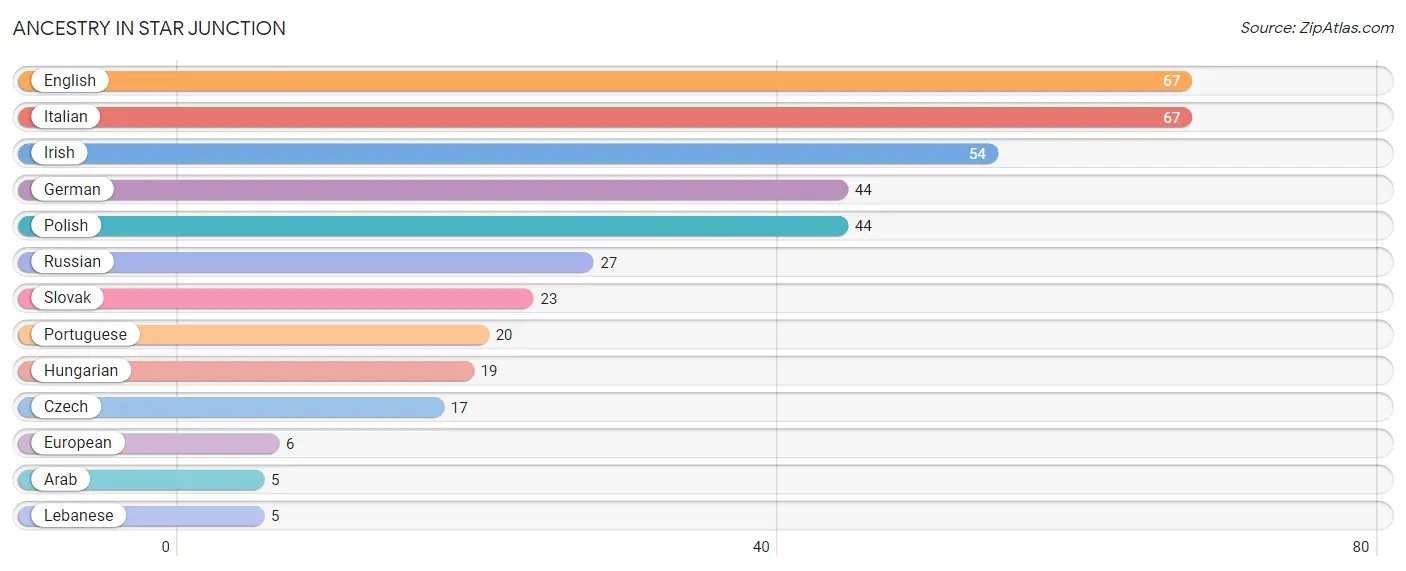
| Ancestry | # Population | % Population |
| Arab | 5 | 1.6% |
| Czech | 17 | 5.5% |
| English | 67 | 21.5% |
| European | 6 | 1.9% |
| German | 44 | 14.1% |
| Hungarian | 19 | 6.1% |
| Irish | 54 | 17.4% |
| Italian | 67 | 21.5% |
| Lebanese | 5 | 1.6% |
| Polish | 44 | 14.1% |
| Portuguese | 20 | 6.4% |
| Russian | 27 | 8.7% |
| Slovak | 23 | 7.4% | View All 13 Rows |
Immigrants in Star Junction

| Immigration Origin | # Population | % Population | View All 0 Rows |
Sex and Age in Star Junction
Sex and Age in Star Junction
The most populous age groups in Star Junction are 30 to 34 Years (20 | 16.3%) for men and 75 to 79 Years (50 | 26.6%) for women.
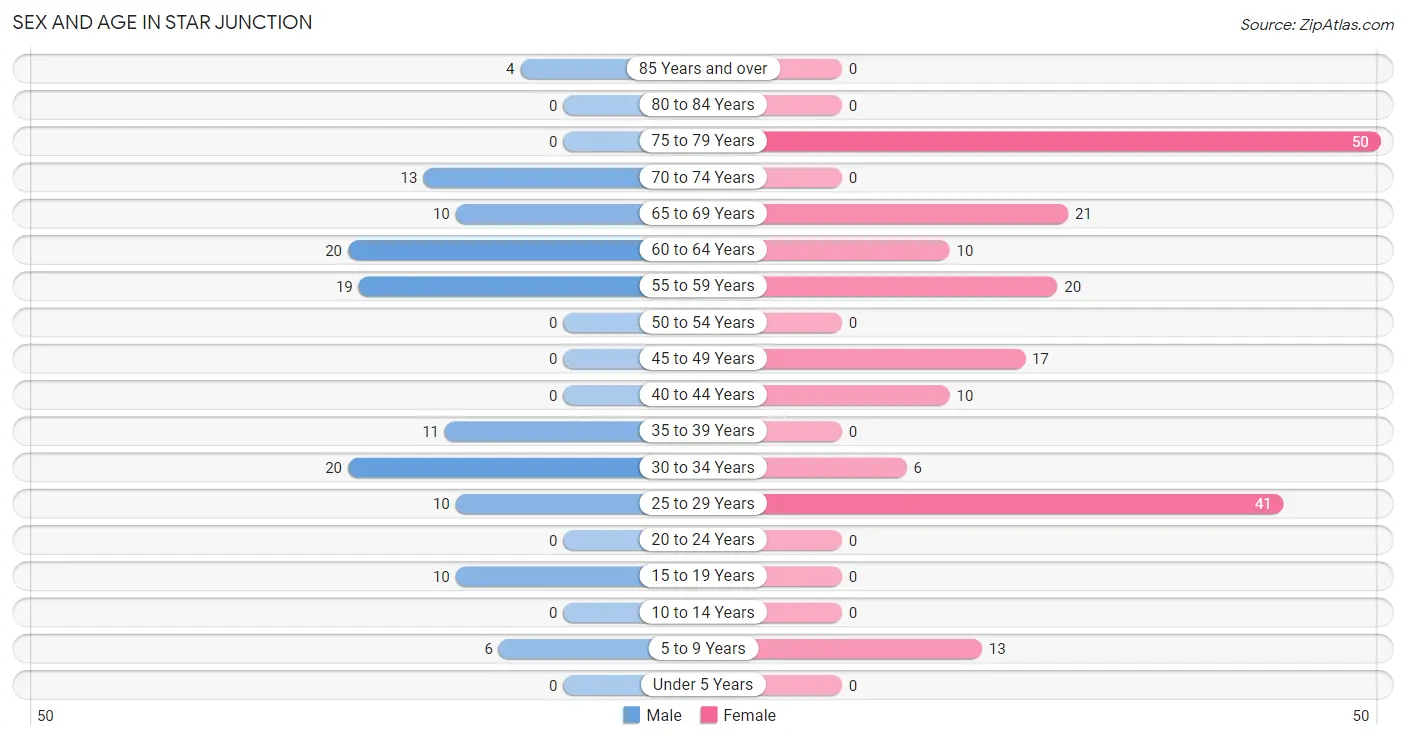
| Age Bracket | Male | Female |
| Under 5 Years | 0 (0.0%) | 0 (0.0%) |
| 5 to 9 Years | 6 (4.9%) | 13 (6.9%) |
| 10 to 14 Years | 0 (0.0%) | 0 (0.0%) |
| 15 to 19 Years | 10 (8.1%) | 0 (0.0%) |
| 20 to 24 Years | 0 (0.0%) | 0 (0.0%) |
| 25 to 29 Years | 10 (8.1%) | 41 (21.8%) |
| 30 to 34 Years | 20 (16.3%) | 6 (3.2%) |
| 35 to 39 Years | 11 (8.9%) | 0 (0.0%) |
| 40 to 44 Years | 0 (0.0%) | 10 (5.3%) |
| 45 to 49 Years | 0 (0.0%) | 17 (9.0%) |
| 50 to 54 Years | 0 (0.0%) | 0 (0.0%) |
| 55 to 59 Years | 19 (15.4%) | 20 (10.6%) |
| 60 to 64 Years | 20 (16.3%) | 10 (5.3%) |
| 65 to 69 Years | 10 (8.1%) | 21 (11.2%) |
| 70 to 74 Years | 13 (10.6%) | 0 (0.0%) |
| 75 to 79 Years | 0 (0.0%) | 50 (26.6%) |
| 80 to 84 Years | 0 (0.0%) | 0 (0.0%) |
| 85 Years and over | 4 (3.3%) | 0 (0.0%) |
| Total | 123 (100.0%) | 188 (100.0%) |
Families and Households in Star Junction
Median Family Size in Star Junction
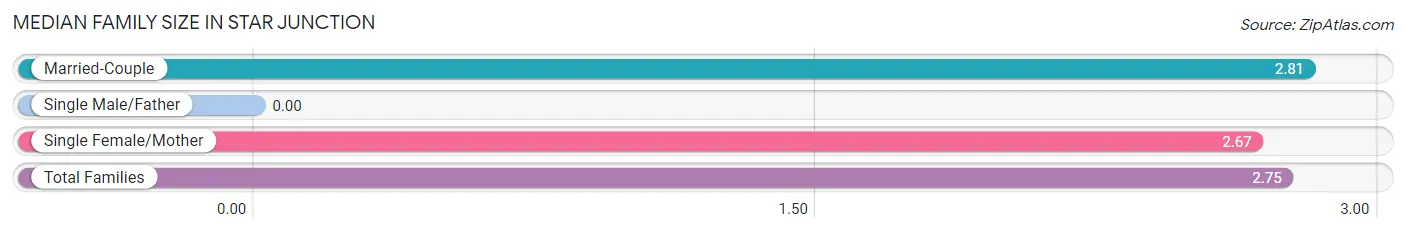
| Family Type | # Families | Family Size |
| Married-Couple | 36 (63.2%) | 2.81 |
| Single Male/Father | 0 (0.0%) | - |
| Single Female/Mother | 21 (36.8%) | 2.67 |
| Total Families | 57 (100.0%) | 2.75 |
Median Household Size in Star Junction
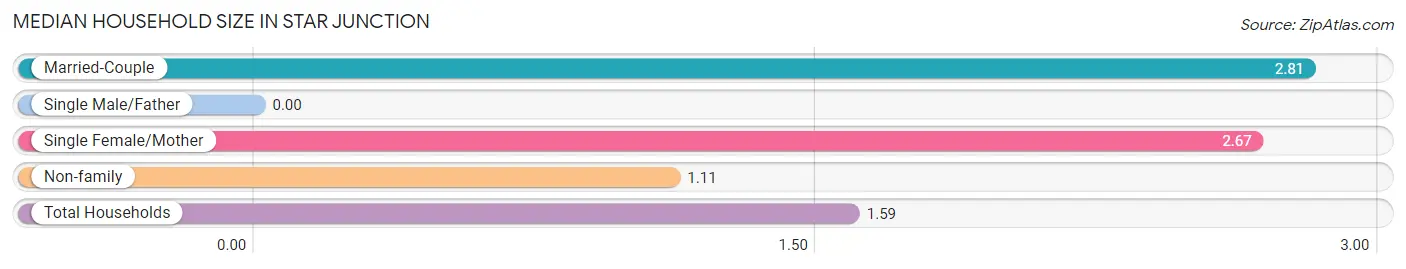
| Household Type | # Households | Household Size |
| Married-Couple | 36 (18.4%) | 2.81 |
| Single Male/Father | 0 (0.0%) | - |
| Single Female/Mother | 21 (10.7%) | 2.67 |
| Non-family | 139 (70.9%) | 1.11 |
| Total Households | 196 (100.0%) | 1.59 |
Household Size by Marriage Status in Star Junction
Out of a total of 196 households in Star Junction, 57 (29.1%) are family households, while 139 (70.9%) are nonfamily households. The most numerous type of family households are 2-person households, comprising 36, and the most common type of nonfamily households are 1-person households, comprising 122.
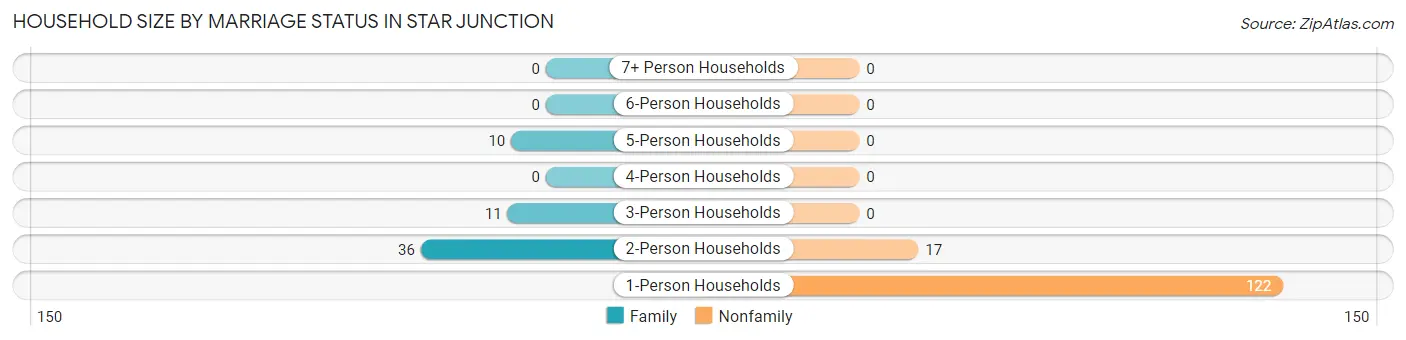
| Household Size | Family Households | Nonfamily Households |
| 1-Person Households | - | 122 (62.2%) |
| 2-Person Households | 36 (18.4%) | 17 (8.7%) |
| 3-Person Households | 11 (5.6%) | 0 (0.0%) |
| 4-Person Households | 0 (0.0%) | 0 (0.0%) |
| 5-Person Households | 10 (5.1%) | 0 (0.0%) |
| 6-Person Households | 0 (0.0%) | 0 (0.0%) |
| 7+ Person Households | 0 (0.0%) | 0 (0.0%) |
| Total | 57 (29.1%) | 139 (70.9%) |
Female Fertility in Star Junction
Fertility by Age in Star Junction
| Age Bracket | Women with Births | Births / 1,000 Women |
| 15 to 19 years | 0 (0.0%) | 0.0 |
| 20 to 34 years | 0 (0.0%) | 0.0 |
| 35 to 50 years | 0 (0.0%) | 0.0 |
| Total | 0 (0.0%) | 0.0 |
Fertility by Age by Marriage Status in Star Junction
| Age Bracket | Married | Unmarried |
| 15 to 19 years | 0 (0.0%) | 0 (0.0%) |
| 20 to 34 years | 0 (0.0%) | 0 (0.0%) |
| 35 to 50 years | 0 (0.0%) | 0 (0.0%) |
| Total | 0 (0.0%) | 0 (0.0%) |
Fertility by Education in Star Junction
| Educational Attainment | Women with Births | Births / 1,000 Women |
| Less than High School | 0 (0.0%) | 0.0 |
| High School Diploma | 0 (0.0%) | 0.0 |
| College or Associate's Degree | 0 (0.0%) | 0.0 |
| Bachelor's Degree | 0 (0.0%) | 0.0 |
| Graduate Degree | 0 (0.0%) | 0.0 |
| Total | 0 (0.0%) | 0.0 |
Fertility by Education by Marriage Status in Star Junction
| Educational Attainment | Married | Unmarried |
| Less than High School | 0 (0.0%) | 0 (0.0%) |
| High School Diploma | 0 (0.0%) | 0 (0.0%) |
| College or Associate's Degree | 0 (0.0%) | 0 (0.0%) |
| Bachelor's Degree | 0 (0.0%) | 0 (0.0%) |
| Graduate Degree | 0 (0.0%) | 0 (0.0%) |
| Total | 0 (0.0%) | 0 (0.0%) |
Employment Characteristics in Star Junction
Employment by Class of Employer in Star Junction
Among the 168 employed individuals in Star Junction, private company employees (142 | 84.5%), not-for-profit organizations (17 | 10.1%), and state government employees (9 | 5.4%) make up the most common classes of employment.
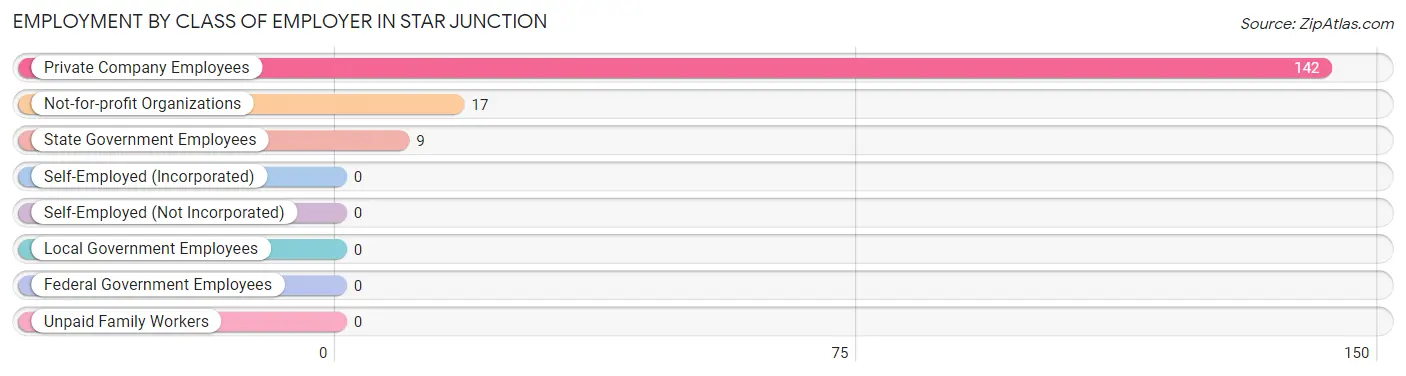
| Employer Class | # Employees | % Employees |
| Private Company Employees | 142 | 84.5% |
| Self-Employed (Incorporated) | 0 | 0.0% |
| Self-Employed (Not Incorporated) | 0 | 0.0% |
| Not-for-profit Organizations | 17 | 10.1% |
| Local Government Employees | 0 | 0.0% |
| State Government Employees | 9 | 5.4% |
| Federal Government Employees | 0 | 0.0% |
| Unpaid Family Workers | 0 | 0.0% |
| Total | 168 | 100.0% |
Employment Status by Age in Star Junction
According to the labor force statistics for Star Junction, out of the total population over 16 years of age (282), 61.7% or 174 individuals are in the labor force, with 3.4% or 6 of them unemployed. The age group with the highest labor force participation rate is 30 to 34 years, with 100.0% or 26 individuals in the labor force. Within the labor force, the 35 to 44 years age range has the highest percentage of unemployed individuals, with 28.6% or 6 of them being unemployed.
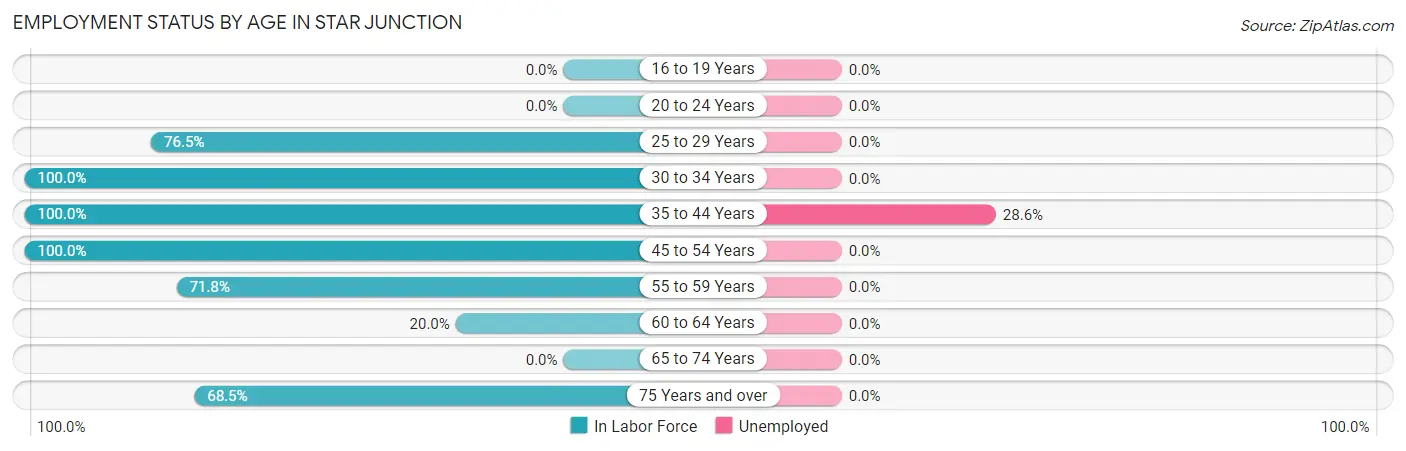
| Age Bracket | In Labor Force | Unemployed |
| 16 to 19 Years | 0 (0.0%) | 0 (0.0%) |
| 20 to 24 Years | 0 (0.0%) | 0 (0.0%) |
| 25 to 29 Years | 39 (76.5%) | 0 (0.0%) |
| 30 to 34 Years | 26 (100.0%) | 0 (0.0%) |
| 35 to 44 Years | 21 (100.0%) | 6 (28.6%) |
| 45 to 54 Years | 17 (100.0%) | 0 (0.0%) |
| 55 to 59 Years | 28 (71.8%) | 0 (0.0%) |
| 60 to 64 Years | 6 (20.0%) | 0 (0.0%) |
| 65 to 74 Years | 0 (0.0%) | 0 (0.0%) |
| 75 Years and over | 37 (68.5%) | 0 (0.0%) |
| Total | 174 (61.7%) | 6 (3.4%) |
Employment Status by Educational Attainment in Star Junction
According to labor force statistics for Star Junction, 74.5% of individuals (137) out of the total population between 25 and 64 years of age (184) are in the labor force, with 4.4% or 6 of them being unemployed. The group with the highest labor force participation rate are those with the educational attainment of college / associate degree, with 88.6% or 39 individuals in the labor force. Within the labor force, individuals with high school diploma education have the highest percentage of unemployment, with 6.8% or 6 of them being unemployed.
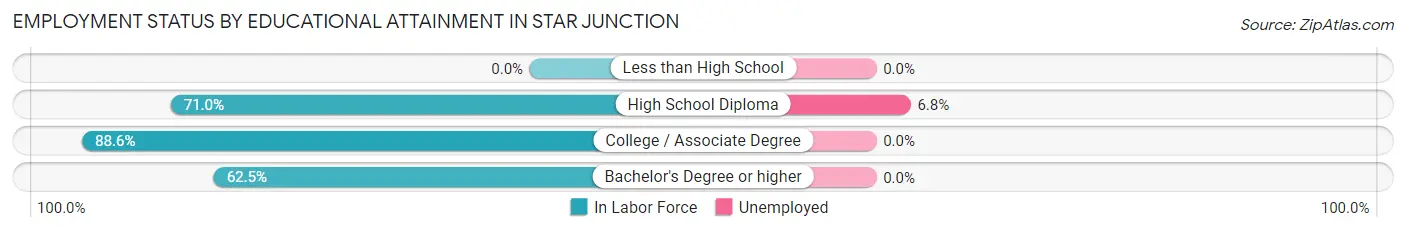
| Educational Attainment | In Labor Force | Unemployed |
| Less than High School | 0 (0.0%) | 0 (0.0%) |
| High School Diploma | 88 (71.0%) | 8 (6.8%) |
| College / Associate Degree | 39 (88.6%) | 0 (0.0%) |
| Bachelor's Degree or higher | 10 (62.5%) | 0 (0.0%) |
| Total | 137 (74.5%) | 8 (4.4%) |
Employment Occupations by Sex in Star Junction
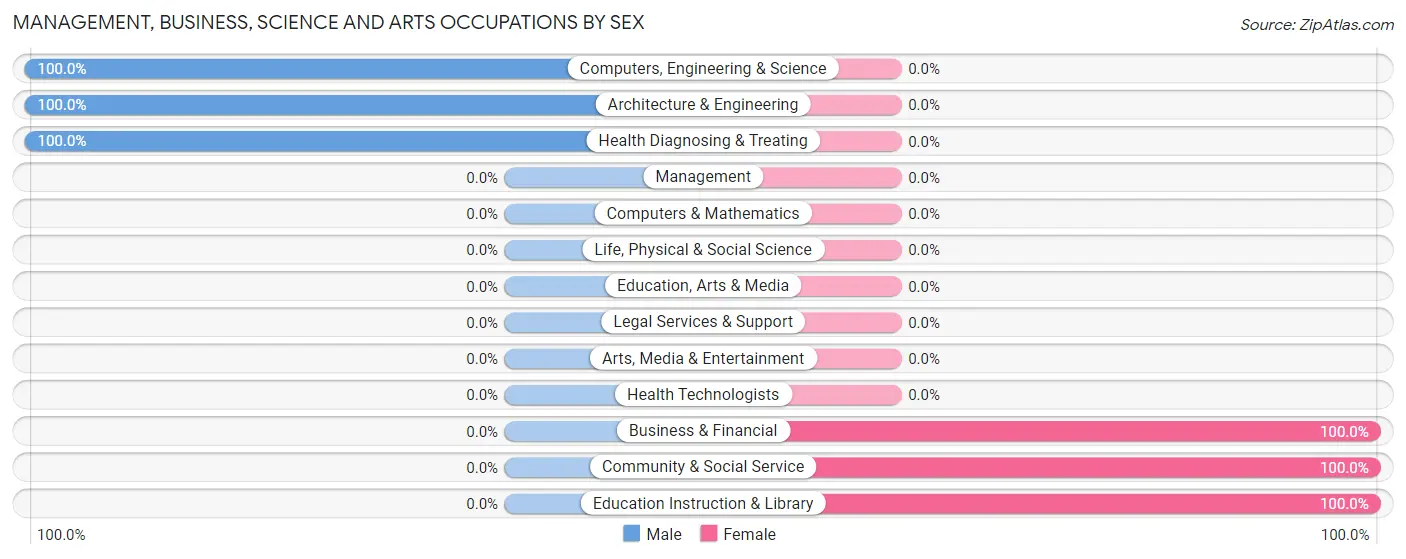
Management, Business, Science and Arts Occupations
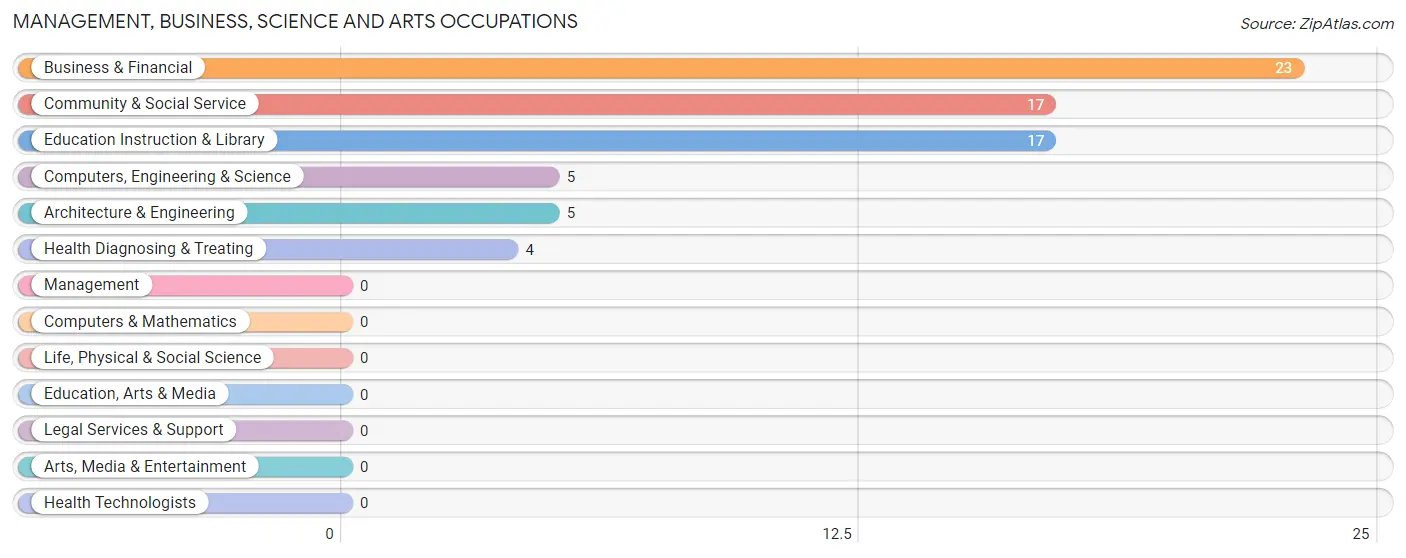
The most common Management, Business, Science and Arts occupations in Star Junction are Business & Financial (23 | 13.7%), Community & Social Service (17 | 10.1%), Education Instruction & Library (17 | 10.1%), Computers, Engineering & Science (5 | 3.0%), and Architecture & Engineering (5 | 3.0%).
Management, Business, Science and Arts Occupations by Sex
Within the Management, Business, Science and Arts occupations in Star Junction, the most male-oriented occupations are Computers, Engineering & Science (100.0%), Architecture & Engineering (100.0%), and Health Diagnosing & Treating (100.0%), while the most female-oriented occupations are Business & Financial (100.0%), Community & Social Service (100.0%), and Education Instruction & Library (100.0%).
| Occupation | Male | Female |
| Management | 0 (0.0%) | 0 (0.0%) |
| Business & Financial | 0 (0.0%) | 23 (100.0%) |
| Computers, Engineering & Science | 5 (100.0%) | 0 (0.0%) |
| Computers & Mathematics | 0 (0.0%) | 0 (0.0%) |
| Architecture & Engineering | 5 (100.0%) | 0 (0.0%) |
| Life, Physical & Social Science | 0 (0.0%) | 0 (0.0%) |
| Community & Social Service | 0 (0.0%) | 17 (100.0%) |
| Education, Arts & Media | 0 (0.0%) | 0 (0.0%) |
| Legal Services & Support | 0 (0.0%) | 0 (0.0%) |
| Education Instruction & Library | 0 (0.0%) | 17 (100.0%) |
| Arts, Media & Entertainment | 0 (0.0%) | 0 (0.0%) |
| Health Diagnosing & Treating | 4 (100.0%) | 0 (0.0%) |
| Health Technologists | 0 (0.0%) | 0 (0.0%) |
| Total (Category) | 9 (18.4%) | 40 (81.6%) |
| Total (Overall) | 60 (35.7%) | 108 (64.3%) |
Services Occupations
Services Occupations by Sex
| Occupation | Male | Female |
| Healthcare Support | 0 (0.0%) | 0 (0.0%) |
| Security & Protection | 0 (0.0%) | 0 (0.0%) |
| Firefighting & Prevention | 0 (0.0%) | 0 (0.0%) |
| Law Enforcement | 0 (0.0%) | 0 (0.0%) |
| Food Preparation & Serving | 0 (0.0%) | 0 (0.0%) |
| Cleaning & Maintenance | 0 (0.0%) | 0 (0.0%) |
| Personal Care & Service | 0 (0.0%) | 0 (0.0%) |
| Total (Category) | 0 (0.0%) | 0 (0.0%) |
| Total (Overall) | 60 (35.7%) | 108 (64.3%) |
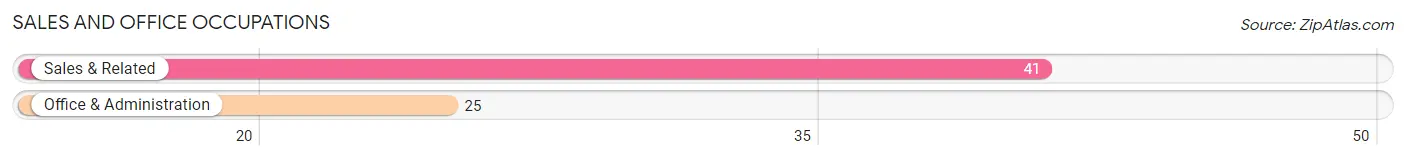
Sales and Office Occupations
The most common Sales and Office occupations in Star Junction are Sales & Related (41 | 24.4%), and Office & Administration (25 | 14.9%).
Sales and Office Occupations by Sex
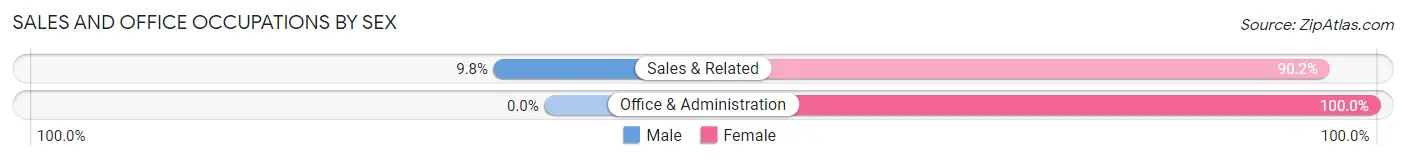
| Occupation | Male | Female |
| Sales & Related | 4 (9.8%) | 37 (90.2%) |
| Office & Administration | 0 (0.0%) | 25 (100.0%) |
| Total (Category) | 4 (6.1%) | 62 (93.9%) |
| Total (Overall) | 60 (35.7%) | 108 (64.3%) |
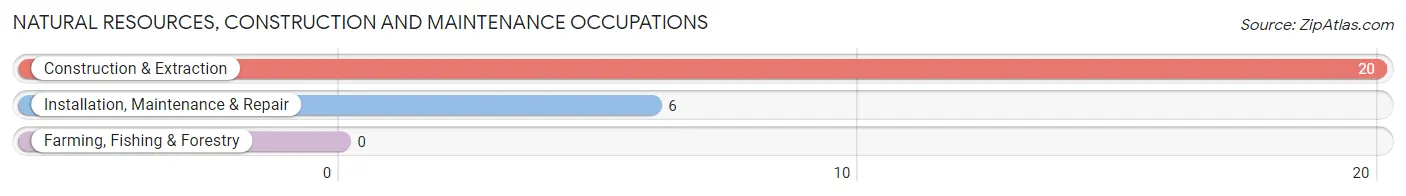
Natural Resources, Construction and Maintenance Occupations
The most common Natural Resources, Construction and Maintenance occupations in Star Junction are Construction & Extraction (20 | 11.9%), and Installation, Maintenance & Repair (6 | 3.6%).
Natural Resources, Construction and Maintenance Occupations by Sex
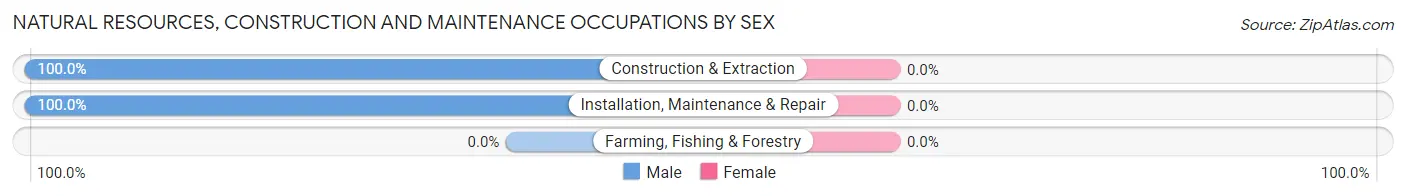
| Occupation | Male | Female |
| Farming, Fishing & Forestry | 0 (0.0%) | 0 (0.0%) |
| Construction & Extraction | 20 (100.0%) | 0 (0.0%) |
| Installation, Maintenance & Repair | 6 (100.0%) | 0 (0.0%) |
| Total (Category) | 26 (100.0%) | 0 (0.0%) |
| Total (Overall) | 60 (35.7%) | 108 (64.3%) |
Production, Transportation and Moving Occupations
The most common Production, Transportation and Moving occupations in Star Junction are Production (21 | 12.5%), and Material Moving (6 | 3.6%).
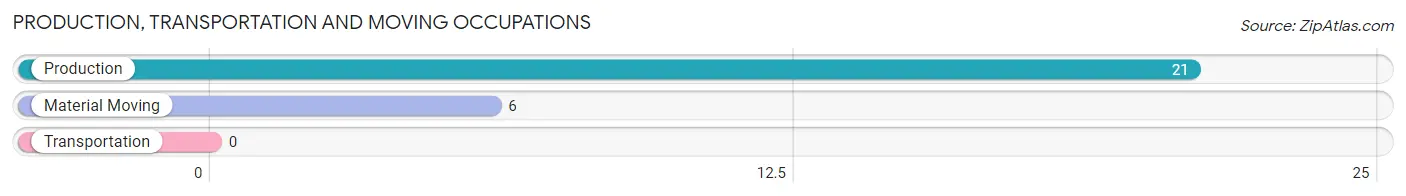
Production, Transportation and Moving Occupations by Sex
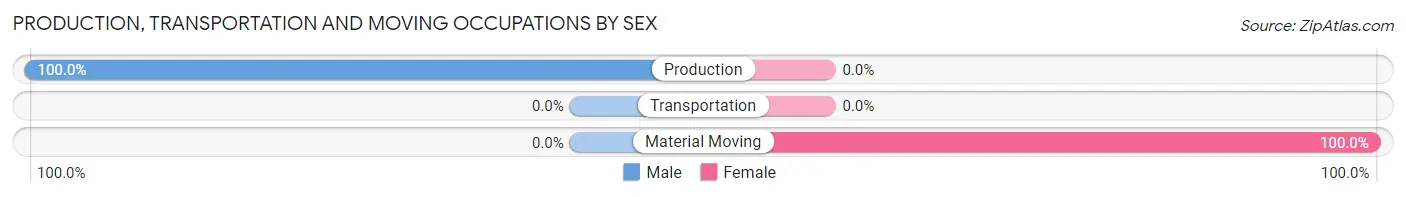
| Occupation | Male | Female |
| Production | 21 (100.0%) | 0 (0.0%) |
| Transportation | 0 (0.0%) | 0 (0.0%) |
| Material Moving | 0 (0.0%) | 6 (100.0%) |
| Total (Category) | 21 (77.8%) | 6 (22.2%) |
| Total (Overall) | 60 (35.7%) | 108 (64.3%) |
Employment Industries by Sex in Star Junction
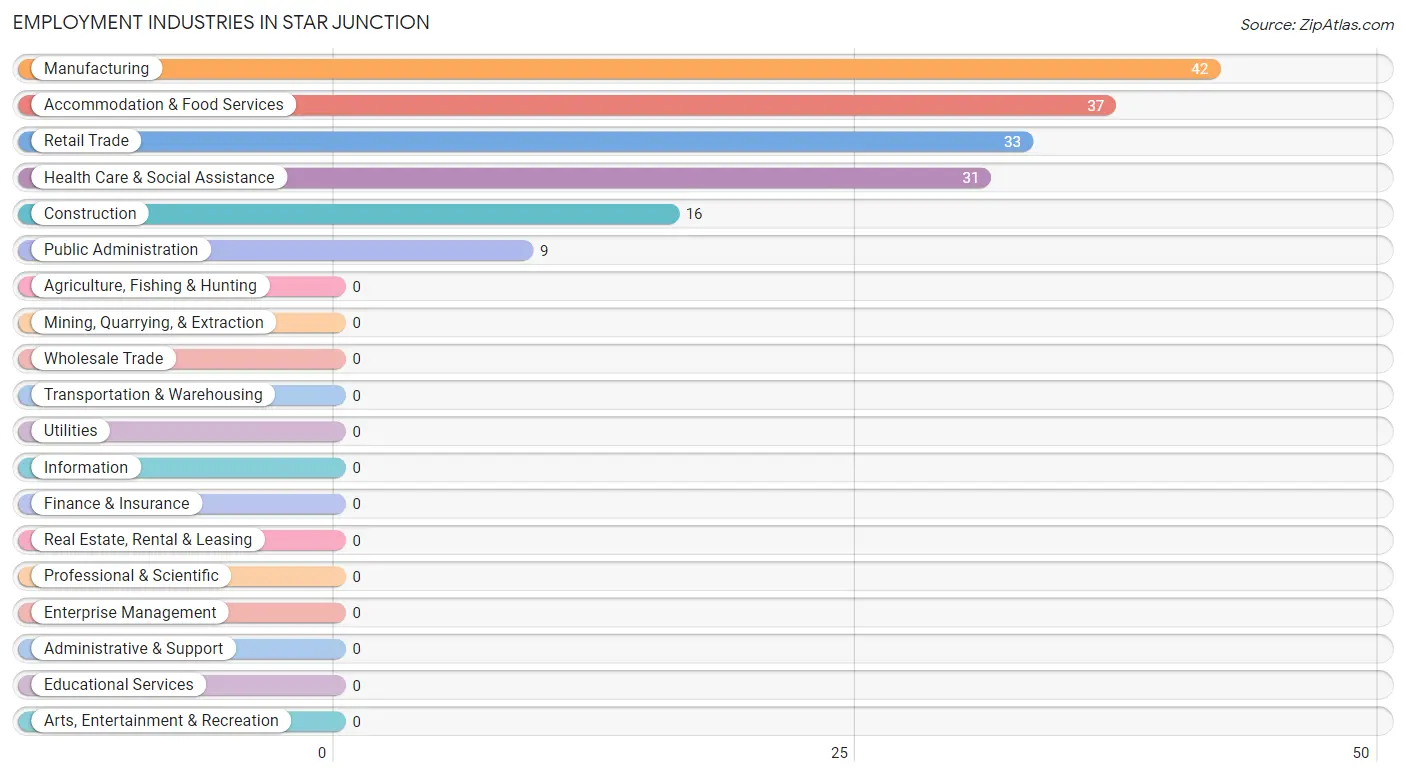
Employment Industries in Star Junction
The major employment industries in Star Junction include Manufacturing (42 | 25.0%), Accommodation & Food Services (37 | 22.0%), Retail Trade (33 | 19.6%), Health Care & Social Assistance (31 | 18.4%), and Construction (16 | 9.5%).
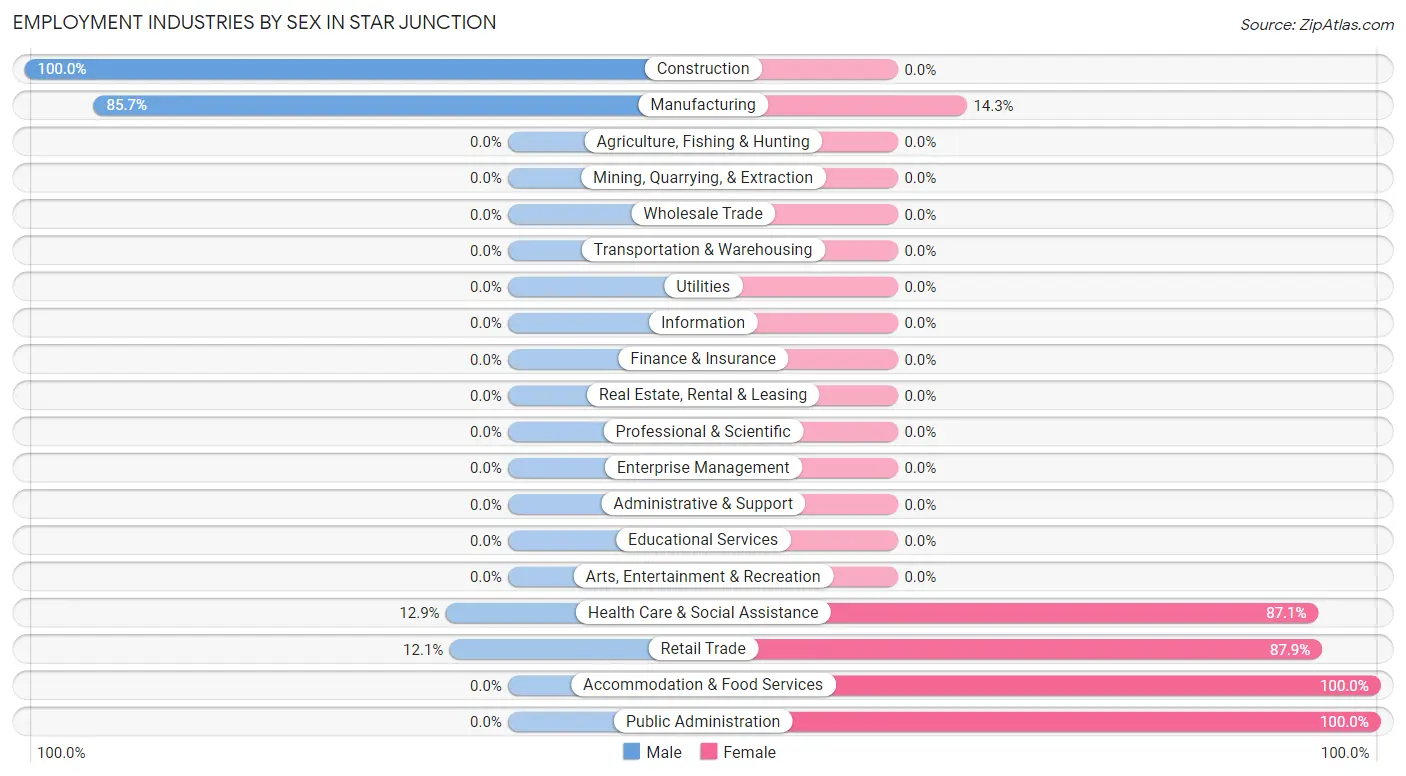
Employment Industries by Sex in Star Junction
The Star Junction industries that see more men than women are Construction (100.0%), Manufacturing (85.7%), and Health Care & Social Assistance (12.9%), whereas the industries that tend to have a higher number of women are Accommodation & Food Services (100.0%), Public Administration (100.0%), and Retail Trade (87.9%).
| Industry | Male | Female |
| Agriculture, Fishing & Hunting | 0 (0.0%) | 0 (0.0%) |
| Mining, Quarrying, & Extraction | 0 (0.0%) | 0 (0.0%) |
| Construction | 16 (100.0%) | 0 (0.0%) |
| Manufacturing | 36 (85.7%) | 6 (14.3%) |
| Wholesale Trade | 0 (0.0%) | 0 (0.0%) |
| Retail Trade | 4 (12.1%) | 29 (87.9%) |
| Transportation & Warehousing | 0 (0.0%) | 0 (0.0%) |
| Utilities | 0 (0.0%) | 0 (0.0%) |
| Information | 0 (0.0%) | 0 (0.0%) |
| Finance & Insurance | 0 (0.0%) | 0 (0.0%) |
| Real Estate, Rental & Leasing | 0 (0.0%) | 0 (0.0%) |
| Professional & Scientific | 0 (0.0%) | 0 (0.0%) |
| Enterprise Management | 0 (0.0%) | 0 (0.0%) |
| Administrative & Support | 0 (0.0%) | 0 (0.0%) |
| Educational Services | 0 (0.0%) | 0 (0.0%) |
| Health Care & Social Assistance | 4 (12.9%) | 27 (87.1%) |
| Arts, Entertainment & Recreation | 0 (0.0%) | 0 (0.0%) |
| Accommodation & Food Services | 0 (0.0%) | 37 (100.0%) |
| Public Administration | 0 (0.0%) | 9 (100.0%) |
| Total | 60 (35.7%) | 108 (64.3%) |
Education in Star Junction
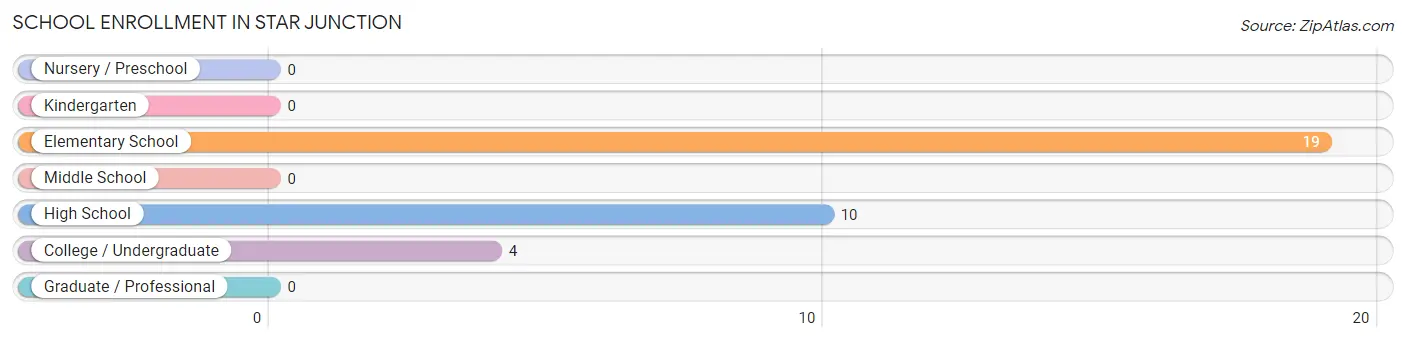
School Enrollment in Star Junction
The most common levels of schooling among the 33 students in Star Junction are elementary school (19 | 57.6%), high school (10 | 30.3%), and college / undergraduate (4 | 12.1%).
| School Level | # Students | % Students |
| Nursery / Preschool | 0 | 0.0% |
| Kindergarten | 0 | 0.0% |
| Elementary School | 19 | 57.6% |
| Middle School | 0 | 0.0% |
| High School | 10 | 30.3% |
| College / Undergraduate | 4 | 12.1% |
| Graduate / Professional | 0 | 0.0% |
| Total | 33 | 100.0% |
School Enrollment by Age by Funding Source in Star Junction
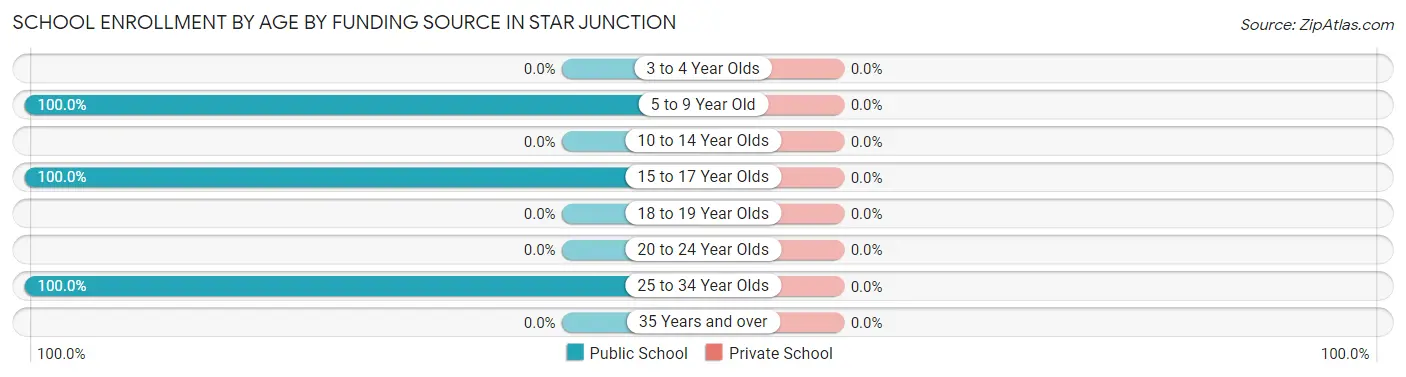
| Age Bracket | Public School | Private School |
| 3 to 4 Year Olds | 0 (0.0%) | 0 (0.0%) |
| 5 to 9 Year Old | 19 (100.0%) | 0 (0.0%) |
| 10 to 14 Year Olds | 0 (0.0%) | 0 (0.0%) |
| 15 to 17 Year Olds | 10 (100.0%) | 0 (0.0%) |
| 18 to 19 Year Olds | 0 (0.0%) | 0 (0.0%) |
| 20 to 24 Year Olds | 0 (0.0%) | 0 (0.0%) |
| 25 to 34 Year Olds | 4 (100.0%) | 0 (0.0%) |
| 35 Years and over | 0 (0.0%) | 0 (0.0%) |
| Total | 33 (100.0%) | 0 (0.0%) |
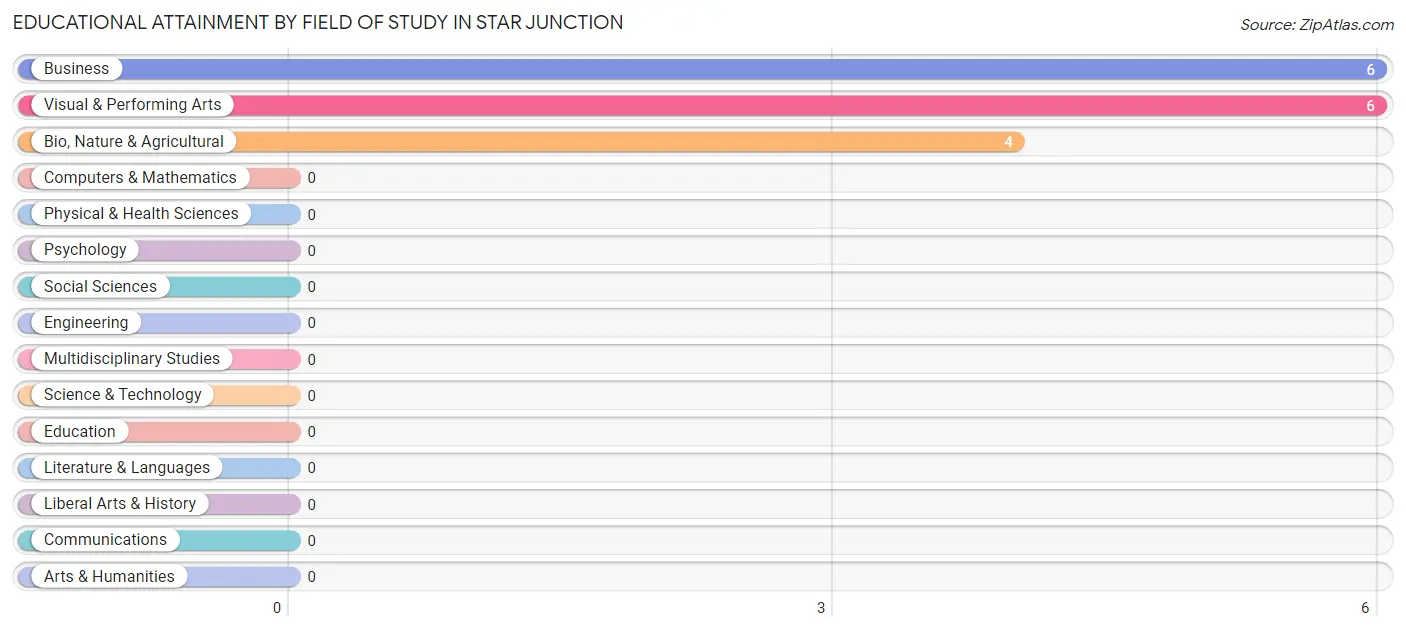
Educational Attainment by Field of Study in Star Junction
Business (6 | 37.5%), visual & performing arts (6 | 37.5%), and bio, nature & agricultural (4 | 25.0%) are the most common fields of study among 16 individuals in Star Junction who have obtained a bachelor's degree or higher.
| Field of Study | # Graduates | % Graduates |
| Computers & Mathematics | 0 | 0.0% |
| Bio, Nature & Agricultural | 4 | 25.0% |
| Physical & Health Sciences | 0 | 0.0% |
| Psychology | 0 | 0.0% |
| Social Sciences | 0 | 0.0% |
| Engineering | 0 | 0.0% |
| Multidisciplinary Studies | 0 | 0.0% |
| Science & Technology | 0 | 0.0% |
| Business | 6 | 37.5% |
| Education | 0 | 0.0% |
| Literature & Languages | 0 | 0.0% |
| Liberal Arts & History | 0 | 0.0% |
| Visual & Performing Arts | 6 | 37.5% |
| Communications | 0 | 0.0% |
| Arts & Humanities | 0 | 0.0% |
| Total | 16 | 100.0% |
Transportation & Commute in Star Junction
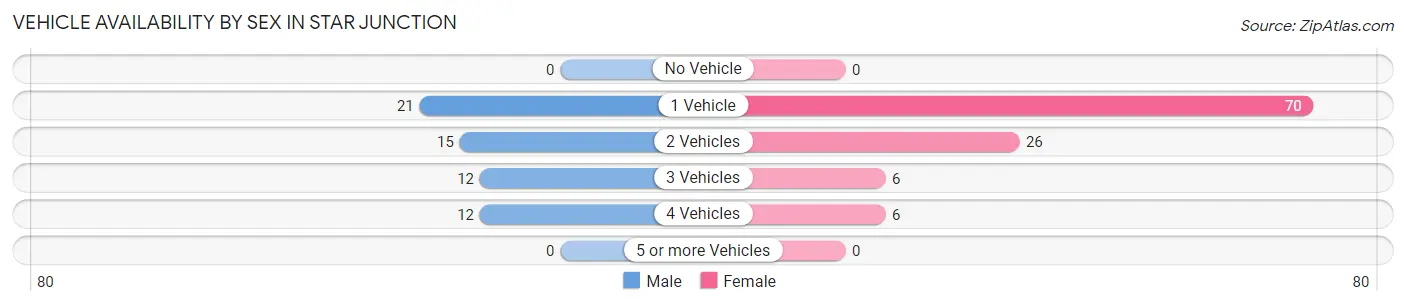
Vehicle Availability by Sex in Star Junction
The most prevalent vehicle ownership categories in Star Junction are males with 1 vehicle (21, accounting for 35.0%) and females with 1 vehicle (70, making up 19.4%).
| Vehicles Available | Male | Female |
| No Vehicle | 0 (0.0%) | 0 (0.0%) |
| 1 Vehicle | 21 (35.0%) | 70 (64.8%) |
| 2 Vehicles | 15 (25.0%) | 26 (24.1%) |
| 3 Vehicles | 12 (20.0%) | 6 (5.6%) |
| 4 Vehicles | 12 (20.0%) | 6 (5.6%) |
| 5 or more Vehicles | 0 (0.0%) | 0 (0.0%) |
| Total | 60 (100.0%) | 108 (100.0%) |
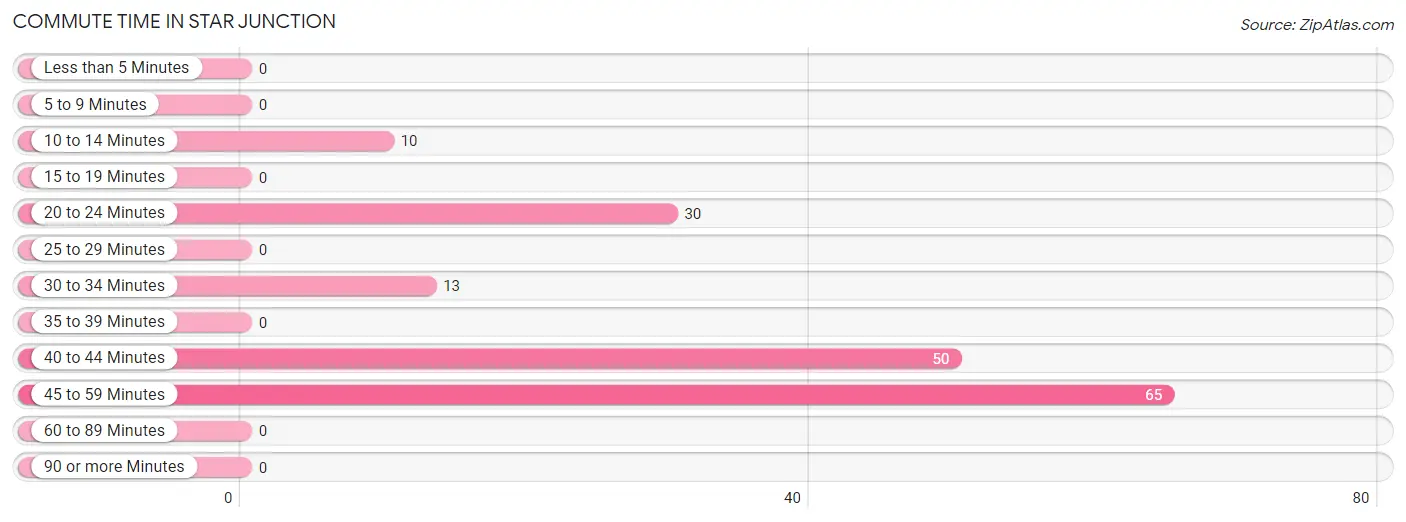
Commute Time in Star Junction
The most frequently occuring commute durations in Star Junction are 45 to 59 minutes (65 commuters, 38.7%), 40 to 44 minutes (50 commuters, 29.8%), and 20 to 24 minutes (30 commuters, 17.9%).
| Commute Time | # Commuters | % Commuters |
| Less than 5 Minutes | 0 | 0.0% |
| 5 to 9 Minutes | 0 | 0.0% |
| 10 to 14 Minutes | 10 | 5.9% |
| 15 to 19 Minutes | 0 | 0.0% |
| 20 to 24 Minutes | 30 | 17.9% |
| 25 to 29 Minutes | 0 | 0.0% |
| 30 to 34 Minutes | 13 | 7.7% |
| 35 to 39 Minutes | 0 | 0.0% |
| 40 to 44 Minutes | 50 | 29.8% |
| 45 to 59 Minutes | 65 | 38.7% |
| 60 to 89 Minutes | 0 | 0.0% |
| 90 or more Minutes | 0 | 0.0% |
Commute Time by Sex in Star Junction
The most common commute times in Star Junction are 45 to 59 minutes (22 commuters, 36.7%) for males and 40 to 44 minutes (46 commuters, 42.6%) for females.
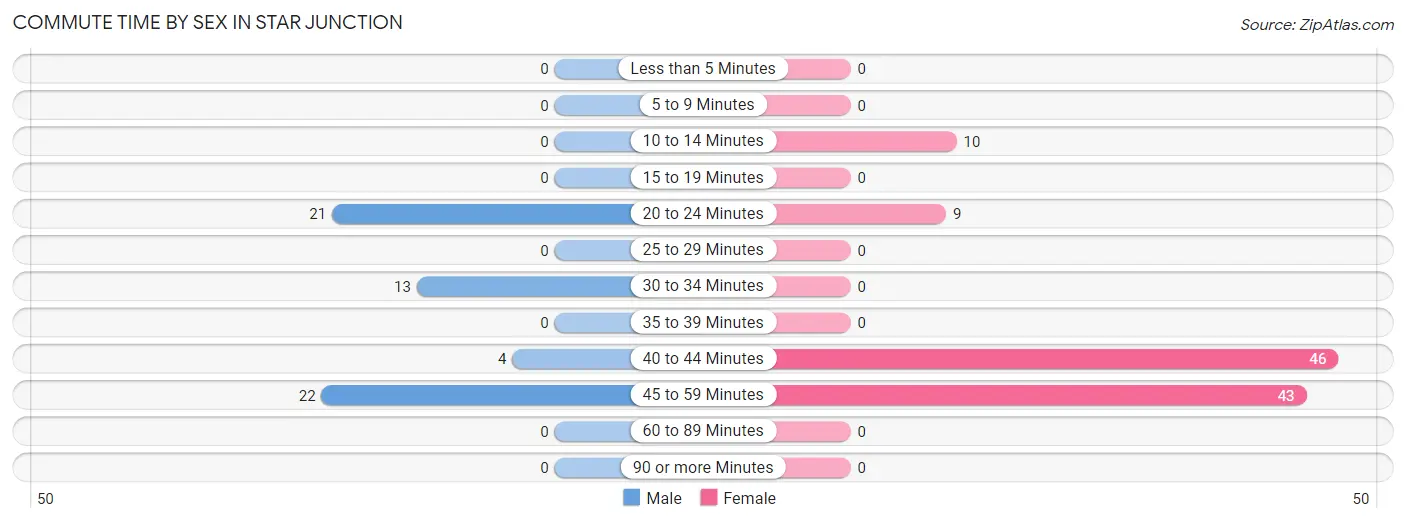
| Commute Time | Male | Female |
| Less than 5 Minutes | 0 (0.0%) | 0 (0.0%) |
| 5 to 9 Minutes | 0 (0.0%) | 0 (0.0%) |
| 10 to 14 Minutes | 0 (0.0%) | 10 (9.3%) |
| 15 to 19 Minutes | 0 (0.0%) | 0 (0.0%) |
| 20 to 24 Minutes | 21 (35.0%) | 9 (8.3%) |
| 25 to 29 Minutes | 0 (0.0%) | 0 (0.0%) |
| 30 to 34 Minutes | 13 (21.7%) | 0 (0.0%) |
| 35 to 39 Minutes | 0 (0.0%) | 0 (0.0%) |
| 40 to 44 Minutes | 4 (6.7%) | 46 (42.6%) |
| 45 to 59 Minutes | 22 (36.7%) | 43 (39.8%) |
| 60 to 89 Minutes | 0 (0.0%) | 0 (0.0%) |
| 90 or more Minutes | 0 (0.0%) | 0 (0.0%) |
Time of Departure to Work by Sex in Star Junction
The most frequent times of departure to work in Star Junction are 6:00 AM to 6:29 AM (16, 26.7%) for males and 6:00 AM to 6:29 AM (43, 39.8%) for females.
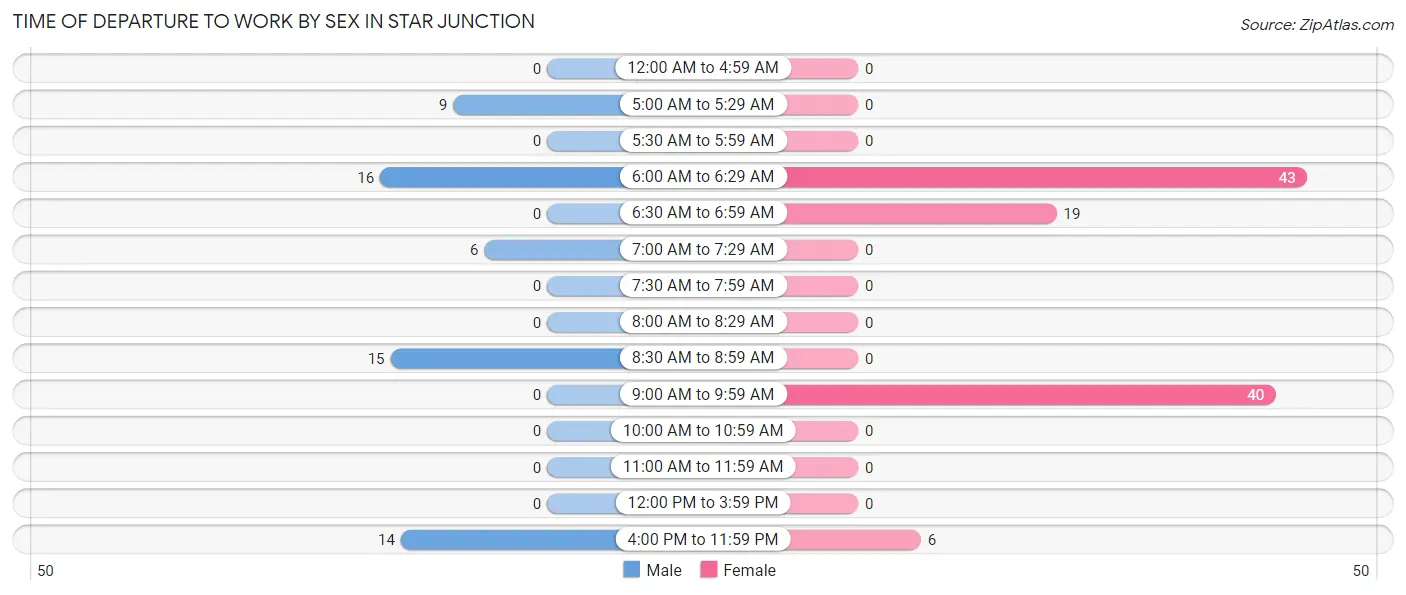
| Time of Departure | Male | Female |
| 12:00 AM to 4:59 AM | 0 (0.0%) | 0 (0.0%) |
| 5:00 AM to 5:29 AM | 9 (15.0%) | 0 (0.0%) |
| 5:30 AM to 5:59 AM | 0 (0.0%) | 0 (0.0%) |
| 6:00 AM to 6:29 AM | 16 (26.7%) | 43 (39.8%) |
| 6:30 AM to 6:59 AM | 0 (0.0%) | 19 (17.6%) |
| 7:00 AM to 7:29 AM | 6 (10.0%) | 0 (0.0%) |
| 7:30 AM to 7:59 AM | 0 (0.0%) | 0 (0.0%) |
| 8:00 AM to 8:29 AM | 0 (0.0%) | 0 (0.0%) |
| 8:30 AM to 8:59 AM | 15 (25.0%) | 0 (0.0%) |
| 9:00 AM to 9:59 AM | 0 (0.0%) | 40 (37.0%) |
| 10:00 AM to 10:59 AM | 0 (0.0%) | 0 (0.0%) |
| 11:00 AM to 11:59 AM | 0 (0.0%) | 0 (0.0%) |
| 12:00 PM to 3:59 PM | 0 (0.0%) | 0 (0.0%) |
| 4:00 PM to 11:59 PM | 14 (23.3%) | 6 (5.6%) |
| Total | 60 (100.0%) | 108 (100.0%) |
Housing Occupancy in Star Junction
Occupancy by Ownership in Star Junction
Of the total 196 dwellings in Star Junction, owner-occupied units account for 113 (57.7%), while renter-occupied units make up 83 (42.3%).
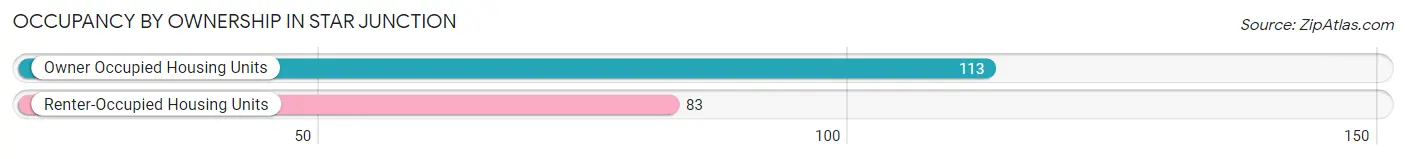
| Occupancy | # Housing Units | % Housing Units |
| Owner Occupied Housing Units | 113 | 57.7% |
| Renter-Occupied Housing Units | 83 | 42.3% |
| Total Occupied Housing Units | 196 | 100.0% |
Occupancy by Household Size in Star Junction
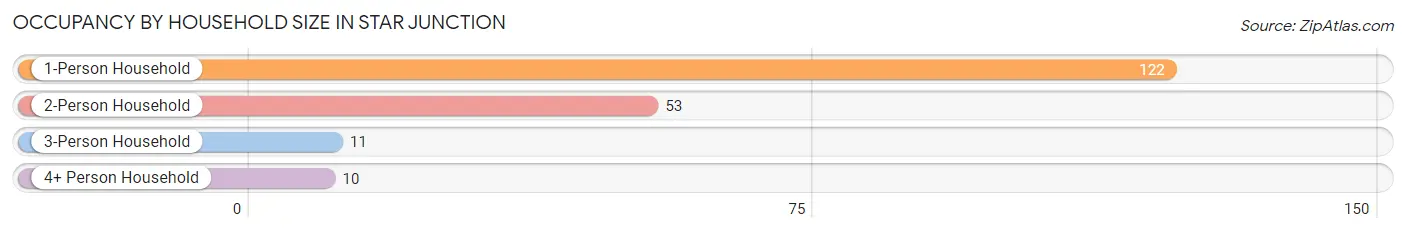
| Household Size | # Housing Units | % Housing Units |
| 1-Person Household | 122 | 62.2% |
| 2-Person Household | 53 | 27.0% |
| 3-Person Household | 11 | 5.6% |
| 4+ Person Household | 10 | 5.1% |
| Total Housing Units | 196 | 100.0% |
Occupancy by Ownership by Household Size in Star Junction
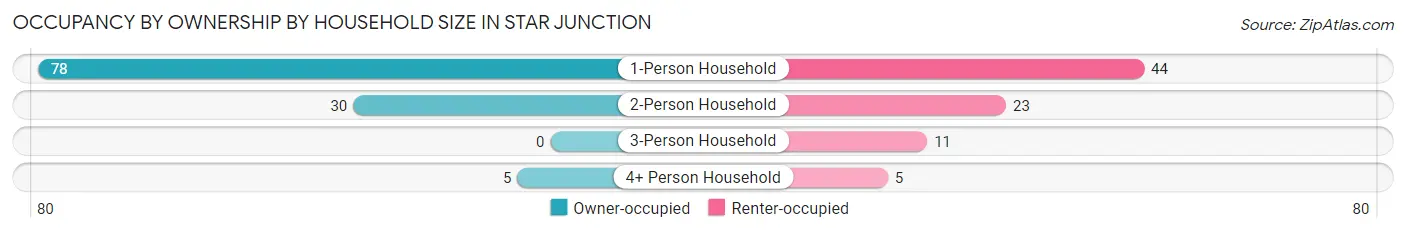
| Household Size | Owner-occupied | Renter-occupied |
| 1-Person Household | 78 (63.9%) | 44 (36.1%) |
| 2-Person Household | 30 (56.6%) | 23 (43.4%) |
| 3-Person Household | 0 (0.0%) | 11 (100.0%) |
| 4+ Person Household | 5 (50.0%) | 5 (50.0%) |
| Total Housing Units | 113 (57.7%) | 83 (42.3%) |
Occupancy by Educational Attainment in Star Junction
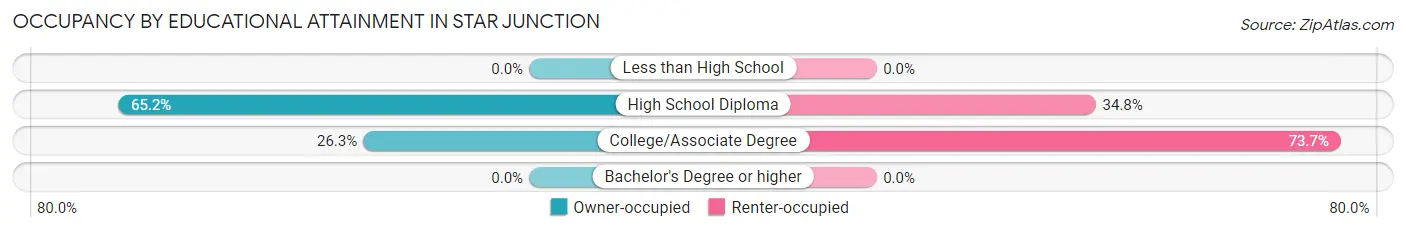
| Household Size | Owner-occupied | Renter-occupied |
| Less than High School | 0 (0.0%) | 0 (0.0%) |
| High School Diploma | 103 (65.2%) | 55 (34.8%) |
| College/Associate Degree | 10 (26.3%) | 28 (73.7%) |
| Bachelor's Degree or higher | 0 (0.0%) | 0 (0.0%) |
Occupancy by Age of Householder in Star Junction
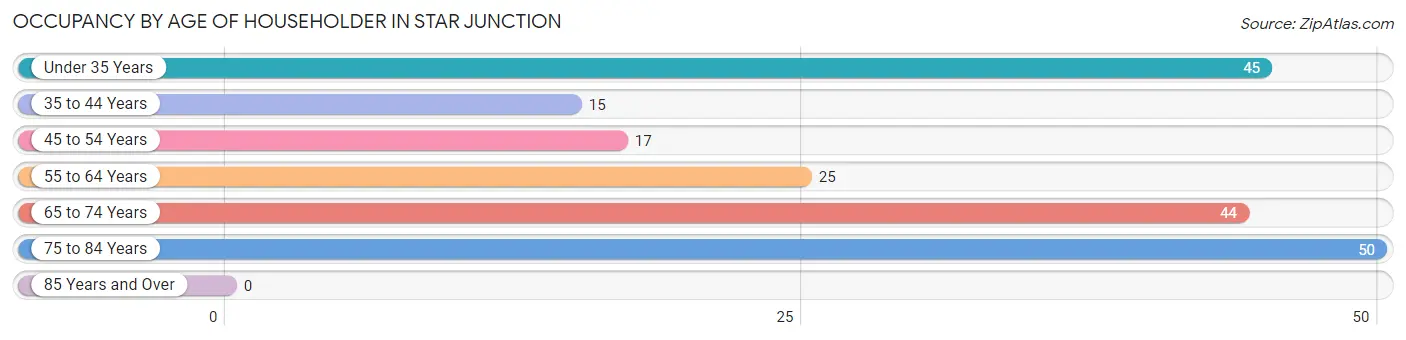
| Age Bracket | # Households | % Households |
| Under 35 Years | 45 | 23.0% |
| 35 to 44 Years | 15 | 7.6% |
| 45 to 54 Years | 17 | 8.7% |
| 55 to 64 Years | 25 | 12.8% |
| 65 to 74 Years | 44 | 22.5% |
| 75 to 84 Years | 50 | 25.5% |
| 85 Years and Over | 0 | 0.0% |
| Total | 196 | 100.0% |
Housing Finances in Star Junction
Median Income by Occupancy in Star Junction
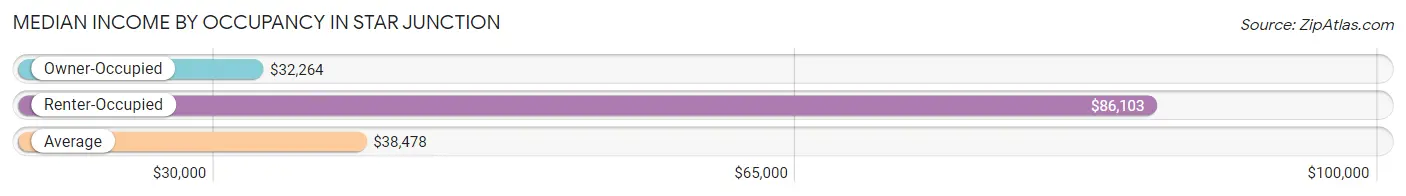
| Occupancy Type | # Households | Median Income |
| Owner-Occupied | 113 (57.7%) | $32,264 |
| Renter-Occupied | 83 (42.3%) | $86,103 |
| Average | 196 (100.0%) | $38,478 |
Occupancy by Householder Income Bracket in Star Junction
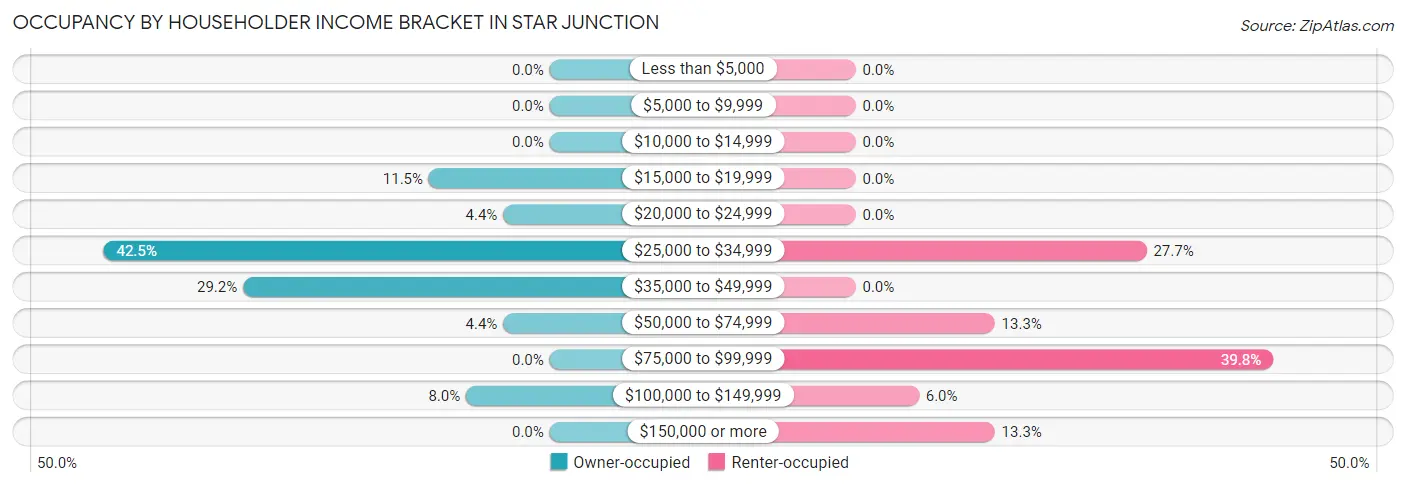
| Income Bracket | Owner-occupied | Renter-occupied |
| Less than $5,000 | 0 (0.0%) | 0 (0.0%) |
| $5,000 to $9,999 | 0 (0.0%) | 0 (0.0%) |
| $10,000 to $14,999 | 0 (0.0%) | 0 (0.0%) |
| $15,000 to $19,999 | 13 (11.5%) | 0 (0.0%) |
| $20,000 to $24,999 | 5 (4.4%) | 0 (0.0%) |
| $25,000 to $34,999 | 48 (42.5%) | 23 (27.7%) |
| $35,000 to $49,999 | 33 (29.2%) | 0 (0.0%) |
| $50,000 to $74,999 | 5 (4.4%) | 11 (13.3%) |
| $75,000 to $99,999 | 0 (0.0%) | 33 (39.8%) |
| $100,000 to $149,999 | 9 (8.0%) | 5 (6.0%) |
| $150,000 or more | 0 (0.0%) | 11 (13.3%) |
| Total | 113 (100.0%) | 83 (100.0%) |
Monthly Housing Cost Tiers in Star Junction
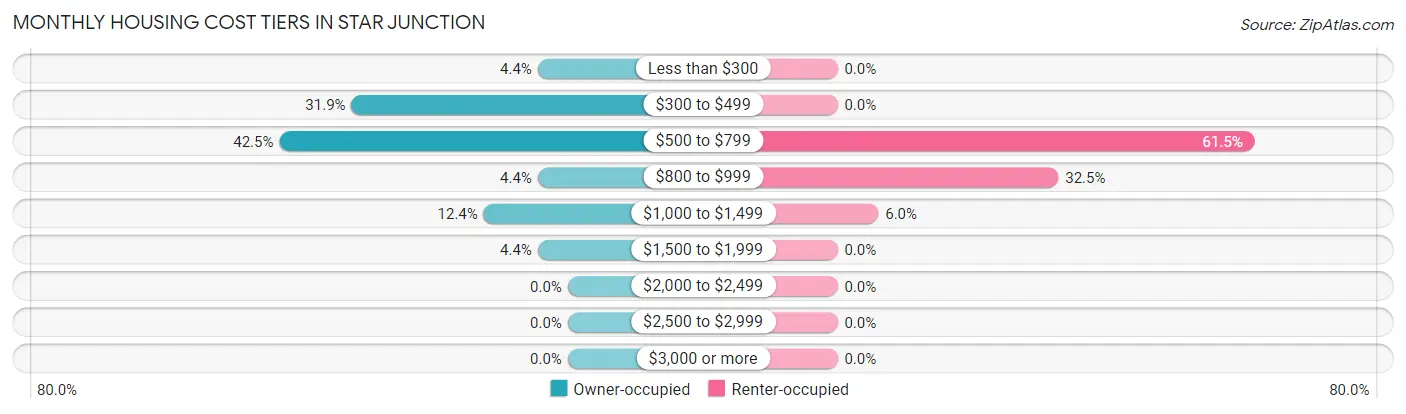
| Monthly Cost | Owner-occupied | Renter-occupied |
| Less than $300 | 5 (4.4%) | 0 (0.0%) |
| $300 to $499 | 36 (31.9%) | 0 (0.0%) |
| $500 to $799 | 48 (42.5%) | 51 (61.5%) |
| $800 to $999 | 5 (4.4%) | 27 (32.5%) |
| $1,000 to $1,499 | 14 (12.4%) | 5 (6.0%) |
| $1,500 to $1,999 | 5 (4.4%) | 0 (0.0%) |
| $2,000 to $2,499 | 0 (0.0%) | 0 (0.0%) |
| $2,500 to $2,999 | 0 (0.0%) | 0 (0.0%) |
| $3,000 or more | 0 (0.0%) | 0 (0.0%) |
| Total | 113 (100.0%) | 83 (100.0%) |
Physical Housing Characteristics in Star Junction
Housing Structures in Star Junction
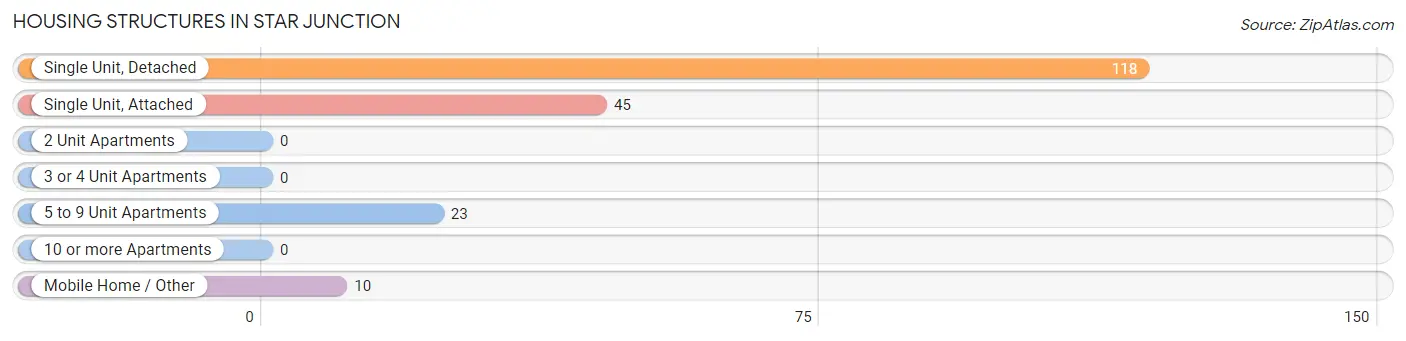
| Structure Type | # Housing Units | % Housing Units |
| Single Unit, Detached | 118 | 60.2% |
| Single Unit, Attached | 45 | 23.0% |
| 2 Unit Apartments | 0 | 0.0% |
| 3 or 4 Unit Apartments | 0 | 0.0% |
| 5 to 9 Unit Apartments | 23 | 11.7% |
| 10 or more Apartments | 0 | 0.0% |
| Mobile Home / Other | 10 | 5.1% |
| Total | 196 | 100.0% |
Housing Structures by Occupancy in Star Junction
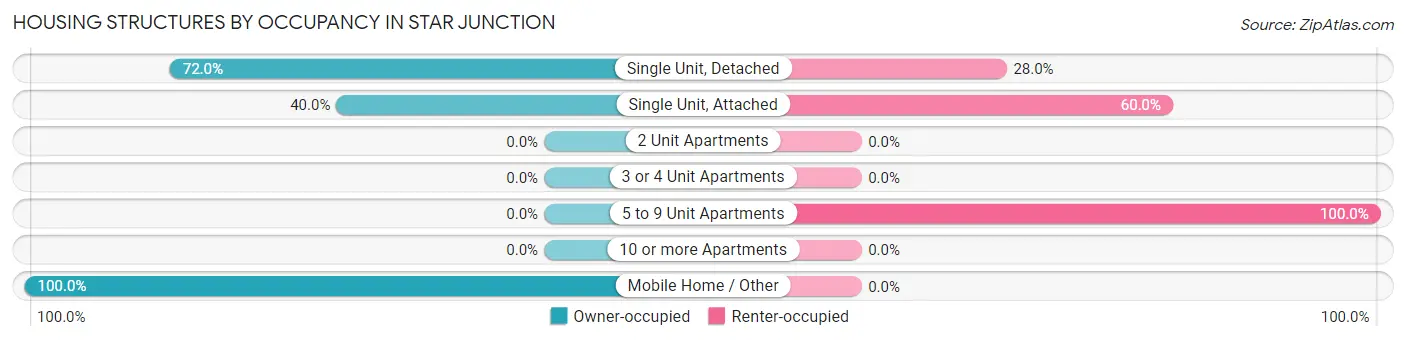
| Structure Type | Owner-occupied | Renter-occupied |
| Single Unit, Detached | 85 (72.0%) | 33 (28.0%) |
| Single Unit, Attached | 18 (40.0%) | 27 (60.0%) |
| 2 Unit Apartments | 0 (0.0%) | 0 (0.0%) |
| 3 or 4 Unit Apartments | 0 (0.0%) | 0 (0.0%) |
| 5 to 9 Unit Apartments | 0 (0.0%) | 23 (100.0%) |
| 10 or more Apartments | 0 (0.0%) | 0 (0.0%) |
| Mobile Home / Other | 10 (100.0%) | 0 (0.0%) |
| Total | 113 (57.7%) | 83 (42.3%) |
Housing Structures by Number of Rooms in Star Junction
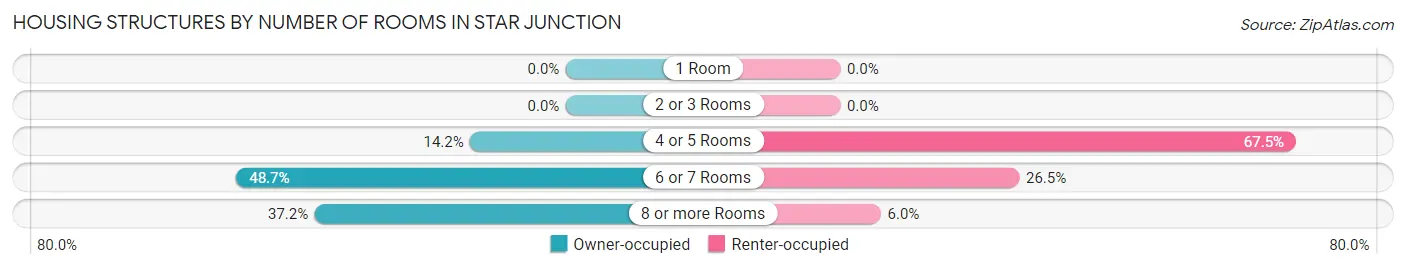
| Number of Rooms | Owner-occupied | Renter-occupied |
| 1 Room | 0 (0.0%) | 0 (0.0%) |
| 2 or 3 Rooms | 0 (0.0%) | 0 (0.0%) |
| 4 or 5 Rooms | 16 (14.2%) | 56 (67.5%) |
| 6 or 7 Rooms | 55 (48.7%) | 22 (26.5%) |
| 8 or more Rooms | 42 (37.2%) | 5 (6.0%) |
| Total | 113 (100.0%) | 83 (100.0%) |
Housing Structure by Heating Type in Star Junction
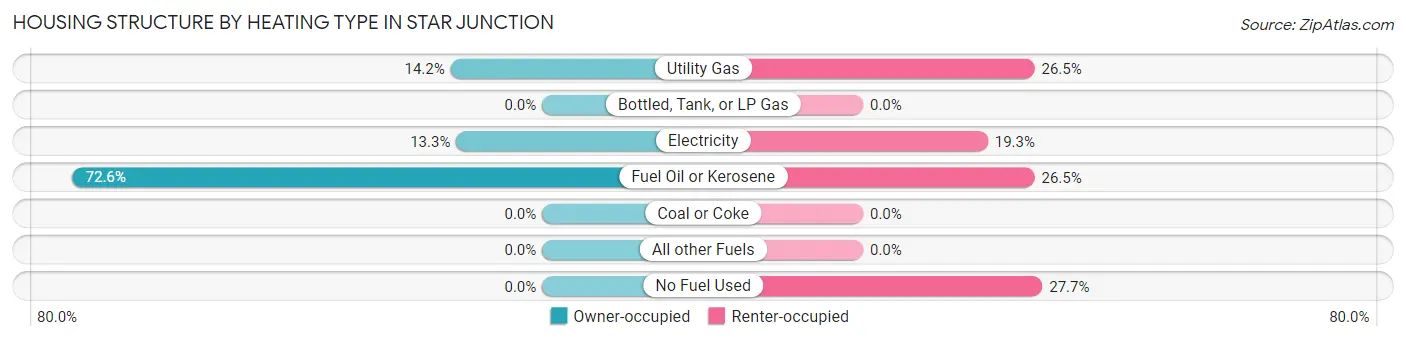
| Heating Type | Owner-occupied | Renter-occupied |
| Utility Gas | 16 (14.2%) | 22 (26.5%) |
| Bottled, Tank, or LP Gas | 0 (0.0%) | 0 (0.0%) |
| Electricity | 15 (13.3%) | 16 (19.3%) |
| Fuel Oil or Kerosene | 82 (72.6%) | 22 (26.5%) |
| Coal or Coke | 0 (0.0%) | 0 (0.0%) |
| All other Fuels | 0 (0.0%) | 0 (0.0%) |
| No Fuel Used | 0 (0.0%) | 23 (27.7%) |
| Total | 113 (100.0%) | 83 (100.0%) |
Household Vehicle Usage in Star Junction
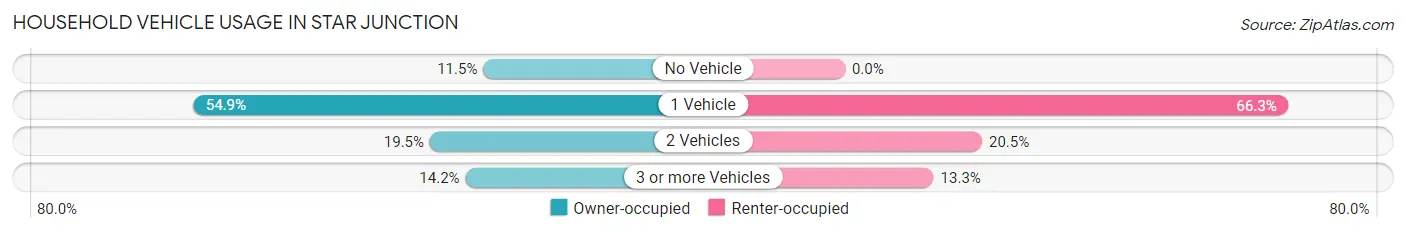
| Vehicles per Household | Owner-occupied | Renter-occupied |
| No Vehicle | 13 (11.5%) | 0 (0.0%) |
| 1 Vehicle | 62 (54.9%) | 55 (66.3%) |
| 2 Vehicles | 22 (19.5%) | 17 (20.5%) |
| 3 or more Vehicles | 16 (14.2%) | 11 (13.3%) |
| Total | 113 (100.0%) | 83 (100.0%) |
Real Estate & Mortgages in Star Junction
Real Estate and Mortgage Overview in Star Junction
| Characteristic | Without Mortgage | With Mortgage |
| Housing Units | 73 | 40 |
| Median Property Value | - | - |
| Median Household Income | $31,250 | $0 |
| Monthly Housing Costs | $615 | $0 |
| Real Estate Taxes | $1,210 | $0 |
Property Value by Mortgage Status in Star Junction
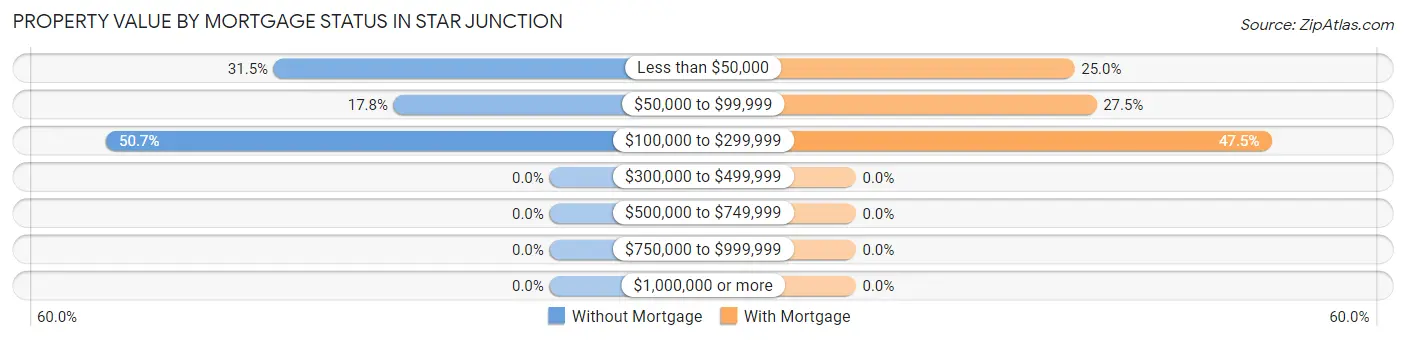
| Property Value | Without Mortgage | With Mortgage |
| Less than $50,000 | 23 (31.5%) | 10 (25.0%) |
| $50,000 to $99,999 | 13 (17.8%) | 11 (27.5%) |
| $100,000 to $299,999 | 37 (50.7%) | 19 (47.5%) |
| $300,000 to $499,999 | 0 (0.0%) | 0 (0.0%) |
| $500,000 to $749,999 | 0 (0.0%) | 0 (0.0%) |
| $750,000 to $999,999 | 0 (0.0%) | 0 (0.0%) |
| $1,000,000 or more | 0 (0.0%) | 0 (0.0%) |
| Total | 73 (100.0%) | 40 (100.0%) |
Household Income by Mortgage Status in Star Junction
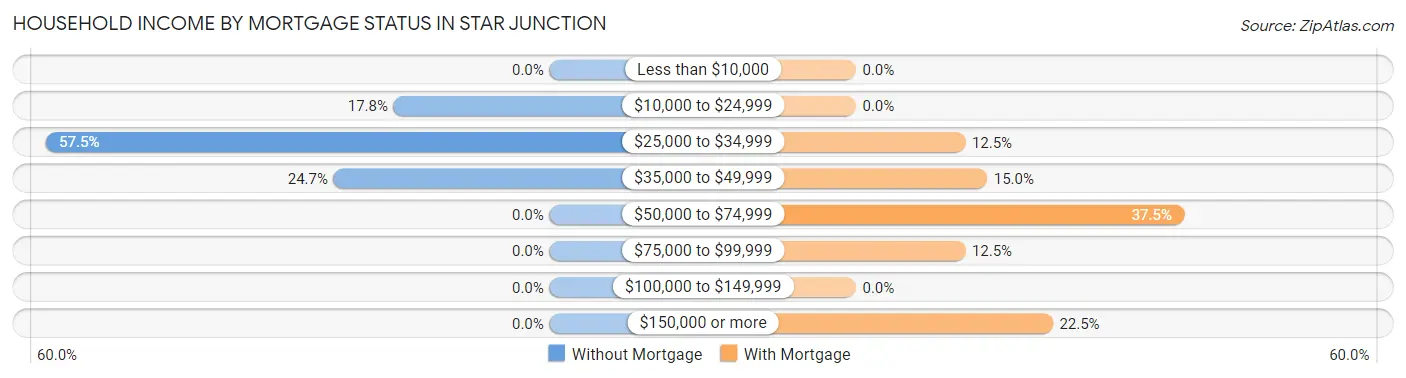
| Household Income | Without Mortgage | With Mortgage |
| Less than $10,000 | 0 (0.0%) | 0 (0.0%) |
| $10,000 to $24,999 | 13 (17.8%) | 0 (0.0%) |
| $25,000 to $34,999 | 42 (57.5%) | 5 (12.5%) |
| $35,000 to $49,999 | 18 (24.7%) | 6 (15.0%) |
| $50,000 to $74,999 | 0 (0.0%) | 15 (37.5%) |
| $75,000 to $99,999 | 0 (0.0%) | 5 (12.5%) |
| $100,000 to $149,999 | 0 (0.0%) | 0 (0.0%) |
| $150,000 or more | 0 (0.0%) | 9 (22.5%) |
| Total | 73 (100.0%) | 40 (100.0%) |
Property Value to Household Income Ratio in Star Junction
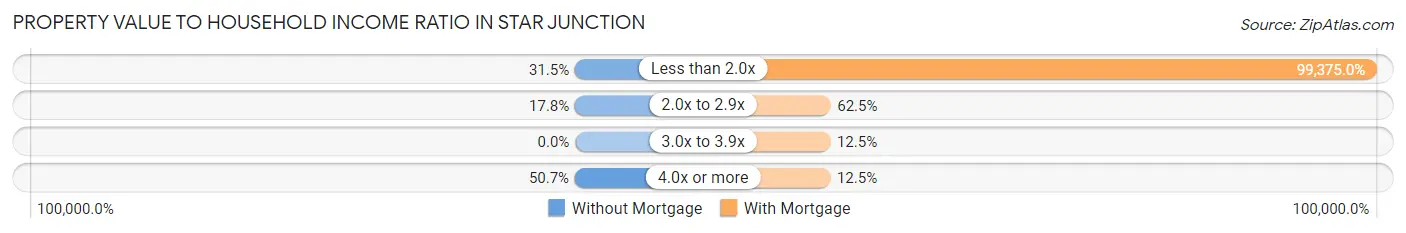
| Value-to-Income Ratio | Without Mortgage | With Mortgage |
| Less than 2.0x | 23 (31.5%) | 39,750 (99,375.0%) |
| 2.0x to 2.9x | 13 (17.8%) | 25 (62.5%) |
| 3.0x to 3.9x | 0 (0.0%) | 5 (12.5%) |
| 4.0x or more | 37 (50.7%) | 5 (12.5%) |
| Total | 73 (100.0%) | 40 (100.0%) |
Real Estate Taxes by Mortgage Status in Star Junction
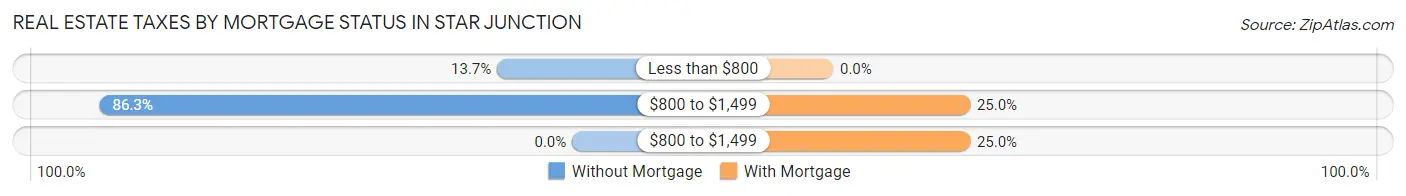
| Property Taxes | Without Mortgage | With Mortgage |
| Less than $800 | 10 (13.7%) | 0 (0.0%) |
| $800 to $1,499 | 63 (86.3%) | 10 (25.0%) |
| $800 to $1,499 | 0 (0.0%) | 10 (25.0%) |
| Total | 73 (100.0%) | 40 (100.0%) |
Health & Disability in Star Junction
Health Insurance Coverage by Age in Star Junction
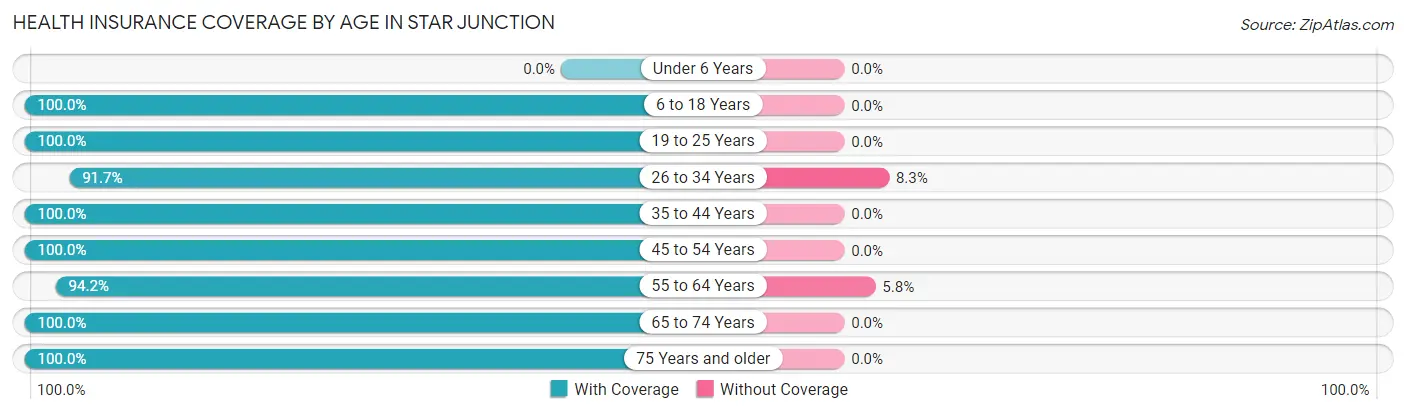
| Age Bracket | With Coverage | Without Coverage |
| Under 6 Years | 0 (0.0%) | 0 (0.0%) |
| 6 to 18 Years | 29 (100.0%) | 0 (0.0%) |
| 19 to 25 Years | 29 (100.0%) | 0 (0.0%) |
| 26 to 34 Years | 44 (91.7%) | 4 (8.3%) |
| 35 to 44 Years | 21 (100.0%) | 0 (0.0%) |
| 45 to 54 Years | 17 (100.0%) | 0 (0.0%) |
| 55 to 64 Years | 65 (94.2%) | 4 (5.8%) |
| 65 to 74 Years | 44 (100.0%) | 0 (0.0%) |
| 75 Years and older | 54 (100.0%) | 0 (0.0%) |
| Total | 303 (97.4%) | 8 (2.6%) |
Health Insurance Coverage by Citizenship Status in Star Junction

| Citizenship Status | With Coverage | Without Coverage |
| Native Born | 0 (0.0%) | 0 (0.0%) |
| Foreign Born, Citizen | 29 (100.0%) | 0 (0.0%) |
| Foreign Born, not a Citizen | 29 (100.0%) | 0 (0.0%) |
Health Insurance Coverage by Household Income in Star Junction
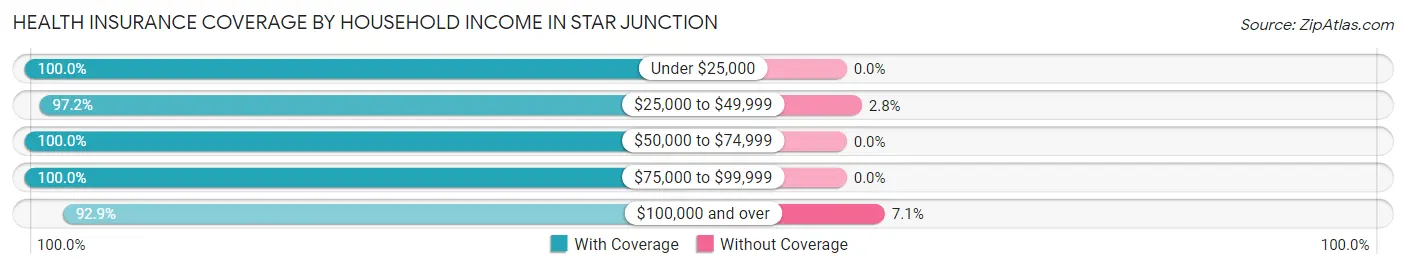
| Household Income | With Coverage | Without Coverage |
| Under $25,000 | 18 (100.0%) | 0 (0.0%) |
| $25,000 to $49,999 | 138 (97.2%) | 4 (2.8%) |
| $50,000 to $74,999 | 47 (100.0%) | 0 (0.0%) |
| $75,000 to $99,999 | 48 (100.0%) | 0 (0.0%) |
| $100,000 and over | 52 (92.9%) | 4 (7.1%) |
Public vs Private Health Insurance Coverage by Age in Star Junction
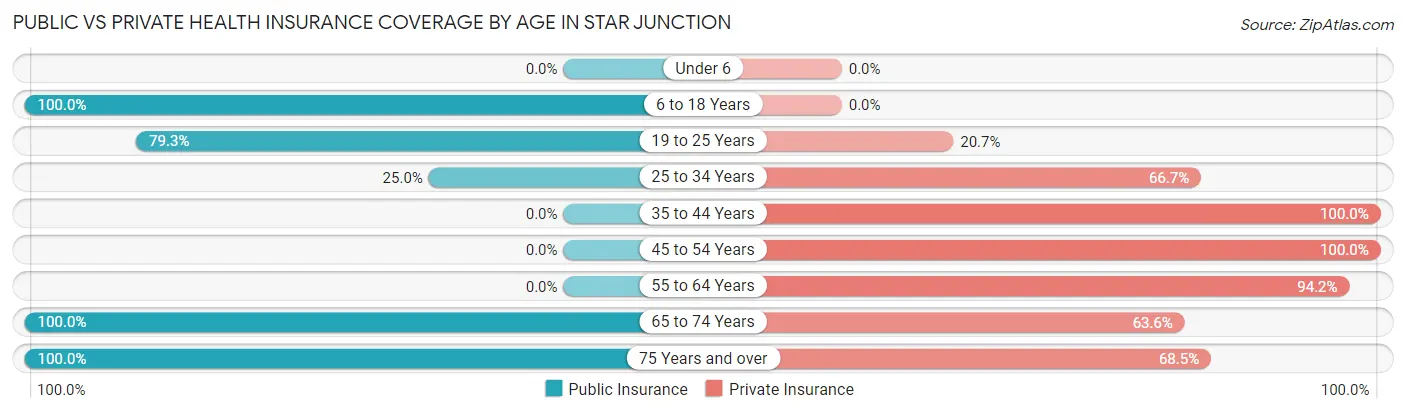
| Age Bracket | Public Insurance | Private Insurance |
| Under 6 | 0 (0.0%) | 0 (0.0%) |
| 6 to 18 Years | 29 (100.0%) | 0 (0.0%) |
| 19 to 25 Years | 23 (79.3%) | 6 (20.7%) |
| 25 to 34 Years | 12 (25.0%) | 32 (66.7%) |
| 35 to 44 Years | 0 (0.0%) | 21 (100.0%) |
| 45 to 54 Years | 0 (0.0%) | 17 (100.0%) |
| 55 to 64 Years | 0 (0.0%) | 65 (94.2%) |
| 65 to 74 Years | 44 (100.0%) | 28 (63.6%) |
| 75 Years and over | 54 (100.0%) | 37 (68.5%) |
| Total | 162 (52.1%) | 206 (66.2%) |
Disability Status by Sex by Age in Star Junction
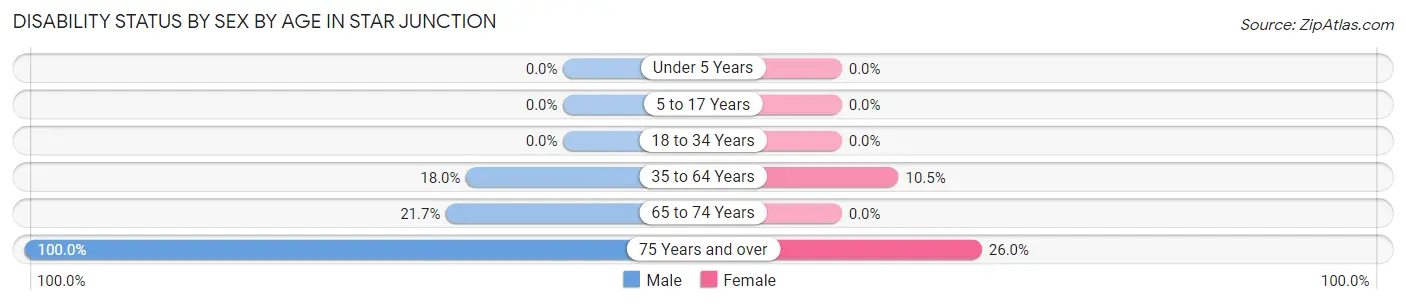
| Age Bracket | Male | Female |
| Under 5 Years | 0 (0.0%) | 0 (0.0%) |
| 5 to 17 Years | 0 (0.0%) | 0 (0.0%) |
| 18 to 34 Years | 0 (0.0%) | 0 (0.0%) |
| 35 to 64 Years | 9 (18.0%) | 6 (10.5%) |
| 65 to 74 Years | 5 (21.7%) | 0 (0.0%) |
| 75 Years and over | 4 (100.0%) | 13 (26.0%) |
Disability Class by Sex by Age in Star Junction
Disability Class: Hearing Difficulty
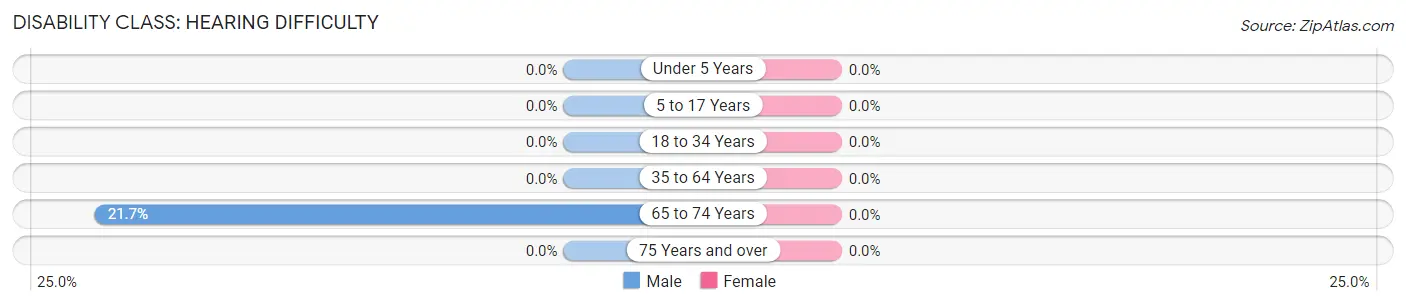
| Age Bracket | Male | Female |
| Under 5 Years | 0 (0.0%) | 0 (0.0%) |
| 5 to 17 Years | 0 (0.0%) | 0 (0.0%) |
| 18 to 34 Years | 0 (0.0%) | 0 (0.0%) |
| 35 to 64 Years | 0 (0.0%) | 0 (0.0%) |
| 65 to 74 Years | 5 (21.7%) | 0 (0.0%) |
| 75 Years and over | 0 (0.0%) | 0 (0.0%) |
Disability Class: Vision Difficulty
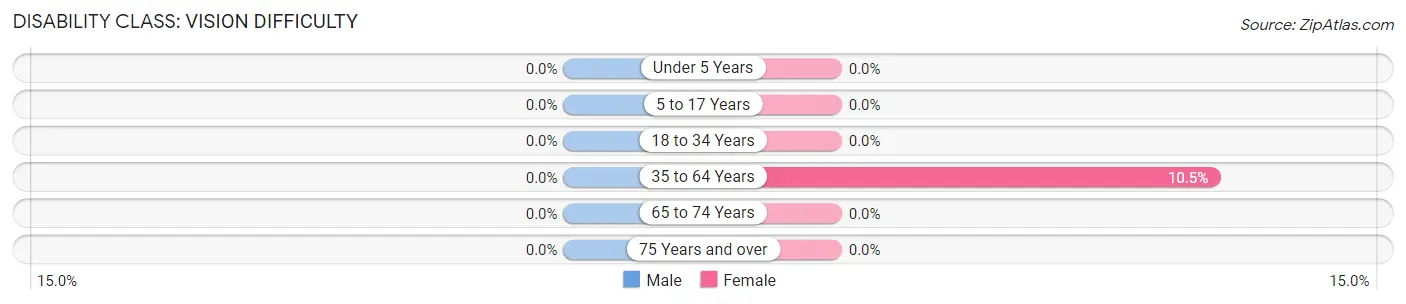
| Age Bracket | Male | Female |
| Under 5 Years | 0 (0.0%) | 0 (0.0%) |
| 5 to 17 Years | 0 (0.0%) | 0 (0.0%) |
| 18 to 34 Years | 0 (0.0%) | 0 (0.0%) |
| 35 to 64 Years | 0 (0.0%) | 6 (10.5%) |
| 65 to 74 Years | 0 (0.0%) | 0 (0.0%) |
| 75 Years and over | 0 (0.0%) | 0 (0.0%) |
Disability Class: Cognitive Difficulty
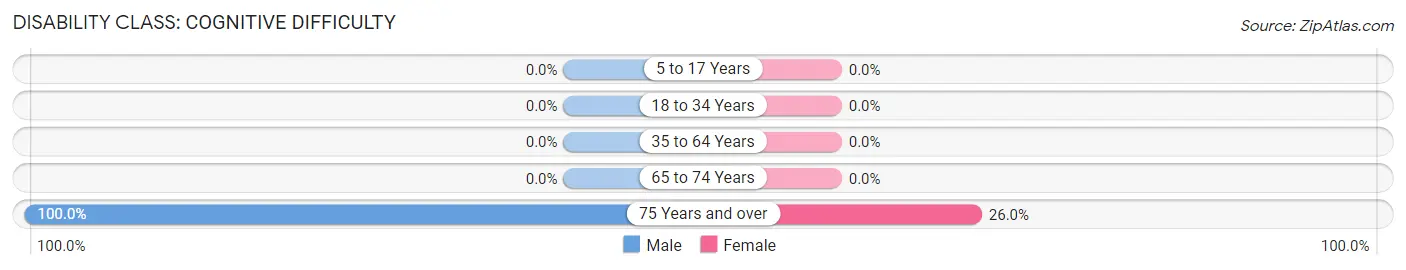
| Age Bracket | Male | Female |
| 5 to 17 Years | 0 (0.0%) | 0 (0.0%) |
| 18 to 34 Years | 0 (0.0%) | 0 (0.0%) |
| 35 to 64 Years | 0 (0.0%) | 0 (0.0%) |
| 65 to 74 Years | 0 (0.0%) | 0 (0.0%) |
| 75 Years and over | 4 (100.0%) | 13 (26.0%) |
Disability Class: Ambulatory Difficulty
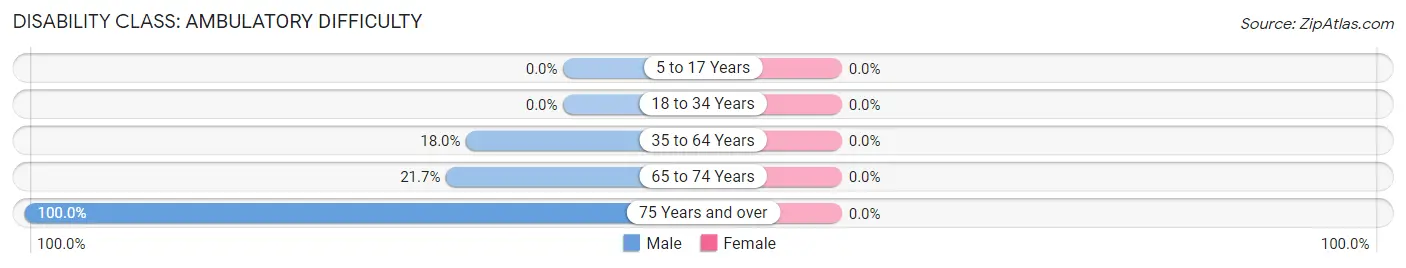
| Age Bracket | Male | Female |
| 5 to 17 Years | 0 (0.0%) | 0 (0.0%) |
| 18 to 34 Years | 0 (0.0%) | 0 (0.0%) |
| 35 to 64 Years | 9 (18.0%) | 0 (0.0%) |
| 65 to 74 Years | 5 (21.7%) | 0 (0.0%) |
| 75 Years and over | 4 (100.0%) | 0 (0.0%) |
Disability Class: Self-Care Difficulty
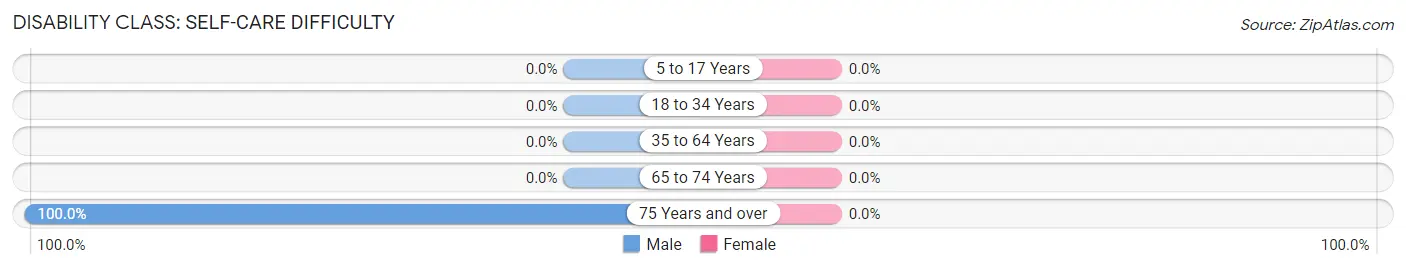
| Age Bracket | Male | Female |
| 5 to 17 Years | 0 (0.0%) | 0 (0.0%) |
| 18 to 34 Years | 0 (0.0%) | 0 (0.0%) |
| 35 to 64 Years | 0 (0.0%) | 0 (0.0%) |
| 65 to 74 Years | 0 (0.0%) | 0 (0.0%) |
| 75 Years and over | 4 (100.0%) | 0 (0.0%) |
Technology Access in Star Junction
Computing Device Access in Star Junction
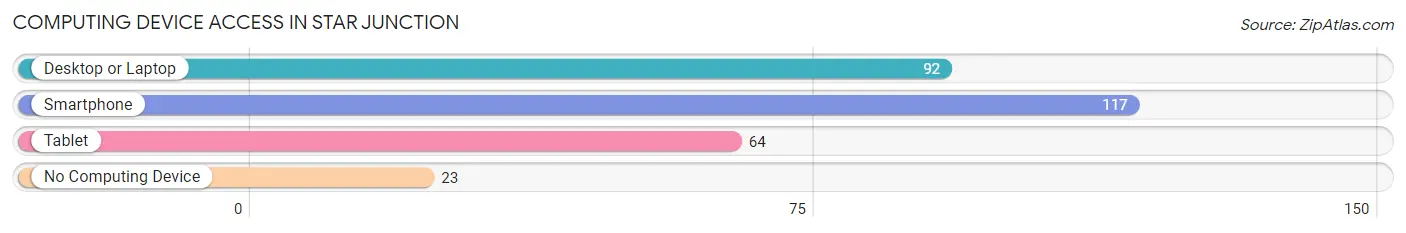
| Device Type | # Households | % Households |
| Desktop or Laptop | 92 | 46.9% |
| Smartphone | 117 | 59.7% |
| Tablet | 64 | 32.7% |
| No Computing Device | 23 | 11.7% |
| Total | 196 | 100.0% |
Internet Access in Star Junction
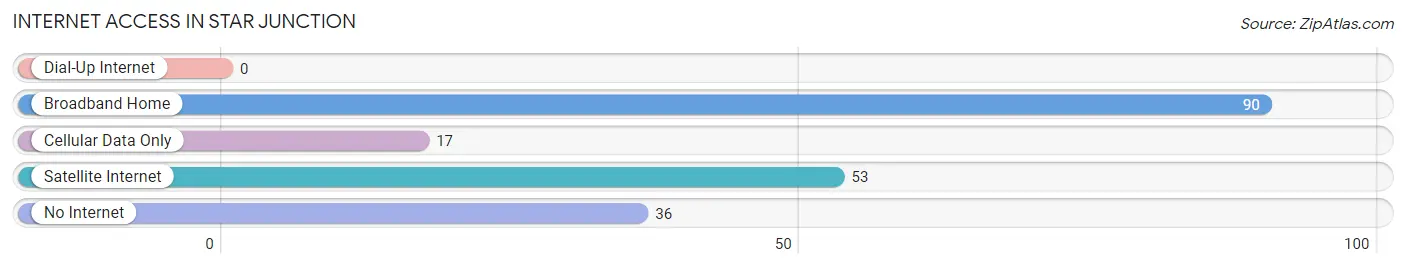
| Internet Type | # Households | % Households |
| Dial-Up Internet | 0 | 0.0% |
| Broadband Home | 90 | 45.9% |
| Cellular Data Only | 17 | 8.7% |
| Satellite Internet | 53 | 27.0% |
| No Internet | 36 | 18.4% |
| Total | 196 | 100.0% |
Star Junction Summary
Star Junction, Pennsylvania is a small borough located in Fayette County, Pennsylvania. It is situated in the southwestern corner of the state, approximately 40 miles south of Pittsburgh. The population of Star Junction was 1,845 as of the 2010 census.
Geography
Star Junction is located at the intersection of U.S. Route 119 and Pennsylvania Route 51. It is situated in the southwestern corner of Fayette County, approximately 40 miles south of Pittsburgh. The borough is surrounded by the townships of Franklin, German, Jefferson, and Redstone. The terrain of the area is mostly hilly, with some flat areas in the valleys. The climate is humid continental, with cold winters and hot summers.
History
Star Junction was founded in 1845 by a group of settlers from the nearby town of Uniontown. The town was named after the intersection of two major roads, which formed a star-shaped junction. The town grew quickly, and by the late 19th century it had become a bustling center of commerce and industry. The town was home to several coal mines, a steel mill, and a variety of other businesses.
In the early 20th century, Star Junction experienced a period of decline. The coal mines and steel mill closed, and the town's population began to decline. In the late 20th century, the town experienced a resurgence, as new businesses moved into the area and the population began to grow again.
Economy
Star Junction's economy is largely based on the service industry. The town is home to several restaurants, bars, and other businesses that cater to the local population. There are also several small manufacturing businesses in the area, as well as a few retail stores. The town is also home to a branch of the Fayette County Bank.
Demographics
As of the 2010 census, the population of Star Junction was 1,845. The racial makeup of the town was 97.3% White, 0.9% African American, 0.2% Native American, 0.3% Asian, and 1.3% from other races. The median household income was $37,917, and the median family income was $45,938. The per capita income was $19,945.
Conclusion
Star Junction, Pennsylvania is a small borough located in Fayette County, Pennsylvania. It is situated in the southwestern corner of the state, approximately 40 miles south of Pittsburgh. The population of Star Junction was 1,845 as of the 2010 census. The town's economy is largely based on the service industry, and the median household income was $37,917. The racial makeup of the town was 97.3% White, 0.9% African American, 0.2% Native American, 0.3% Asian, and 1.3% from other races. Star Junction is a small town with a rich history and a bright future.
Common Questions
What is Per Capita Income in Star Junction?
Per Capita income in Star Junction is $34,915.
What is the Median Family Income in Star Junction?
Median Family Income in Star Junction is $51,705.
What is the Median Household income in Star Junction?
Median Household Income in Star Junction is $38,478.
What is Inequality or Gini Index in Star Junction?
Inequality or Gini Index in Star Junction is 0.36.
What is the Total Population of Star Junction?
Total Population of Star Junction is 311.
What is the Total Male Population of Star Junction?
Total Male Population of Star Junction is 123.
What is the Total Female Population of Star Junction?
Total Female Population of Star Junction is 188.
What is the Ratio of Males per 100 Females in Star Junction?
There are 65.43 Males per 100 Females in Star Junction.
What is the Ratio of Females per 100 Males in Star Junction?
There are 152.85 Females per 100 Males in Star Junction.
What is the Median Population Age in Star Junction?
Median Population Age in Star Junction is 56.7 Years.
What is the Average Family Size in Star Junction
Average Family Size in Star Junction is 2.8 People.
What is the Average Household Size in Star Junction
Average Household Size in Star Junction is 1.6 People.
How Large is the Labor Force in Star Junction?
There are 174 People in the Labor Forcein in Star Junction.
What is the Percentage of People in the Labor Force in Star Junction?
61.7% of People are in the Labor Force in Star Junction.
What is the Unemployment Rate in Star Junction?
Unemployment Rate in Star Junction is 3.4%.