Spry, PA Map & Demographics
Spry Map
Spry Overview
$39,080
PER CAPITA INCOME
$100,236
AVG FAMILY INCOME
$94,219
AVG HOUSEHOLD INCOME
42.7%
WAGE / INCOME GAP [ % ]
57.3¢/ $1
WAGE / INCOME GAP [ $ ]
0.35
INEQUALITY / GINI INDEX
4,760
TOTAL POPULATION
2,141
MALE POPULATION
2,619
FEMALE POPULATION
81.75
MALES / 100 FEMALES
122.33
FEMALES / 100 MALES
43.9
MEDIAN AGE
2.7
AVG FAMILY SIZE
2.4
AVG HOUSEHOLD SIZE
2,774
LABOR FORCE [ PEOPLE ]
69.1%
PERCENT IN LABOR FORCE
4.5%
UNEMPLOYMENT RATE
Income in Spry
Income Overview in Spry
Per Capita Income in Spry is $39,080, while median incomes of families and households are $100,236 and $94,219 respectively.
| Characteristic | Number | Measure |
| Per Capita Income | 4,760 | $39,080 |
| Median Family Income | 1,436 | $100,236 |
| Mean Family Income | 1,436 | $100,980 |
| Median Household Income | 2,008 | $94,219 |
| Mean Household Income | 2,008 | $93,867 |
| Income Deficit | 1,436 | $0 |
| Wage / Income Gap (%) | 4,760 | 42.73% |
| Wage / Income Gap ($) | 4,760 | 57.27¢ per $1 |
| Gini / Inequality Index | 4,760 | 0.35 |
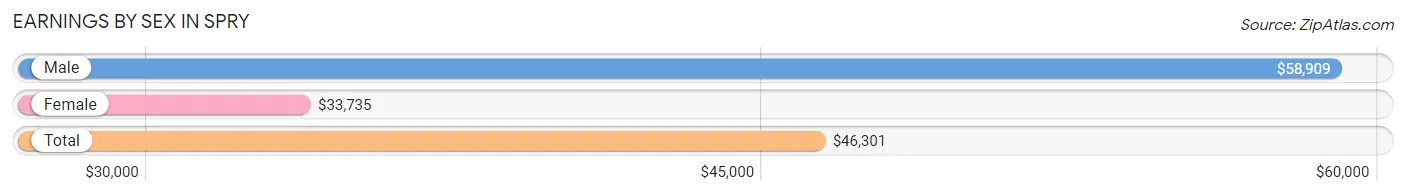
Earnings by Sex in Spry
Average Earnings in Spry are $46,301, $58,909 for men and $33,735 for women, a difference of 42.7%.
| Sex | Number | Average Earnings |
| Male | 1,455 (48.0%) | $58,909 |
| Female | 1,575 (52.0%) | $33,735 |
| Total | 3,030 (100.0%) | $46,301 |
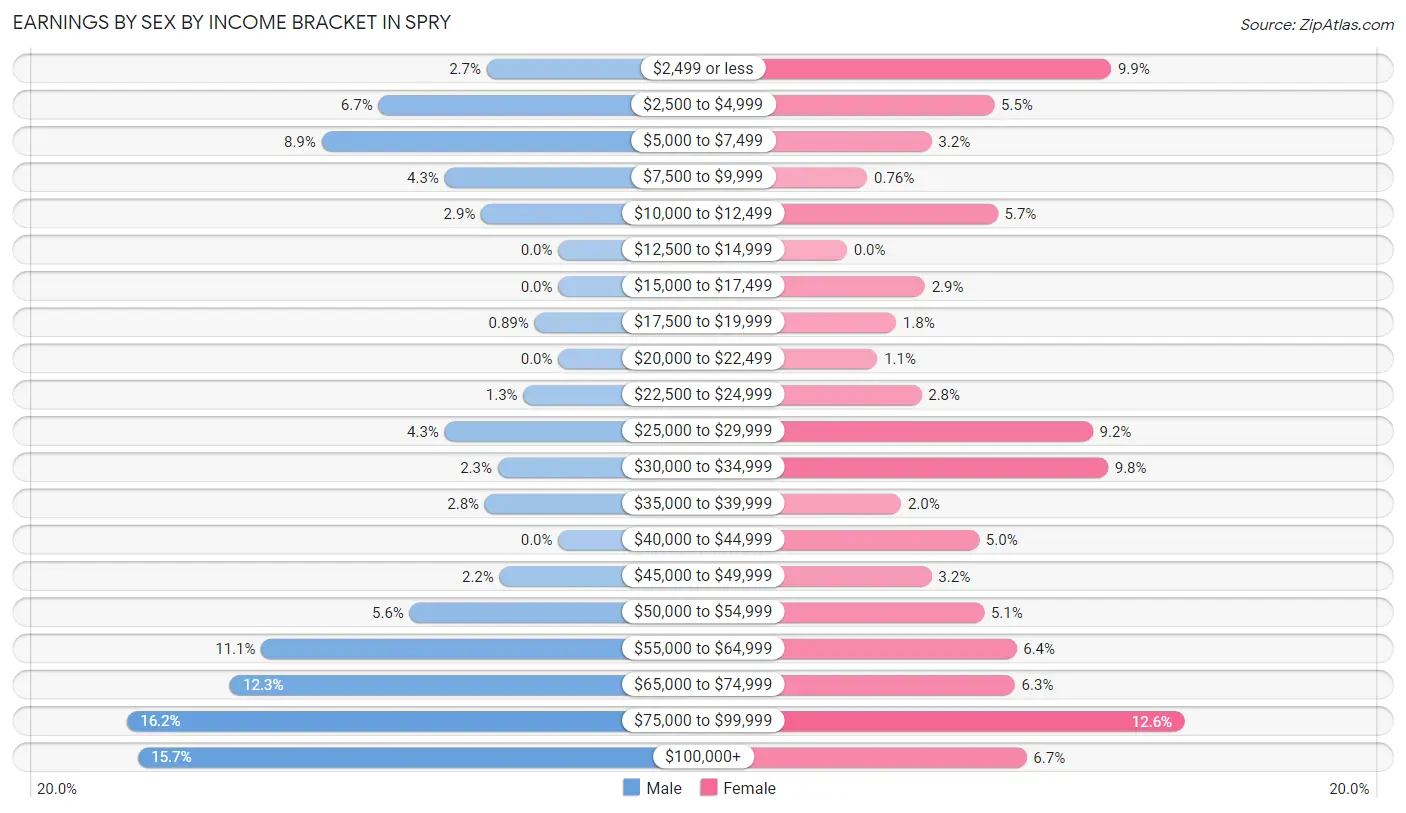
Earnings by Sex by Income Bracket in Spry
The most common earnings brackets in Spry are $75,000 to $99,999 for men (235 | 16.2%) and $75,000 to $99,999 for women (199 | 12.6%).
| Income | Male | Female |
| $2,499 or less | 39 (2.7%) | 156 (9.9%) |
| $2,500 to $4,999 | 98 (6.7%) | 87 (5.5%) |
| $5,000 to $7,499 | 129 (8.9%) | 50 (3.2%) |
| $7,500 to $9,999 | 62 (4.3%) | 12 (0.8%) |
| $10,000 to $12,499 | 42 (2.9%) | 89 (5.7%) |
| $12,500 to $14,999 | 0 (0.0%) | 0 (0.0%) |
| $15,000 to $17,499 | 0 (0.0%) | 46 (2.9%) |
| $17,500 to $19,999 | 13 (0.9%) | 29 (1.8%) |
| $20,000 to $22,499 | 0 (0.0%) | 18 (1.1%) |
| $22,500 to $24,999 | 19 (1.3%) | 44 (2.8%) |
| $25,000 to $29,999 | 62 (4.3%) | 145 (9.2%) |
| $30,000 to $34,999 | 33 (2.3%) | 154 (9.8%) |
| $35,000 to $39,999 | 40 (2.8%) | 32 (2.0%) |
| $40,000 to $44,999 | 0 (0.0%) | 78 (5.0%) |
| $45,000 to $49,999 | 32 (2.2%) | 50 (3.2%) |
| $50,000 to $54,999 | 81 (5.6%) | 81 (5.1%) |
| $55,000 to $64,999 | 162 (11.1%) | 100 (6.4%) |
| $65,000 to $74,999 | 179 (12.3%) | 99 (6.3%) |
| $75,000 to $99,999 | 235 (16.2%) | 199 (12.6%) |
| $100,000+ | 229 (15.7%) | 106 (6.7%) |
| Total | 1,455 (100.0%) | 1,575 (100.0%) |
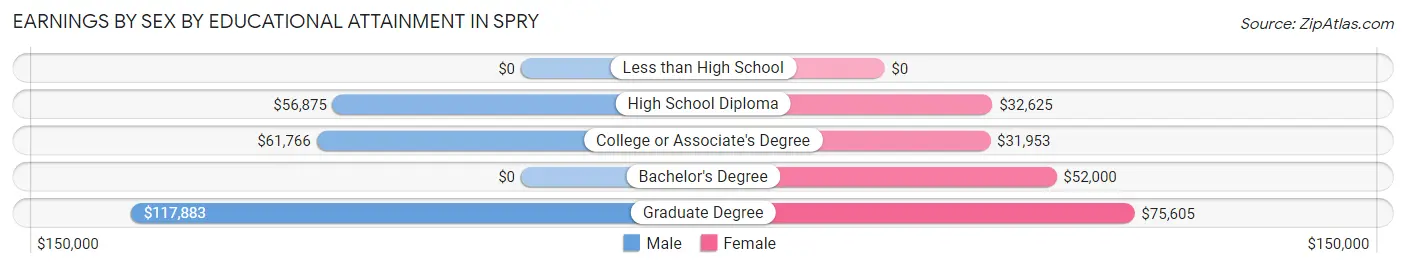
Earnings by Sex by Educational Attainment in Spry
Average earnings in Spry are $61,875 for men and $41,977 for women, a difference of 32.2%. Men with an educational attainment of graduate degree enjoy the highest average annual earnings of $117,883, while those with high school diploma education earn the least with $56,875. Women with an educational attainment of graduate degree earn the most with the average annual earnings of $75,605, while those with college or associate's degree education have the smallest earnings of $31,953.
| Educational Attainment | Male Income | Female Income |
| Less than High School | - | - |
| High School Diploma | $56,875 | $32,625 |
| College or Associate's Degree | $61,766 | $31,953 |
| Bachelor's Degree | - | - |
| Graduate Degree | $117,883 | $75,605 |
| Total | $61,875 | $41,977 |
Family Income in Spry
Family Income Brackets in Spry
According to the Spry family income data, there are 452 families falling into the $100,000 to $149,999 income range, which is the most common income bracket and makes up 31.5% of all families.
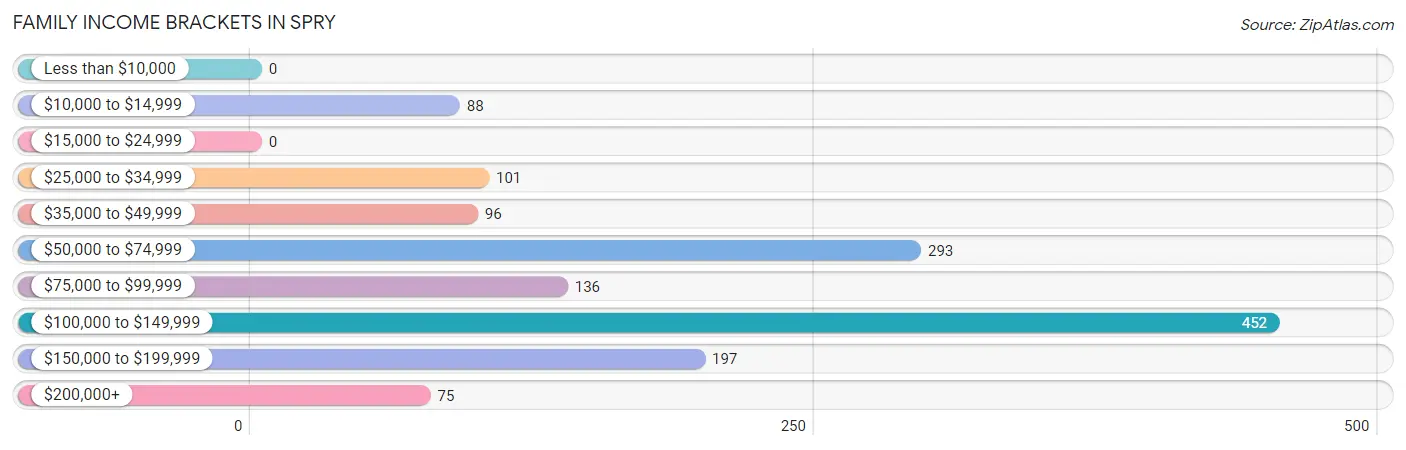
| Income Bracket | # Families | % Families |
| Less than $10,000 | 0 | 0.0% |
| $10,000 to $14,999 | 88 | 6.1% |
| $15,000 to $24,999 | 0 | 0.0% |
| $25,000 to $34,999 | 101 | 7.0% |
| $35,000 to $49,999 | 96 | 6.7% |
| $50,000 to $74,999 | 293 | 20.4% |
| $75,000 to $99,999 | 136 | 9.5% |
| $100,000 to $149,999 | 452 | 31.5% |
| $150,000 to $199,999 | 197 | 13.7% |
| $200,000+ | 75 | 5.2% |
Family Income by Famaliy Size in Spry
5-person families (50 | 3.5%) account for the highest median family income in Spry with $190,179 per family, while 5-person families (50 | 3.5%) have the highest median income of $38,036 per family member.
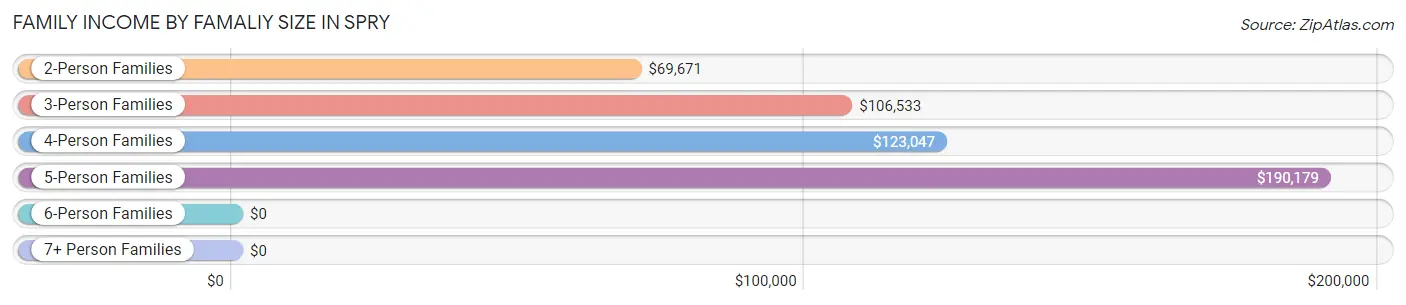
| Income Bracket | # Families | Median Income |
| 2-Person Families | 775 (54.0%) | $69,671 |
| 3-Person Families | 474 (33.0%) | $106,533 |
| 4-Person Families | 137 (9.5%) | $123,047 |
| 5-Person Families | 50 (3.5%) | $190,179 |
| 6-Person Families | 0 (0.0%) | $0 |
| 7+ Person Families | 0 (0.0%) | $0 |
| Total | 1,436 (100.0%) | $100,236 |
Family Income by Number of Earners in Spry
The median family income in Spry is $100,236, with families comprising 3+ earners (140) having the highest median family income of $156,250, while families with no earners (98) have the lowest median family income of $51,667, accounting for 9.8% and 6.8% of families, respectively.
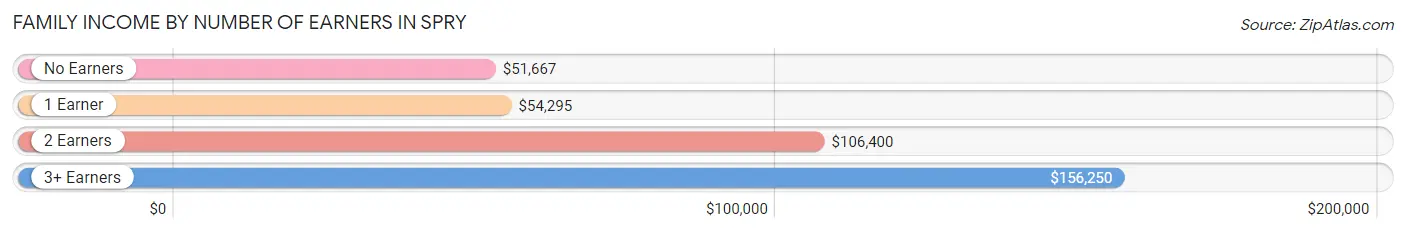
| Number of Earners | # Families | Median Income |
| No Earners | 98 (6.8%) | $51,667 |
| 1 Earner | 474 (33.0%) | $54,295 |
| 2 Earners | 724 (50.4%) | $106,400 |
| 3+ Earners | 140 (9.8%) | $156,250 |
| Total | 1,436 (100.0%) | $100,236 |
Household Income in Spry
Household Income Brackets in Spry
With 580 households falling in the category, the $100,000 to $149,999 income range is the most frequent in Spry, accounting for 28.9% of all households.
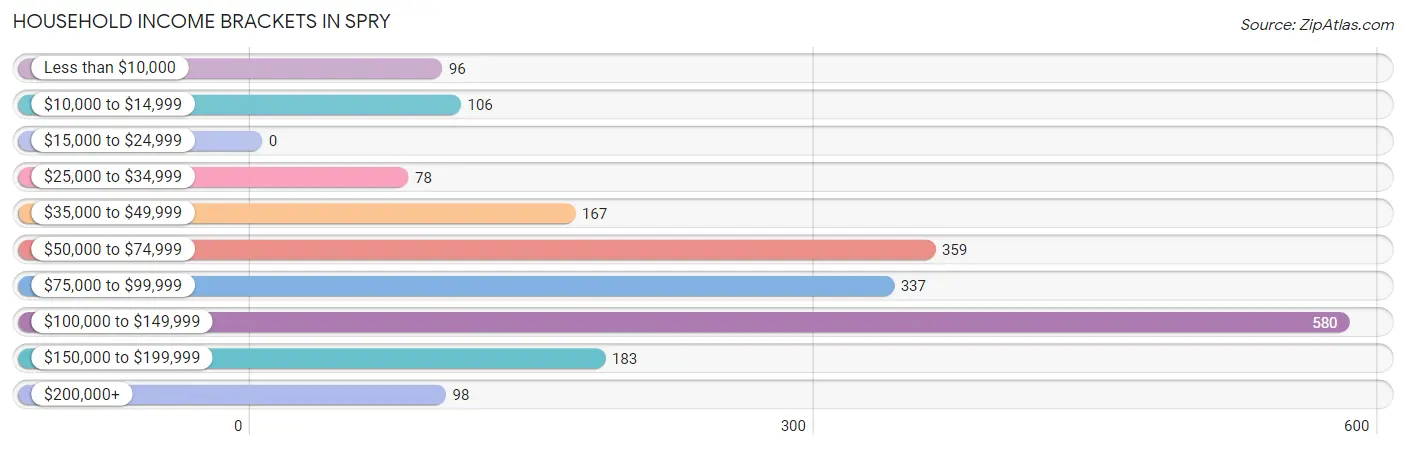
| Income Bracket | # Households | % Households |
| Less than $10,000 | 96 | 4.8% |
| $10,000 to $14,999 | 106 | 5.3% |
| $15,000 to $24,999 | 0 | 0.0% |
| $25,000 to $34,999 | 78 | 3.9% |
| $35,000 to $49,999 | 167 | 8.3% |
| $50,000 to $74,999 | 359 | 17.9% |
| $75,000 to $99,999 | 337 | 16.8% |
| $100,000 to $149,999 | 580 | 28.9% |
| $150,000 to $199,999 | 183 | 9.1% |
| $200,000+ | 98 | 4.9% |
Household Income by Householder Age in Spry
The median household income in Spry is $94,219, with the highest median household income of $107,250 found in the 45 to 64 years age bracket for the primary householder. A total of 785 households (39.1%) fall into this category. Meanwhile, the 15 to 24 years age bracket for the primary householder has the lowest median household income of $0, with 43 households (2.1%) in this group.
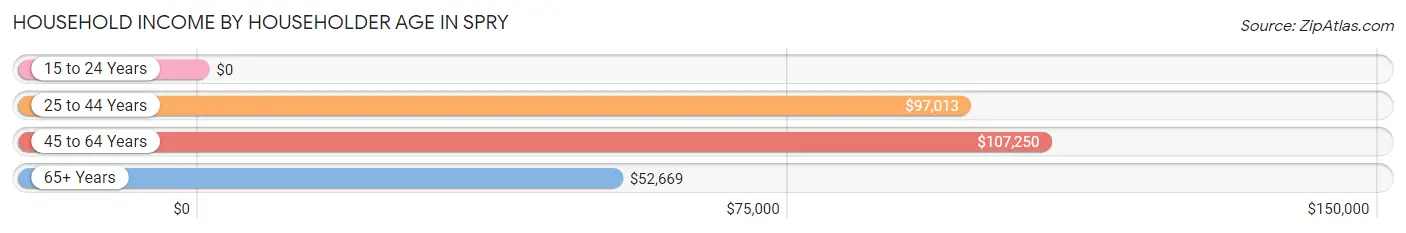
| Income Bracket | # Households | Median Income |
| 15 to 24 Years | 43 (2.1%) | $0 |
| 25 to 44 Years | 606 (30.2%) | $97,013 |
| 45 to 64 Years | 785 (39.1%) | $107,250 |
| 65+ Years | 574 (28.6%) | $52,669 |
| Total | 2,008 (100.0%) | $94,219 |
Poverty in Spry
Income Below Poverty by Sex and Age in Spry
With 7.0% poverty level for males and 8.9% for females among the residents of Spry, 55 to 64 year old males and 65 to 74 year old females are the most vulnerable to poverty, with 111 males (28.2%) and 61 females (20.3%) in their respective age groups living below the poverty level.
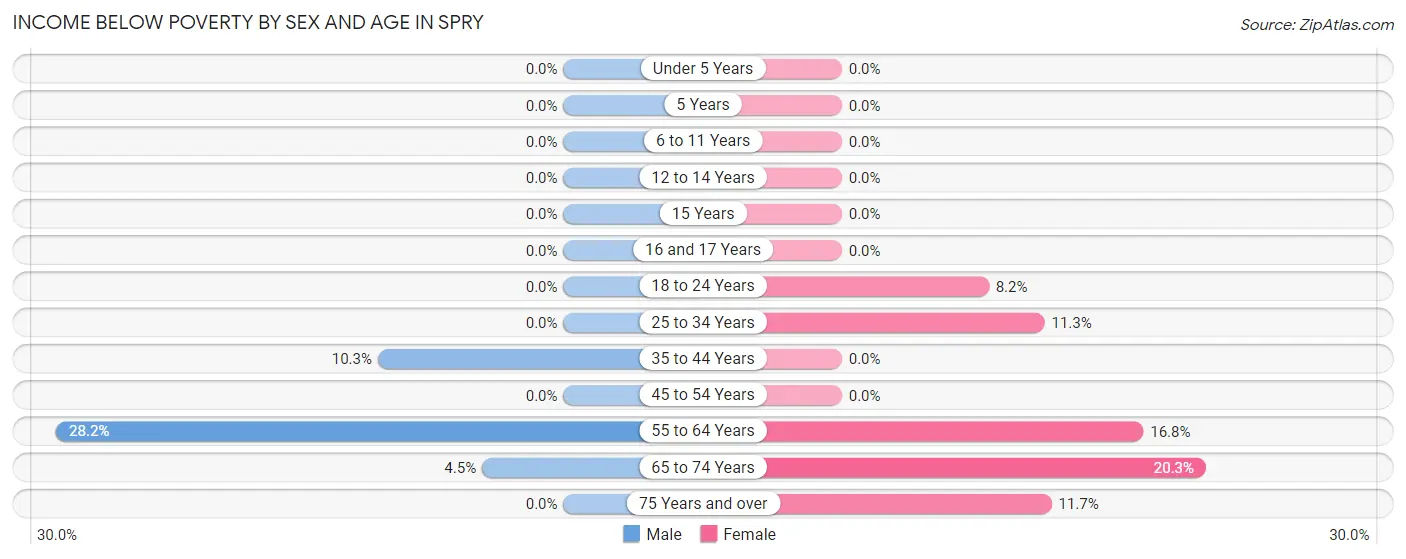
| Age Bracket | Male | Female |
| Under 5 Years | 0 (0.0%) | 0 (0.0%) |
| 5 Years | 0 (0.0%) | 0 (0.0%) |
| 6 to 11 Years | 0 (0.0%) | 0 (0.0%) |
| 12 to 14 Years | 0 (0.0%) | 0 (0.0%) |
| 15 Years | 0 (0.0%) | 0 (0.0%) |
| 16 and 17 Years | 0 (0.0%) | 0 (0.0%) |
| 18 to 24 Years | 0 (0.0%) | 18 (8.2%) |
| 25 to 34 Years | 0 (0.0%) | 41 (11.3%) |
| 35 to 44 Years | 25 (10.3%) | 0 (0.0%) |
| 45 to 54 Years | 0 (0.0%) | 0 (0.0%) |
| 55 to 64 Years | 111 (28.2%) | 90 (16.8%) |
| 65 to 74 Years | 13 (4.5%) | 61 (20.3%) |
| 75 Years and over | 0 (0.0%) | 23 (11.7%) |
| Total | 149 (7.0%) | 233 (8.9%) |
Income Above Poverty by Sex and Age in Spry
According to the poverty statistics in Spry, males aged under 5 years and females aged under 5 years are the age groups that are most secure financially, with 100.0% of males and 100.0% of females in these age groups living above the poverty line.
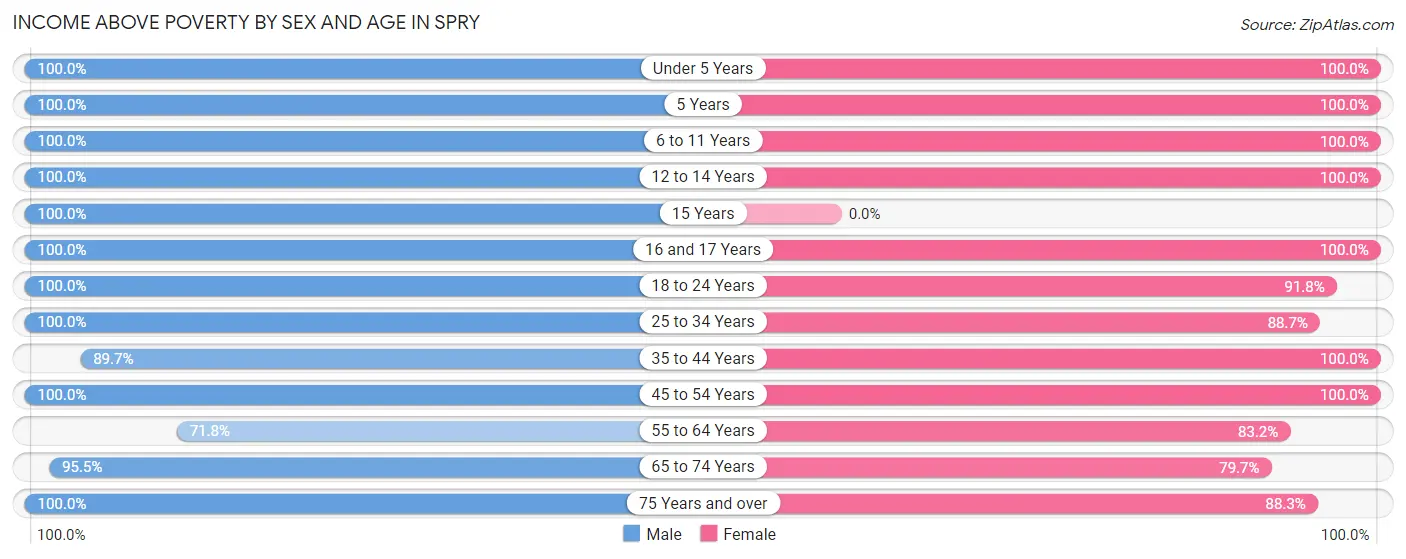
| Age Bracket | Male | Female |
| Under 5 Years | 56 (100.0%) | 85 (100.0%) |
| 5 Years | 127 (100.0%) | 37 (100.0%) |
| 6 to 11 Years | 78 (100.0%) | 196 (100.0%) |
| 12 to 14 Years | 60 (100.0%) | 88 (100.0%) |
| 15 Years | 11 (100.0%) | 0 (0.0%) |
| 16 and 17 Years | 21 (100.0%) | 54 (100.0%) |
| 18 to 24 Years | 162 (100.0%) | 202 (91.8%) |
| 25 to 34 Years | 342 (100.0%) | 322 (88.7%) |
| 35 to 44 Years | 217 (89.7%) | 273 (100.0%) |
| 45 to 54 Years | 247 (100.0%) | 261 (100.0%) |
| 55 to 64 Years | 282 (71.8%) | 446 (83.2%) |
| 65 to 74 Years | 274 (95.5%) | 240 (79.7%) |
| 75 Years and over | 115 (100.0%) | 174 (88.3%) |
| Total | 1,992 (93.0%) | 2,378 (91.1%) |
Income Below Poverty Among Married-Couple Families in Spry
The poverty statistics for married-couple families in Spry show that 7.6% or 87 of the total 1,139 families live below the poverty line. Families with no children have the highest poverty rate of 9.8%, comprising of 87 families. On the other hand, families with 1 or 2 children have the lowest poverty rate of 0.0%, which includes 0 families.
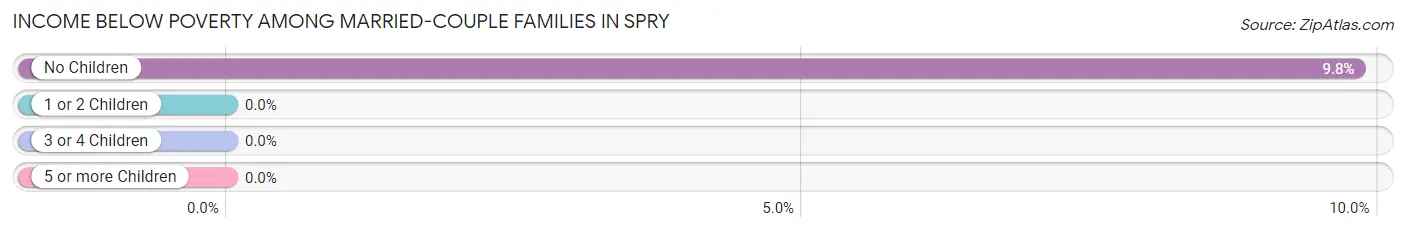
| Children | Above Poverty | Below Poverty |
| No Children | 799 (90.2%) | 87 (9.8%) |
| 1 or 2 Children | 232 (100.0%) | 0 (0.0%) |
| 3 or 4 Children | 21 (100.0%) | 0 (0.0%) |
| 5 or more Children | 0 (0.0%) | 0 (0.0%) |
| Total | 1,052 (92.4%) | 87 (7.6%) |
Income Below Poverty Among Single-Parent Households in Spry
| Children | Single Father | Single Mother |
| No Children | 0 (0.0%) | 0 (0.0%) |
| 1 or 2 Children | 0 (0.0%) | 0 (0.0%) |
| 3 or 4 Children | 0 (0.0%) | 0 (0.0%) |
| 5 or more Children | 0 (0.0%) | 0 (0.0%) |
| Total | 0 (0.0%) | 0 (0.0%) |
Income Below Poverty Among Married-Couple vs Single-Parent Households in Spry
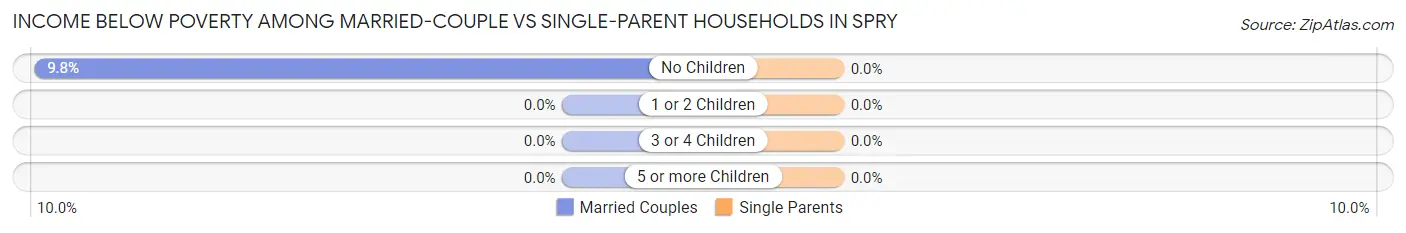
| Children | Married-Couple Families | Single-Parent Households |
| No Children | 87 (9.8%) | 0 (0.0%) |
| 1 or 2 Children | 0 (0.0%) | 0 (0.0%) |
| 3 or 4 Children | 0 (0.0%) | 0 (0.0%) |
| 5 or more Children | 0 (0.0%) | 0 (0.0%) |
| Total | 87 (7.6%) | 0 (0.0%) |
Race in Spry
The most populous races in Spry are White / Caucasian (4,138 | 86.9%), Two or more Races (455 | 9.6%), and Black / African American (133 | 2.8%).
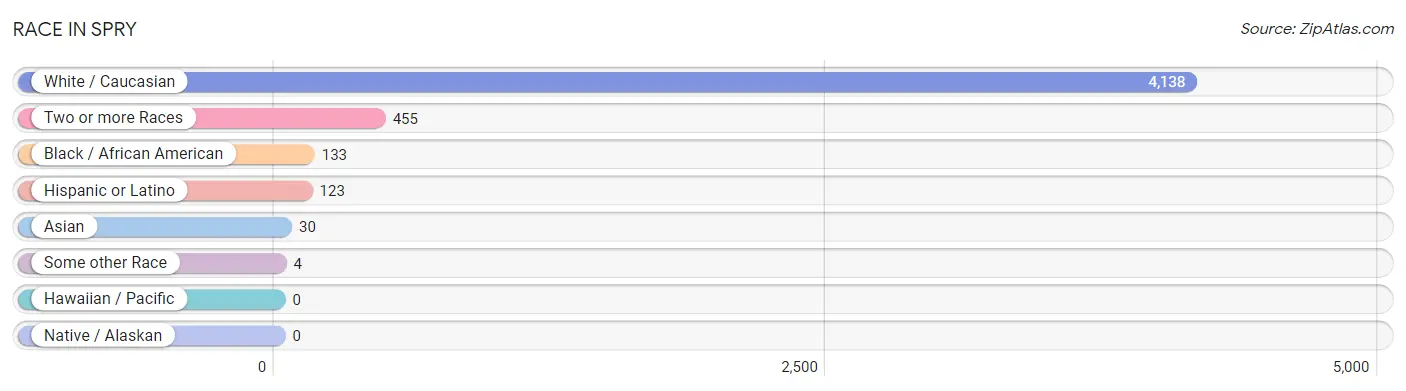
| Race | # Population | % Population |
| Asian | 30 | 0.6% |
| Black / African American | 133 | 2.8% |
| Hawaiian / Pacific | 0 | 0.0% |
| Hispanic or Latino | 123 | 2.6% |
| Native / Alaskan | 0 | 0.0% |
| White / Caucasian | 4,138 | 86.9% |
| Two or more Races | 455 | 9.6% |
| Some other Race | 4 | 0.1% |
| Total | 4,760 | 100.0% |
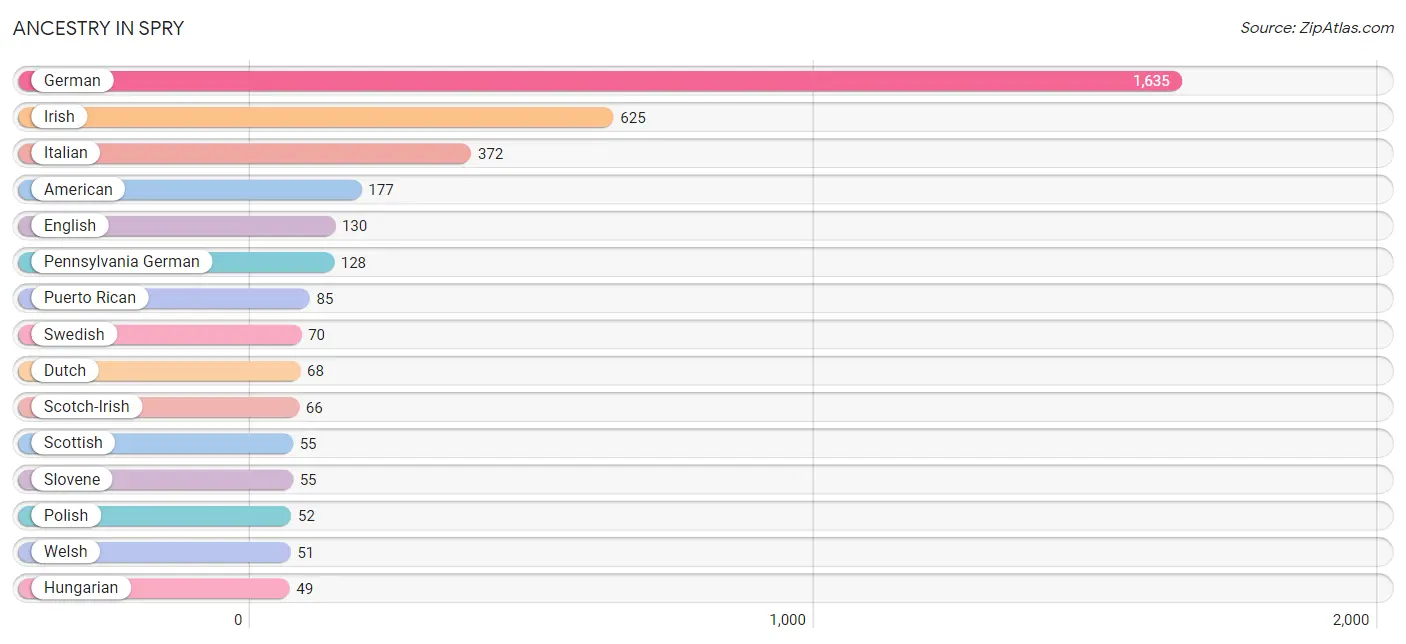
Ancestry in Spry
The most populous ancestries reported in Spry are German (1,635 | 34.4%), Irish (625 | 13.1%), Italian (372 | 7.8%), American (177 | 3.7%), and English (130 | 2.7%), together accounting for 61.8% of all Spry residents.
| Ancestry | # Population | % Population |
| American | 177 | 3.7% |
| Arab | 10 | 0.2% |
| Austrian | 1 | 0.0% |
| Belgian | 13 | 0.3% |
| British | 13 | 0.3% |
| Canadian | 33 | 0.7% |
| Dutch | 68 | 1.4% |
| English | 130 | 2.7% |
| European | 18 | 0.4% |
| Finnish | 13 | 0.3% |
| French | 14 | 0.3% |
| German | 1,635 | 34.4% |
| Greek | 17 | 0.4% |
| Hungarian | 49 | 1.0% |
| Indian (Asian) | 16 | 0.3% |
| Irish | 625 | 13.1% |
| Italian | 372 | 7.8% |
| Lebanese | 10 | 0.2% |
| Mexican | 16 | 0.3% |
| Norwegian | 16 | 0.3% |
| Pennsylvania German | 128 | 2.7% |
| Polish | 52 | 1.1% |
| Puerto Rican | 85 | 1.8% |
| Scotch-Irish | 66 | 1.4% |
| Scottish | 55 | 1.2% |
| Slavic | 21 | 0.4% |
| Slovak | 32 | 0.7% |
| Slovene | 55 | 1.2% |
| Spaniard | 22 | 0.5% |
| Sri Lankan | 14 | 0.3% |
| Swedish | 70 | 1.5% |
| Swiss | 26 | 0.5% |
| Welsh | 51 | 1.1% |
| Yugoslavian | 18 | 0.4% | View All 34 Rows |
Immigrants in Spry
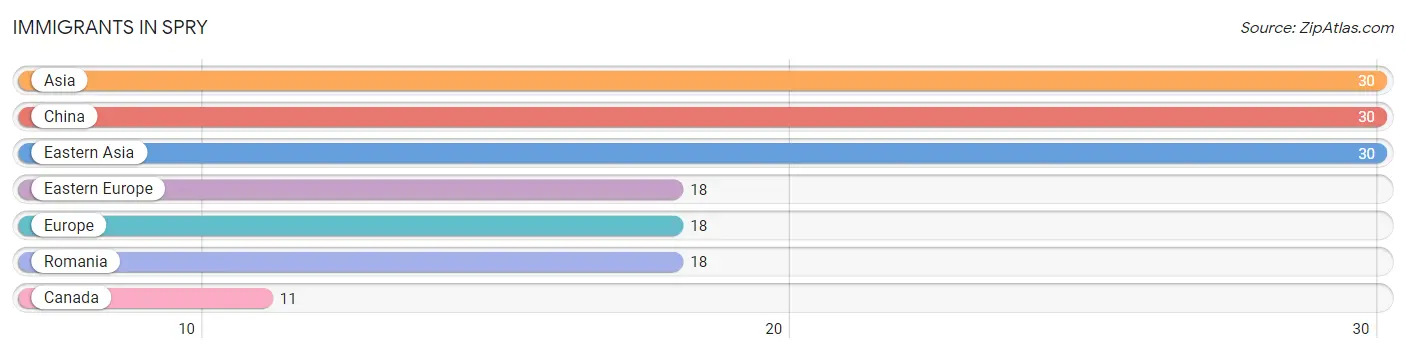
The most numerous immigrant groups reported in Spry came from Asia (30 | 0.6%), China (30 | 0.6%), Eastern Asia (30 | 0.6%), Eastern Europe (18 | 0.4%), and Europe (18 | 0.4%), together accounting for 2.7% of all Spry residents.
| Immigration Origin | # Population | % Population |
| Asia | 30 | 0.6% |
| Canada | 11 | 0.2% |
| China | 30 | 0.6% |
| Eastern Asia | 30 | 0.6% |
| Eastern Europe | 18 | 0.4% |
| Europe | 18 | 0.4% |
| Romania | 18 | 0.4% | View All 7 Rows |
Sex and Age in Spry
Sex and Age in Spry
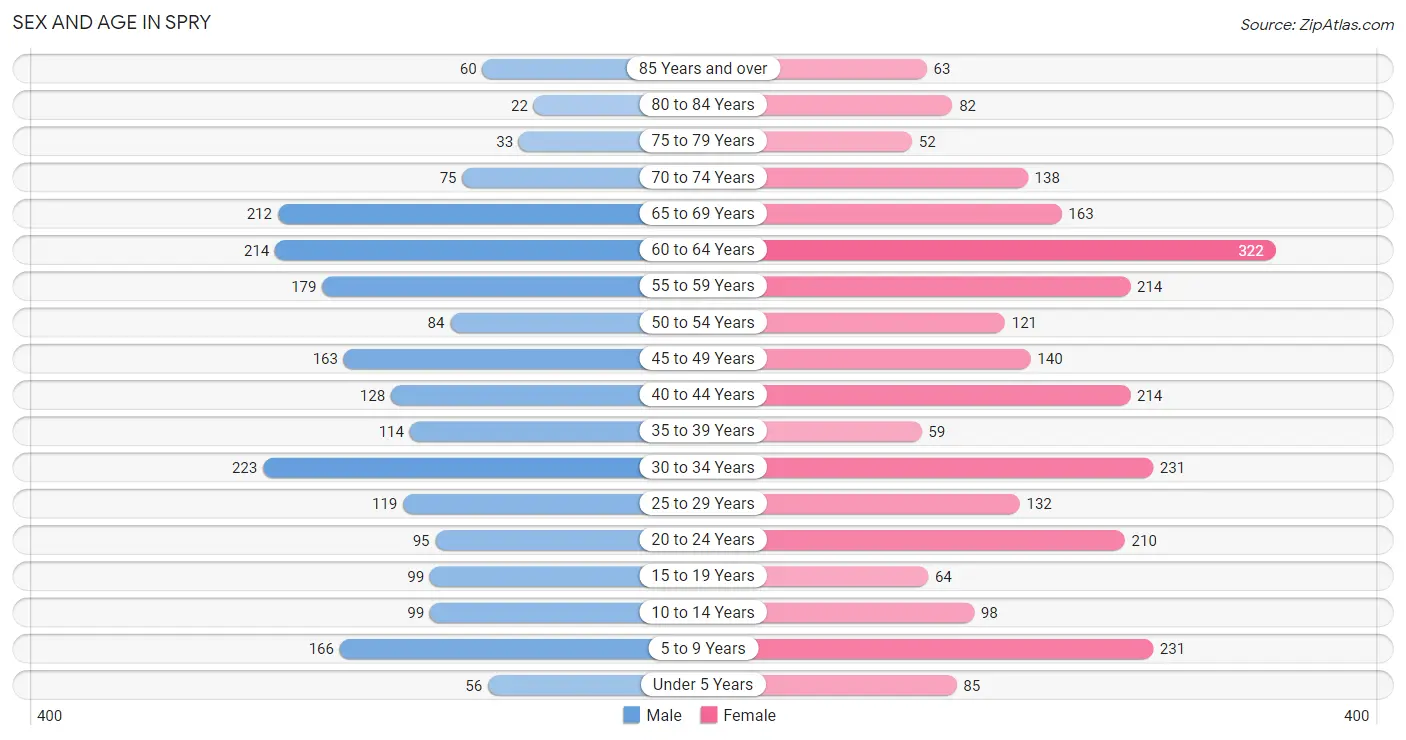
The most populous age groups in Spry are 30 to 34 Years (223 | 10.4%) for men and 60 to 64 Years (322 | 12.3%) for women.
| Age Bracket | Male | Female |
| Under 5 Years | 56 (2.6%) | 85 (3.3%) |
| 5 to 9 Years | 166 (7.7%) | 231 (8.8%) |
| 10 to 14 Years | 99 (4.6%) | 98 (3.7%) |
| 15 to 19 Years | 99 (4.6%) | 64 (2.4%) |
| 20 to 24 Years | 95 (4.4%) | 210 (8.0%) |
| 25 to 29 Years | 119 (5.6%) | 132 (5.0%) |
| 30 to 34 Years | 223 (10.4%) | 231 (8.8%) |
| 35 to 39 Years | 114 (5.3%) | 59 (2.2%) |
| 40 to 44 Years | 128 (6.0%) | 214 (8.2%) |
| 45 to 49 Years | 163 (7.6%) | 140 (5.3%) |
| 50 to 54 Years | 84 (3.9%) | 121 (4.6%) |
| 55 to 59 Years | 179 (8.4%) | 214 (8.2%) |
| 60 to 64 Years | 214 (10.0%) | 322 (12.3%) |
| 65 to 69 Years | 212 (9.9%) | 163 (6.2%) |
| 70 to 74 Years | 75 (3.5%) | 138 (5.3%) |
| 75 to 79 Years | 33 (1.5%) | 52 (2.0%) |
| 80 to 84 Years | 22 (1.0%) | 82 (3.1%) |
| 85 Years and over | 60 (2.8%) | 63 (2.4%) |
| Total | 2,141 (100.0%) | 2,619 (100.0%) |
Families and Households in Spry
Median Family Size in Spry
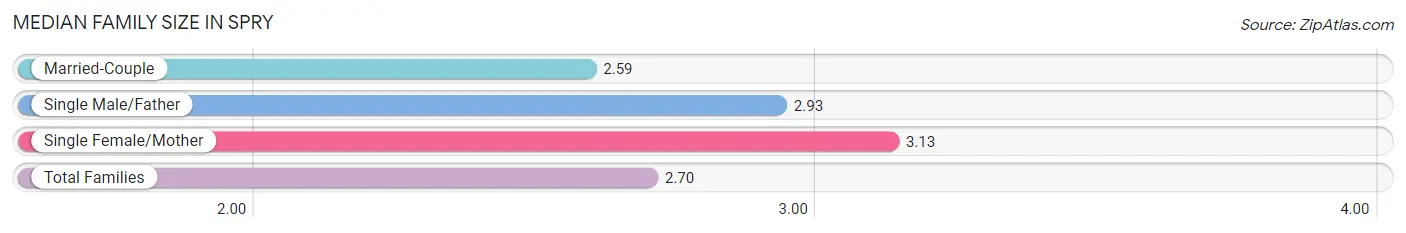
The median family size in Spry is 2.70 persons per family, with single female/mother families (242 | 16.9%) accounting for the largest median family size of 3.13 persons per family. On the other hand, married-couple families (1,139 | 79.3%) represent the smallest median family size with 2.59 persons per family.
| Family Type | # Families | Family Size |
| Married-Couple | 1,139 (79.3%) | 2.59 |
| Single Male/Father | 55 (3.8%) | 2.93 |
| Single Female/Mother | 242 (16.9%) | 3.13 |
| Total Families | 1,436 (100.0%) | 2.70 |
Median Household Size in Spry
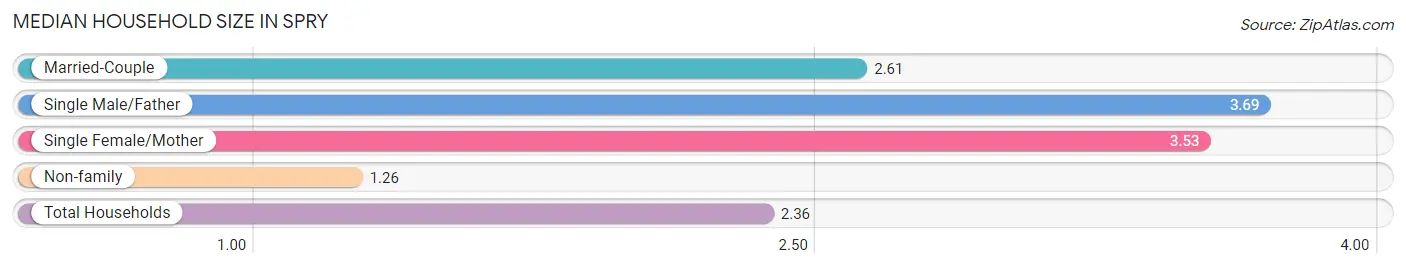
The median household size in Spry is 2.36 persons per household, with single male/father households (55 | 2.7%) accounting for the largest median household size of 3.69 persons per household. non-family households (572 | 28.5%) represent the smallest median household size with 1.26 persons per household.
| Household Type | # Households | Household Size |
| Married-Couple | 1,139 (56.7%) | 2.61 |
| Single Male/Father | 55 (2.7%) | 3.69 |
| Single Female/Mother | 242 (12.0%) | 3.53 |
| Non-family | 572 (28.5%) | 1.26 |
| Total Households | 2,008 (100.0%) | 2.36 |
Household Size by Marriage Status in Spry
Out of a total of 2,008 households in Spry, 1,436 (71.5%) are family households, while 572 (28.5%) are nonfamily households. The most numerous type of family households are 2-person households, comprising 755, and the most common type of nonfamily households are 1-person households, comprising 425.
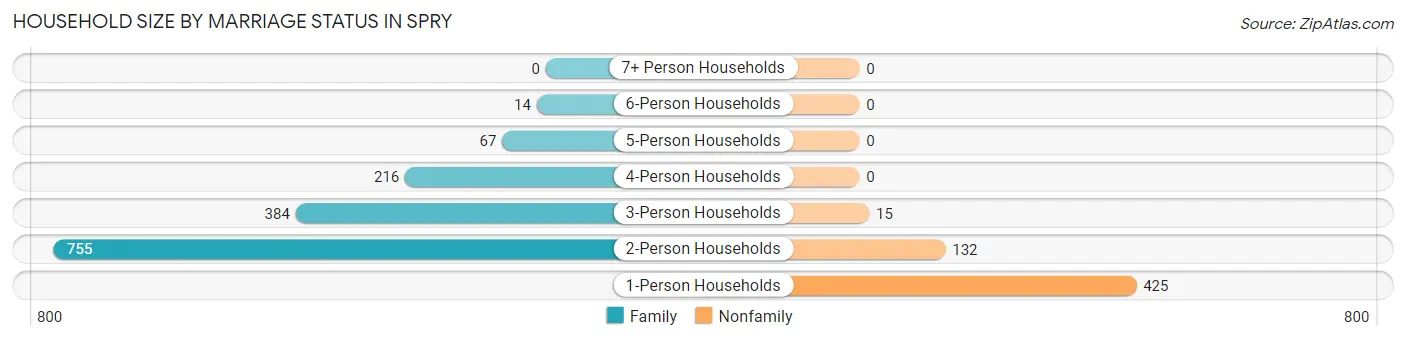
| Household Size | Family Households | Nonfamily Households |
| 1-Person Households | - | 425 (21.2%) |
| 2-Person Households | 755 (37.6%) | 132 (6.6%) |
| 3-Person Households | 384 (19.1%) | 15 (0.7%) |
| 4-Person Households | 216 (10.8%) | 0 (0.0%) |
| 5-Person Households | 67 (3.3%) | 0 (0.0%) |
| 6-Person Households | 14 (0.7%) | 0 (0.0%) |
| 7+ Person Households | 0 (0.0%) | 0 (0.0%) |
| Total | 1,436 (71.5%) | 572 (28.5%) |
Female Fertility in Spry
Fertility by Age in Spry
Average fertility rate in Spry is 15.0 births per 1,000 women. Women in the age bracket of 20 to 34 years have the highest fertility rate with 30.0 births per 1,000 women. Women in the age bracket of 20 to 34 years acount for 100.0% of all women with births.
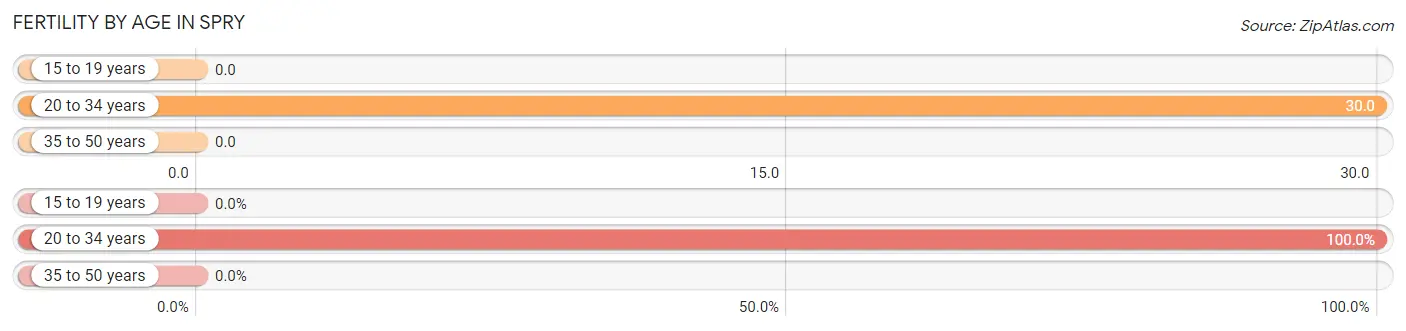
| Age Bracket | Women with Births | Births / 1,000 Women |
| 15 to 19 years | 0 (0.0%) | 0.0 |
| 20 to 34 years | 17 (100.0%) | 30.0 |
| 35 to 50 years | 0 (0.0%) | 0.0 |
| Total | 17 (100.0%) | 15.0 |
Fertility by Age by Marriage Status in Spry
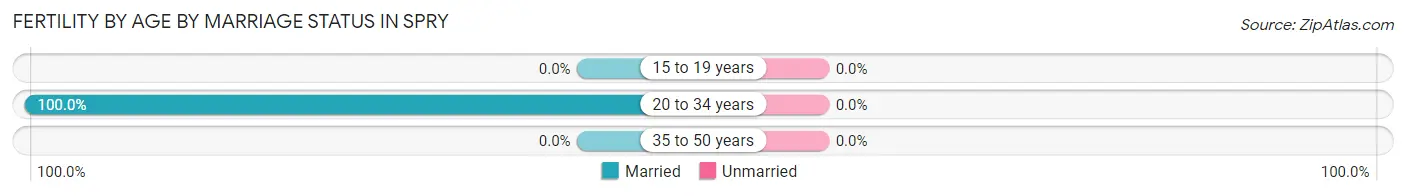
| Age Bracket | Married | Unmarried |
| 15 to 19 years | 0 (0.0%) | 0 (0.0%) |
| 20 to 34 years | 17 (100.0%) | 0 (0.0%) |
| 35 to 50 years | 0 (0.0%) | 0 (0.0%) |
| Total | 17 (100.0%) | 0 (0.0%) |
Fertility by Education in Spry
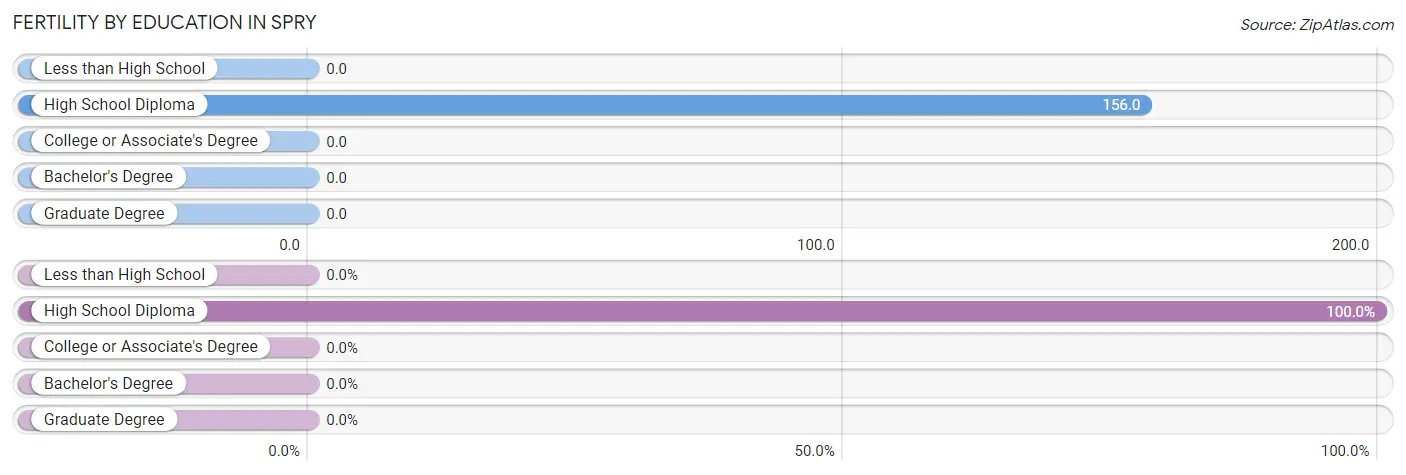
| Educational Attainment | Women with Births | Births / 1,000 Women |
| Less than High School | 0 (0.0%) | 0.0 |
| High School Diploma | 17 (100.0%) | 156.0 |
| College or Associate's Degree | 0 (0.0%) | 0.0 |
| Bachelor's Degree | 0 (0.0%) | 0.0 |
| Graduate Degree | 0 (0.0%) | 0.0 |
| Total | 17 (100.0%) | 15.0 |
Fertility by Education by Marriage Status in Spry
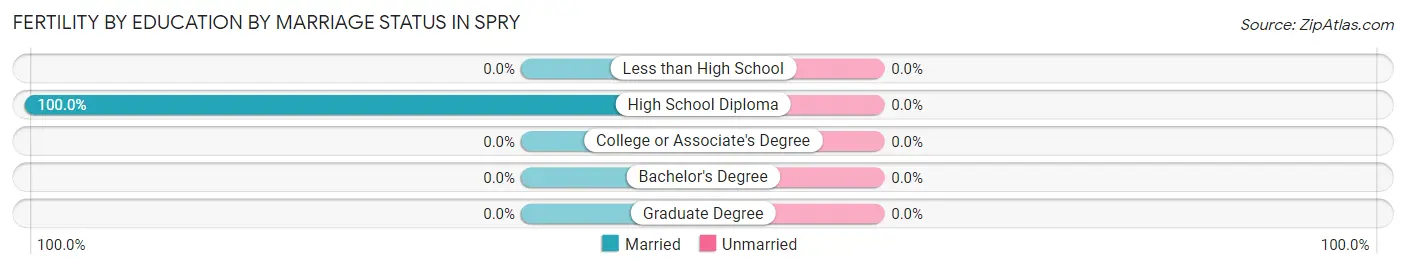
| Educational Attainment | Married | Unmarried |
| Less than High School | 0 (0.0%) | 0 (0.0%) |
| High School Diploma | 17 (100.0%) | 0 (0.0%) |
| College or Associate's Degree | 0 (0.0%) | 0 (0.0%) |
| Bachelor's Degree | 0 (0.0%) | 0 (0.0%) |
| Graduate Degree | 0 (0.0%) | 0 (0.0%) |
| Total | 17 (100.0%) | 0 (0.0%) |
Employment Characteristics in Spry
Employment by Class of Employer in Spry
Among the 2,600 employed individuals in Spry, private company employees (1,562 | 60.1%), not-for-profit organizations (512 | 19.7%), and local government employees (143 | 5.5%) make up the most common classes of employment.
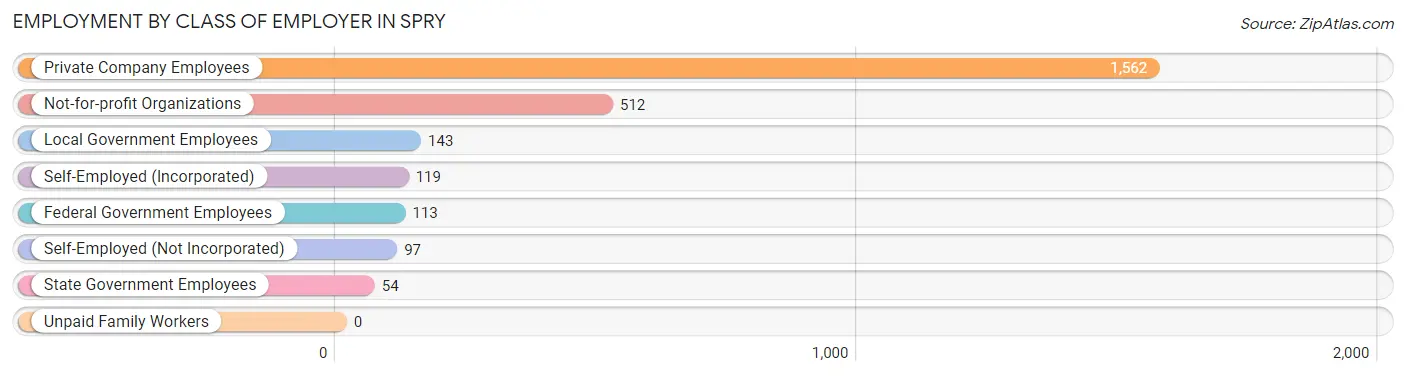
| Employer Class | # Employees | % Employees |
| Private Company Employees | 1,562 | 60.1% |
| Self-Employed (Incorporated) | 119 | 4.6% |
| Self-Employed (Not Incorporated) | 97 | 3.7% |
| Not-for-profit Organizations | 512 | 19.7% |
| Local Government Employees | 143 | 5.5% |
| State Government Employees | 54 | 2.1% |
| Federal Government Employees | 113 | 4.3% |
| Unpaid Family Workers | 0 | 0.0% |
| Total | 2,600 | 100.0% |
Employment Status by Age in Spry
According to the labor force statistics for Spry, out of the total population over 16 years of age (4,014), 69.1% or 2,774 individuals are in the labor force, with 4.5% or 125 of them unemployed. The age group with the highest labor force participation rate is 20 to 24 years, with 94.1% or 287 individuals in the labor force. Within the labor force, the 20 to 24 years age range has the highest percentage of unemployed individuals, with 35.5% or 102 of them being unemployed.
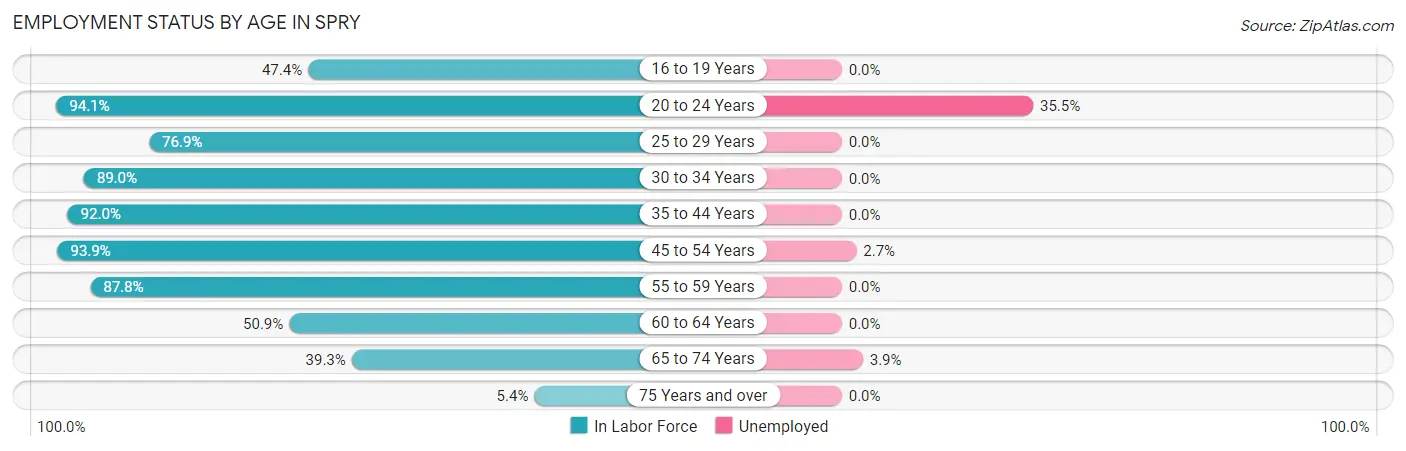
| Age Bracket | In Labor Force | Unemployed |
| 16 to 19 Years | 72 (47.4%) | 0 (0.0%) |
| 20 to 24 Years | 287 (94.1%) | 102 (35.5%) |
| 25 to 29 Years | 193 (76.9%) | 0 (0.0%) |
| 30 to 34 Years | 404 (89.0%) | 0 (0.0%) |
| 35 to 44 Years | 474 (92.0%) | 0 (0.0%) |
| 45 to 54 Years | 477 (93.9%) | 13 (2.7%) |
| 55 to 59 Years | 345 (87.8%) | 0 (0.0%) |
| 60 to 64 Years | 273 (50.9%) | 0 (0.0%) |
| 65 to 74 Years | 231 (39.3%) | 9 (3.9%) |
| 75 Years and over | 17 (5.4%) | 0 (0.0%) |
| Total | 2,774 (69.1%) | 125 (4.5%) |
Employment Status by Educational Attainment in Spry
According to labor force statistics for Spry, 81.5% of individuals (2,165) out of the total population between 25 and 64 years of age (2,657) are in the labor force, with 0.6% or 13 of them being unemployed. The group with the highest labor force participation rate are those with the educational attainment of college / associate degree, with 94.0% or 737 individuals in the labor force. Within the labor force, individuals with high school diploma education have the highest percentage of unemployment, with 2.6% or 13 of them being unemployed.
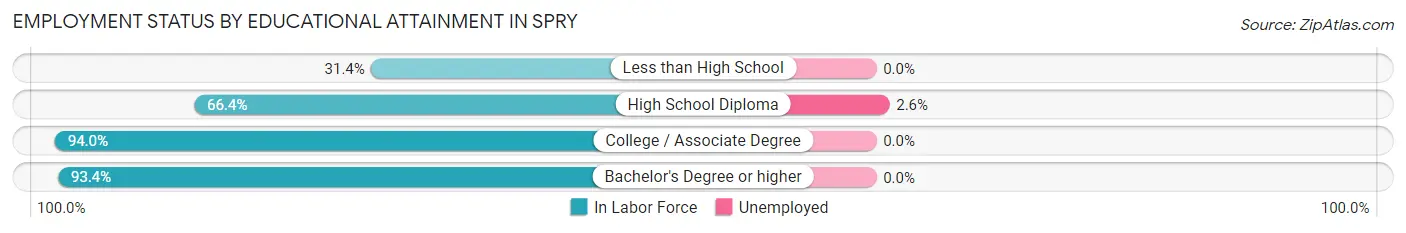
| Educational Attainment | In Labor Force | Unemployed |
| Less than High School | 60 (31.4%) | 0 (0.0%) |
| High School Diploma | 496 (66.4%) | 19 (2.6%) |
| College / Associate Degree | 737 (94.0%) | 0 (0.0%) |
| Bachelor's Degree or higher | 873 (93.4%) | 0 (0.0%) |
| Total | 2,165 (81.5%) | 16 (0.6%) |
Employment Occupations by Sex in Spry
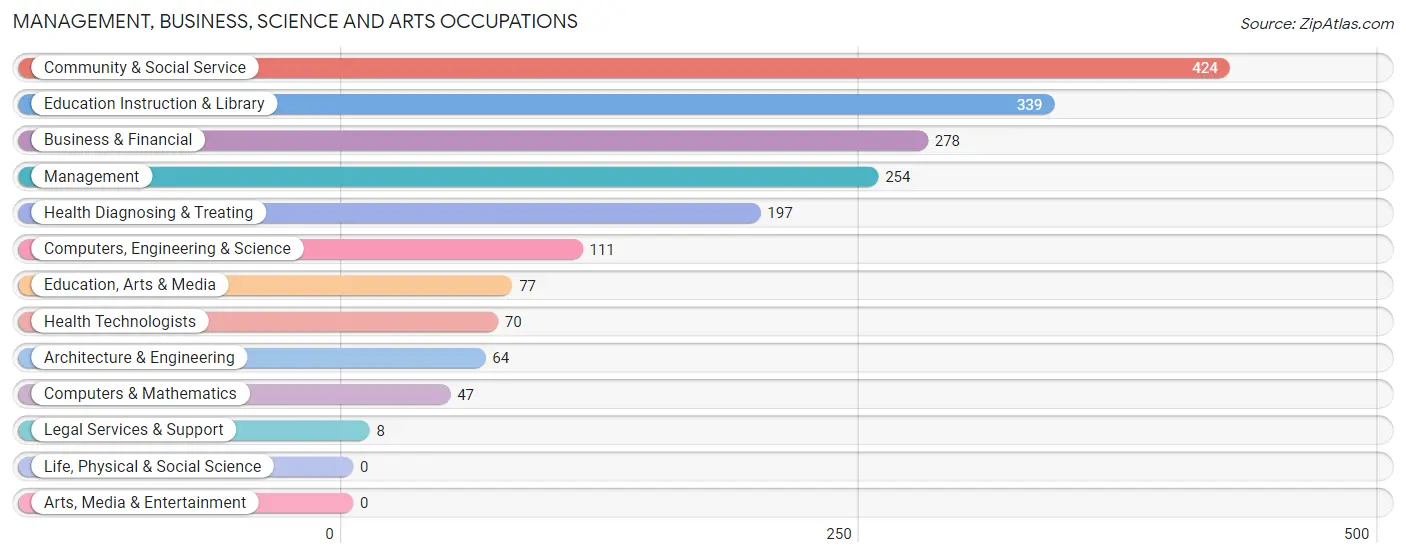
Management, Business, Science and Arts Occupations
The most common Management, Business, Science and Arts occupations in Spry are Community & Social Service (424 | 16.0%), Education Instruction & Library (339 | 12.8%), Business & Financial (278 | 10.5%), Management (254 | 9.6%), and Health Diagnosing & Treating (197 | 7.4%).
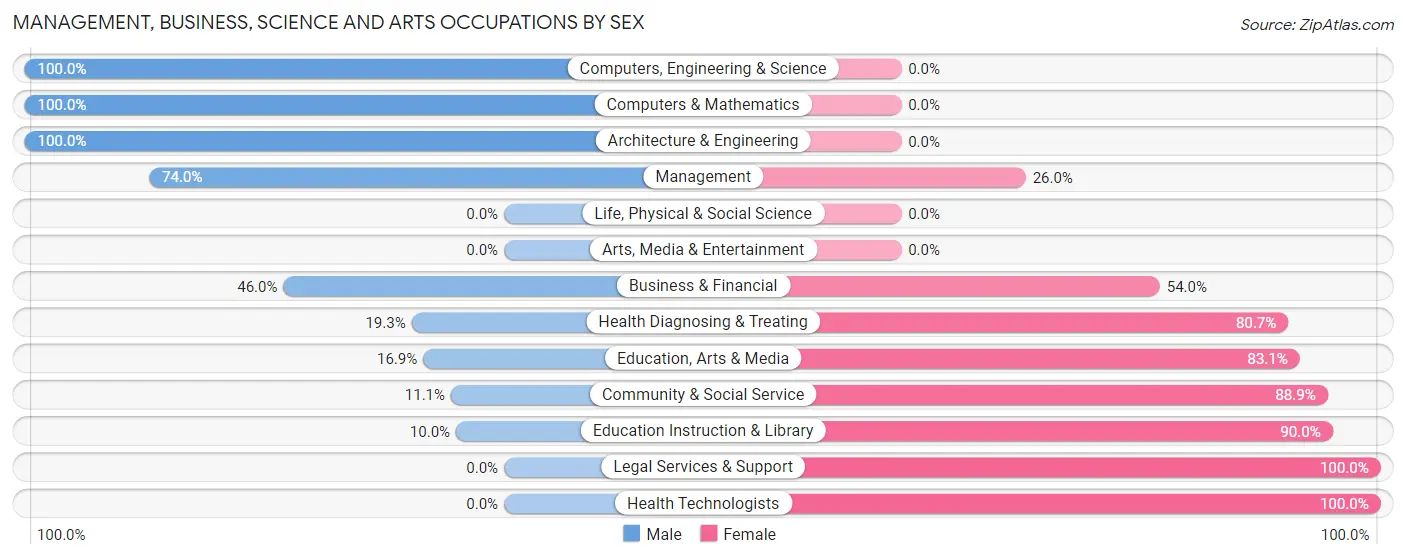
Management, Business, Science and Arts Occupations by Sex
Within the Management, Business, Science and Arts occupations in Spry, the most male-oriented occupations are Computers, Engineering & Science (100.0%), Computers & Mathematics (100.0%), and Architecture & Engineering (100.0%), while the most female-oriented occupations are Legal Services & Support (100.0%), Health Technologists (100.0%), and Education Instruction & Library (90.0%).
| Occupation | Male | Female |
| Management | 188 (74.0%) | 66 (26.0%) |
| Business & Financial | 128 (46.0%) | 150 (54.0%) |
| Computers, Engineering & Science | 111 (100.0%) | 0 (0.0%) |
| Computers & Mathematics | 47 (100.0%) | 0 (0.0%) |
| Architecture & Engineering | 64 (100.0%) | 0 (0.0%) |
| Life, Physical & Social Science | 0 (0.0%) | 0 (0.0%) |
| Community & Social Service | 47 (11.1%) | 377 (88.9%) |
| Education, Arts & Media | 13 (16.9%) | 64 (83.1%) |
| Legal Services & Support | 0 (0.0%) | 8 (100.0%) |
| Education Instruction & Library | 34 (10.0%) | 305 (90.0%) |
| Arts, Media & Entertainment | 0 (0.0%) | 0 (0.0%) |
| Health Diagnosing & Treating | 38 (19.3%) | 159 (80.7%) |
| Health Technologists | 0 (0.0%) | 70 (100.0%) |
| Total (Category) | 512 (40.5%) | 752 (59.5%) |
| Total (Overall) | 1,261 (47.7%) | 1,382 (52.3%) |
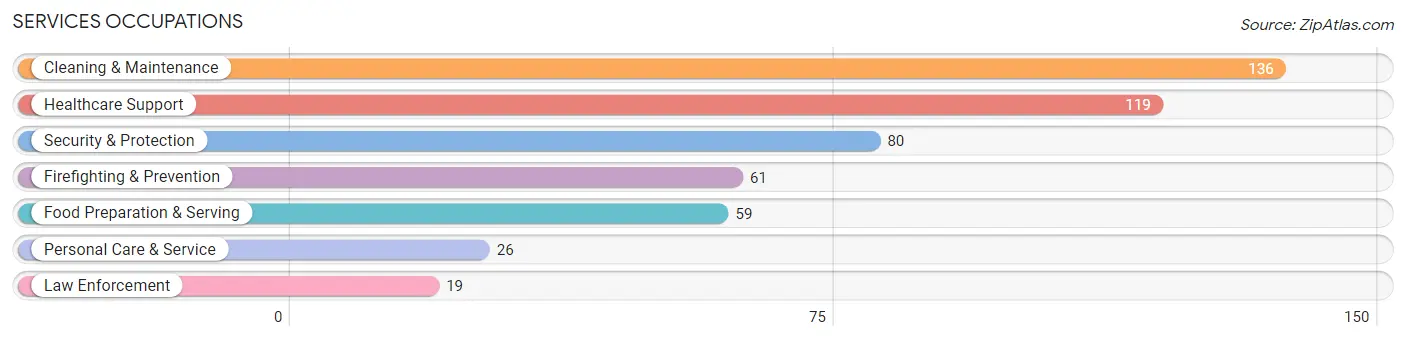
Services Occupations
The most common Services occupations in Spry are Cleaning & Maintenance (136 | 5.1%), Healthcare Support (119 | 4.5%), Security & Protection (80 | 3.0%), Firefighting & Prevention (61 | 2.3%), and Food Preparation & Serving (59 | 2.2%).
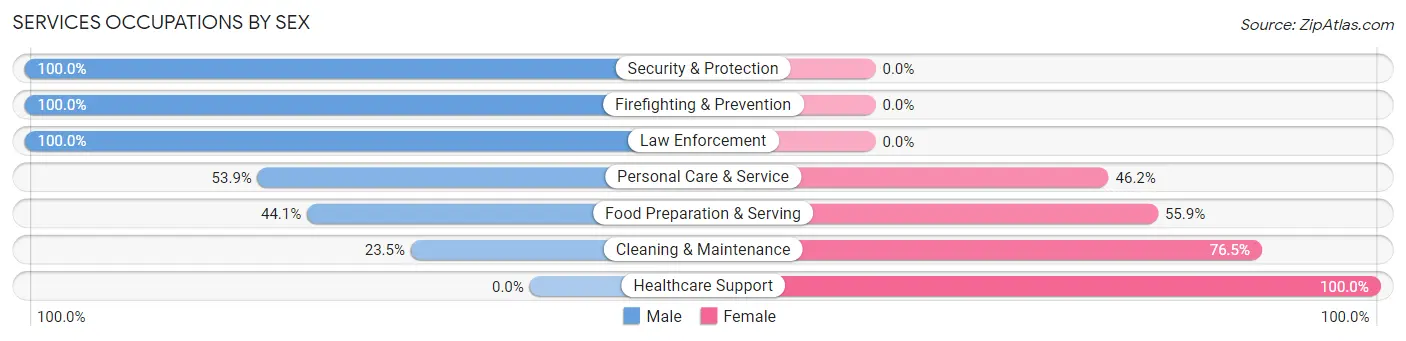
Services Occupations by Sex
Within the Services occupations in Spry, the most male-oriented occupations are Security & Protection (100.0%), Firefighting & Prevention (100.0%), and Law Enforcement (100.0%), while the most female-oriented occupations are Healthcare Support (100.0%), Cleaning & Maintenance (76.5%), and Food Preparation & Serving (55.9%).
| Occupation | Male | Female |
| Healthcare Support | 0 (0.0%) | 119 (100.0%) |
| Security & Protection | 80 (100.0%) | 0 (0.0%) |
| Firefighting & Prevention | 61 (100.0%) | 0 (0.0%) |
| Law Enforcement | 19 (100.0%) | 0 (0.0%) |
| Food Preparation & Serving | 26 (44.1%) | 33 (55.9%) |
| Cleaning & Maintenance | 32 (23.5%) | 104 (76.5%) |
| Personal Care & Service | 14 (53.8%) | 12 (46.2%) |
| Total (Category) | 152 (36.2%) | 268 (63.8%) |
| Total (Overall) | 1,261 (47.7%) | 1,382 (52.3%) |
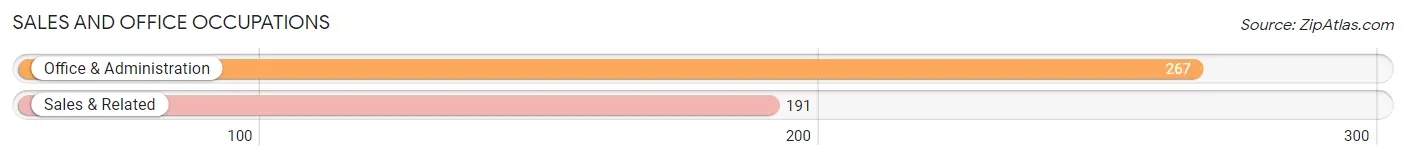
Sales and Office Occupations
The most common Sales and Office occupations in Spry are Office & Administration (267 | 10.1%), and Sales & Related (191 | 7.2%).
Sales and Office Occupations by Sex
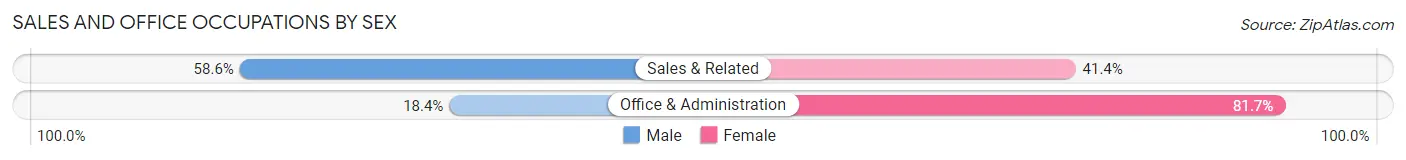
| Occupation | Male | Female |
| Sales & Related | 112 (58.6%) | 79 (41.4%) |
| Office & Administration | 49 (18.3%) | 218 (81.7%) |
| Total (Category) | 161 (35.1%) | 297 (64.8%) |
| Total (Overall) | 1,261 (47.7%) | 1,382 (52.3%) |
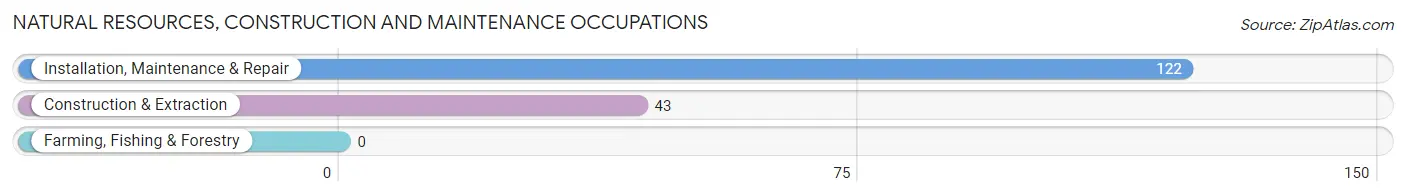
Natural Resources, Construction and Maintenance Occupations
The most common Natural Resources, Construction and Maintenance occupations in Spry are Installation, Maintenance & Repair (122 | 4.6%), and Construction & Extraction (43 | 1.6%).
Natural Resources, Construction and Maintenance Occupations by Sex
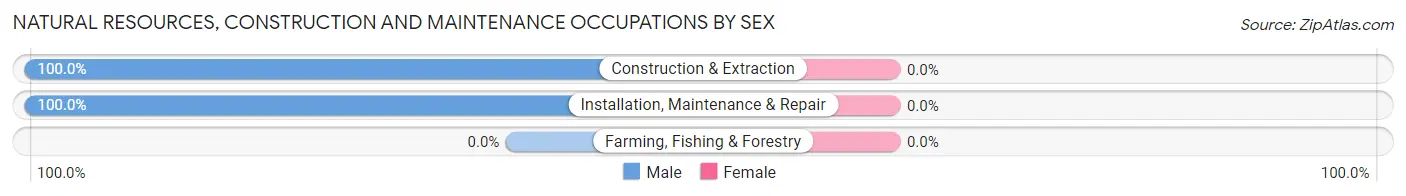
| Occupation | Male | Female |
| Farming, Fishing & Forestry | 0 (0.0%) | 0 (0.0%) |
| Construction & Extraction | 43 (100.0%) | 0 (0.0%) |
| Installation, Maintenance & Repair | 122 (100.0%) | 0 (0.0%) |
| Total (Category) | 165 (100.0%) | 0 (0.0%) |
| Total (Overall) | 1,261 (47.7%) | 1,382 (52.3%) |
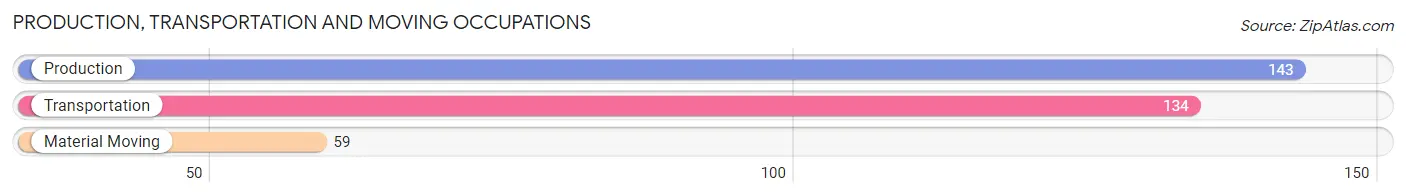
Production, Transportation and Moving Occupations
The most common Production, Transportation and Moving occupations in Spry are Production (143 | 5.4%), Transportation (134 | 5.1%), and Material Moving (59 | 2.2%).
Production, Transportation and Moving Occupations by Sex
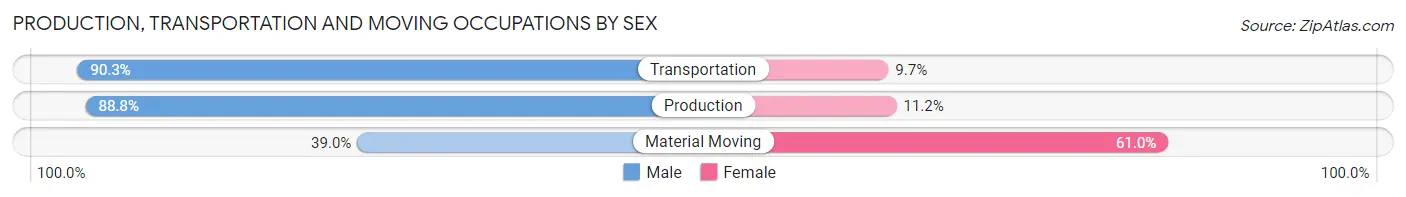
| Occupation | Male | Female |
| Production | 127 (88.8%) | 16 (11.2%) |
| Transportation | 121 (90.3%) | 13 (9.7%) |
| Material Moving | 23 (39.0%) | 36 (61.0%) |
| Total (Category) | 271 (80.6%) | 65 (19.4%) |
| Total (Overall) | 1,261 (47.7%) | 1,382 (52.3%) |
Employment Industries by Sex in Spry
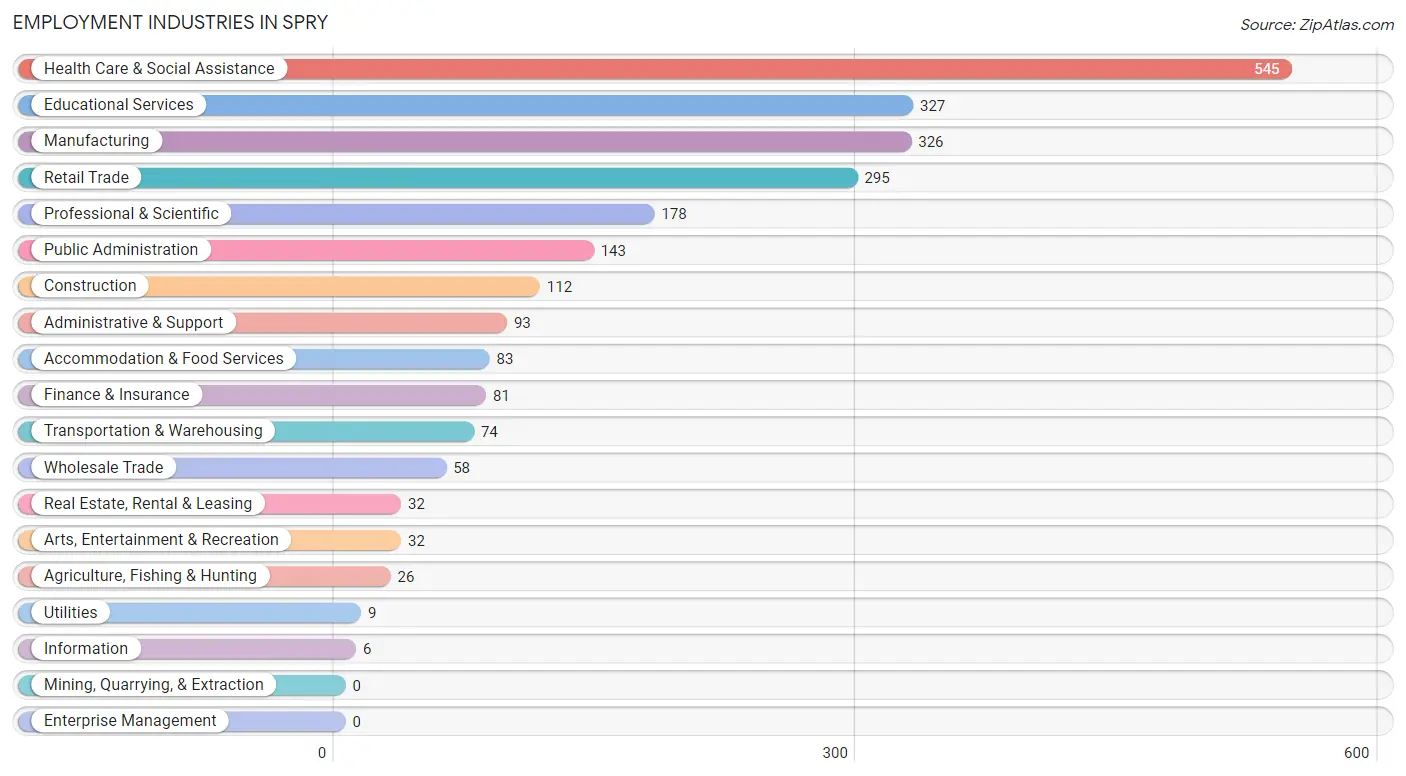
Employment Industries in Spry
The major employment industries in Spry include Health Care & Social Assistance (545 | 20.6%), Educational Services (327 | 12.4%), Manufacturing (326 | 12.3%), Retail Trade (295 | 11.2%), and Professional & Scientific (178 | 6.7%).
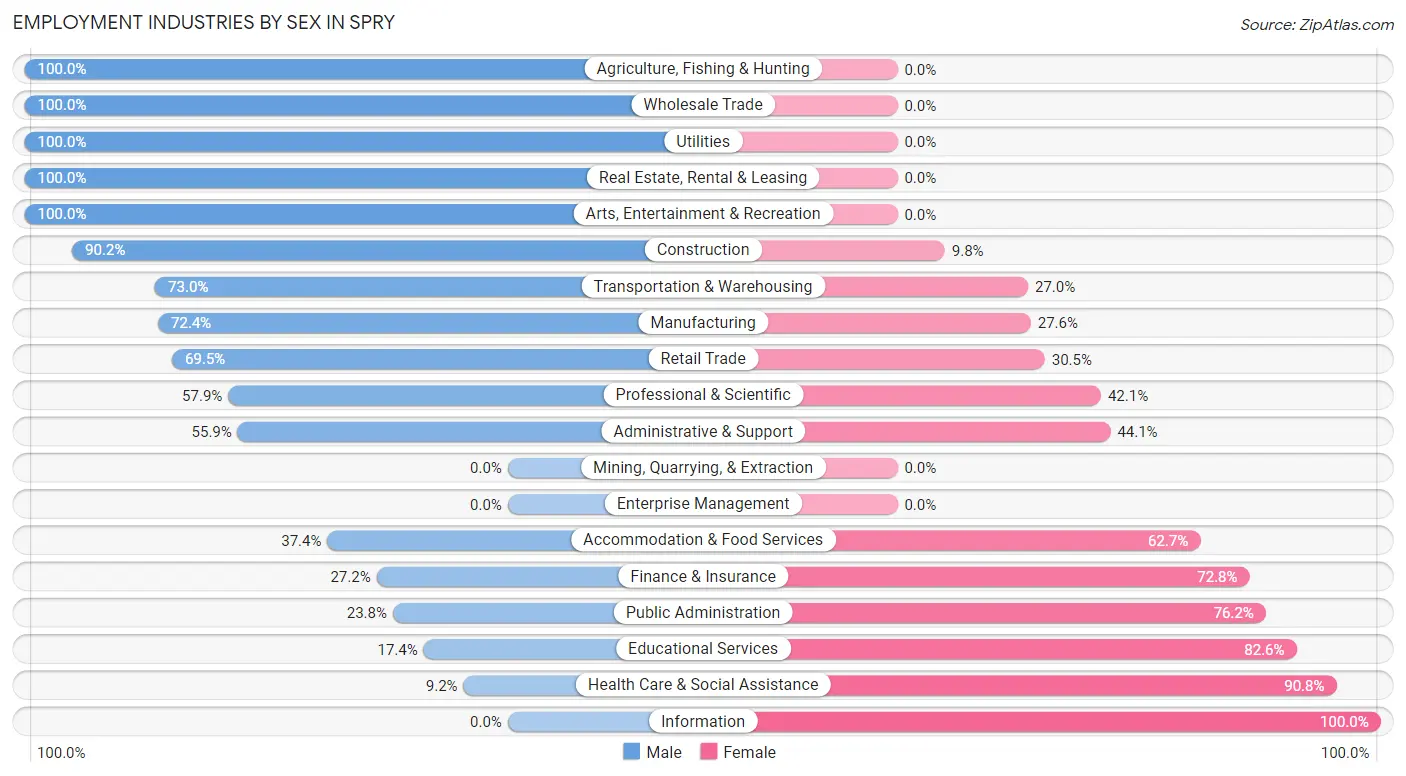
Employment Industries by Sex in Spry
The Spry industries that see more men than women are Agriculture, Fishing & Hunting (100.0%), Wholesale Trade (100.0%), and Utilities (100.0%), whereas the industries that tend to have a higher number of women are Information (100.0%), Health Care & Social Assistance (90.8%), and Educational Services (82.6%).
| Industry | Male | Female |
| Agriculture, Fishing & Hunting | 26 (100.0%) | 0 (0.0%) |
| Mining, Quarrying, & Extraction | 0 (0.0%) | 0 (0.0%) |
| Construction | 101 (90.2%) | 11 (9.8%) |
| Manufacturing | 236 (72.4%) | 90 (27.6%) |
| Wholesale Trade | 58 (100.0%) | 0 (0.0%) |
| Retail Trade | 205 (69.5%) | 90 (30.5%) |
| Transportation & Warehousing | 54 (73.0%) | 20 (27.0%) |
| Utilities | 9 (100.0%) | 0 (0.0%) |
| Information | 0 (0.0%) | 6 (100.0%) |
| Finance & Insurance | 22 (27.2%) | 59 (72.8%) |
| Real Estate, Rental & Leasing | 32 (100.0%) | 0 (0.0%) |
| Professional & Scientific | 103 (57.9%) | 75 (42.1%) |
| Enterprise Management | 0 (0.0%) | 0 (0.0%) |
| Administrative & Support | 52 (55.9%) | 41 (44.1%) |
| Educational Services | 57 (17.4%) | 270 (82.6%) |
| Health Care & Social Assistance | 50 (9.2%) | 495 (90.8%) |
| Arts, Entertainment & Recreation | 32 (100.0%) | 0 (0.0%) |
| Accommodation & Food Services | 31 (37.3%) | 52 (62.6%) |
| Public Administration | 34 (23.8%) | 109 (76.2%) |
| Total | 1,261 (47.7%) | 1,382 (52.3%) |
Education in Spry
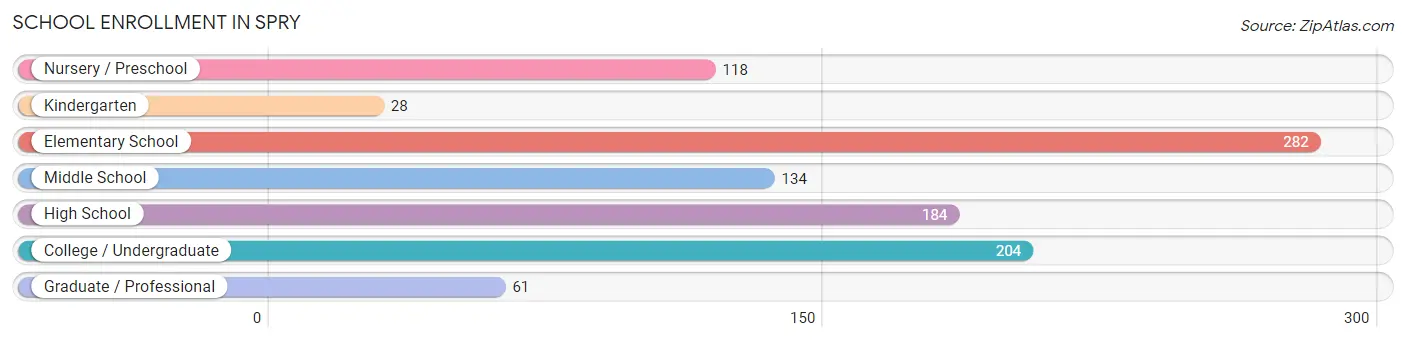
School Enrollment in Spry
The most common levels of schooling among the 1,011 students in Spry are elementary school (282 | 27.9%), college / undergraduate (204 | 20.2%), and high school (184 | 18.2%).
| School Level | # Students | % Students |
| Nursery / Preschool | 118 | 11.7% |
| Kindergarten | 28 | 2.8% |
| Elementary School | 282 | 27.9% |
| Middle School | 134 | 13.3% |
| High School | 184 | 18.2% |
| College / Undergraduate | 204 | 20.2% |
| Graduate / Professional | 61 | 6.0% |
| Total | 1,011 | 100.0% |
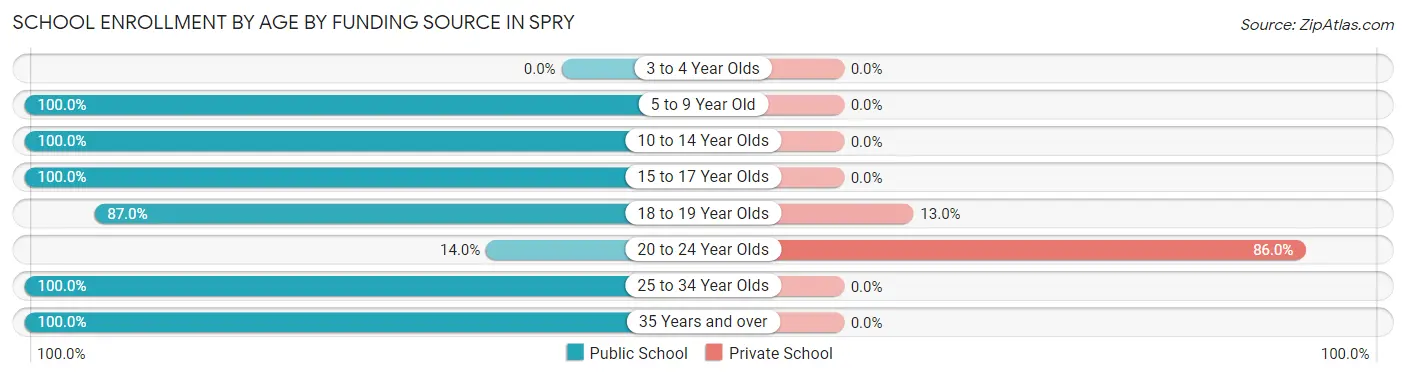
School Enrollment by Age by Funding Source in Spry
Out of a total of 1,011 students who are enrolled in schools in Spry, 157 (15.5%) attend a private institution, while the remaining 854 (84.5%) are enrolled in public schools. The age group of 20 to 24 year olds has the highest likelihood of being enrolled in private schools, with 147 (86.0% in the age bracket) enrolled. Conversely, the age group of 5 to 9 year old has the lowest likelihood of being enrolled in a private school, with 379 (100.0% in the age bracket) attending a public institution.
| Age Bracket | Public School | Private School |
| 3 to 4 Year Olds | 0 (0.0%) | 0 (0.0%) |
| 5 to 9 Year Old | 379 (100.0%) | 0 (0.0%) |
| 10 to 14 Year Olds | 179 (100.0%) | 0 (0.0%) |
| 15 to 17 Year Olds | 86 (100.0%) | 0 (0.0%) |
| 18 to 19 Year Olds | 67 (87.0%) | 10 (13.0%) |
| 20 to 24 Year Olds | 24 (14.0%) | 147 (86.0%) |
| 25 to 34 Year Olds | 35 (100.0%) | 0 (0.0%) |
| 35 Years and over | 84 (100.0%) | 0 (0.0%) |
| Total | 854 (84.5%) | 157 (15.5%) |
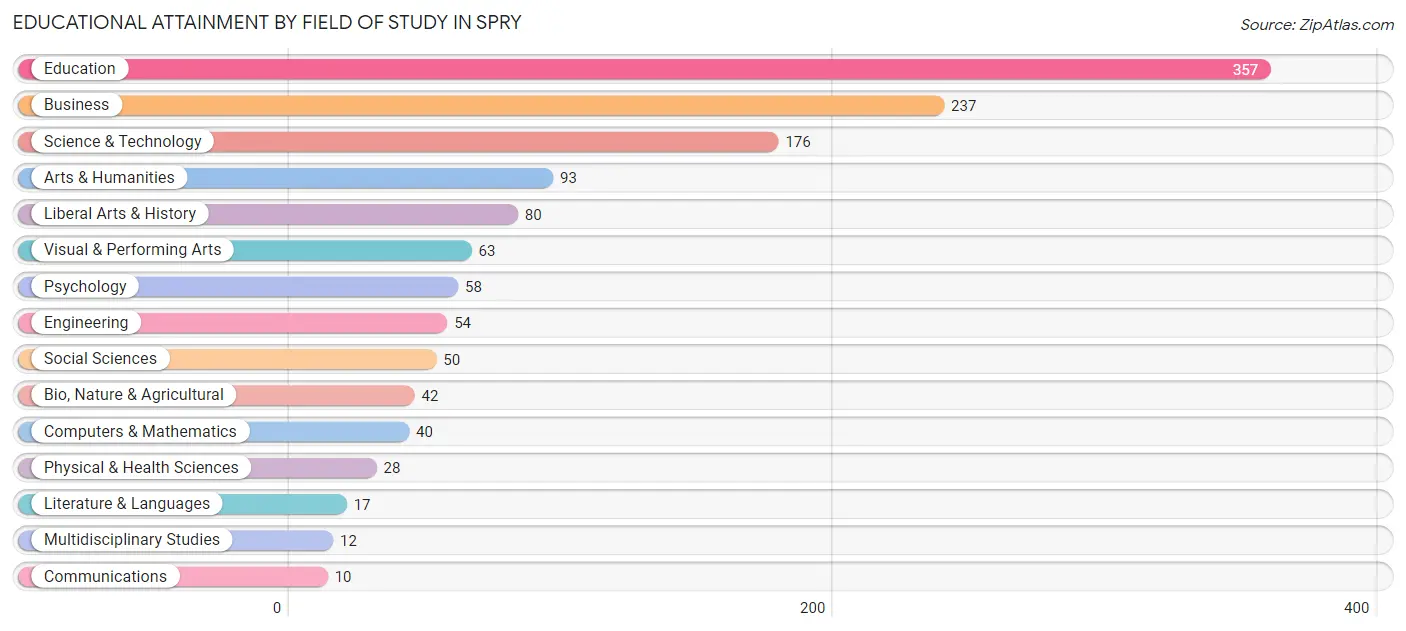
Educational Attainment by Field of Study in Spry
Education (357 | 27.1%), business (237 | 18.0%), science & technology (176 | 13.4%), arts & humanities (93 | 7.1%), and liberal arts & history (80 | 6.1%) are the most common fields of study among 1,317 individuals in Spry who have obtained a bachelor's degree or higher.
| Field of Study | # Graduates | % Graduates |
| Computers & Mathematics | 40 | 3.0% |
| Bio, Nature & Agricultural | 42 | 3.2% |
| Physical & Health Sciences | 28 | 2.1% |
| Psychology | 58 | 4.4% |
| Social Sciences | 50 | 3.8% |
| Engineering | 54 | 4.1% |
| Multidisciplinary Studies | 12 | 0.9% |
| Science & Technology | 176 | 13.4% |
| Business | 237 | 18.0% |
| Education | 357 | 27.1% |
| Literature & Languages | 17 | 1.3% |
| Liberal Arts & History | 80 | 6.1% |
| Visual & Performing Arts | 63 | 4.8% |
| Communications | 10 | 0.8% |
| Arts & Humanities | 93 | 7.1% |
| Total | 1,317 | 100.0% |
Transportation & Commute in Spry
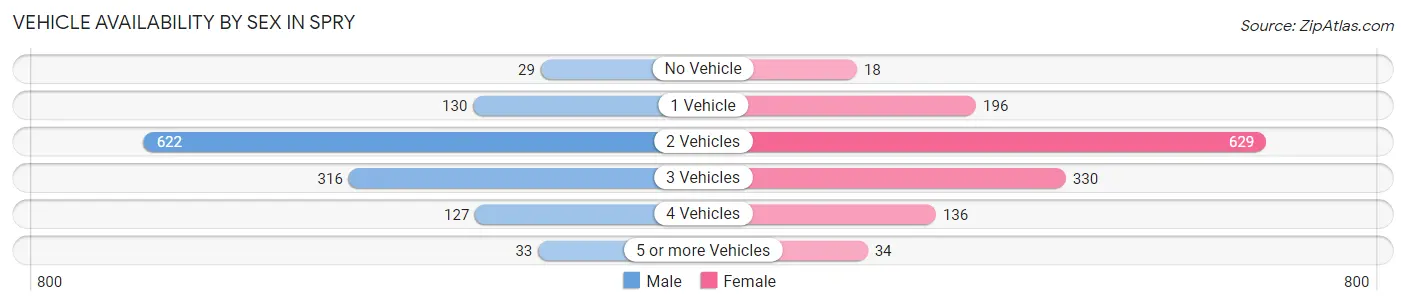
Vehicle Availability by Sex in Spry
The most prevalent vehicle ownership categories in Spry are males with 2 vehicles (622, accounting for 49.5%) and females with 2 vehicles (629, making up 46.3%).
| Vehicles Available | Male | Female |
| No Vehicle | 29 (2.3%) | 18 (1.3%) |
| 1 Vehicle | 130 (10.3%) | 196 (14.6%) |
| 2 Vehicles | 622 (49.5%) | 629 (46.8%) |
| 3 Vehicles | 316 (25.1%) | 330 (24.6%) |
| 4 Vehicles | 127 (10.1%) | 136 (10.1%) |
| 5 or more Vehicles | 33 (2.6%) | 34 (2.5%) |
| Total | 1,257 (100.0%) | 1,343 (100.0%) |
Commute Time in Spry
The most frequently occuring commute durations in Spry are 15 to 19 minutes (832 commuters, 34.7%), 10 to 14 minutes (354 commuters, 14.8%), and 5 to 9 minutes (309 commuters, 12.9%).
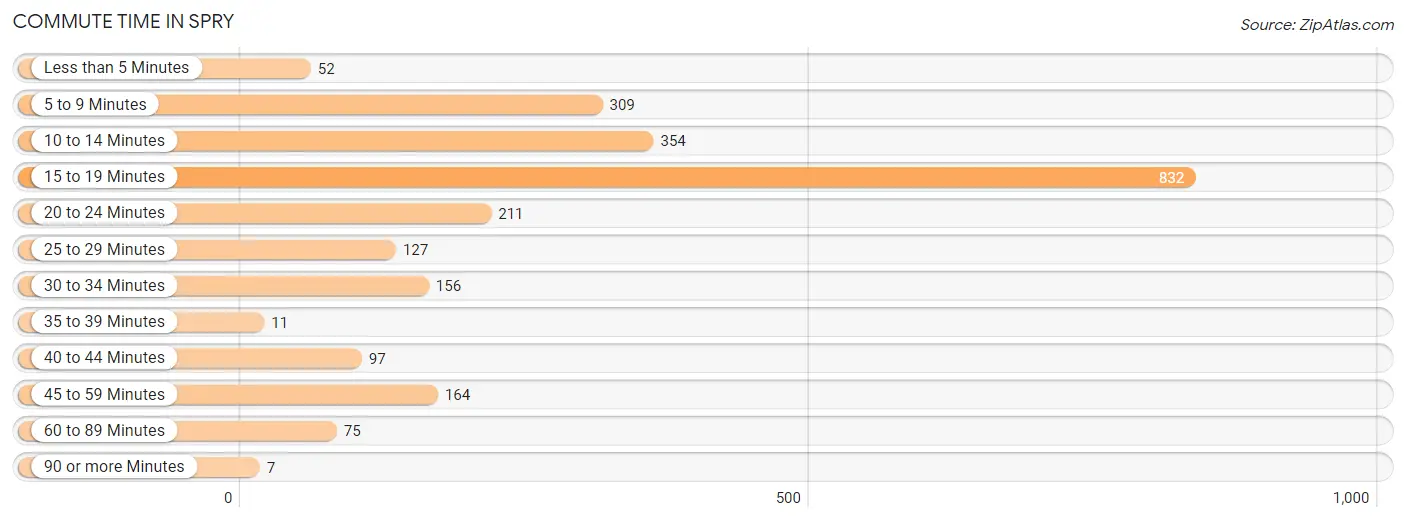
| Commute Time | # Commuters | % Commuters |
| Less than 5 Minutes | 52 | 2.2% |
| 5 to 9 Minutes | 309 | 12.9% |
| 10 to 14 Minutes | 354 | 14.8% |
| 15 to 19 Minutes | 832 | 34.7% |
| 20 to 24 Minutes | 211 | 8.8% |
| 25 to 29 Minutes | 127 | 5.3% |
| 30 to 34 Minutes | 156 | 6.5% |
| 35 to 39 Minutes | 11 | 0.5% |
| 40 to 44 Minutes | 97 | 4.1% |
| 45 to 59 Minutes | 164 | 6.9% |
| 60 to 89 Minutes | 75 | 3.1% |
| 90 or more Minutes | 7 | 0.3% |
Commute Time by Sex in Spry
The most common commute times in Spry are 15 to 19 minutes (432 commuters, 37.1%) for males and 15 to 19 minutes (400 commuters, 32.5%) for females.
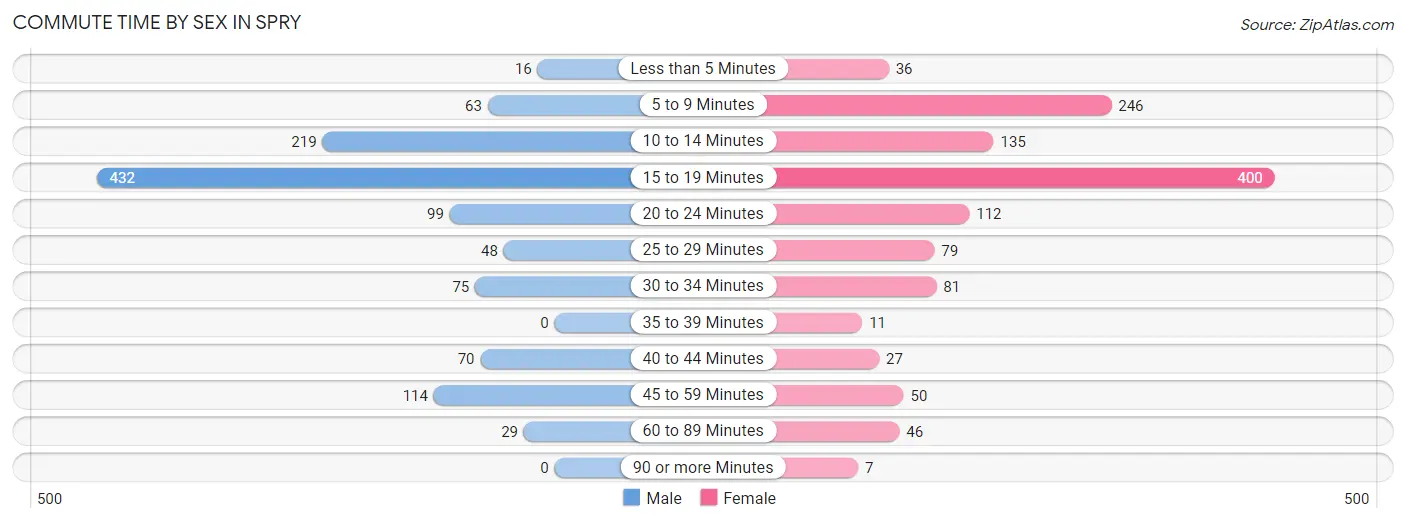
| Commute Time | Male | Female |
| Less than 5 Minutes | 16 (1.4%) | 36 (2.9%) |
| 5 to 9 Minutes | 63 (5.4%) | 246 (20.0%) |
| 10 to 14 Minutes | 219 (18.8%) | 135 (11.0%) |
| 15 to 19 Minutes | 432 (37.1%) | 400 (32.5%) |
| 20 to 24 Minutes | 99 (8.5%) | 112 (9.1%) |
| 25 to 29 Minutes | 48 (4.1%) | 79 (6.4%) |
| 30 to 34 Minutes | 75 (6.4%) | 81 (6.6%) |
| 35 to 39 Minutes | 0 (0.0%) | 11 (0.9%) |
| 40 to 44 Minutes | 70 (6.0%) | 27 (2.2%) |
| 45 to 59 Minutes | 114 (9.8%) | 50 (4.1%) |
| 60 to 89 Minutes | 29 (2.5%) | 46 (3.7%) |
| 90 or more Minutes | 0 (0.0%) | 7 (0.6%) |
Time of Departure to Work by Sex in Spry
The most frequent times of departure to work in Spry are 7:00 AM to 7:29 AM (219, 18.8%) for males and 7:30 AM to 7:59 AM (243, 19.8%) for females.
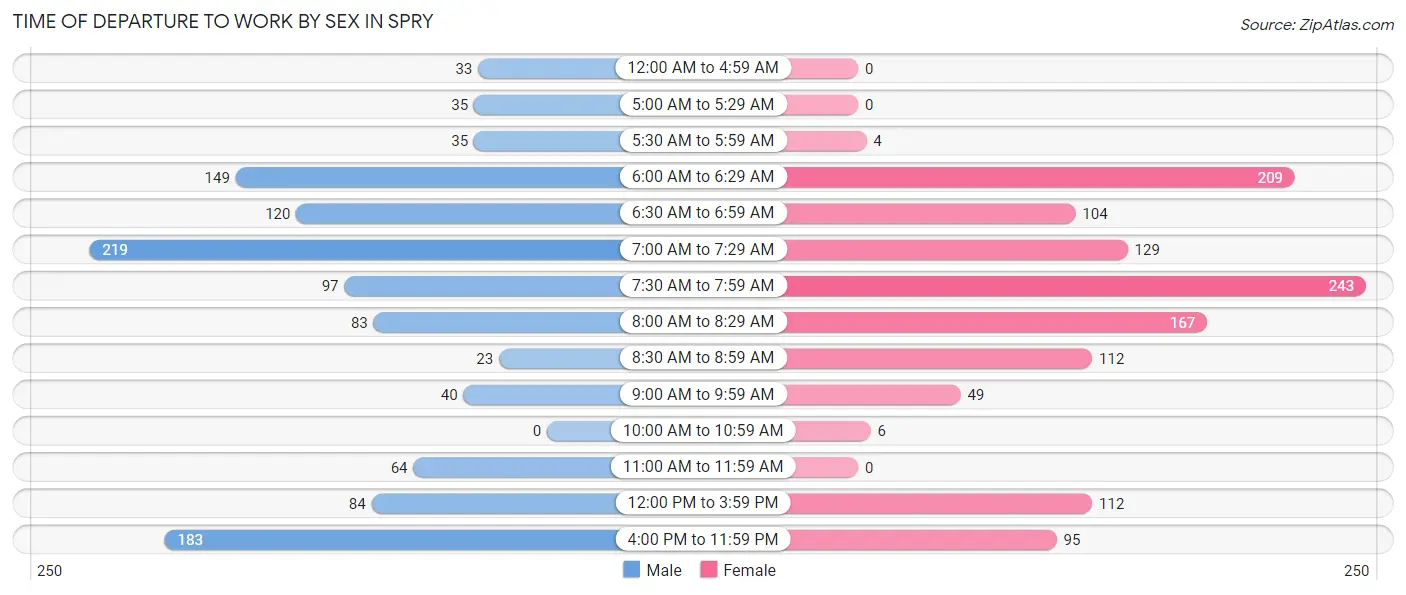
| Time of Departure | Male | Female |
| 12:00 AM to 4:59 AM | 33 (2.8%) | 0 (0.0%) |
| 5:00 AM to 5:29 AM | 35 (3.0%) | 0 (0.0%) |
| 5:30 AM to 5:59 AM | 35 (3.0%) | 4 (0.3%) |
| 6:00 AM to 6:29 AM | 149 (12.8%) | 209 (17.0%) |
| 6:30 AM to 6:59 AM | 120 (10.3%) | 104 (8.5%) |
| 7:00 AM to 7:29 AM | 219 (18.8%) | 129 (10.5%) |
| 7:30 AM to 7:59 AM | 97 (8.3%) | 243 (19.8%) |
| 8:00 AM to 8:29 AM | 83 (7.1%) | 167 (13.6%) |
| 8:30 AM to 8:59 AM | 23 (2.0%) | 112 (9.1%) |
| 9:00 AM to 9:59 AM | 40 (3.4%) | 49 (4.0%) |
| 10:00 AM to 10:59 AM | 0 (0.0%) | 6 (0.5%) |
| 11:00 AM to 11:59 AM | 64 (5.5%) | 0 (0.0%) |
| 12:00 PM to 3:59 PM | 84 (7.2%) | 112 (9.1%) |
| 4:00 PM to 11:59 PM | 183 (15.7%) | 95 (7.7%) |
| Total | 1,165 (100.0%) | 1,230 (100.0%) |
Housing Occupancy in Spry
Occupancy by Ownership in Spry
Of the total 2,008 dwellings in Spry, owner-occupied units account for 1,484 (73.9%), while renter-occupied units make up 524 (26.1%).
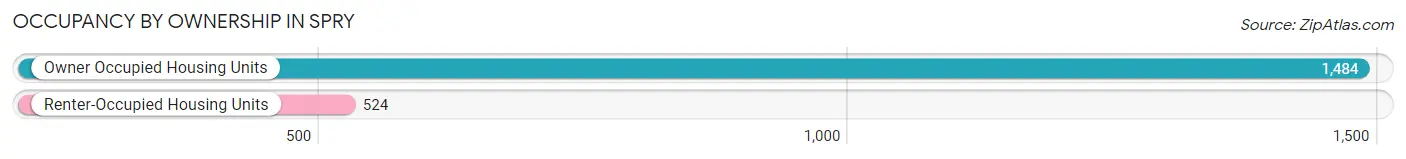
| Occupancy | # Housing Units | % Housing Units |
| Owner Occupied Housing Units | 1,484 | 73.9% |
| Renter-Occupied Housing Units | 524 | 26.1% |
| Total Occupied Housing Units | 2,008 | 100.0% |
Occupancy by Household Size in Spry
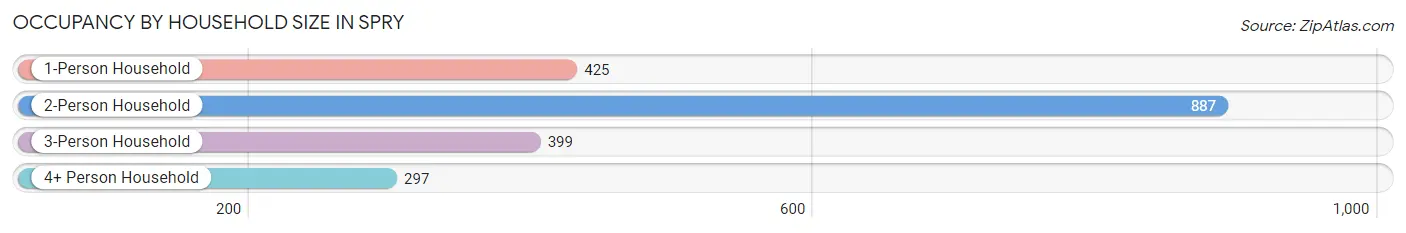
| Household Size | # Housing Units | % Housing Units |
| 1-Person Household | 425 | 21.2% |
| 2-Person Household | 887 | 44.2% |
| 3-Person Household | 399 | 19.9% |
| 4+ Person Household | 297 | 14.8% |
| Total Housing Units | 2,008 | 100.0% |
Occupancy by Ownership by Household Size in Spry
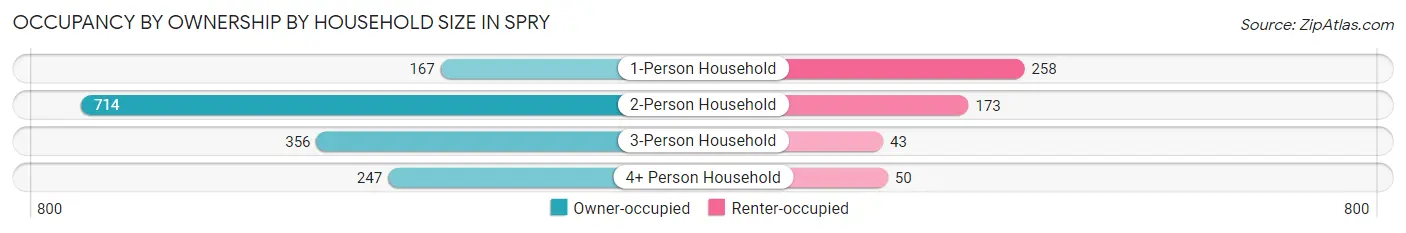
| Household Size | Owner-occupied | Renter-occupied |
| 1-Person Household | 167 (39.3%) | 258 (60.7%) |
| 2-Person Household | 714 (80.5%) | 173 (19.5%) |
| 3-Person Household | 356 (89.2%) | 43 (10.8%) |
| 4+ Person Household | 247 (83.2%) | 50 (16.8%) |
| Total Housing Units | 1,484 (73.9%) | 524 (26.1%) |
Occupancy by Educational Attainment in Spry
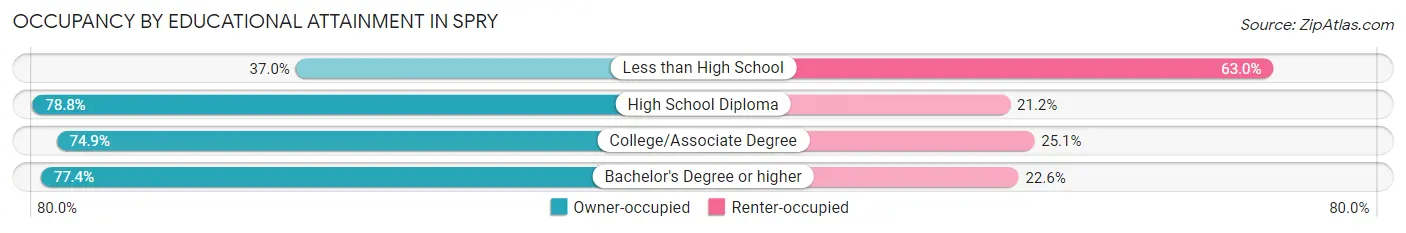
| Household Size | Owner-occupied | Renter-occupied |
| Less than High School | 57 (37.0%) | 97 (63.0%) |
| High School Diploma | 445 (78.8%) | 120 (21.2%) |
| College/Associate Degree | 481 (74.9%) | 161 (25.1%) |
| Bachelor's Degree or higher | 501 (77.4%) | 146 (22.6%) |
Occupancy by Age of Householder in Spry
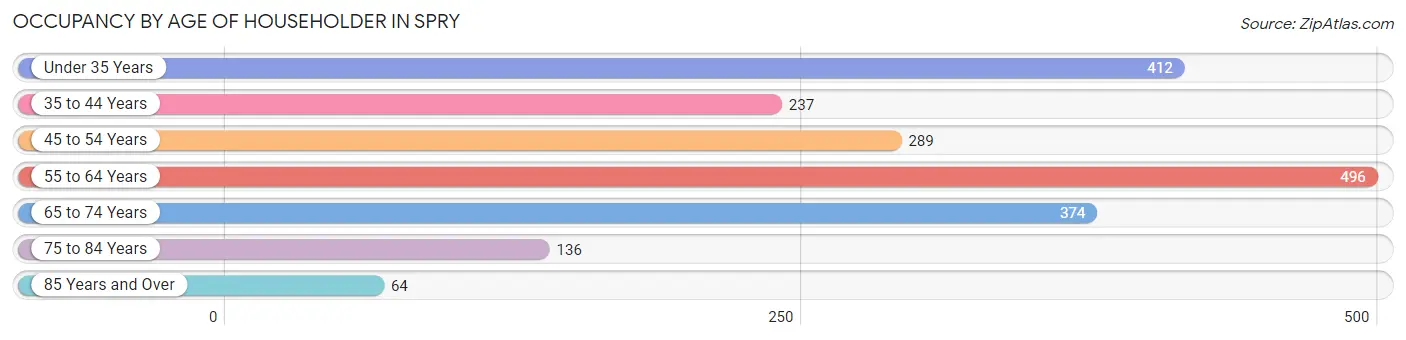
| Age Bracket | # Households | % Households |
| Under 35 Years | 412 | 20.5% |
| 35 to 44 Years | 237 | 11.8% |
| 45 to 54 Years | 289 | 14.4% |
| 55 to 64 Years | 496 | 24.7% |
| 65 to 74 Years | 374 | 18.6% |
| 75 to 84 Years | 136 | 6.8% |
| 85 Years and Over | 64 | 3.2% |
| Total | 2,008 | 100.0% |
Housing Finances in Spry
Median Income by Occupancy in Spry
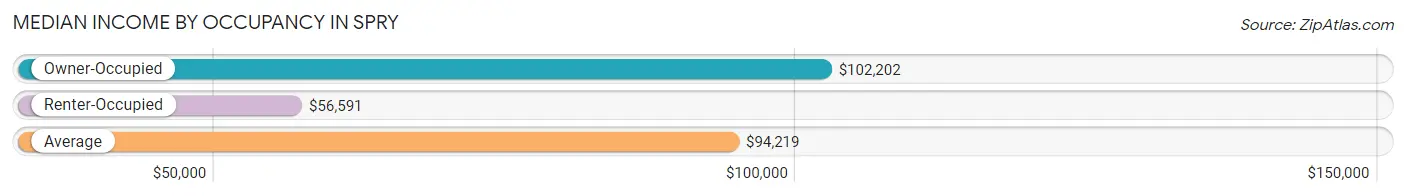
| Occupancy Type | # Households | Median Income |
| Owner-Occupied | 1,484 (73.9%) | $102,202 |
| Renter-Occupied | 524 (26.1%) | $56,591 |
| Average | 2,008 (100.0%) | $94,219 |
Occupancy by Householder Income Bracket in Spry
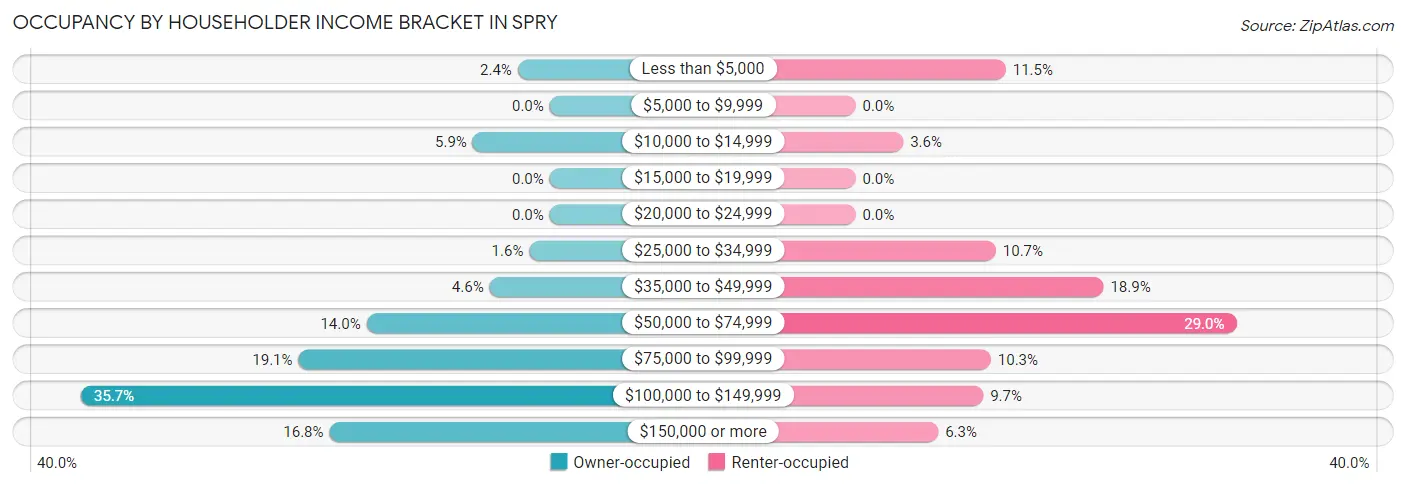
| Income Bracket | Owner-occupied | Renter-occupied |
| Less than $5,000 | 36 (2.4%) | 60 (11.5%) |
| $5,000 to $9,999 | 0 (0.0%) | 0 (0.0%) |
| $10,000 to $14,999 | 87 (5.9%) | 19 (3.6%) |
| $15,000 to $19,999 | 0 (0.0%) | 0 (0.0%) |
| $20,000 to $24,999 | 0 (0.0%) | 0 (0.0%) |
| $25,000 to $34,999 | 23 (1.5%) | 56 (10.7%) |
| $35,000 to $49,999 | 68 (4.6%) | 99 (18.9%) |
| $50,000 to $74,999 | 207 (14.0%) | 152 (29.0%) |
| $75,000 to $99,999 | 284 (19.1%) | 54 (10.3%) |
| $100,000 to $149,999 | 530 (35.7%) | 51 (9.7%) |
| $150,000 or more | 249 (16.8%) | 33 (6.3%) |
| Total | 1,484 (100.0%) | 524 (100.0%) |
Monthly Housing Cost Tiers in Spry
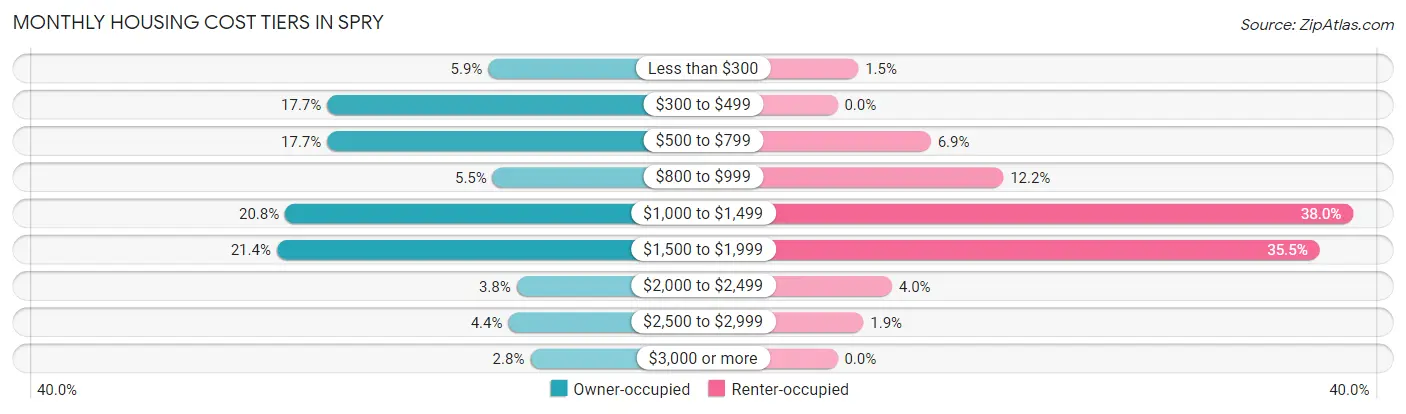
| Monthly Cost | Owner-occupied | Renter-occupied |
| Less than $300 | 87 (5.9%) | 8 (1.5%) |
| $300 to $499 | 263 (17.7%) | 0 (0.0%) |
| $500 to $799 | 263 (17.7%) | 36 (6.9%) |
| $800 to $999 | 82 (5.5%) | 64 (12.2%) |
| $1,000 to $1,499 | 309 (20.8%) | 199 (38.0%) |
| $1,500 to $1,999 | 318 (21.4%) | 186 (35.5%) |
| $2,000 to $2,499 | 56 (3.8%) | 21 (4.0%) |
| $2,500 to $2,999 | 65 (4.4%) | 10 (1.9%) |
| $3,000 or more | 41 (2.8%) | 0 (0.0%) |
| Total | 1,484 (100.0%) | 524 (100.0%) |
Physical Housing Characteristics in Spry
Housing Structures in Spry
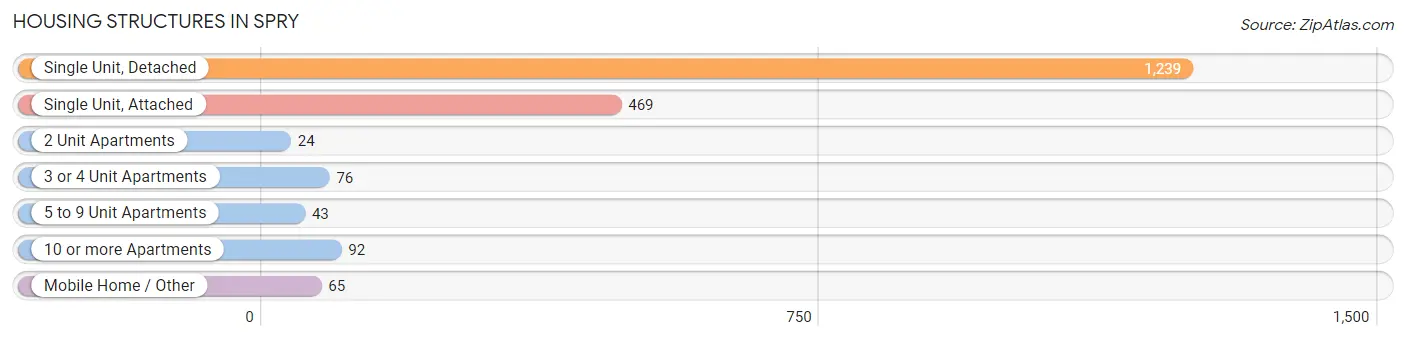
| Structure Type | # Housing Units | % Housing Units |
| Single Unit, Detached | 1,239 | 61.7% |
| Single Unit, Attached | 469 | 23.4% |
| 2 Unit Apartments | 24 | 1.2% |
| 3 or 4 Unit Apartments | 76 | 3.8% |
| 5 to 9 Unit Apartments | 43 | 2.1% |
| 10 or more Apartments | 92 | 4.6% |
| Mobile Home / Other | 65 | 3.2% |
| Total | 2,008 | 100.0% |
Housing Structures by Occupancy in Spry
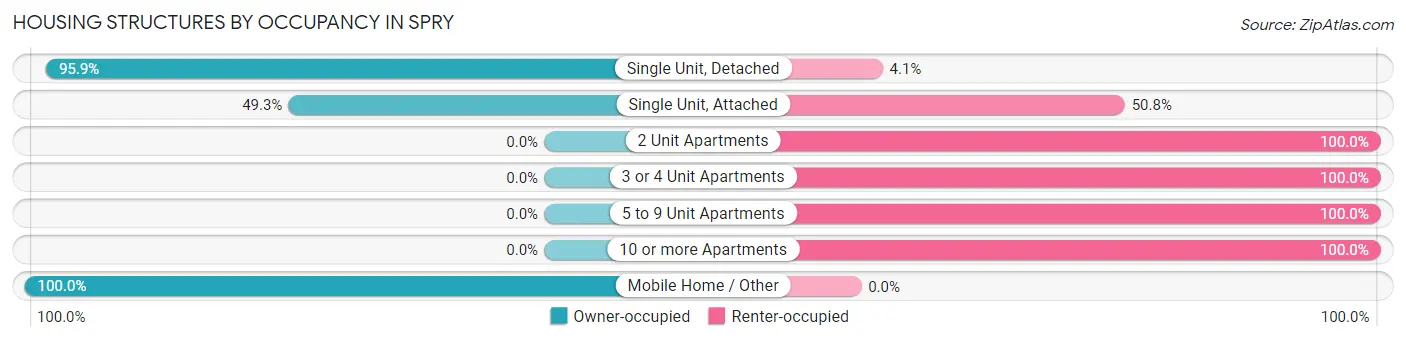
| Structure Type | Owner-occupied | Renter-occupied |
| Single Unit, Detached | 1,188 (95.9%) | 51 (4.1%) |
| Single Unit, Attached | 231 (49.2%) | 238 (50.7%) |
| 2 Unit Apartments | 0 (0.0%) | 24 (100.0%) |
| 3 or 4 Unit Apartments | 0 (0.0%) | 76 (100.0%) |
| 5 to 9 Unit Apartments | 0 (0.0%) | 43 (100.0%) |
| 10 or more Apartments | 0 (0.0%) | 92 (100.0%) |
| Mobile Home / Other | 65 (100.0%) | 0 (0.0%) |
| Total | 1,484 (73.9%) | 524 (26.1%) |
Housing Structures by Number of Rooms in Spry
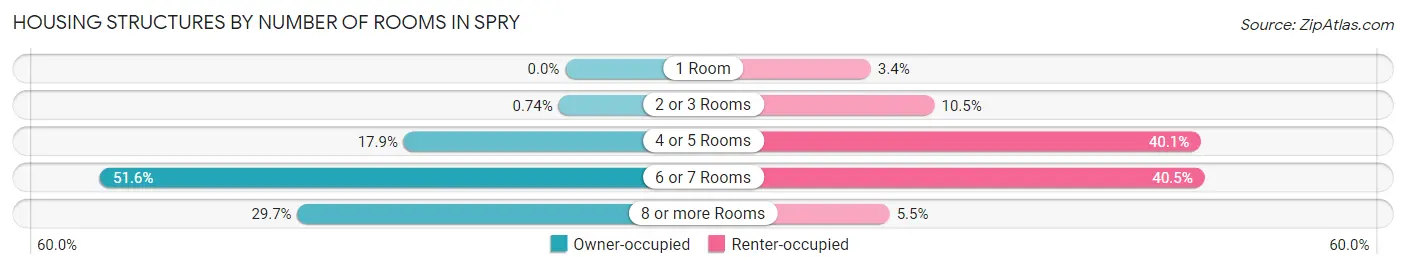
| Number of Rooms | Owner-occupied | Renter-occupied |
| 1 Room | 0 (0.0%) | 18 (3.4%) |
| 2 or 3 Rooms | 11 (0.7%) | 55 (10.5%) |
| 4 or 5 Rooms | 266 (17.9%) | 210 (40.1%) |
| 6 or 7 Rooms | 766 (51.6%) | 212 (40.5%) |
| 8 or more Rooms | 441 (29.7%) | 29 (5.5%) |
| Total | 1,484 (100.0%) | 524 (100.0%) |
Housing Structure by Heating Type in Spry
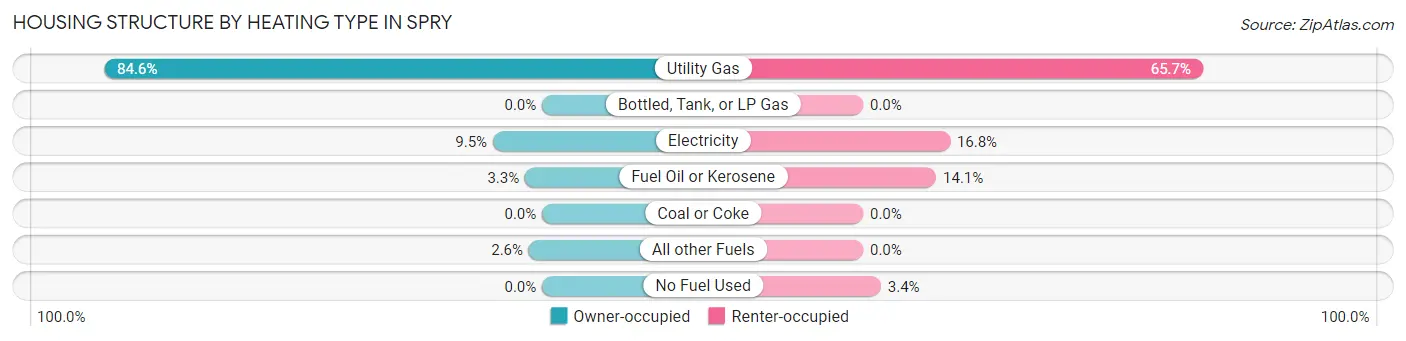
| Heating Type | Owner-occupied | Renter-occupied |
| Utility Gas | 1,256 (84.6%) | 344 (65.6%) |
| Bottled, Tank, or LP Gas | 0 (0.0%) | 0 (0.0%) |
| Electricity | 141 (9.5%) | 88 (16.8%) |
| Fuel Oil or Kerosene | 49 (3.3%) | 74 (14.1%) |
| Coal or Coke | 0 (0.0%) | 0 (0.0%) |
| All other Fuels | 38 (2.6%) | 0 (0.0%) |
| No Fuel Used | 0 (0.0%) | 18 (3.4%) |
| Total | 1,484 (100.0%) | 524 (100.0%) |
Household Vehicle Usage in Spry
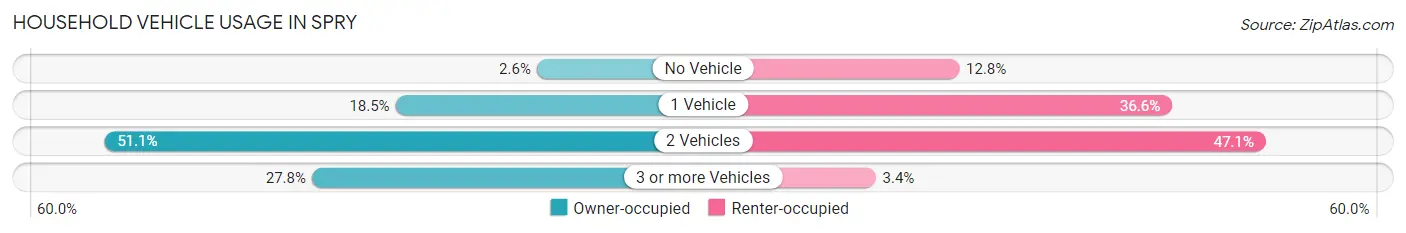
| Vehicles per Household | Owner-occupied | Renter-occupied |
| No Vehicle | 39 (2.6%) | 67 (12.8%) |
| 1 Vehicle | 274 (18.5%) | 192 (36.6%) |
| 2 Vehicles | 758 (51.1%) | 247 (47.1%) |
| 3 or more Vehicles | 413 (27.8%) | 18 (3.4%) |
| Total | 1,484 (100.0%) | 524 (100.0%) |
Real Estate & Mortgages in Spry
Real Estate and Mortgage Overview in Spry
| Characteristic | Without Mortgage | With Mortgage |
| Housing Units | 747 | 737 |
| Median Property Value | $219,800 | $210,100 |
| Median Household Income | $95,069 | $204 |
| Monthly Housing Costs | $605 | $41 |
| Real Estate Taxes | $4,239 | $17 |
Property Value by Mortgage Status in Spry
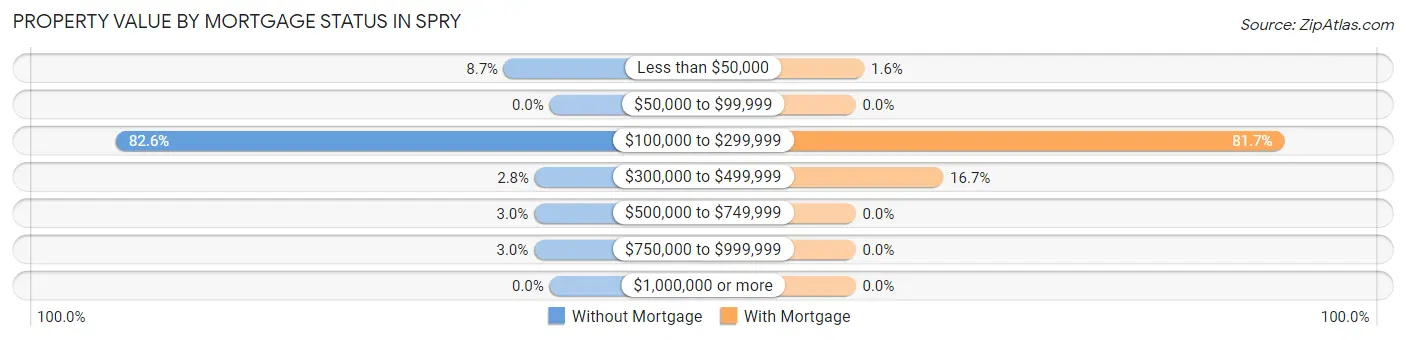
| Property Value | Without Mortgage | With Mortgage |
| Less than $50,000 | 65 (8.7%) | 12 (1.6%) |
| $50,000 to $99,999 | 0 (0.0%) | 0 (0.0%) |
| $100,000 to $299,999 | 617 (82.6%) | 602 (81.7%) |
| $300,000 to $499,999 | 21 (2.8%) | 123 (16.7%) |
| $500,000 to $749,999 | 22 (2.9%) | 0 (0.0%) |
| $750,000 to $999,999 | 22 (2.9%) | 0 (0.0%) |
| $1,000,000 or more | 0 (0.0%) | 0 (0.0%) |
| Total | 747 (100.0%) | 737 (100.0%) |
Household Income by Mortgage Status in Spry
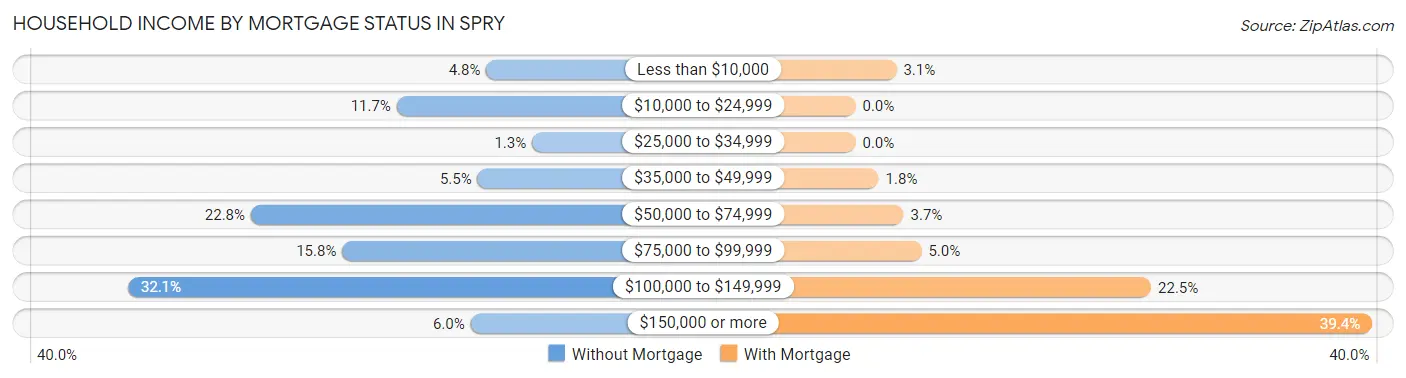
| Household Income | Without Mortgage | With Mortgage |
| Less than $10,000 | 36 (4.8%) | 23 (3.1%) |
| $10,000 to $24,999 | 87 (11.7%) | 0 (0.0%) |
| $25,000 to $34,999 | 10 (1.3%) | 0 (0.0%) |
| $35,000 to $49,999 | 41 (5.5%) | 13 (1.8%) |
| $50,000 to $74,999 | 170 (22.8%) | 27 (3.7%) |
| $75,000 to $99,999 | 118 (15.8%) | 37 (5.0%) |
| $100,000 to $149,999 | 240 (32.1%) | 166 (22.5%) |
| $150,000 or more | 45 (6.0%) | 290 (39.4%) |
| Total | 747 (100.0%) | 737 (100.0%) |
Property Value to Household Income Ratio in Spry
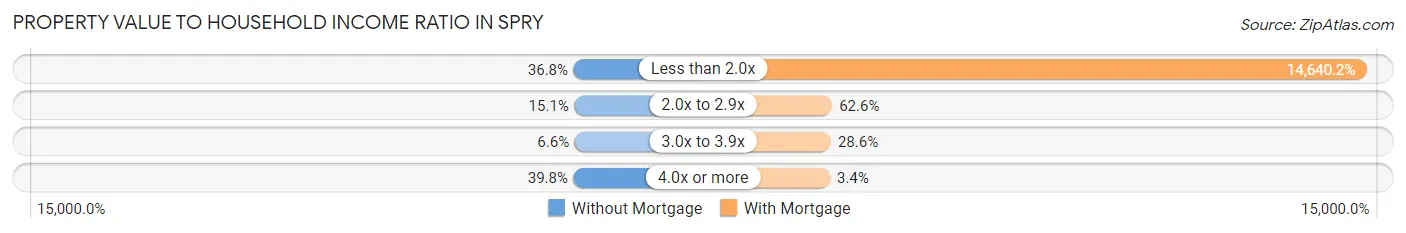
| Value-to-Income Ratio | Without Mortgage | With Mortgage |
| Less than 2.0x | 275 (36.8%) | 107,898 (14,640.2%) |
| 2.0x to 2.9x | 113 (15.1%) | 461 (62.5%) |
| 3.0x to 3.9x | 49 (6.6%) | 211 (28.6%) |
| 4.0x or more | 297 (39.8%) | 25 (3.4%) |
| Total | 747 (100.0%) | 737 (100.0%) |
Real Estate Taxes by Mortgage Status in Spry
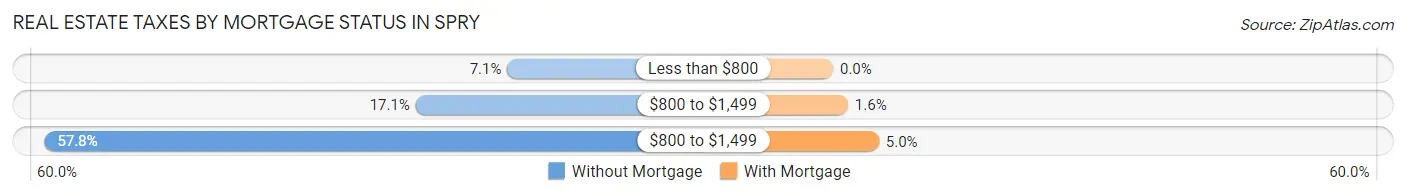
| Property Taxes | Without Mortgage | With Mortgage |
| Less than $800 | 53 (7.1%) | 0 (0.0%) |
| $800 to $1,499 | 128 (17.1%) | 12 (1.6%) |
| $800 to $1,499 | 432 (57.8%) | 37 (5.0%) |
| Total | 747 (100.0%) | 737 (100.0%) |
Health & Disability in Spry
Health Insurance Coverage by Age in Spry
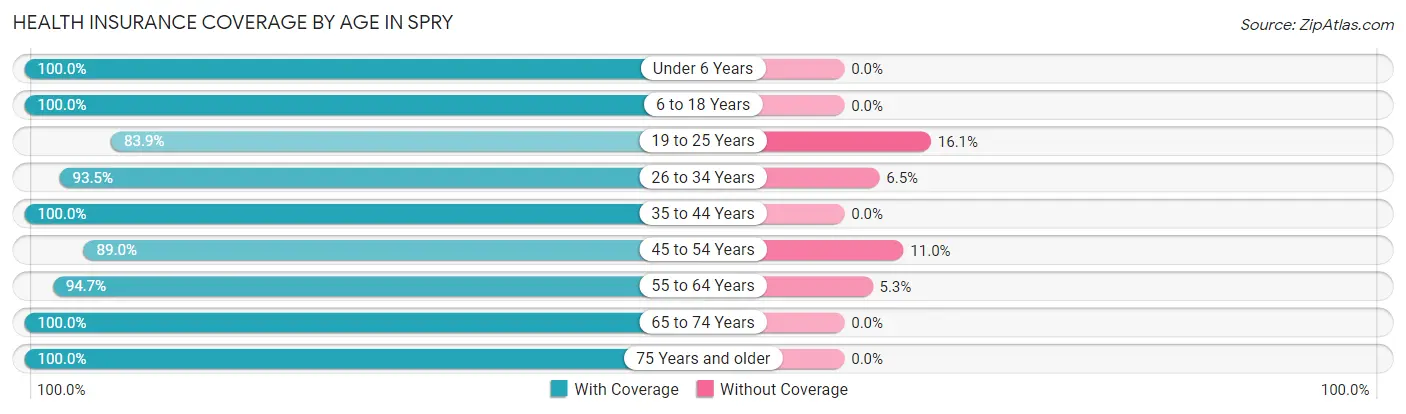
| Age Bracket | With Coverage | Without Coverage |
| Under 6 Years | 305 (100.0%) | 0 (0.0%) |
| 6 to 18 Years | 593 (100.0%) | 0 (0.0%) |
| 19 to 25 Years | 291 (83.9%) | 56 (16.1%) |
| 26 to 34 Years | 614 (93.5%) | 43 (6.5%) |
| 35 to 44 Years | 515 (100.0%) | 0 (0.0%) |
| 45 to 54 Years | 452 (89.0%) | 56 (11.0%) |
| 55 to 64 Years | 880 (94.7%) | 49 (5.3%) |
| 65 to 74 Years | 588 (100.0%) | 0 (0.0%) |
| 75 Years and older | 312 (100.0%) | 0 (0.0%) |
| Total | 4,550 (95.7%) | 204 (4.3%) |
Health Insurance Coverage by Citizenship Status in Spry
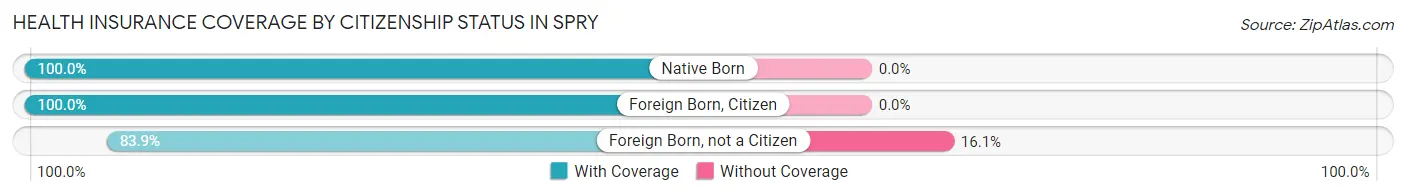
| Citizenship Status | With Coverage | Without Coverage |
| Native Born | 305 (100.0%) | 0 (0.0%) |
| Foreign Born, Citizen | 593 (100.0%) | 0 (0.0%) |
| Foreign Born, not a Citizen | 291 (83.9%) | 56 (16.1%) |
Health Insurance Coverage by Household Income in Spry
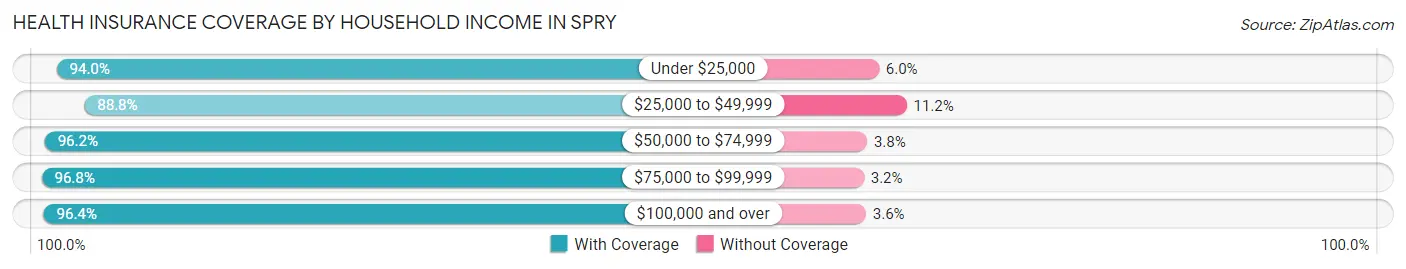
| Household Income | With Coverage | Without Coverage |
| Under $25,000 | 282 (94.0%) | 18 (6.0%) |
| $25,000 to $49,999 | 341 (88.8%) | 43 (11.2%) |
| $50,000 to $74,999 | 815 (96.2%) | 32 (3.8%) |
| $75,000 to $99,999 | 883 (96.8%) | 29 (3.2%) |
| $100,000 and over | 2,216 (96.4%) | 82 (3.6%) |
Public vs Private Health Insurance Coverage by Age in Spry
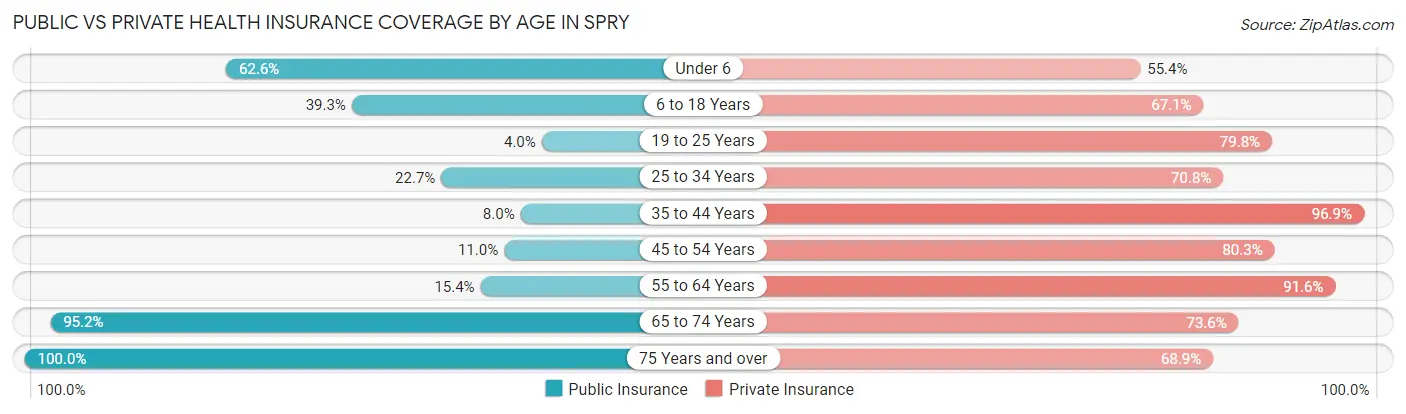
| Age Bracket | Public Insurance | Private Insurance |
| Under 6 | 191 (62.6%) | 169 (55.4%) |
| 6 to 18 Years | 233 (39.3%) | 398 (67.1%) |
| 19 to 25 Years | 14 (4.0%) | 277 (79.8%) |
| 25 to 34 Years | 149 (22.7%) | 465 (70.8%) |
| 35 to 44 Years | 41 (8.0%) | 499 (96.9%) |
| 45 to 54 Years | 56 (11.0%) | 408 (80.3%) |
| 55 to 64 Years | 143 (15.4%) | 851 (91.6%) |
| 65 to 74 Years | 560 (95.2%) | 433 (73.6%) |
| 75 Years and over | 312 (100.0%) | 215 (68.9%) |
| Total | 1,699 (35.7%) | 3,715 (78.1%) |
Disability Status by Sex by Age in Spry
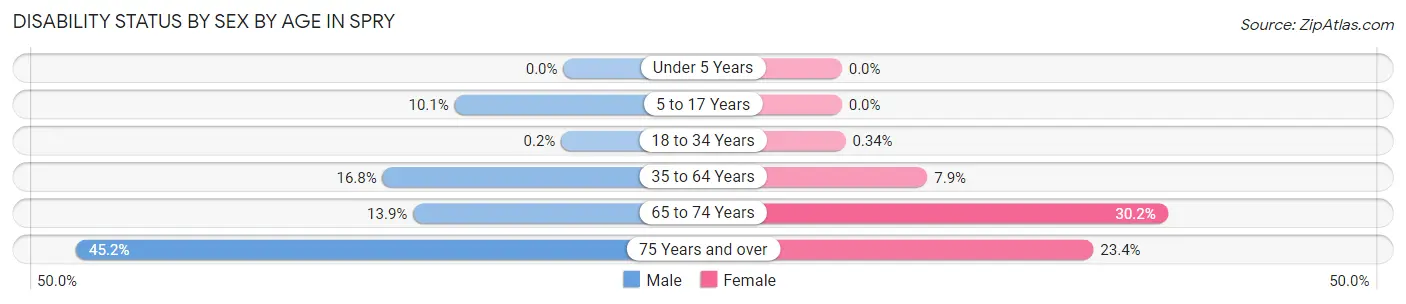
| Age Bracket | Male | Female |
| Under 5 Years | 0 (0.0%) | 0 (0.0%) |
| 5 to 17 Years | 30 (10.1%) | 0 (0.0%) |
| 18 to 34 Years | 1 (0.2%) | 2 (0.3%) |
| 35 to 64 Years | 148 (16.8%) | 85 (7.9%) |
| 65 to 74 Years | 40 (13.9%) | 91 (30.2%) |
| 75 Years and over | 52 (45.2%) | 46 (23.4%) |
Disability Class by Sex by Age in Spry
Disability Class: Hearing Difficulty
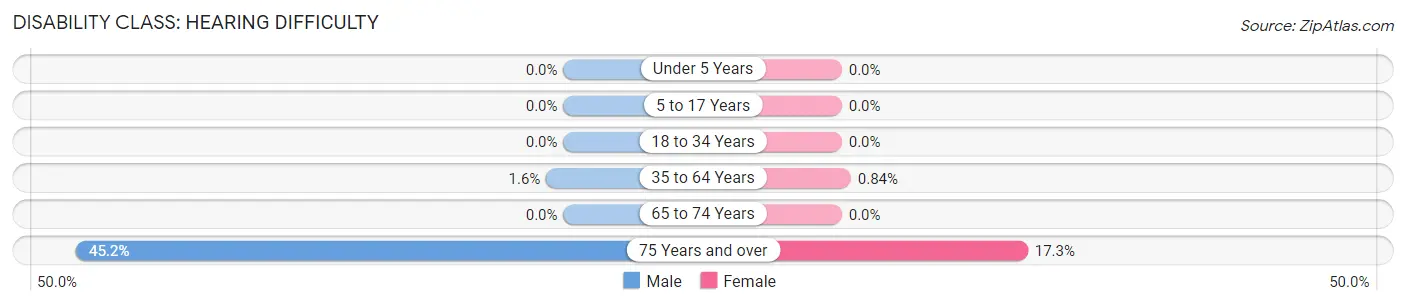
| Age Bracket | Male | Female |
| Under 5 Years | 0 (0.0%) | 0 (0.0%) |
| 5 to 17 Years | 0 (0.0%) | 0 (0.0%) |
| 18 to 34 Years | 0 (0.0%) | 0 (0.0%) |
| 35 to 64 Years | 14 (1.6%) | 9 (0.8%) |
| 65 to 74 Years | 0 (0.0%) | 0 (0.0%) |
| 75 Years and over | 52 (45.2%) | 34 (17.3%) |
Disability Class: Vision Difficulty
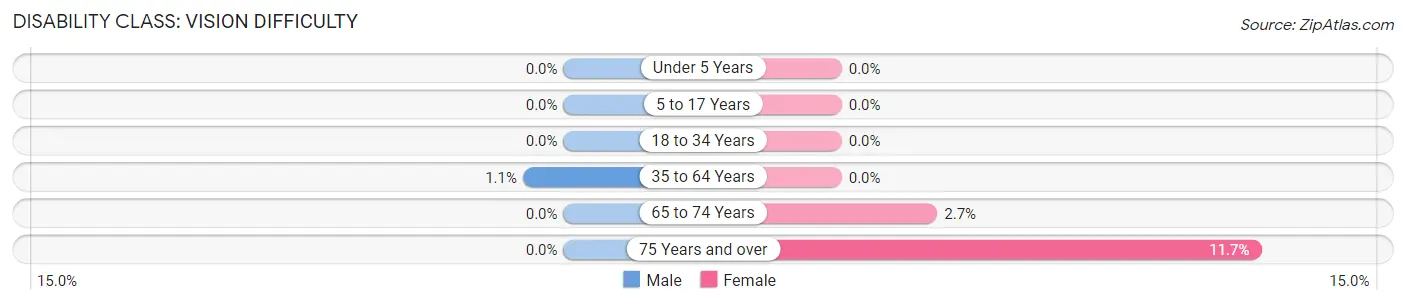
| Age Bracket | Male | Female |
| Under 5 Years | 0 (0.0%) | 0 (0.0%) |
| 5 to 17 Years | 0 (0.0%) | 0 (0.0%) |
| 18 to 34 Years | 0 (0.0%) | 0 (0.0%) |
| 35 to 64 Years | 10 (1.1%) | 0 (0.0%) |
| 65 to 74 Years | 0 (0.0%) | 8 (2.7%) |
| 75 Years and over | 0 (0.0%) | 23 (11.7%) |
Disability Class: Cognitive Difficulty
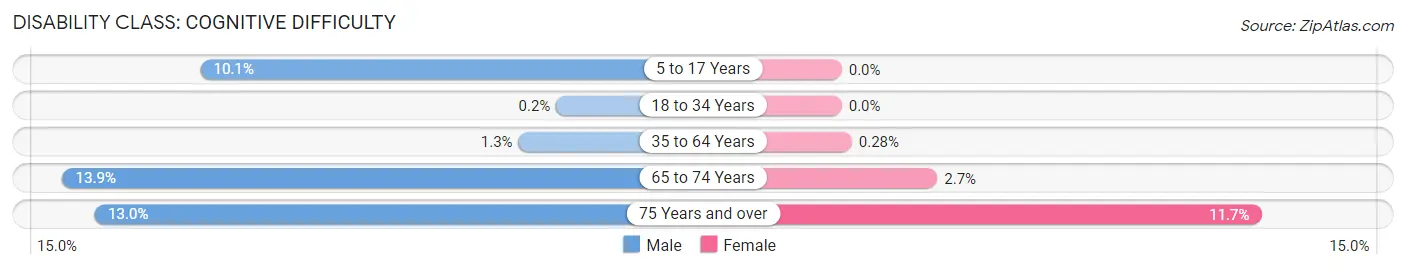
| Age Bracket | Male | Female |
| 5 to 17 Years | 30 (10.1%) | 0 (0.0%) |
| 18 to 34 Years | 1 (0.2%) | 0 (0.0%) |
| 35 to 64 Years | 11 (1.3%) | 3 (0.3%) |
| 65 to 74 Years | 40 (13.9%) | 8 (2.7%) |
| 75 Years and over | 15 (13.0%) | 23 (11.7%) |
Disability Class: Ambulatory Difficulty
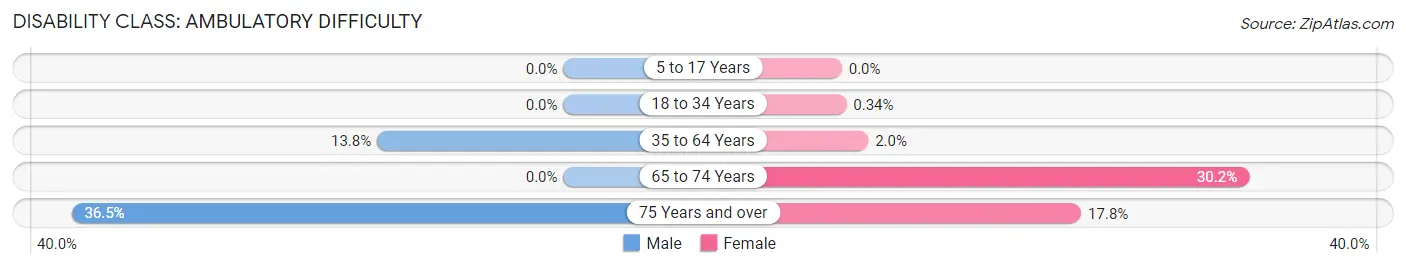
| Age Bracket | Male | Female |
| 5 to 17 Years | 0 (0.0%) | 0 (0.0%) |
| 18 to 34 Years | 0 (0.0%) | 2 (0.3%) |
| 35 to 64 Years | 122 (13.8%) | 21 (2.0%) |
| 65 to 74 Years | 0 (0.0%) | 91 (30.2%) |
| 75 Years and over | 42 (36.5%) | 35 (17.8%) |
Disability Class: Self-Care Difficulty
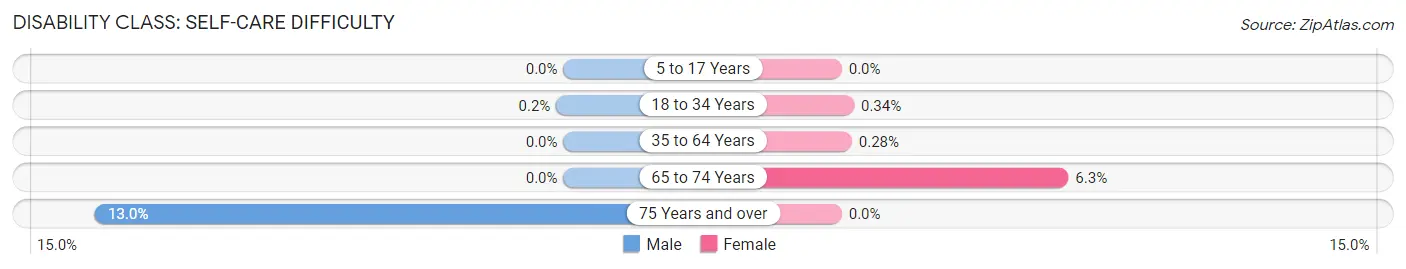
| Age Bracket | Male | Female |
| 5 to 17 Years | 0 (0.0%) | 0 (0.0%) |
| 18 to 34 Years | 1 (0.2%) | 2 (0.3%) |
| 35 to 64 Years | 0 (0.0%) | 3 (0.3%) |
| 65 to 74 Years | 0 (0.0%) | 19 (6.3%) |
| 75 Years and over | 15 (13.0%) | 0 (0.0%) |
Technology Access in Spry
Computing Device Access in Spry
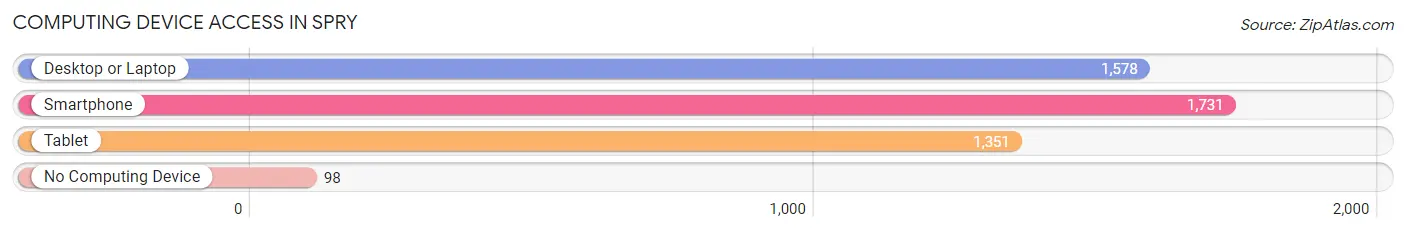
| Device Type | # Households | % Households |
| Desktop or Laptop | 1,578 | 78.6% |
| Smartphone | 1,731 | 86.2% |
| Tablet | 1,351 | 67.3% |
| No Computing Device | 98 | 4.9% |
| Total | 2,008 | 100.0% |
Internet Access in Spry
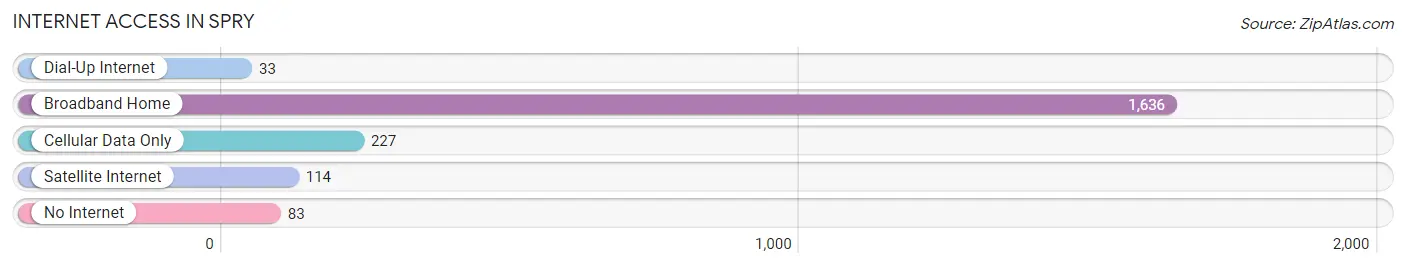
| Internet Type | # Households | % Households |
| Dial-Up Internet | 33 | 1.6% |
| Broadband Home | 1,636 | 81.5% |
| Cellular Data Only | 227 | 11.3% |
| Satellite Internet | 114 | 5.7% |
| No Internet | 83 | 4.1% |
| Total | 2,008 | 100.0% |
Spry Summary
Spry is a small borough located in York County, Pennsylvania. It is situated in the southeastern corner of the county, just north of the Susquehanna River. The population of Spry was 1,845 as of the 2010 census.
History
Spry was first settled in 1750 by a group of German immigrants. The town was originally known as “Spry’s Corner” and was named after the Spry family who owned the land. The town was officially incorporated in 1851.
In the late 19th century, Spry was a thriving agricultural community. The town was known for its production of apples, peaches, and other fruits. The town also had a number of mills, including a grist mill, a saw mill, and a woolen mill.
In the early 20th century, Spry began to experience a decline in population as many of its residents moved away in search of better economic opportunities. The town’s population dropped from 1,845 in 1910 to 1,619 in 1930.
Geography
Spry is located at 40°2'17" North, 76°37'17" West (40.038, -76.621). The borough has a total area of 0.7 square miles, all of which is land.
The borough is located in the Piedmont region of Pennsylvania. The terrain is mostly flat, with some rolling hills. The climate is humid continental, with hot summers and cold winters.
Economy
The economy of Spry is largely based on agriculture. The town is known for its production of apples, peaches, and other fruits. The town also has a number of small businesses, including a grocery store, a hardware store, and a few restaurants.
Demographics
As of the 2010 census, the population of Spry was 1,845. The racial makeup of the borough was 95.3% White, 1.2% African American, 0.2% Native American, 0.7% Asian, 0.1% Pacific Islander, 0.7% from other races, and 1.9% from two or more races. Hispanic or Latino of any race were 2.2% of the population.
The median household income in Spry was $45,938, and the median family income was $51,250. The per capita income for the borough was $20,945. About 8.3% of families and 10.2% of the population were below the poverty line, including 14.2% of those under age 18 and 5.2% of those age 65 or over.
Common Questions
What is Per Capita Income in Spry?
Per Capita income in Spry is $39,080.
What is the Median Family Income in Spry?
Median Family Income in Spry is $100,236.
What is the Median Household income in Spry?
Median Household Income in Spry is $94,219.
What is Income or Wage Gap in Spry?
Income or Wage Gap in Spry is 42.7%.
Women in Spry earn 57.3 cents for every dollar earned by a man.
What is Inequality or Gini Index in Spry?
Inequality or Gini Index in Spry is 0.35.
What is the Total Population of Spry?
Total Population of Spry is 4,760.
What is the Total Male Population of Spry?
Total Male Population of Spry is 2,141.
What is the Total Female Population of Spry?
Total Female Population of Spry is 2,619.
What is the Ratio of Males per 100 Females in Spry?
There are 81.75 Males per 100 Females in Spry.
What is the Ratio of Females per 100 Males in Spry?
There are 122.33 Females per 100 Males in Spry.
What is the Median Population Age in Spry?
Median Population Age in Spry is 43.9 Years.
What is the Average Family Size in Spry
Average Family Size in Spry is 2.7 People.
What is the Average Household Size in Spry
Average Household Size in Spry is 2.4 People.
How Large is the Labor Force in Spry?
There are 2,774 People in the Labor Forcein in Spry.
What is the Percentage of People in the Labor Force in Spry?
69.1% of People are in the Labor Force in Spry.
What is the Unemployment Rate in Spry?
Unemployment Rate in Spry is 4.5%.