Southwest Greensburg borough, PA Map & Demographics
Southwest Greensburg borough Overview
$37,820
PER CAPITA INCOME
$70,750
AVG FAMILY INCOME
$54,318
AVG HOUSEHOLD INCOME
29.2%
WAGE / INCOME GAP [ % ]
70.8¢/ $1
WAGE / INCOME GAP [ $ ]
0.47
INEQUALITY / GINI INDEX
2,012
TOTAL POPULATION
958
MALE POPULATION
1,054
FEMALE POPULATION
90.89
MALES / 100 FEMALES
110.02
FEMALES / 100 MALES
43.9
MEDIAN AGE
2.6
AVG FAMILY SIZE
2.0
AVG HOUSEHOLD SIZE
1,123
LABOR FORCE [ PEOPLE ]
63.6%
PERCENT IN LABOR FORCE
4.8%
UNEMPLOYMENT RATE
Income in Southwest Greensburg borough
Income Overview in Southwest Greensburg borough
Per Capita Income in Southwest Greensburg borough is $37,820, while median incomes of families and households are $70,750 and $54,318 respectively.
| Characteristic | Number | Measure |
| Per Capita Income | 2,012 | $37,820 |
| Median Family Income | 561 | $70,750 |
| Mean Family Income | 561 | $81,179 |
| Median Household Income | 1,004 | $54,318 |
| Mean Household Income | 1,004 | $75,111 |
| Income Deficit | 561 | $0 |
| Wage / Income Gap (%) | 2,012 | 29.22% |
| Wage / Income Gap ($) | 2,012 | 70.78¢ per $1 |
| Gini / Inequality Index | 2,012 | 0.47 |
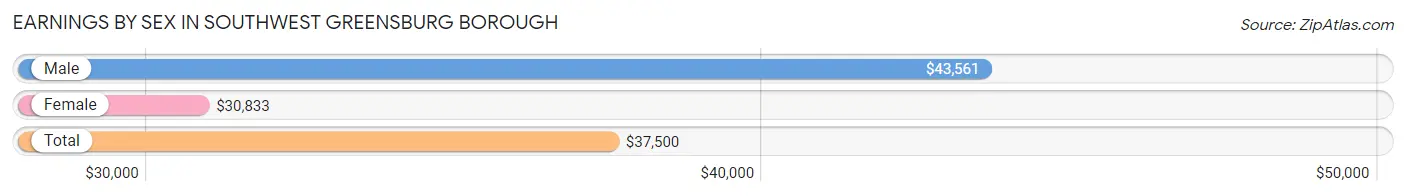
Earnings by Sex in Southwest Greensburg borough
Average Earnings in Southwest Greensburg borough are $37,500, $43,561 for men and $30,833 for women, a difference of 29.2%.
| Sex | Number | Average Earnings |
| Male | 622 (53.4%) | $43,561 |
| Female | 542 (46.6%) | $30,833 |
| Total | 1,164 (100.0%) | $37,500 |
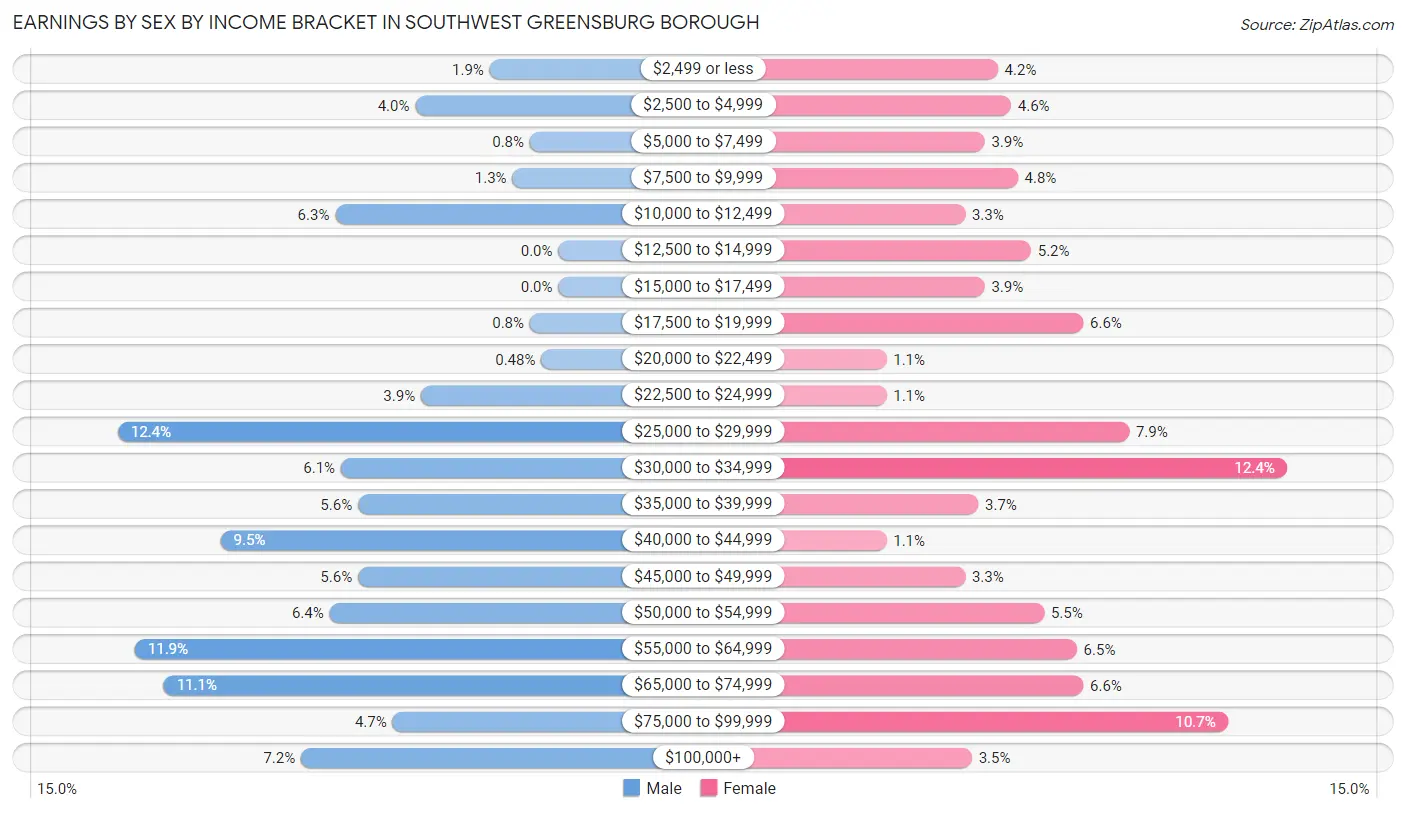
Earnings by Sex by Income Bracket in Southwest Greensburg borough
The most common earnings brackets in Southwest Greensburg borough are $25,000 to $29,999 for men (77 | 12.4%) and $30,000 to $34,999 for women (67 | 12.4%).
| Income | Male | Female |
| $2,499 or less | 12 (1.9%) | 23 (4.2%) |
| $2,500 to $4,999 | 25 (4.0%) | 25 (4.6%) |
| $5,000 to $7,499 | 5 (0.8%) | 21 (3.9%) |
| $7,500 to $9,999 | 8 (1.3%) | 26 (4.8%) |
| $10,000 to $12,499 | 39 (6.3%) | 18 (3.3%) |
| $12,500 to $14,999 | 0 (0.0%) | 28 (5.2%) |
| $15,000 to $17,499 | 0 (0.0%) | 21 (3.9%) |
| $17,500 to $19,999 | 5 (0.8%) | 36 (6.6%) |
| $20,000 to $22,499 | 3 (0.5%) | 6 (1.1%) |
| $22,500 to $24,999 | 24 (3.9%) | 6 (1.1%) |
| $25,000 to $29,999 | 77 (12.4%) | 43 (7.9%) |
| $30,000 to $34,999 | 38 (6.1%) | 67 (12.4%) |
| $35,000 to $39,999 | 35 (5.6%) | 20 (3.7%) |
| $40,000 to $44,999 | 59 (9.5%) | 6 (1.1%) |
| $45,000 to $49,999 | 35 (5.6%) | 18 (3.3%) |
| $50,000 to $54,999 | 40 (6.4%) | 30 (5.5%) |
| $55,000 to $64,999 | 74 (11.9%) | 35 (6.5%) |
| $65,000 to $74,999 | 69 (11.1%) | 36 (6.6%) |
| $75,000 to $99,999 | 29 (4.7%) | 58 (10.7%) |
| $100,000+ | 45 (7.2%) | 19 (3.5%) |
| Total | 622 (100.0%) | 542 (100.0%) |
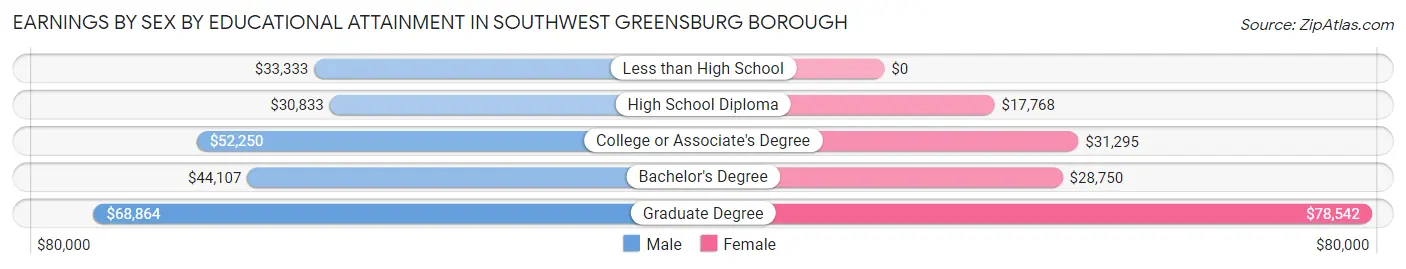
Earnings by Sex by Educational Attainment in Southwest Greensburg borough
Average earnings in Southwest Greensburg borough are $45,000 for men and $31,719 for women, a difference of 29.5%. Men with an educational attainment of graduate degree enjoy the highest average annual earnings of $68,864, while those with high school diploma education earn the least with $30,833. Women with an educational attainment of graduate degree earn the most with the average annual earnings of $78,542, while those with high school diploma education have the smallest earnings of $17,768.
| Educational Attainment | Male Income | Female Income |
| Less than High School | $33,333 | $0 |
| High School Diploma | $30,833 | $17,768 |
| College or Associate's Degree | $52,250 | $31,295 |
| Bachelor's Degree | $44,107 | $28,750 |
| Graduate Degree | $68,864 | $78,542 |
| Total | $45,000 | $31,719 |
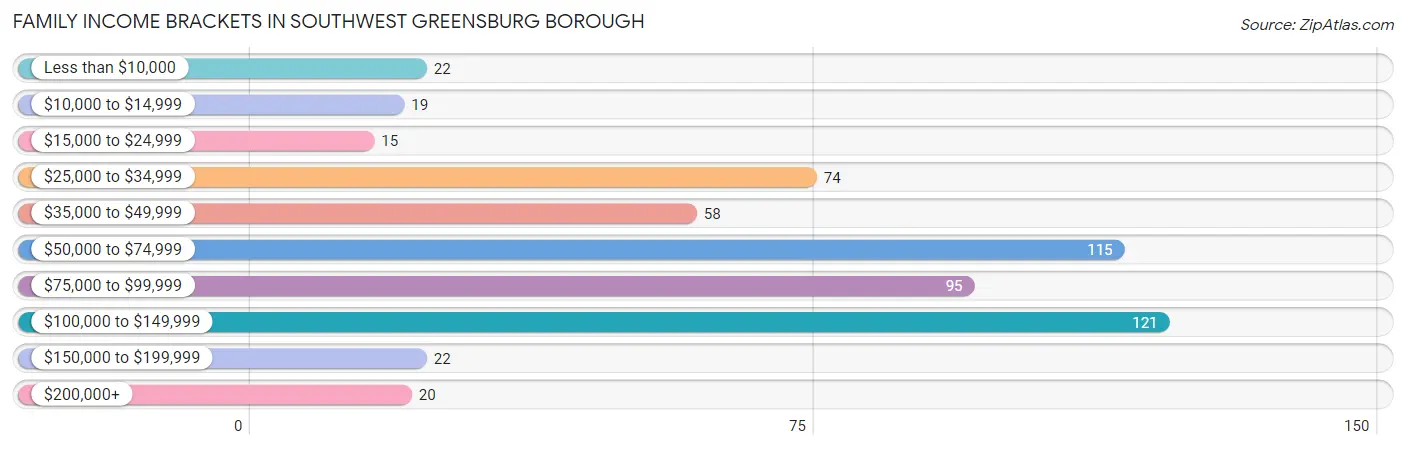
Family Income in Southwest Greensburg borough
Family Income Brackets in Southwest Greensburg borough
According to the Southwest Greensburg borough family income data, there are 121 families falling into the $100,000 to $149,999 income range, which is the most common income bracket and makes up 21.6% of all families. Conversely, the $15,000 to $24,999 income bracket is the least frequent group with only 15 families (2.7%) belonging to this category.
| Income Bracket | # Families | % Families |
| Less than $10,000 | 22 | 3.9% |
| $10,000 to $14,999 | 19 | 3.4% |
| $15,000 to $24,999 | 15 | 2.7% |
| $25,000 to $34,999 | 74 | 13.2% |
| $35,000 to $49,999 | 58 | 10.3% |
| $50,000 to $74,999 | 115 | 20.5% |
| $75,000 to $99,999 | 95 | 16.9% |
| $100,000 to $149,999 | 121 | 21.6% |
| $150,000 to $199,999 | 22 | 3.9% |
| $200,000+ | 20 | 3.6% |
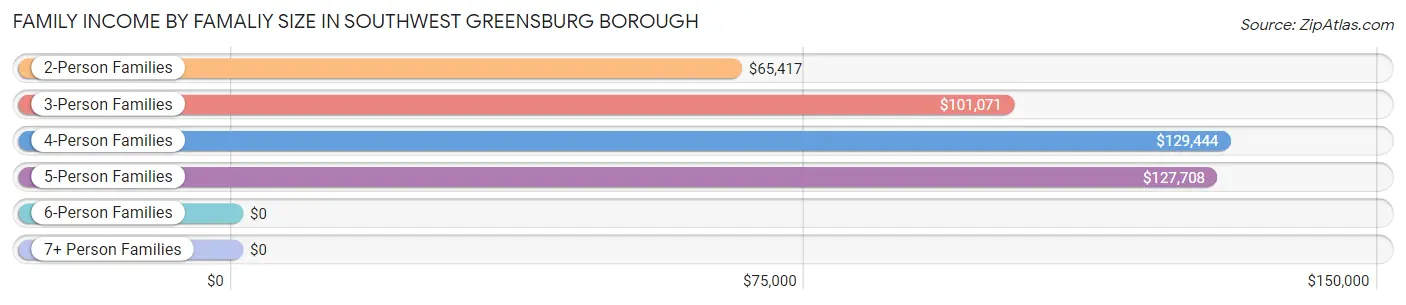
Family Income by Famaliy Size in Southwest Greensburg borough
4-person families (68 | 12.1%) account for the highest median family income in Southwest Greensburg borough with $129,444 per family, while 3-person families (84 | 15.0%) have the highest median income of $33,690 per family member.
| Income Bracket | # Families | Median Income |
| 2-Person Families | 376 (67.0%) | $65,417 |
| 3-Person Families | 84 (15.0%) | $101,071 |
| 4-Person Families | 68 (12.1%) | $129,444 |
| 5-Person Families | 33 (5.9%) | $127,708 |
| 6-Person Families | 0 (0.0%) | $0 |
| 7+ Person Families | 0 (0.0%) | $0 |
| Total | 561 (100.0%) | $70,750 |
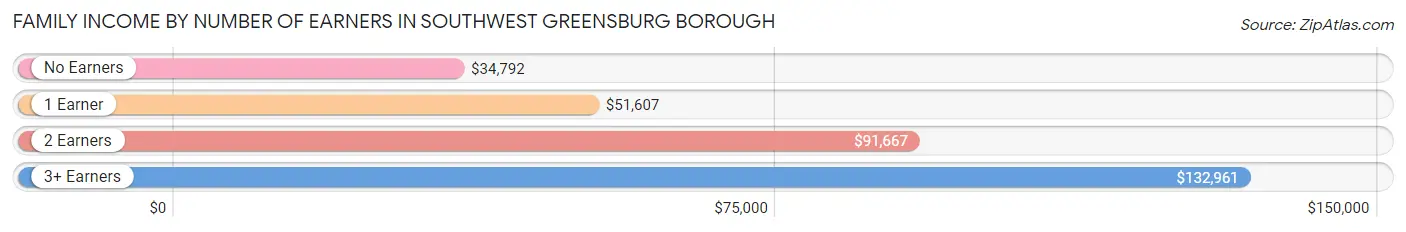
Family Income by Number of Earners in Southwest Greensburg borough
The median family income in Southwest Greensburg borough is $70,750, with families comprising 3+ earners (57) having the highest median family income of $132,961, while families with no earners (115) have the lowest median family income of $34,792, accounting for 10.2% and 20.5% of families, respectively.
| Number of Earners | # Families | Median Income |
| No Earners | 115 (20.5%) | $34,792 |
| 1 Earner | 141 (25.1%) | $51,607 |
| 2 Earners | 248 (44.2%) | $91,667 |
| 3+ Earners | 57 (10.2%) | $132,961 |
| Total | 561 (100.0%) | $70,750 |
Household Income in Southwest Greensburg borough
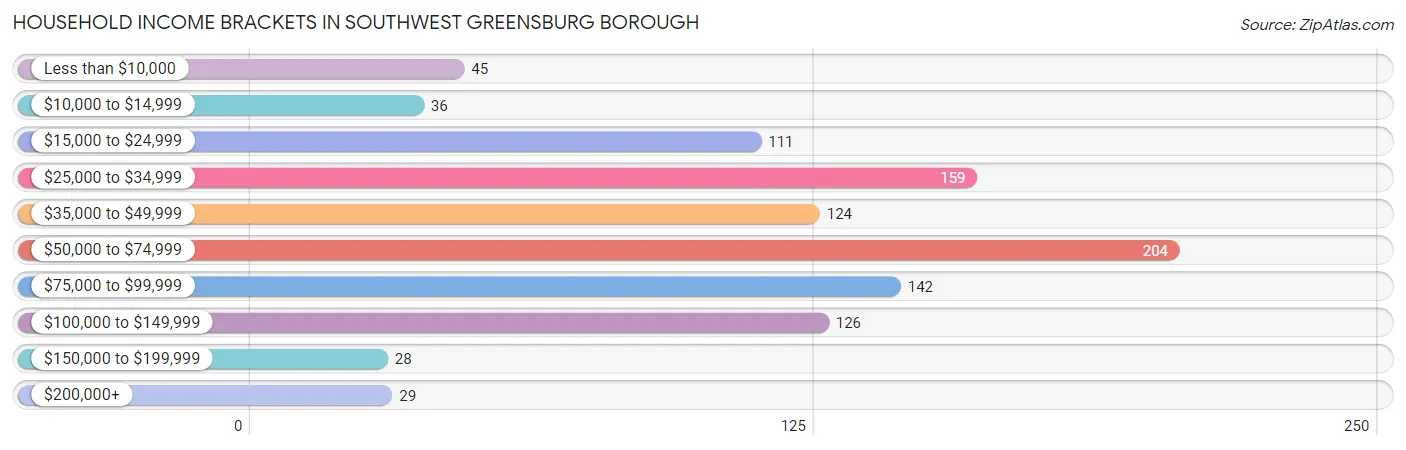
Household Income Brackets in Southwest Greensburg borough
With 204 households falling in the category, the $50,000 to $74,999 income range is the most frequent in Southwest Greensburg borough, accounting for 20.3% of all households. In contrast, only 28 households (2.8%) fall into the $150,000 to $199,999 income bracket, making it the least populous group.
| Income Bracket | # Households | % Households |
| Less than $10,000 | 45 | 4.5% |
| $10,000 to $14,999 | 36 | 3.6% |
| $15,000 to $24,999 | 111 | 11.1% |
| $25,000 to $34,999 | 159 | 15.8% |
| $35,000 to $49,999 | 124 | 12.4% |
| $50,000 to $74,999 | 204 | 20.3% |
| $75,000 to $99,999 | 142 | 14.1% |
| $100,000 to $149,999 | 126 | 12.5% |
| $150,000 to $199,999 | 28 | 2.8% |
| $200,000+ | 29 | 2.9% |
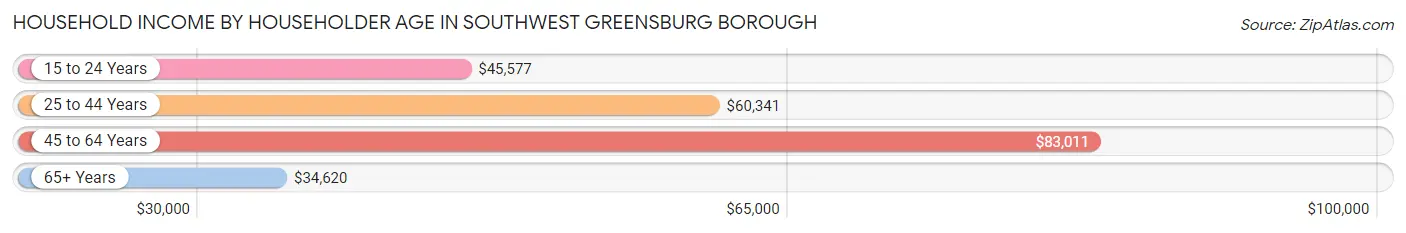
Household Income by Householder Age in Southwest Greensburg borough
The median household income in Southwest Greensburg borough is $54,318, with the highest median household income of $83,011 found in the 45 to 64 years age bracket for the primary householder. A total of 287 households (28.6%) fall into this category. Meanwhile, the 65+ years age bracket for the primary householder has the lowest median household income of $34,620, with 301 households (30.0%) in this group.
| Income Bracket | # Households | Median Income |
| 15 to 24 Years | 42 (4.2%) | $45,577 |
| 25 to 44 Years | 374 (37.2%) | $60,341 |
| 45 to 64 Years | 287 (28.6%) | $83,011 |
| 65+ Years | 301 (30.0%) | $34,620 |
| Total | 1,004 (100.0%) | $54,318 |
Poverty in Southwest Greensburg borough
Income Below Poverty by Sex and Age in Southwest Greensburg borough
With 13.6% poverty level for males and 15.1% for females among the residents of Southwest Greensburg borough, 6 to 11 year old males and 18 to 24 year old females are the most vulnerable to poverty, with 22 males (100.0%) and 11 females (31.4%) in their respective age groups living below the poverty level.
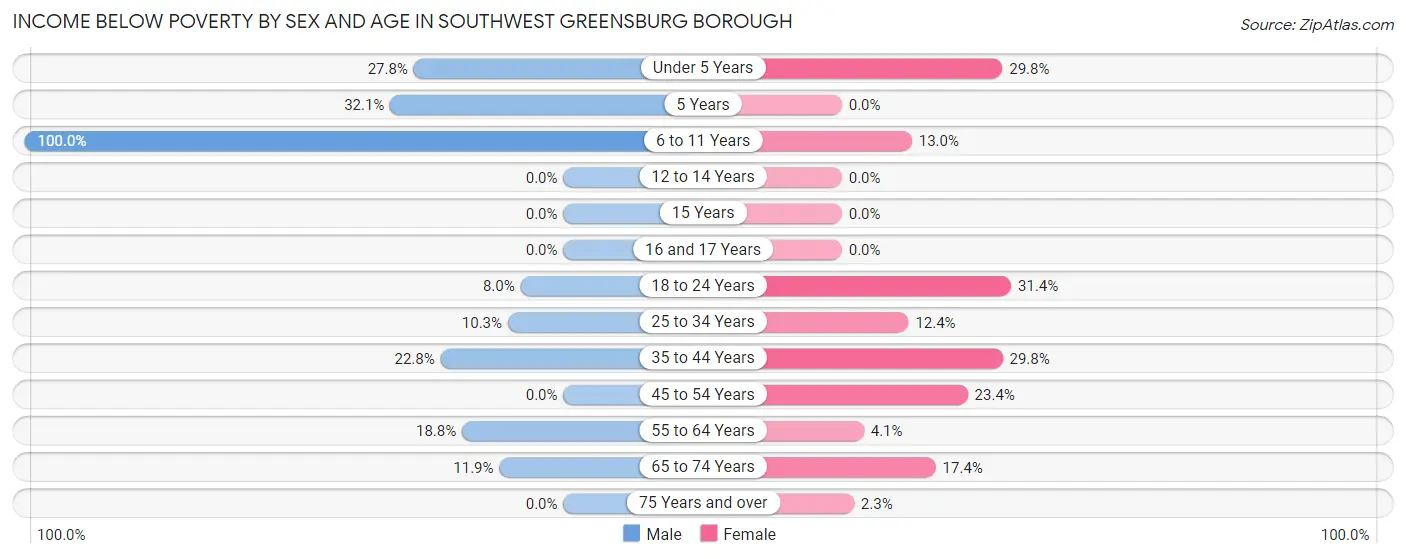
| Age Bracket | Male | Female |
| Under 5 Years | 10 (27.8%) | 14 (29.8%) |
| 5 Years | 9 (32.1%) | 0 (0.0%) |
| 6 to 11 Years | 22 (100.0%) | 10 (13.0%) |
| 12 to 14 Years | 0 (0.0%) | 0 (0.0%) |
| 15 Years | 0 (0.0%) | 0 (0.0%) |
| 16 and 17 Years | 0 (0.0%) | 0 (0.0%) |
| 18 to 24 Years | 7 (8.0%) | 11 (31.4%) |
| 25 to 34 Years | 17 (10.3%) | 24 (12.4%) |
| 35 to 44 Years | 31 (22.8%) | 37 (29.8%) |
| 45 to 54 Years | 0 (0.0%) | 32 (23.4%) |
| 55 to 64 Years | 22 (18.8%) | 4 (4.1%) |
| 65 to 74 Years | 12 (11.9%) | 23 (17.4%) |
| 75 Years and over | 0 (0.0%) | 4 (2.2%) |
| Total | 130 (13.6%) | 159 (15.1%) |
Income Above Poverty by Sex and Age in Southwest Greensburg borough
According to the poverty statistics in Southwest Greensburg borough, males aged 15 years and females aged 12 to 14 years are the age groups that are most secure financially, with 100.0% of males and 100.0% of females in these age groups living above the poverty line.
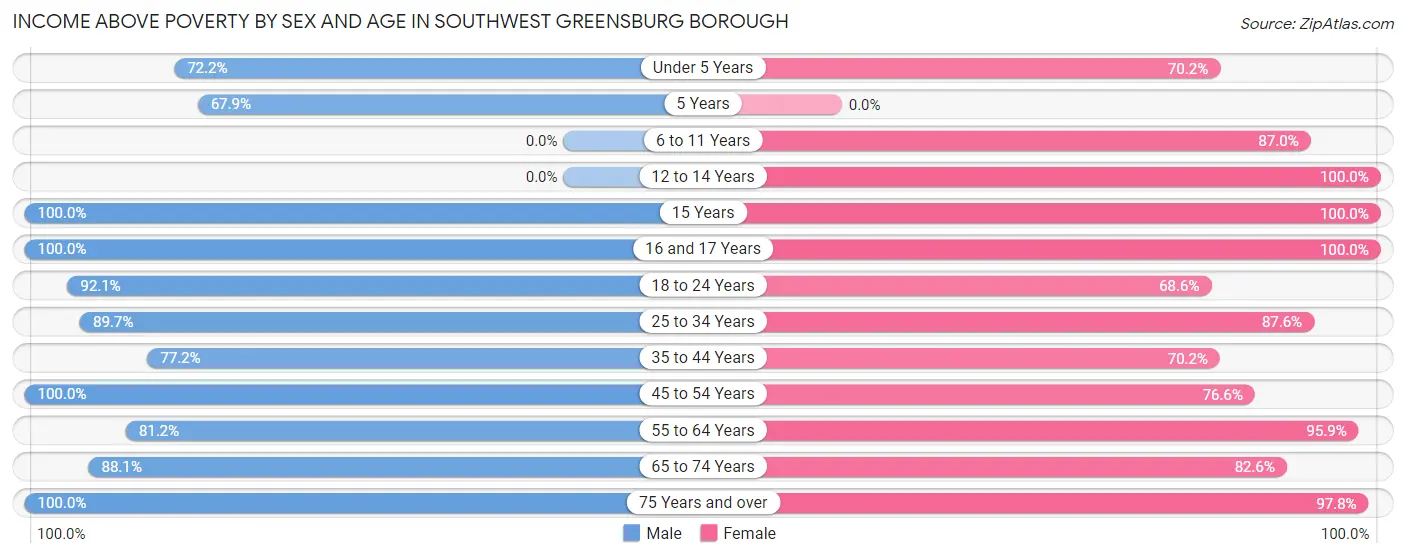
| Age Bracket | Male | Female |
| Under 5 Years | 26 (72.2%) | 33 (70.2%) |
| 5 Years | 19 (67.9%) | 0 (0.0%) |
| 6 to 11 Years | 0 (0.0%) | 67 (87.0%) |
| 12 to 14 Years | 0 (0.0%) | 16 (100.0%) |
| 15 Years | 16 (100.0%) | 5 (100.0%) |
| 16 and 17 Years | 36 (100.0%) | 11 (100.0%) |
| 18 to 24 Years | 81 (92.0%) | 24 (68.6%) |
| 25 to 34 Years | 148 (89.7%) | 170 (87.6%) |
| 35 to 44 Years | 105 (77.2%) | 87 (70.2%) |
| 45 to 54 Years | 133 (100.0%) | 105 (76.6%) |
| 55 to 64 Years | 95 (81.2%) | 94 (95.9%) |
| 65 to 74 Years | 89 (88.1%) | 109 (82.6%) |
| 75 Years and over | 80 (100.0%) | 174 (97.8%) |
| Total | 828 (86.4%) | 895 (84.9%) |
Income Below Poverty Among Married-Couple Families in Southwest Greensburg borough
The poverty statistics for married-couple families in Southwest Greensburg borough show that 8.3% or 34 of the total 408 families live below the poverty line. Families with 3 or 4 children have the highest poverty rate of 37.0%, comprising of 10 families. On the other hand, families with no children have the lowest poverty rate of 4.0%, which includes 11 families.
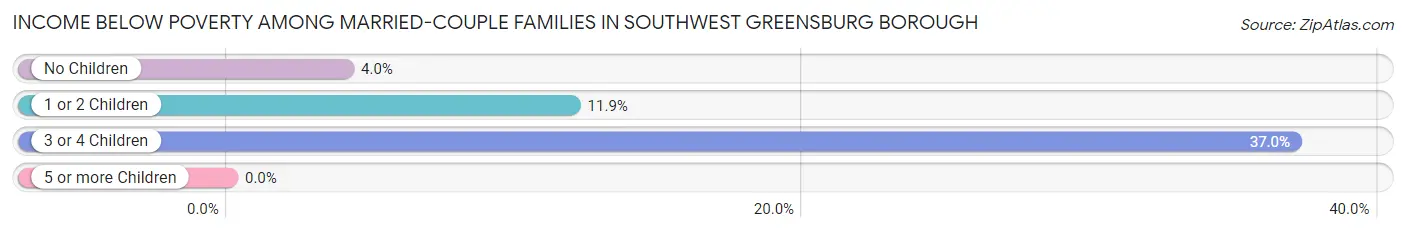
| Children | Above Poverty | Below Poverty |
| No Children | 261 (96.0%) | 11 (4.0%) |
| 1 or 2 Children | 96 (88.1%) | 13 (11.9%) |
| 3 or 4 Children | 17 (63.0%) | 10 (37.0%) |
| 5 or more Children | 0 (0.0%) | 0 (0.0%) |
| Total | 374 (91.7%) | 34 (8.3%) |
Income Below Poverty Among Single-Parent Households in Southwest Greensburg borough
According to the poverty data in Southwest Greensburg borough, 21.1% or 19 single-father households and 4.8% or 3 single-mother households are living below the poverty line. Among single-father households, those with 1 or 2 children have the highest poverty rate, with 19 households (45.2%) experiencing poverty. Likewise, among single-mother households, those with no children have the highest poverty rate, with 3 households (7.0%) falling below the poverty line.
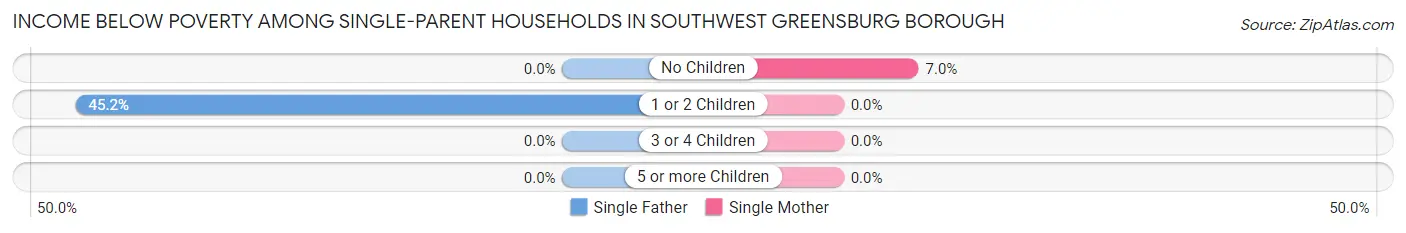
| Children | Single Father | Single Mother |
| No Children | 0 (0.0%) | 3 (7.0%) |
| 1 or 2 Children | 19 (45.2%) | 0 (0.0%) |
| 3 or 4 Children | 0 (0.0%) | 0 (0.0%) |
| 5 or more Children | 0 (0.0%) | 0 (0.0%) |
| Total | 19 (21.1%) | 3 (4.8%) |
Income Below Poverty Among Married-Couple vs Single-Parent Households in Southwest Greensburg borough
The poverty data for Southwest Greensburg borough shows that 34 of the married-couple family households (8.3%) and 22 of the single-parent households (14.4%) are living below the poverty level. Within the married-couple family households, those with 3 or 4 children have the highest poverty rate, with 10 households (37.0%) falling below the poverty line. Among the single-parent households, those with 1 or 2 children have the highest poverty rate, with 19 household (30.6%) living below poverty.
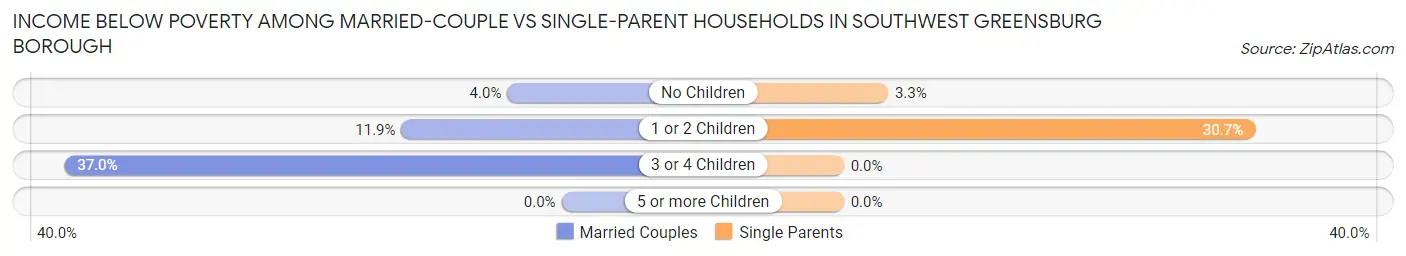
| Children | Married-Couple Families | Single-Parent Households |
| No Children | 11 (4.0%) | 3 (3.3%) |
| 1 or 2 Children | 13 (11.9%) | 19 (30.6%) |
| 3 or 4 Children | 10 (37.0%) | 0 (0.0%) |
| 5 or more Children | 0 (0.0%) | 0 (0.0%) |
| Total | 34 (8.3%) | 22 (14.4%) |
Race in Southwest Greensburg borough
The most populous races in Southwest Greensburg borough are White / Caucasian (1,834 | 91.1%), Black / African American (97 | 4.8%), and Two or more Races (56 | 2.8%).
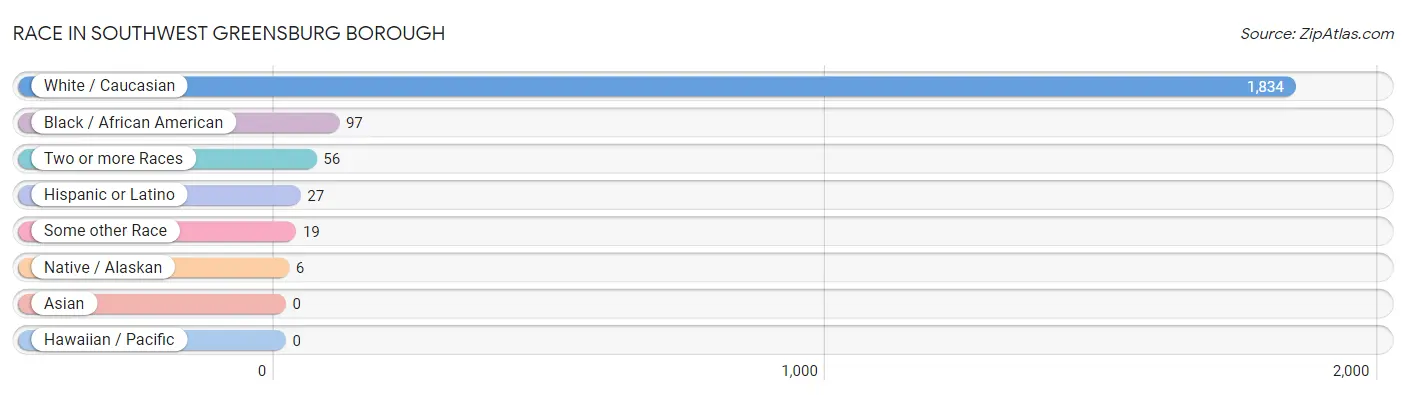
| Race | # Population | % Population |
| Asian | 0 | 0.0% |
| Black / African American | 97 | 4.8% |
| Hawaiian / Pacific | 0 | 0.0% |
| Hispanic or Latino | 27 | 1.3% |
| Native / Alaskan | 6 | 0.3% |
| White / Caucasian | 1,834 | 91.1% |
| Two or more Races | 56 | 2.8% |
| Some other Race | 19 | 0.9% |
| Total | 2,012 | 100.0% |
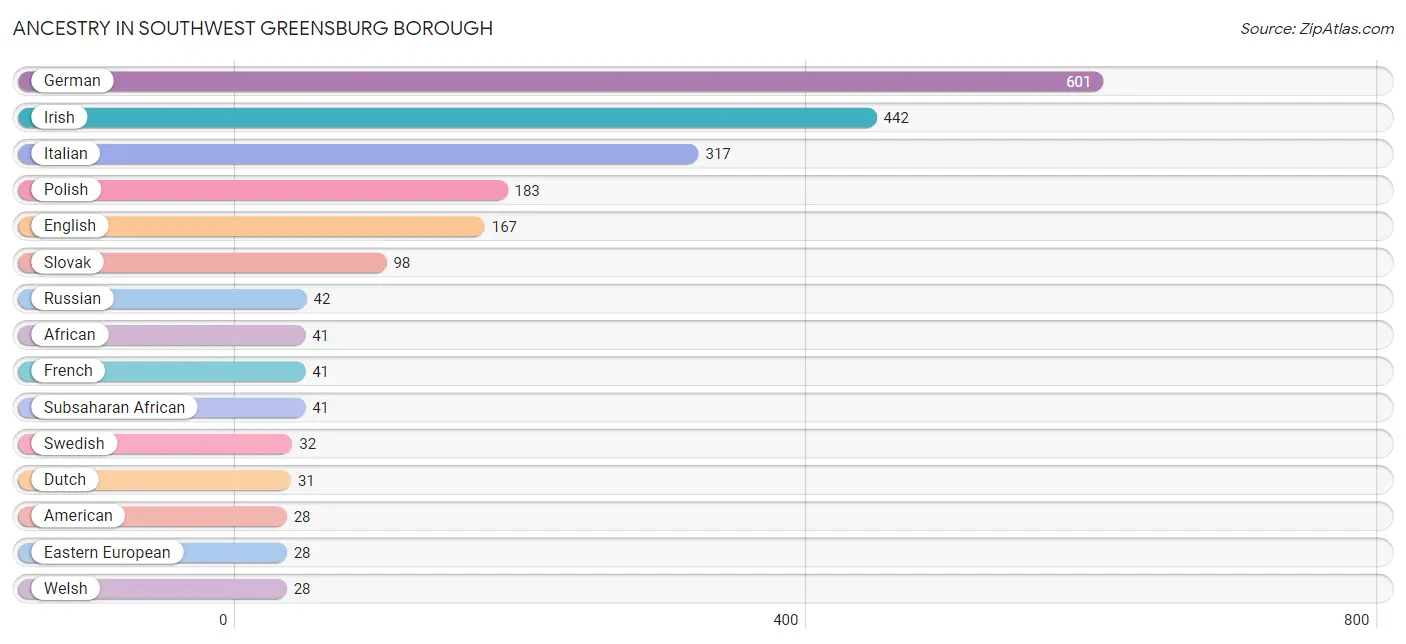
Ancestry in Southwest Greensburg borough
The most populous ancestries reported in Southwest Greensburg borough are German (601 | 29.9%), Irish (442 | 22.0%), Italian (317 | 15.8%), Polish (183 | 9.1%), and English (167 | 8.3%), together accounting for 85.0% of all Southwest Greensburg borough residents.
| Ancestry | # Population | % Population |
| African | 41 | 2.0% |
| American | 28 | 1.4% |
| Arab | 5 | 0.3% |
| Bhutanese | 6 | 0.3% |
| British | 16 | 0.8% |
| Colombian | 7 | 0.4% |
| Croatian | 16 | 0.8% |
| Czech | 9 | 0.4% |
| Czechoslovakian | 13 | 0.6% |
| Dutch | 31 | 1.5% |
| Eastern European | 28 | 1.4% |
| English | 167 | 8.3% |
| European | 5 | 0.3% |
| French | 41 | 2.0% |
| German | 601 | 29.9% |
| Greek | 20 | 1.0% |
| Hungarian | 12 | 0.6% |
| Icelander | 27 | 1.3% |
| Irish | 442 | 22.0% |
| Italian | 317 | 15.8% |
| Macedonian | 6 | 0.3% |
| New Zealander | 5 | 0.3% |
| Norwegian | 16 | 0.8% |
| Paraguayan | 6 | 0.3% |
| Polish | 183 | 9.1% |
| Russian | 42 | 2.1% |
| Scottish | 6 | 0.3% |
| Slavic | 7 | 0.4% |
| Slovak | 98 | 4.9% |
| Slovene | 4 | 0.2% |
| South American | 13 | 0.6% |
| South American Indian | 6 | 0.3% |
| Subsaharan African | 41 | 2.0% |
| Swedish | 32 | 1.6% |
| Syrian | 5 | 0.3% |
| Welsh | 28 | 1.4% |
| Yugoslavian | 6 | 0.3% | View All 37 Rows |
Immigrants in Southwest Greensburg borough
The most numerous immigrant groups reported in Southwest Greensburg borough came from Latin America (13 | 0.6%), South America (13 | 0.6%), and Colombia (7 | 0.4%), together accounting for 1.7% of all Southwest Greensburg borough residents.
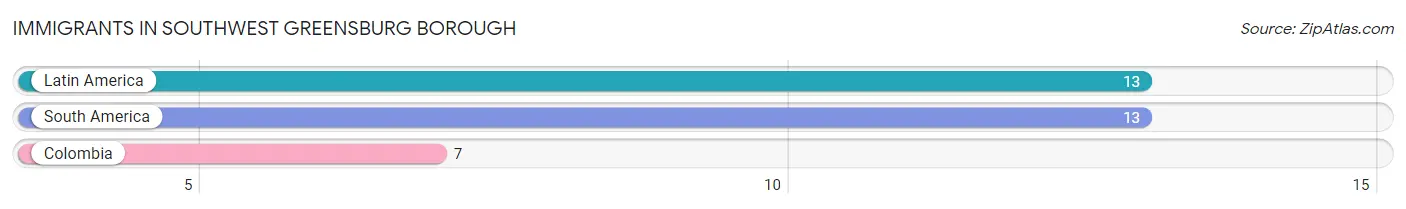
| Immigration Origin | # Population | % Population |
| Colombia | 7 | 0.4% |
| Latin America | 13 | 0.6% |
| South America | 13 | 0.6% | View All 3 Rows |
Sex and Age in Southwest Greensburg borough
Sex and Age in Southwest Greensburg borough
The most populous age groups in Southwest Greensburg borough are 50 to 54 Years (101 | 10.5%) for men and 25 to 29 Years (104 | 9.9%) for women.
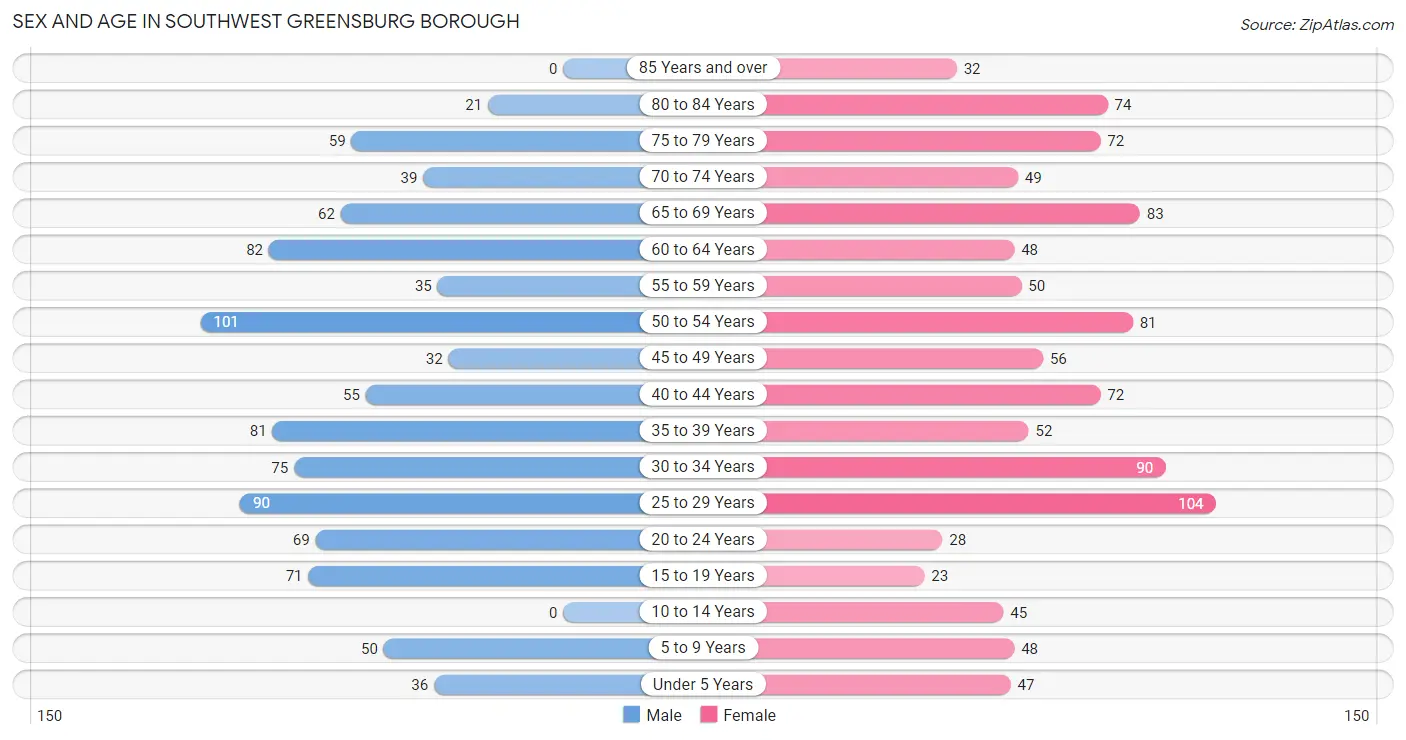
| Age Bracket | Male | Female |
| Under 5 Years | 36 (3.8%) | 47 (4.5%) |
| 5 to 9 Years | 50 (5.2%) | 48 (4.5%) |
| 10 to 14 Years | 0 (0.0%) | 45 (4.3%) |
| 15 to 19 Years | 71 (7.4%) | 23 (2.2%) |
| 20 to 24 Years | 69 (7.2%) | 28 (2.7%) |
| 25 to 29 Years | 90 (9.4%) | 104 (9.9%) |
| 30 to 34 Years | 75 (7.8%) | 90 (8.5%) |
| 35 to 39 Years | 81 (8.5%) | 52 (4.9%) |
| 40 to 44 Years | 55 (5.7%) | 72 (6.8%) |
| 45 to 49 Years | 32 (3.3%) | 56 (5.3%) |
| 50 to 54 Years | 101 (10.5%) | 81 (7.7%) |
| 55 to 59 Years | 35 (3.6%) | 50 (4.7%) |
| 60 to 64 Years | 82 (8.6%) | 48 (4.5%) |
| 65 to 69 Years | 62 (6.5%) | 83 (7.9%) |
| 70 to 74 Years | 39 (4.1%) | 49 (4.6%) |
| 75 to 79 Years | 59 (6.2%) | 72 (6.8%) |
| 80 to 84 Years | 21 (2.2%) | 74 (7.0%) |
| 85 Years and over | 0 (0.0%) | 32 (3.0%) |
| Total | 958 (100.0%) | 1,054 (100.0%) |
Families and Households in Southwest Greensburg borough
Median Family Size in Southwest Greensburg borough
The median family size in Southwest Greensburg borough is 2.59 persons per family, with married-couple families (408 | 72.7%) accounting for the largest median family size of 2.7 persons per family. On the other hand, single male/father families (90 | 16.0%) represent the smallest median family size with 2.20 persons per family.
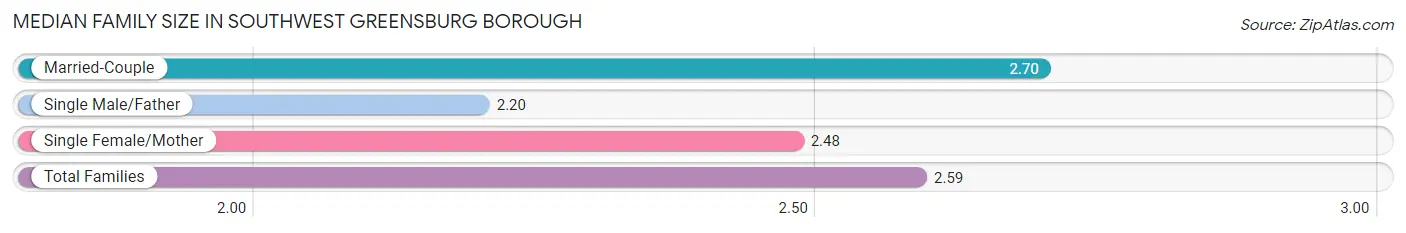
| Family Type | # Families | Family Size |
| Married-Couple | 408 (72.7%) | 2.70 |
| Single Male/Father | 90 (16.0%) | 2.20 |
| Single Female/Mother | 63 (11.2%) | 2.48 |
| Total Families | 561 (100.0%) | 2.59 |
Median Household Size in Southwest Greensburg borough
The median household size in Southwest Greensburg borough is 2.00 persons per household, with married-couple households (408 | 40.6%) accounting for the largest median household size of 2.7 persons per household. non-family households (443 | 44.1%) represent the smallest median household size with 1.17 persons per household.
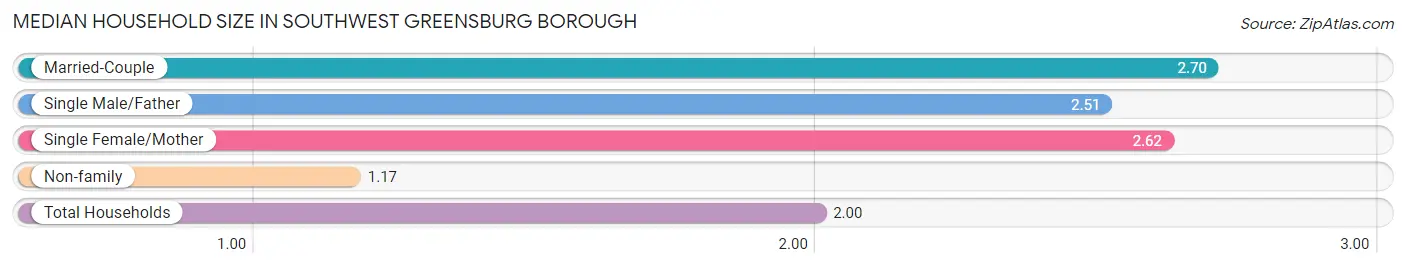
| Household Type | # Households | Household Size |
| Married-Couple | 408 (40.6%) | 2.70 |
| Single Male/Father | 90 (9.0%) | 2.51 |
| Single Female/Mother | 63 (6.3%) | 2.62 |
| Non-family | 443 (44.1%) | 1.17 |
| Total Households | 1,004 (100.0%) | 2.00 |
Household Size by Marriage Status in Southwest Greensburg borough
Out of a total of 1,004 households in Southwest Greensburg borough, 561 (55.9%) are family households, while 443 (44.1%) are nonfamily households. The most numerous type of family households are 2-person households, comprising 343, and the most common type of nonfamily households are 1-person households, comprising 367.
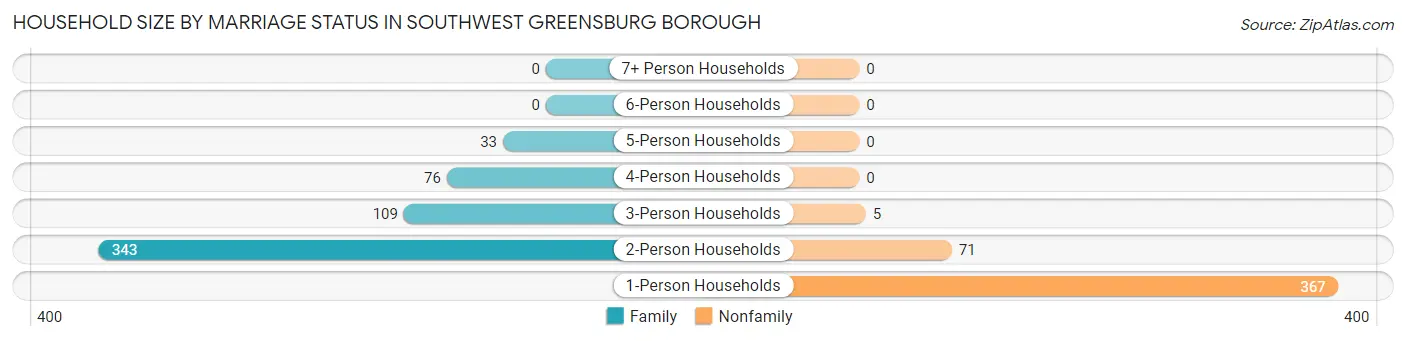
| Household Size | Family Households | Nonfamily Households |
| 1-Person Households | - | 367 (36.5%) |
| 2-Person Households | 343 (34.2%) | 71 (7.1%) |
| 3-Person Households | 109 (10.9%) | 5 (0.5%) |
| 4-Person Households | 76 (7.6%) | 0 (0.0%) |
| 5-Person Households | 33 (3.3%) | 0 (0.0%) |
| 6-Person Households | 0 (0.0%) | 0 (0.0%) |
| 7+ Person Households | 0 (0.0%) | 0 (0.0%) |
| Total | 561 (55.9%) | 443 (44.1%) |
Female Fertility in Southwest Greensburg borough
Fertility by Age in Southwest Greensburg borough
Average fertility rate in Southwest Greensburg borough is 26.0 births per 1,000 women. Women in the age bracket of 35 to 50 years have the highest fertility rate with 32.0 births per 1,000 women. Women in the age bracket of 35 to 50 years acount for 54.5% of all women with births.
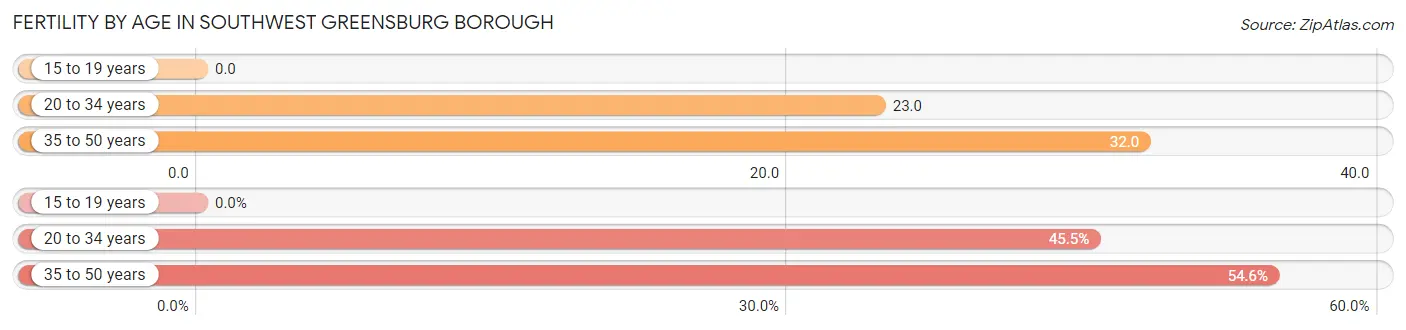
| Age Bracket | Women with Births | Births / 1,000 Women |
| 15 to 19 years | 0 (0.0%) | 0.0 |
| 20 to 34 years | 5 (45.5%) | 23.0 |
| 35 to 50 years | 6 (54.5%) | 32.0 |
| Total | 11 (100.0%) | 26.0 |
Fertility by Age by Marriage Status in Southwest Greensburg borough
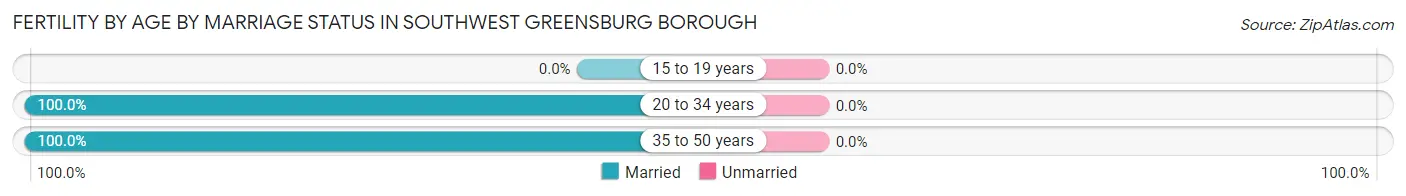
| Age Bracket | Married | Unmarried |
| 15 to 19 years | 0 (0.0%) | 0 (0.0%) |
| 20 to 34 years | 5 (100.0%) | 0 (0.0%) |
| 35 to 50 years | 6 (100.0%) | 0 (0.0%) |
| Total | 11 (100.0%) | 0 (0.0%) |
Fertility by Education in Southwest Greensburg borough
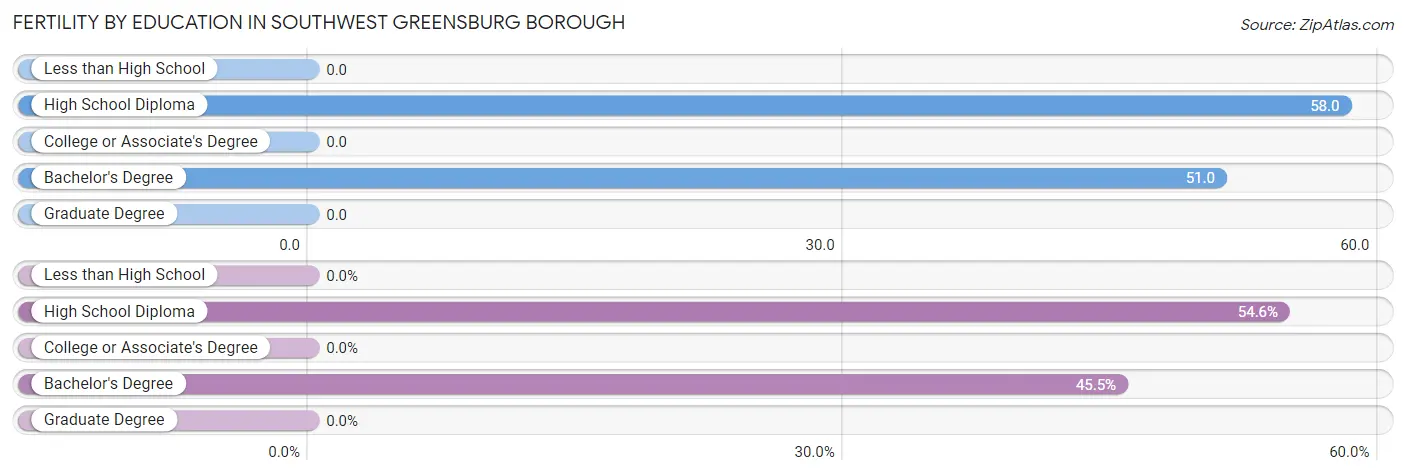
| Educational Attainment | Women with Births | Births / 1,000 Women |
| Less than High School | 0 (0.0%) | 0.0 |
| High School Diploma | 6 (54.5%) | 58.0 |
| College or Associate's Degree | 0 (0.0%) | 0.0 |
| Bachelor's Degree | 5 (45.5%) | 51.0 |
| Graduate Degree | 0 (0.0%) | 0.0 |
| Total | 11 (100.0%) | 26.0 |
Fertility by Education by Marriage Status in Southwest Greensburg borough
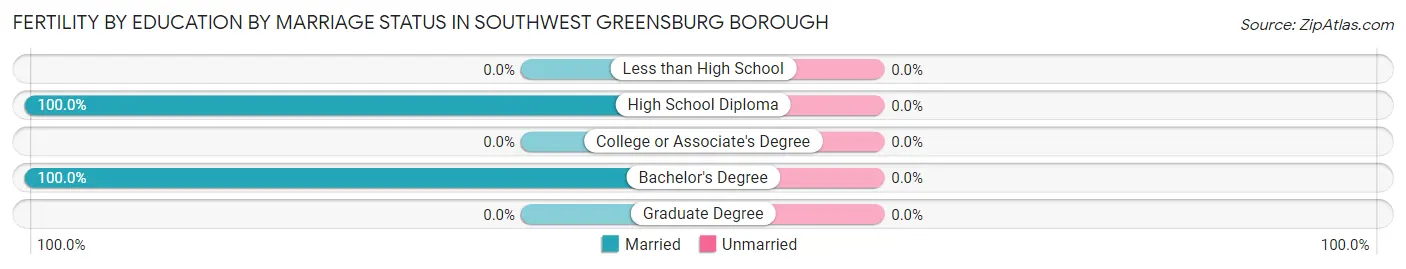
| Educational Attainment | Married | Unmarried |
| Less than High School | 0 (0.0%) | 0 (0.0%) |
| High School Diploma | 6 (100.0%) | 0 (0.0%) |
| College or Associate's Degree | 0 (0.0%) | 0 (0.0%) |
| Bachelor's Degree | 5 (100.0%) | 0 (0.0%) |
| Graduate Degree | 0 (0.0%) | 0 (0.0%) |
| Total | 11 (100.0%) | 0 (0.0%) |
Employment Characteristics in Southwest Greensburg borough
Employment by Class of Employer in Southwest Greensburg borough
Among the 1,039 employed individuals in Southwest Greensburg borough, private company employees (756 | 72.8%), not-for-profit organizations (138 | 13.3%), and local government employees (93 | 8.9%) make up the most common classes of employment.
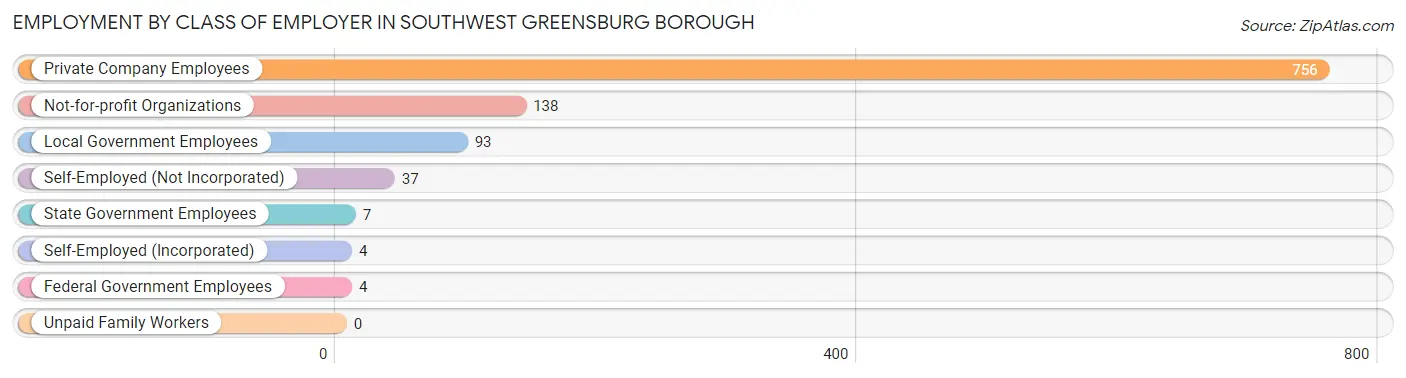
| Employer Class | # Employees | % Employees |
| Private Company Employees | 756 | 72.8% |
| Self-Employed (Incorporated) | 4 | 0.4% |
| Self-Employed (Not Incorporated) | 37 | 3.6% |
| Not-for-profit Organizations | 138 | 13.3% |
| Local Government Employees | 93 | 8.9% |
| State Government Employees | 7 | 0.7% |
| Federal Government Employees | 4 | 0.4% |
| Unpaid Family Workers | 0 | 0.0% |
| Total | 1,039 | 100.0% |
Employment Status by Age in Southwest Greensburg borough
According to the labor force statistics for Southwest Greensburg borough, out of the total population over 16 years of age (1,765), 63.6% or 1,123 individuals are in the labor force, with 4.8% or 54 of them unemployed. The age group with the highest labor force participation rate is 30 to 34 years, with 96.4% or 159 individuals in the labor force. Within the labor force, the 16 to 19 years age range has the highest percentage of unemployed individuals, with 35.1% or 20 of them being unemployed.
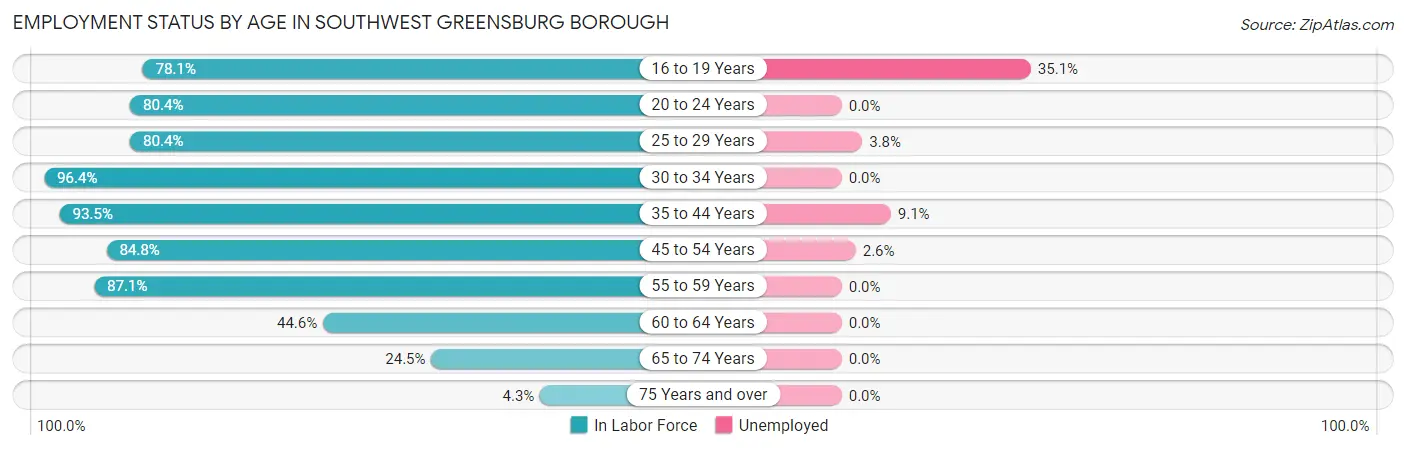
| Age Bracket | In Labor Force | Unemployed |
| 16 to 19 Years | 57 (78.1%) | 20 (35.1%) |
| 20 to 24 Years | 78 (80.4%) | 0 (0.0%) |
| 25 to 29 Years | 156 (80.4%) | 6 (3.8%) |
| 30 to 34 Years | 159 (96.4%) | 0 (0.0%) |
| 35 to 44 Years | 243 (93.5%) | 22 (9.1%) |
| 45 to 54 Years | 229 (84.8%) | 6 (2.6%) |
| 55 to 59 Years | 74 (87.1%) | 0 (0.0%) |
| 60 to 64 Years | 58 (44.6%) | 0 (0.0%) |
| 65 to 74 Years | 57 (24.5%) | 0 (0.0%) |
| 75 Years and over | 11 (4.3%) | 0 (0.0%) |
| Total | 1,123 (63.6%) | 54 (4.8%) |
Employment Status by Educational Attainment in Southwest Greensburg borough
According to labor force statistics for Southwest Greensburg borough, 83.2% of individuals (919) out of the total population between 25 and 64 years of age (1,104) are in the labor force, with 3.7% or 34 of them being unemployed. The group with the highest labor force participation rate are those with the educational attainment of college / associate degree, with 90.8% or 305 individuals in the labor force. Within the labor force, individuals with bachelor's degree or higher education have the highest percentage of unemployment, with 4.2% or 12 of them being unemployed.
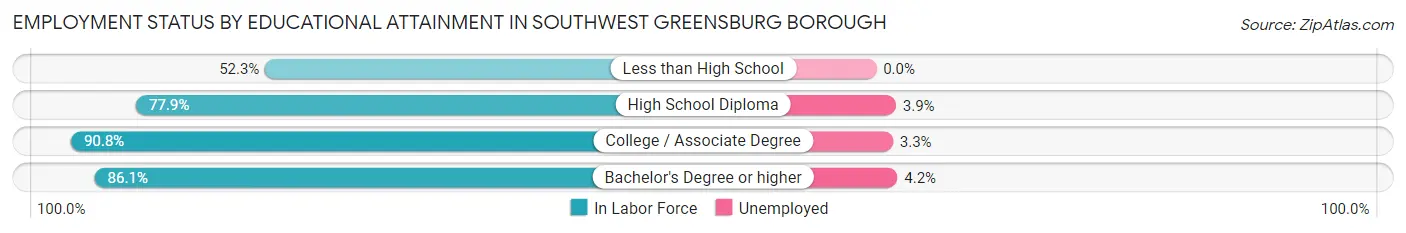
| Educational Attainment | In Labor Force | Unemployed |
| Less than High School | 23 (52.3%) | 0 (0.0%) |
| High School Diploma | 306 (77.9%) | 15 (3.9%) |
| College / Associate Degree | 305 (90.8%) | 11 (3.3%) |
| Bachelor's Degree or higher | 285 (86.1%) | 14 (4.2%) |
| Total | 919 (83.2%) | 41 (3.7%) |
Employment Occupations by Sex in Southwest Greensburg borough
Management, Business, Science and Arts Occupations
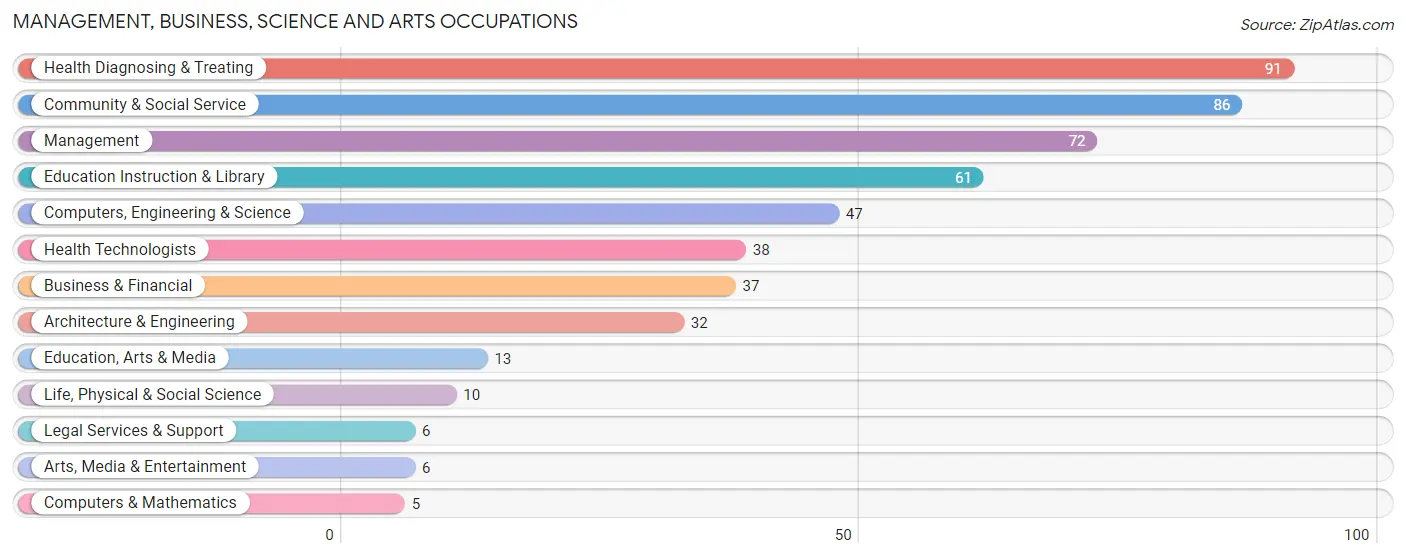
The most common Management, Business, Science and Arts occupations in Southwest Greensburg borough are Health Diagnosing & Treating (91 | 8.5%), Community & Social Service (86 | 8.1%), Management (72 | 6.7%), Education Instruction & Library (61 | 5.7%), and Computers, Engineering & Science (47 | 4.4%).
Management, Business, Science and Arts Occupations by Sex
Within the Management, Business, Science and Arts occupations in Southwest Greensburg borough, the most male-oriented occupations are Architecture & Engineering (100.0%), Life, Physical & Social Science (100.0%), and Education, Arts & Media (100.0%), while the most female-oriented occupations are Computers & Mathematics (100.0%), Legal Services & Support (100.0%), and Education Instruction & Library (82.0%).
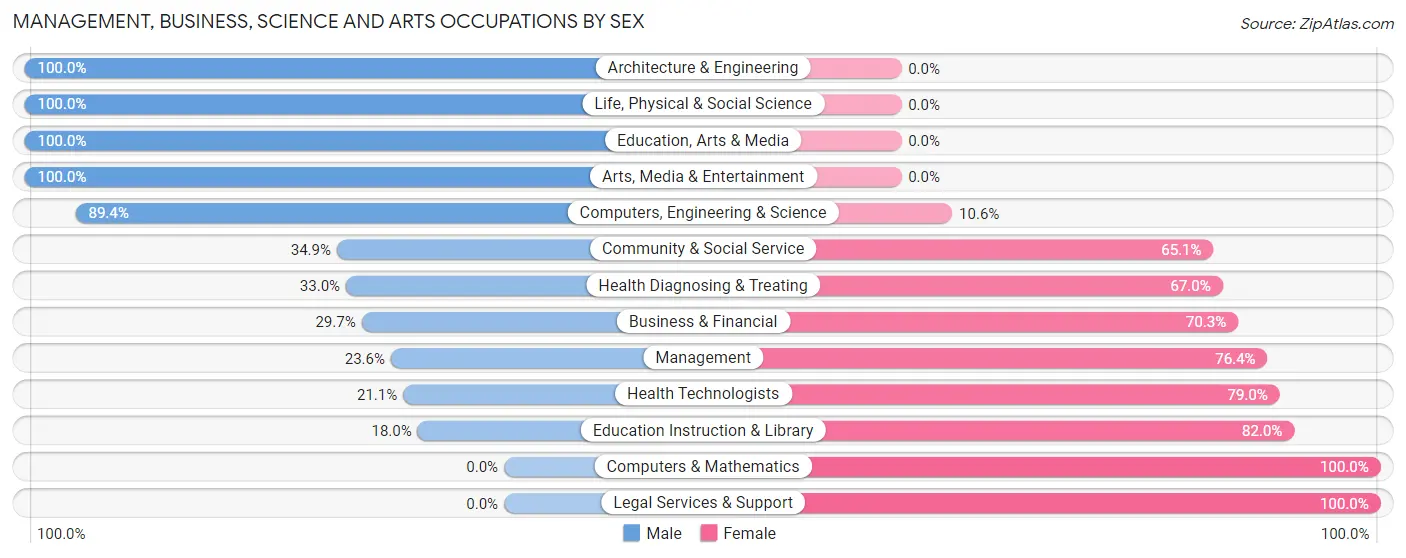
| Occupation | Male | Female |
| Management | 17 (23.6%) | 55 (76.4%) |
| Business & Financial | 11 (29.7%) | 26 (70.3%) |
| Computers, Engineering & Science | 42 (89.4%) | 5 (10.6%) |
| Computers & Mathematics | 0 (0.0%) | 5 (100.0%) |
| Architecture & Engineering | 32 (100.0%) | 0 (0.0%) |
| Life, Physical & Social Science | 10 (100.0%) | 0 (0.0%) |
| Community & Social Service | 30 (34.9%) | 56 (65.1%) |
| Education, Arts & Media | 13 (100.0%) | 0 (0.0%) |
| Legal Services & Support | 0 (0.0%) | 6 (100.0%) |
| Education Instruction & Library | 11 (18.0%) | 50 (82.0%) |
| Arts, Media & Entertainment | 6 (100.0%) | 0 (0.0%) |
| Health Diagnosing & Treating | 30 (33.0%) | 61 (67.0%) |
| Health Technologists | 8 (21.0%) | 30 (78.9%) |
| Total (Category) | 130 (39.0%) | 203 (61.0%) |
| Total (Overall) | 567 (53.1%) | 501 (46.9%) |
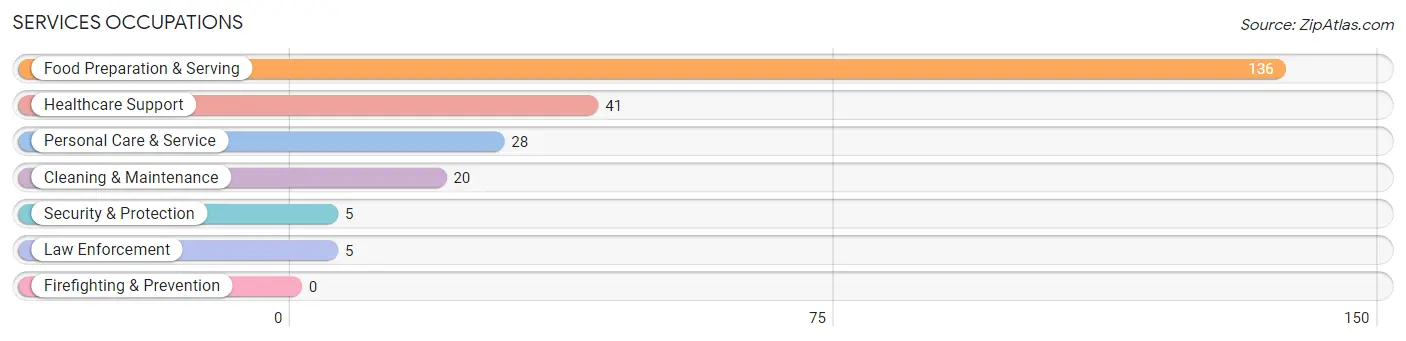
Services Occupations
The most common Services occupations in Southwest Greensburg borough are Food Preparation & Serving (136 | 12.7%), Healthcare Support (41 | 3.8%), Personal Care & Service (28 | 2.6%), Cleaning & Maintenance (20 | 1.9%), and Security & Protection (5 | 0.5%).
Services Occupations by Sex
Within the Services occupations in Southwest Greensburg borough, the most male-oriented occupations are Security & Protection (100.0%), Law Enforcement (100.0%), and Cleaning & Maintenance (75.0%), while the most female-oriented occupations are Healthcare Support (100.0%), Personal Care & Service (100.0%), and Food Preparation & Serving (56.6%).
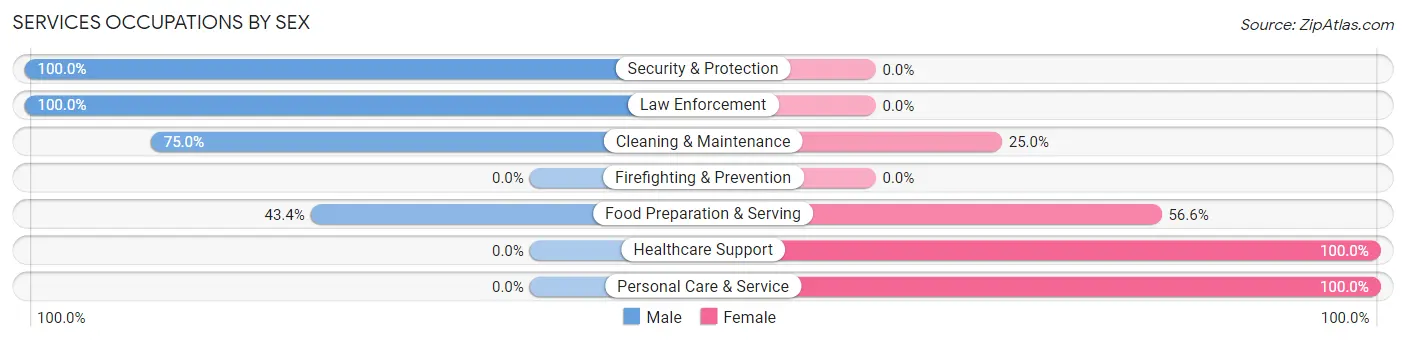
| Occupation | Male | Female |
| Healthcare Support | 0 (0.0%) | 41 (100.0%) |
| Security & Protection | 5 (100.0%) | 0 (0.0%) |
| Firefighting & Prevention | 0 (0.0%) | 0 (0.0%) |
| Law Enforcement | 5 (100.0%) | 0 (0.0%) |
| Food Preparation & Serving | 59 (43.4%) | 77 (56.6%) |
| Cleaning & Maintenance | 15 (75.0%) | 5 (25.0%) |
| Personal Care & Service | 0 (0.0%) | 28 (100.0%) |
| Total (Category) | 79 (34.4%) | 151 (65.6%) |
| Total (Overall) | 567 (53.1%) | 501 (46.9%) |
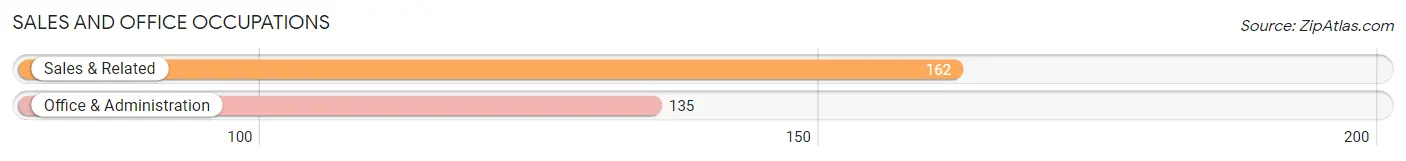
Sales and Office Occupations
The most common Sales and Office occupations in Southwest Greensburg borough are Sales & Related (162 | 15.2%), and Office & Administration (135 | 12.6%).
Sales and Office Occupations by Sex
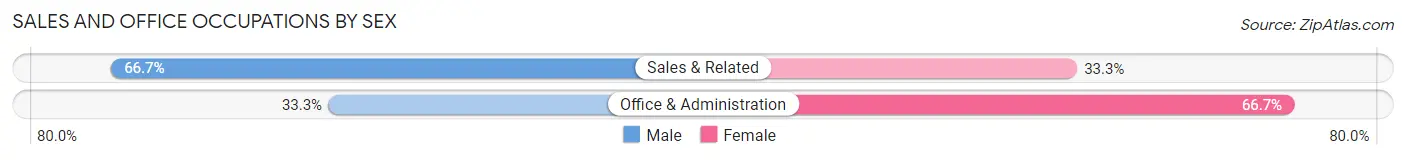
| Occupation | Male | Female |
| Sales & Related | 108 (66.7%) | 54 (33.3%) |
| Office & Administration | 45 (33.3%) | 90 (66.7%) |
| Total (Category) | 153 (51.5%) | 144 (48.5%) |
| Total (Overall) | 567 (53.1%) | 501 (46.9%) |
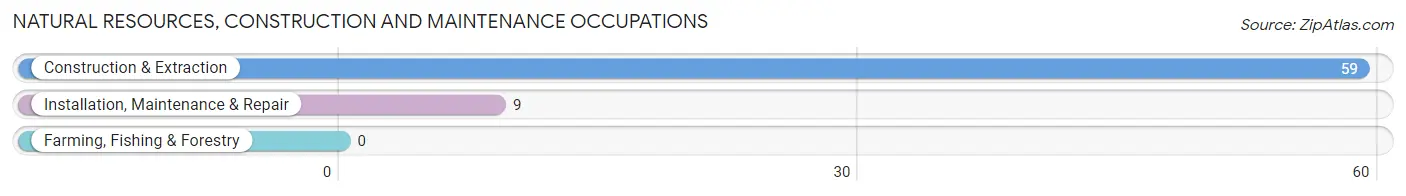
Natural Resources, Construction and Maintenance Occupations
The most common Natural Resources, Construction and Maintenance occupations in Southwest Greensburg borough are Construction & Extraction (59 | 5.5%), and Installation, Maintenance & Repair (9 | 0.8%).
Natural Resources, Construction and Maintenance Occupations by Sex
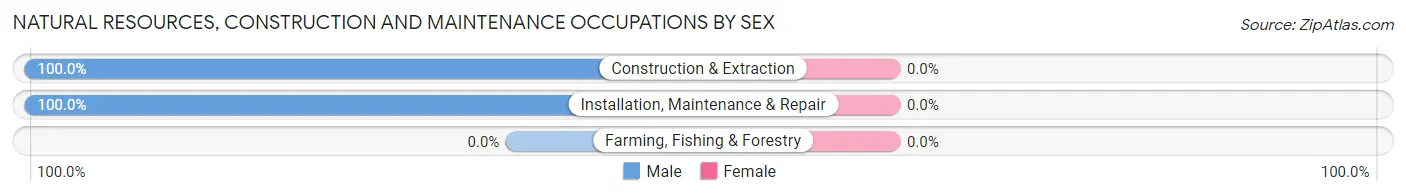
| Occupation | Male | Female |
| Farming, Fishing & Forestry | 0 (0.0%) | 0 (0.0%) |
| Construction & Extraction | 59 (100.0%) | 0 (0.0%) |
| Installation, Maintenance & Repair | 9 (100.0%) | 0 (0.0%) |
| Total (Category) | 68 (100.0%) | 0 (0.0%) |
| Total (Overall) | 567 (53.1%) | 501 (46.9%) |
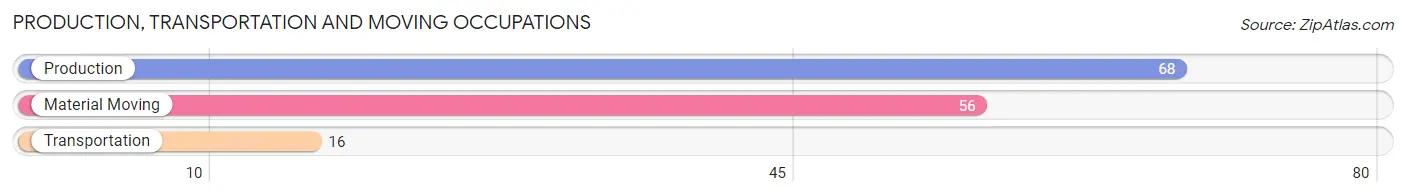
Production, Transportation and Moving Occupations
The most common Production, Transportation and Moving occupations in Southwest Greensburg borough are Production (68 | 6.4%), Material Moving (56 | 5.2%), and Transportation (16 | 1.5%).
Production, Transportation and Moving Occupations by Sex
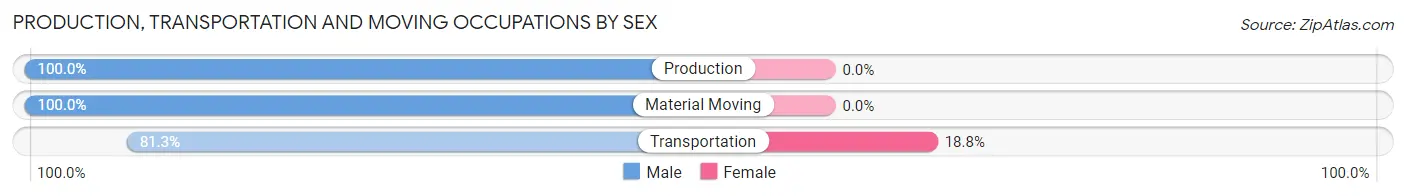
| Occupation | Male | Female |
| Production | 68 (100.0%) | 0 (0.0%) |
| Transportation | 13 (81.2%) | 3 (18.8%) |
| Material Moving | 56 (100.0%) | 0 (0.0%) |
| Total (Category) | 137 (97.9%) | 3 (2.1%) |
| Total (Overall) | 567 (53.1%) | 501 (46.9%) |
Employment Industries by Sex in Southwest Greensburg borough
Employment Industries in Southwest Greensburg borough
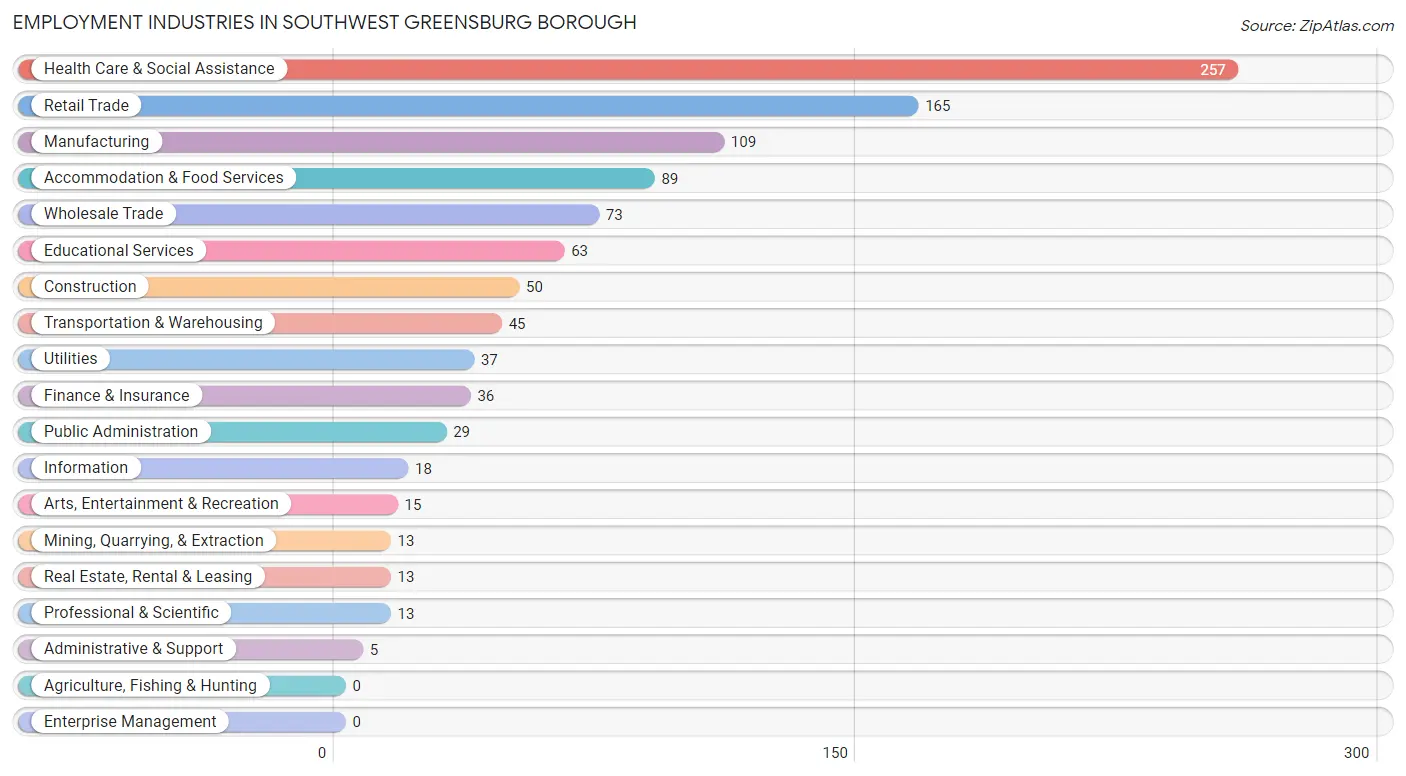
The major employment industries in Southwest Greensburg borough include Health Care & Social Assistance (257 | 24.1%), Retail Trade (165 | 15.4%), Manufacturing (109 | 10.2%), Accommodation & Food Services (89 | 8.3%), and Wholesale Trade (73 | 6.8%).
Employment Industries by Sex in Southwest Greensburg borough
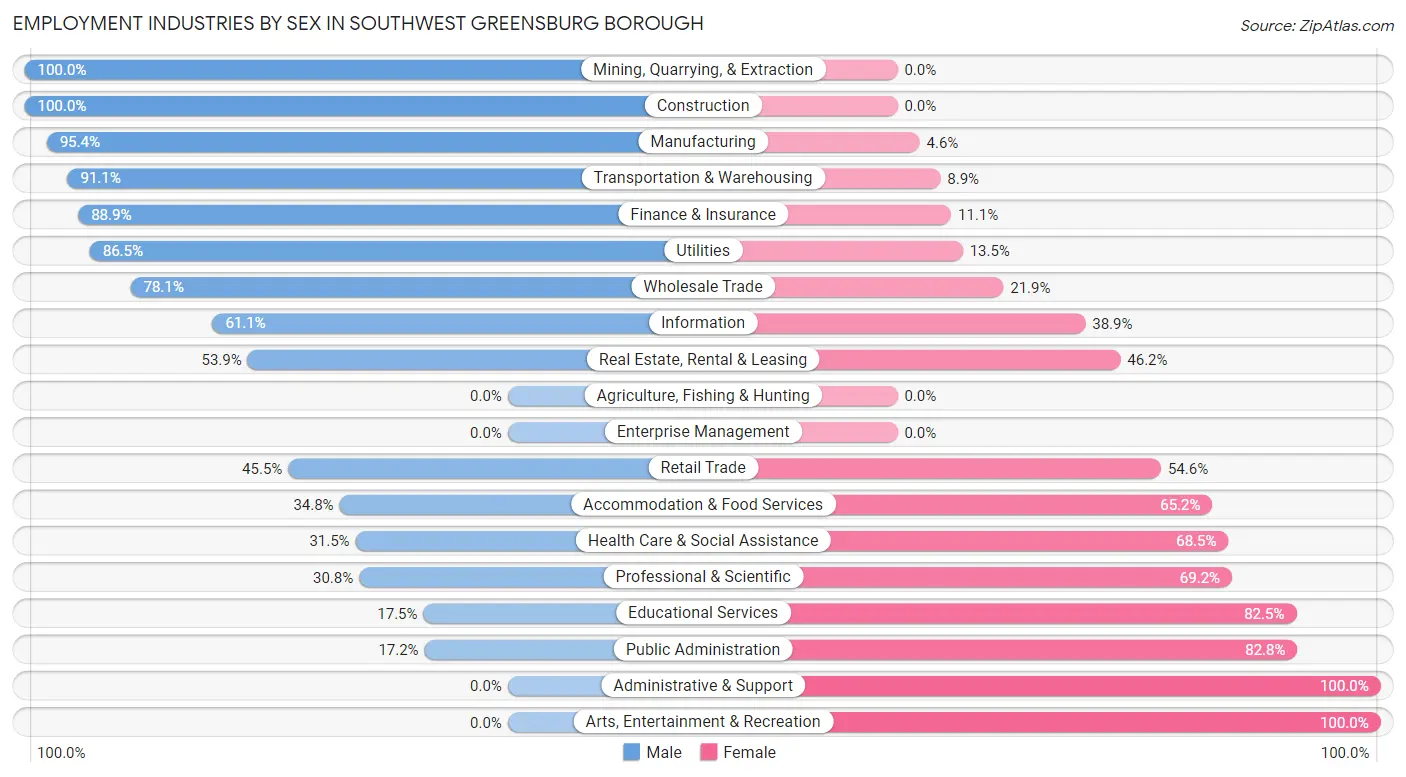
The Southwest Greensburg borough industries that see more men than women are Mining, Quarrying, & Extraction (100.0%), Construction (100.0%), and Manufacturing (95.4%), whereas the industries that tend to have a higher number of women are Administrative & Support (100.0%), Arts, Entertainment & Recreation (100.0%), and Public Administration (82.8%).
| Industry | Male | Female |
| Agriculture, Fishing & Hunting | 0 (0.0%) | 0 (0.0%) |
| Mining, Quarrying, & Extraction | 13 (100.0%) | 0 (0.0%) |
| Construction | 50 (100.0%) | 0 (0.0%) |
| Manufacturing | 104 (95.4%) | 5 (4.6%) |
| Wholesale Trade | 57 (78.1%) | 16 (21.9%) |
| Retail Trade | 75 (45.5%) | 90 (54.5%) |
| Transportation & Warehousing | 41 (91.1%) | 4 (8.9%) |
| Utilities | 32 (86.5%) | 5 (13.5%) |
| Information | 11 (61.1%) | 7 (38.9%) |
| Finance & Insurance | 32 (88.9%) | 4 (11.1%) |
| Real Estate, Rental & Leasing | 7 (53.8%) | 6 (46.2%) |
| Professional & Scientific | 4 (30.8%) | 9 (69.2%) |
| Enterprise Management | 0 (0.0%) | 0 (0.0%) |
| Administrative & Support | 0 (0.0%) | 5 (100.0%) |
| Educational Services | 11 (17.5%) | 52 (82.5%) |
| Health Care & Social Assistance | 81 (31.5%) | 176 (68.5%) |
| Arts, Entertainment & Recreation | 0 (0.0%) | 15 (100.0%) |
| Accommodation & Food Services | 31 (34.8%) | 58 (65.2%) |
| Public Administration | 5 (17.2%) | 24 (82.8%) |
| Total | 567 (53.1%) | 501 (46.9%) |
Education in Southwest Greensburg borough
School Enrollment in Southwest Greensburg borough
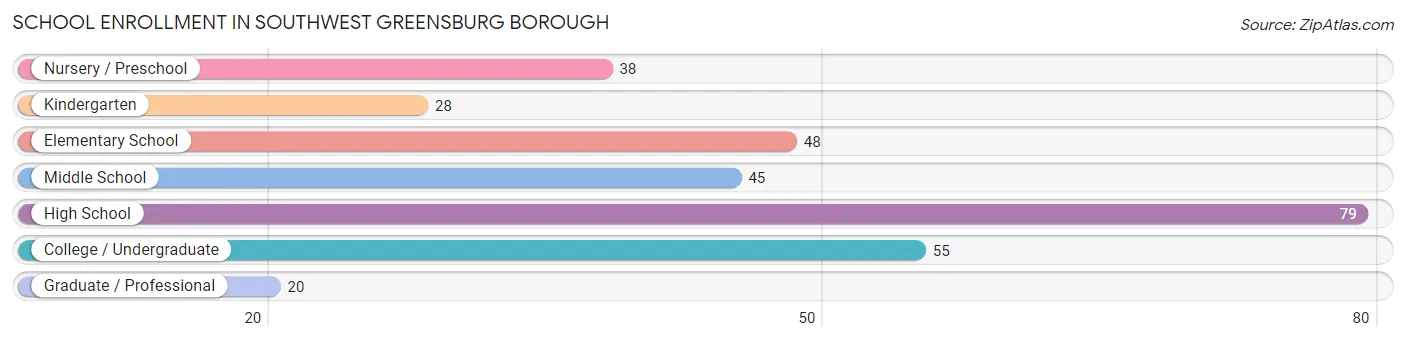
The most common levels of schooling among the 313 students in Southwest Greensburg borough are high school (79 | 25.2%), college / undergraduate (55 | 17.6%), and elementary school (48 | 15.3%).
| School Level | # Students | % Students |
| Nursery / Preschool | 38 | 12.1% |
| Kindergarten | 28 | 8.9% |
| Elementary School | 48 | 15.3% |
| Middle School | 45 | 14.4% |
| High School | 79 | 25.2% |
| College / Undergraduate | 55 | 17.6% |
| Graduate / Professional | 20 | 6.4% |
| Total | 313 | 100.0% |
School Enrollment by Age by Funding Source in Southwest Greensburg borough
Out of a total of 313 students who are enrolled in schools in Southwest Greensburg borough, 26 (8.3%) attend a private institution, while the remaining 287 (91.7%) are enrolled in public schools. The age group of 25 to 34 year olds has the highest likelihood of being enrolled in private schools, with 14 (35.0% in the age bracket) enrolled. Conversely, the age group of 5 to 9 year old has the lowest likelihood of being enrolled in a private school, with 76 (100.0% in the age bracket) attending a public institution.
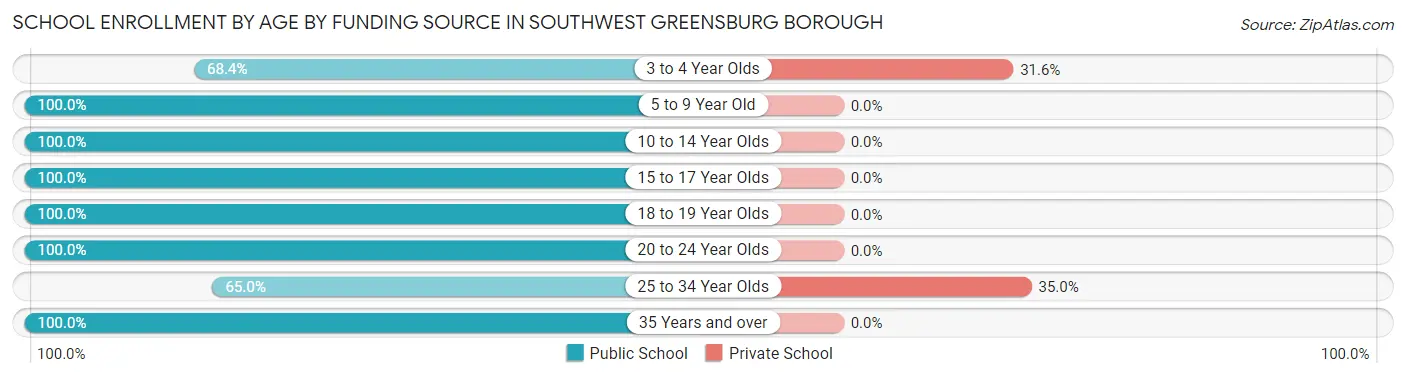
| Age Bracket | Public School | Private School |
| 3 to 4 Year Olds | 26 (68.4%) | 12 (31.6%) |
| 5 to 9 Year Old | 76 (100.0%) | 0 (0.0%) |
| 10 to 14 Year Olds | 45 (100.0%) | 0 (0.0%) |
| 15 to 17 Year Olds | 68 (100.0%) | 0 (0.0%) |
| 18 to 19 Year Olds | 7 (100.0%) | 0 (0.0%) |
| 20 to 24 Year Olds | 33 (100.0%) | 0 (0.0%) |
| 25 to 34 Year Olds | 26 (65.0%) | 14 (35.0%) |
| 35 Years and over | 6 (100.0%) | 0 (0.0%) |
| Total | 287 (91.7%) | 26 (8.3%) |
Educational Attainment by Field of Study in Southwest Greensburg borough
Science & technology (90 | 19.1%), business (74 | 15.7%), education (47 | 10.0%), bio, nature & agricultural (45 | 9.6%), and visual & performing arts (41 | 8.7%) are the most common fields of study among 471 individuals in Southwest Greensburg borough who have obtained a bachelor's degree or higher.
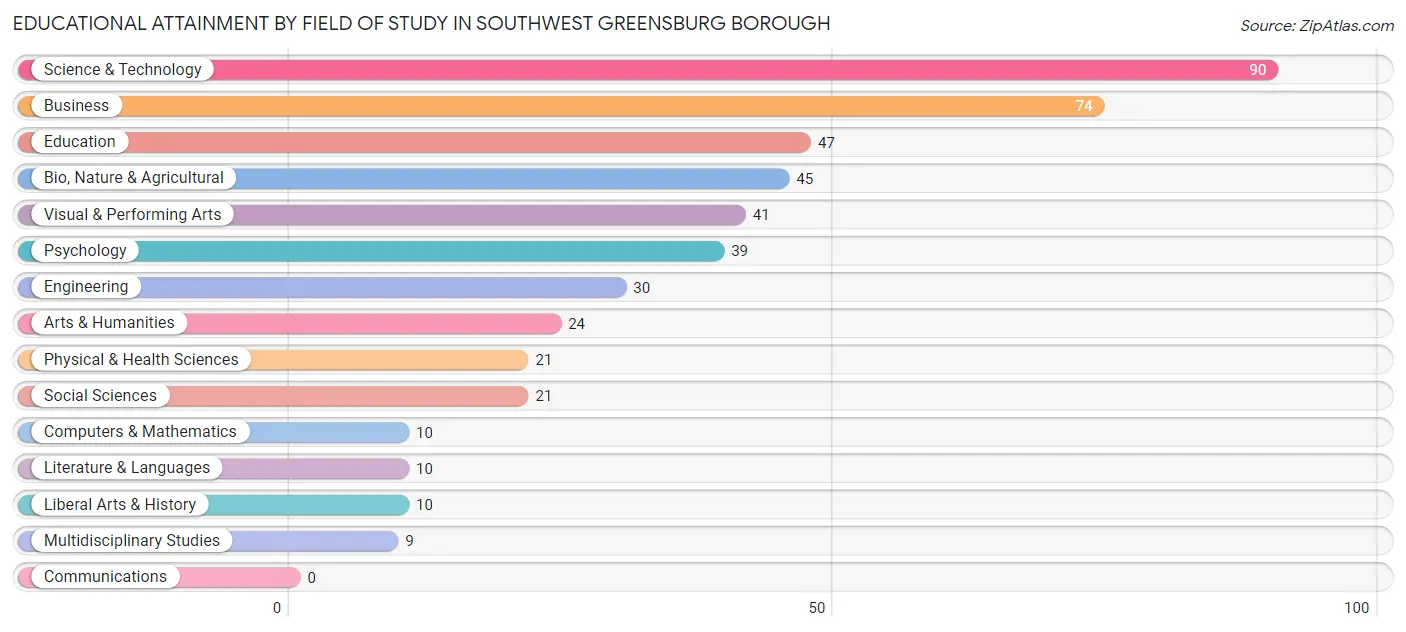
| Field of Study | # Graduates | % Graduates |
| Computers & Mathematics | 10 | 2.1% |
| Bio, Nature & Agricultural | 45 | 9.6% |
| Physical & Health Sciences | 21 | 4.5% |
| Psychology | 39 | 8.3% |
| Social Sciences | 21 | 4.5% |
| Engineering | 30 | 6.4% |
| Multidisciplinary Studies | 9 | 1.9% |
| Science & Technology | 90 | 19.1% |
| Business | 74 | 15.7% |
| Education | 47 | 10.0% |
| Literature & Languages | 10 | 2.1% |
| Liberal Arts & History | 10 | 2.1% |
| Visual & Performing Arts | 41 | 8.7% |
| Communications | 0 | 0.0% |
| Arts & Humanities | 24 | 5.1% |
| Total | 471 | 100.0% |
Transportation & Commute in Southwest Greensburg borough
Vehicle Availability by Sex in Southwest Greensburg borough
The most prevalent vehicle ownership categories in Southwest Greensburg borough are males with 2 vehicles (268, accounting for 49.0%) and females with 2 vehicles (245, making up 54.5%).
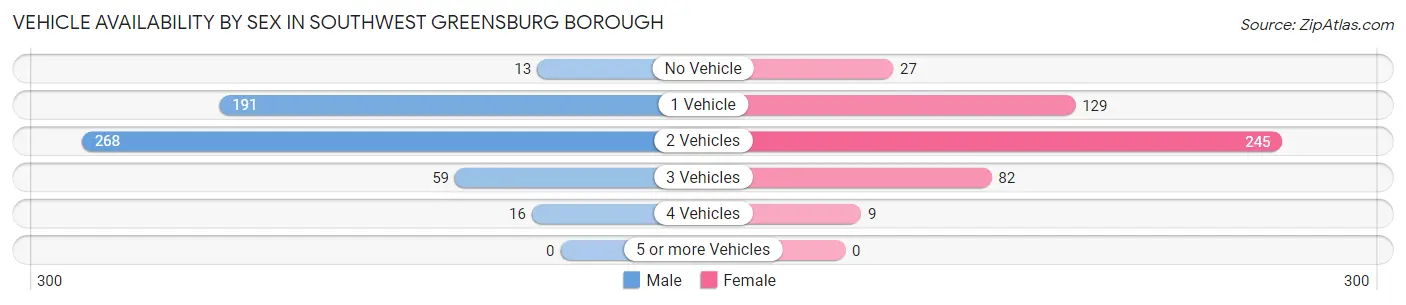
| Vehicles Available | Male | Female |
| No Vehicle | 13 (2.4%) | 27 (5.5%) |
| 1 Vehicle | 191 (34.9%) | 129 (26.2%) |
| 2 Vehicles | 268 (49.0%) | 245 (49.8%) |
| 3 Vehicles | 59 (10.8%) | 82 (16.7%) |
| 4 Vehicles | 16 (2.9%) | 9 (1.8%) |
| 5 or more Vehicles | 0 (0.0%) | 0 (0.0%) |
| Total | 547 (100.0%) | 492 (100.0%) |
Commute Time in Southwest Greensburg borough
The most frequently occuring commute durations in Southwest Greensburg borough are 5 to 9 minutes (243 commuters, 23.6%), 10 to 14 minutes (237 commuters, 23.1%), and 15 to 19 minutes (128 commuters, 12.4%).
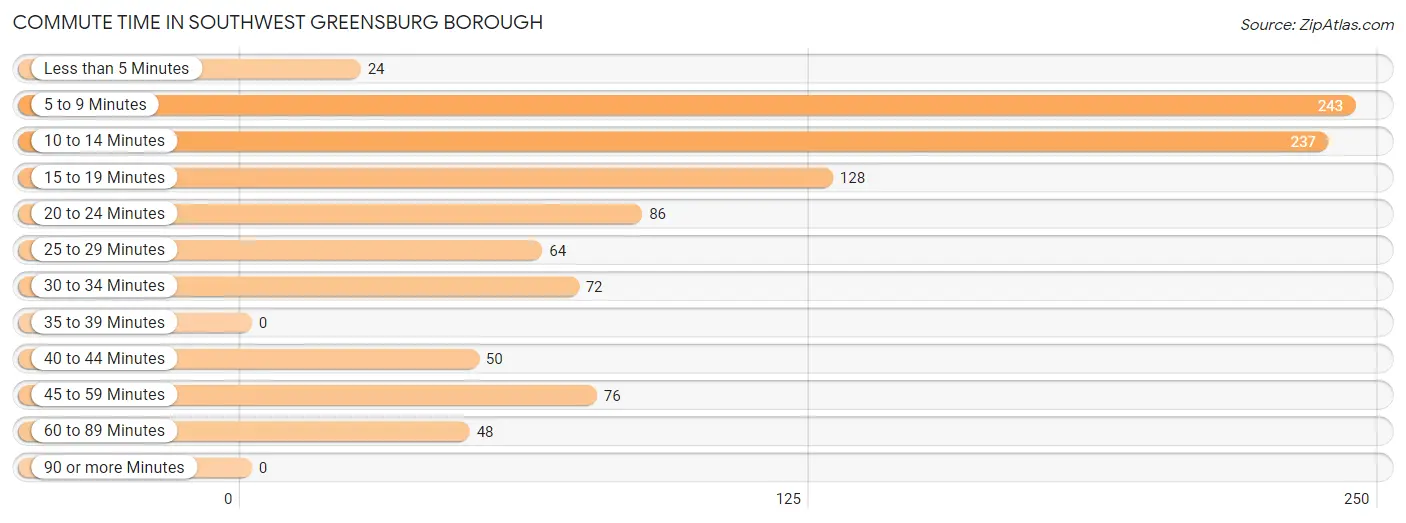
| Commute Time | # Commuters | % Commuters |
| Less than 5 Minutes | 24 | 2.3% |
| 5 to 9 Minutes | 243 | 23.6% |
| 10 to 14 Minutes | 237 | 23.1% |
| 15 to 19 Minutes | 128 | 12.4% |
| 20 to 24 Minutes | 86 | 8.4% |
| 25 to 29 Minutes | 64 | 6.2% |
| 30 to 34 Minutes | 72 | 7.0% |
| 35 to 39 Minutes | 0 | 0.0% |
| 40 to 44 Minutes | 50 | 4.9% |
| 45 to 59 Minutes | 76 | 7.4% |
| 60 to 89 Minutes | 48 | 4.7% |
| 90 or more Minutes | 0 | 0.0% |
Commute Time by Sex in Southwest Greensburg borough
The most common commute times in Southwest Greensburg borough are 10 to 14 minutes (139 commuters, 25.6%) for males and 5 to 9 minutes (133 commuters, 27.4%) for females.
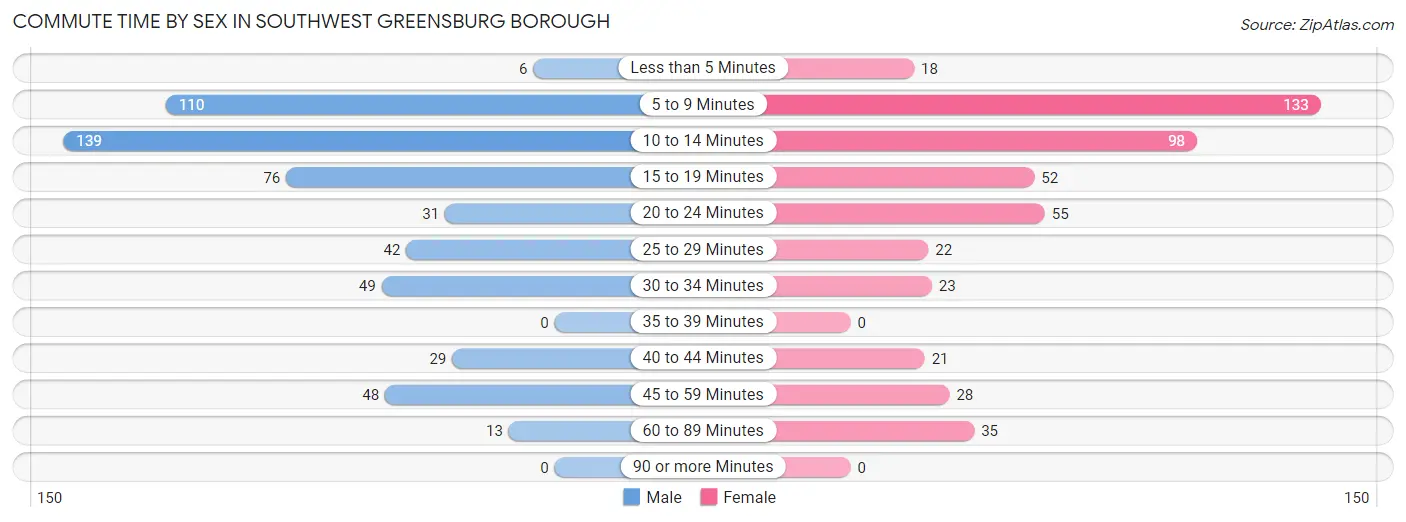
| Commute Time | Male | Female |
| Less than 5 Minutes | 6 (1.1%) | 18 (3.7%) |
| 5 to 9 Minutes | 110 (20.3%) | 133 (27.4%) |
| 10 to 14 Minutes | 139 (25.6%) | 98 (20.2%) |
| 15 to 19 Minutes | 76 (14.0%) | 52 (10.7%) |
| 20 to 24 Minutes | 31 (5.7%) | 55 (11.3%) |
| 25 to 29 Minutes | 42 (7.7%) | 22 (4.5%) |
| 30 to 34 Minutes | 49 (9.0%) | 23 (4.7%) |
| 35 to 39 Minutes | 0 (0.0%) | 0 (0.0%) |
| 40 to 44 Minutes | 29 (5.3%) | 21 (4.3%) |
| 45 to 59 Minutes | 48 (8.8%) | 28 (5.8%) |
| 60 to 89 Minutes | 13 (2.4%) | 35 (7.2%) |
| 90 or more Minutes | 0 (0.0%) | 0 (0.0%) |
Time of Departure to Work by Sex in Southwest Greensburg borough
The most frequent times of departure to work in Southwest Greensburg borough are 6:30 AM to 6:59 AM (93, 17.1%) for males and 7:30 AM to 7:59 AM (98, 20.2%) for females.
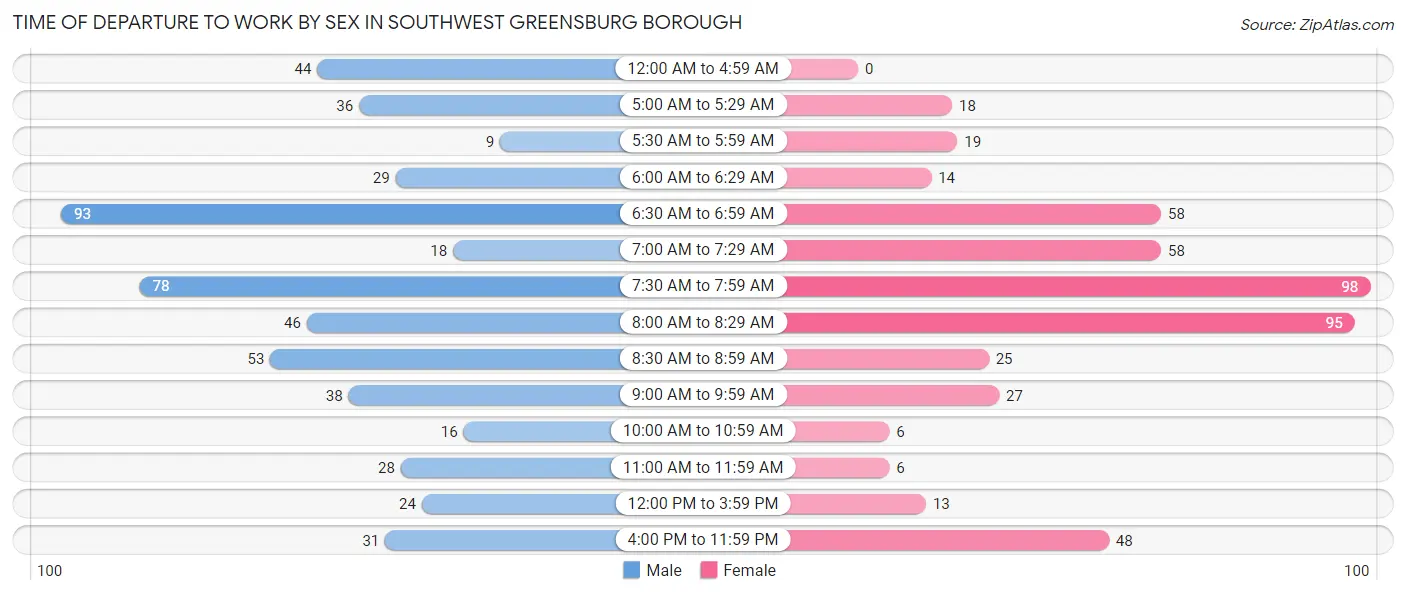
| Time of Departure | Male | Female |
| 12:00 AM to 4:59 AM | 44 (8.1%) | 0 (0.0%) |
| 5:00 AM to 5:29 AM | 36 (6.6%) | 18 (3.7%) |
| 5:30 AM to 5:59 AM | 9 (1.7%) | 19 (3.9%) |
| 6:00 AM to 6:29 AM | 29 (5.3%) | 14 (2.9%) |
| 6:30 AM to 6:59 AM | 93 (17.1%) | 58 (12.0%) |
| 7:00 AM to 7:29 AM | 18 (3.3%) | 58 (12.0%) |
| 7:30 AM to 7:59 AM | 78 (14.4%) | 98 (20.2%) |
| 8:00 AM to 8:29 AM | 46 (8.5%) | 95 (19.6%) |
| 8:30 AM to 8:59 AM | 53 (9.8%) | 25 (5.1%) |
| 9:00 AM to 9:59 AM | 38 (7.0%) | 27 (5.6%) |
| 10:00 AM to 10:59 AM | 16 (2.9%) | 6 (1.2%) |
| 11:00 AM to 11:59 AM | 28 (5.2%) | 6 (1.2%) |
| 12:00 PM to 3:59 PM | 24 (4.4%) | 13 (2.7%) |
| 4:00 PM to 11:59 PM | 31 (5.7%) | 48 (9.9%) |
| Total | 543 (100.0%) | 485 (100.0%) |
Housing Occupancy in Southwest Greensburg borough
Occupancy by Ownership in Southwest Greensburg borough
Of the total 1,004 dwellings in Southwest Greensburg borough, owner-occupied units account for 603 (60.1%), while renter-occupied units make up 401 (39.9%).
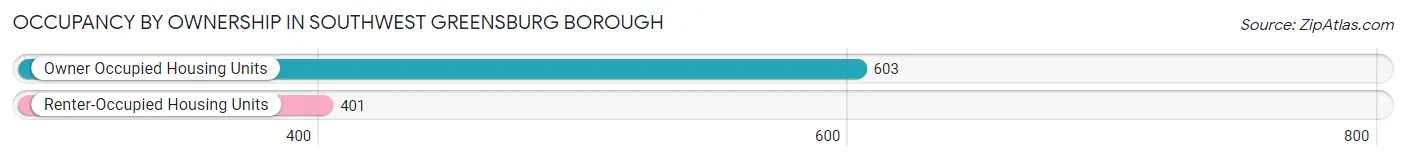
| Occupancy | # Housing Units | % Housing Units |
| Owner Occupied Housing Units | 603 | 60.1% |
| Renter-Occupied Housing Units | 401 | 39.9% |
| Total Occupied Housing Units | 1,004 | 100.0% |
Occupancy by Household Size in Southwest Greensburg borough
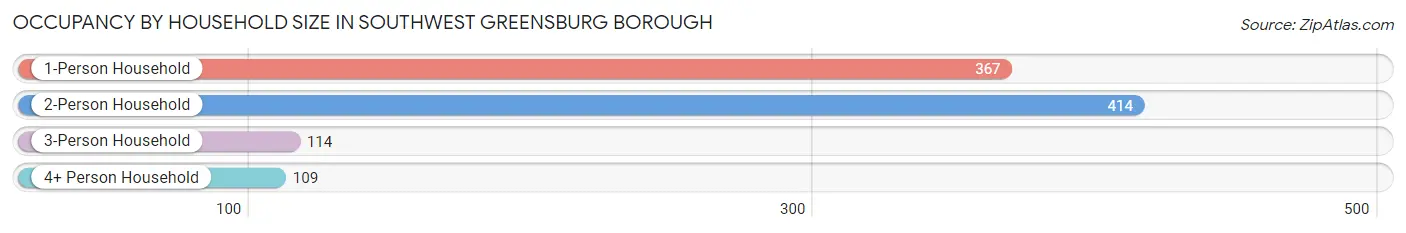
| Household Size | # Housing Units | % Housing Units |
| 1-Person Household | 367 | 36.5% |
| 2-Person Household | 414 | 41.2% |
| 3-Person Household | 114 | 11.4% |
| 4+ Person Household | 109 | 10.9% |
| Total Housing Units | 1,004 | 100.0% |
Occupancy by Ownership by Household Size in Southwest Greensburg borough
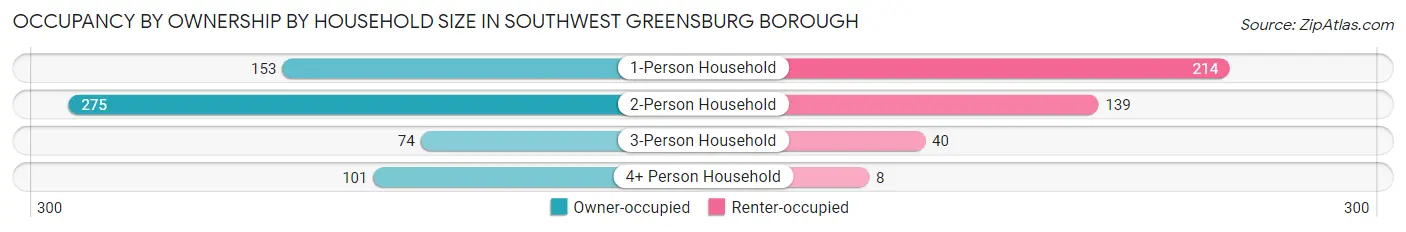
| Household Size | Owner-occupied | Renter-occupied |
| 1-Person Household | 153 (41.7%) | 214 (58.3%) |
| 2-Person Household | 275 (66.4%) | 139 (33.6%) |
| 3-Person Household | 74 (64.9%) | 40 (35.1%) |
| 4+ Person Household | 101 (92.7%) | 8 (7.3%) |
| Total Housing Units | 603 (60.1%) | 401 (39.9%) |
Occupancy by Educational Attainment in Southwest Greensburg borough
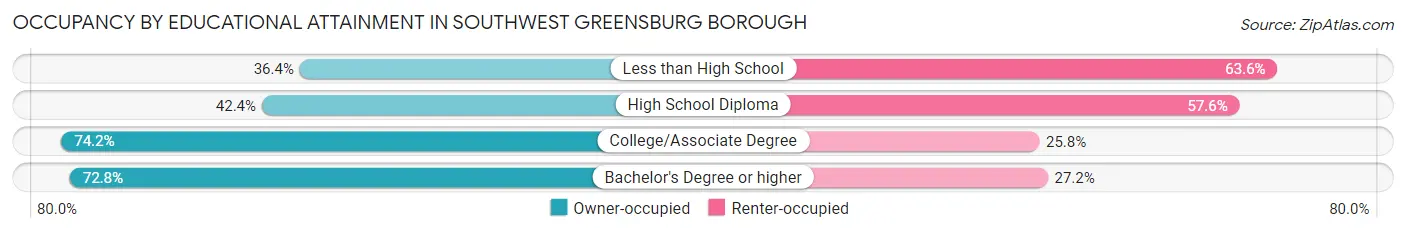
| Household Size | Owner-occupied | Renter-occupied |
| Less than High School | 16 (36.4%) | 28 (63.6%) |
| High School Diploma | 161 (42.4%) | 219 (57.6%) |
| College/Associate Degree | 201 (74.2%) | 70 (25.8%) |
| Bachelor's Degree or higher | 225 (72.8%) | 84 (27.2%) |
Occupancy by Age of Householder in Southwest Greensburg borough
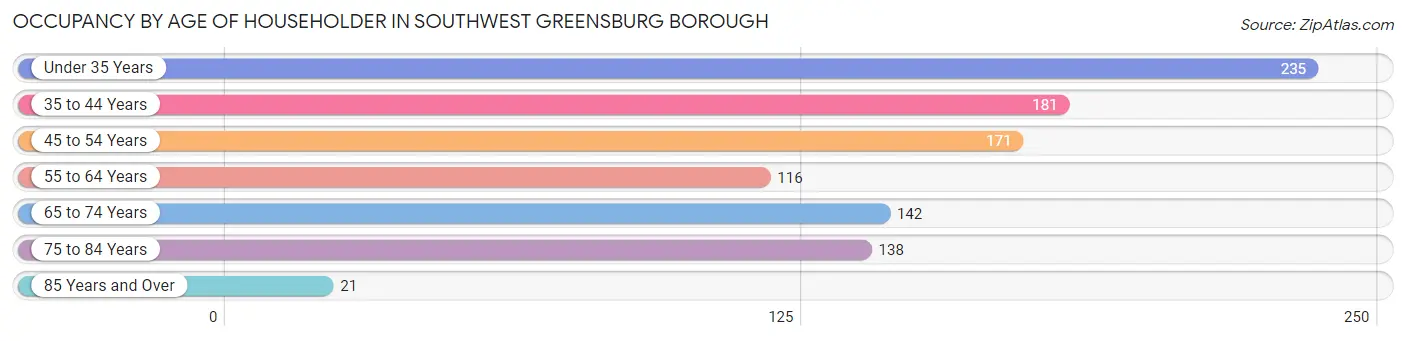
| Age Bracket | # Households | % Households |
| Under 35 Years | 235 | 23.4% |
| 35 to 44 Years | 181 | 18.0% |
| 45 to 54 Years | 171 | 17.0% |
| 55 to 64 Years | 116 | 11.6% |
| 65 to 74 Years | 142 | 14.1% |
| 75 to 84 Years | 138 | 13.8% |
| 85 Years and Over | 21 | 2.1% |
| Total | 1,004 | 100.0% |
Housing Finances in Southwest Greensburg borough
Median Income by Occupancy in Southwest Greensburg borough
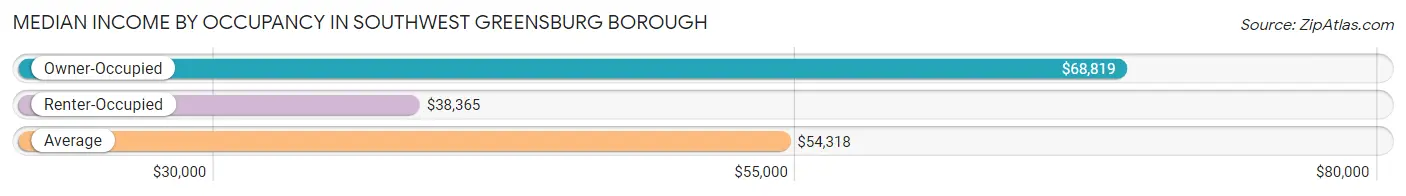
| Occupancy Type | # Households | Median Income |
| Owner-Occupied | 603 (60.1%) | $68,819 |
| Renter-Occupied | 401 (39.9%) | $38,365 |
| Average | 1,004 (100.0%) | $54,318 |
Occupancy by Householder Income Bracket in Southwest Greensburg borough
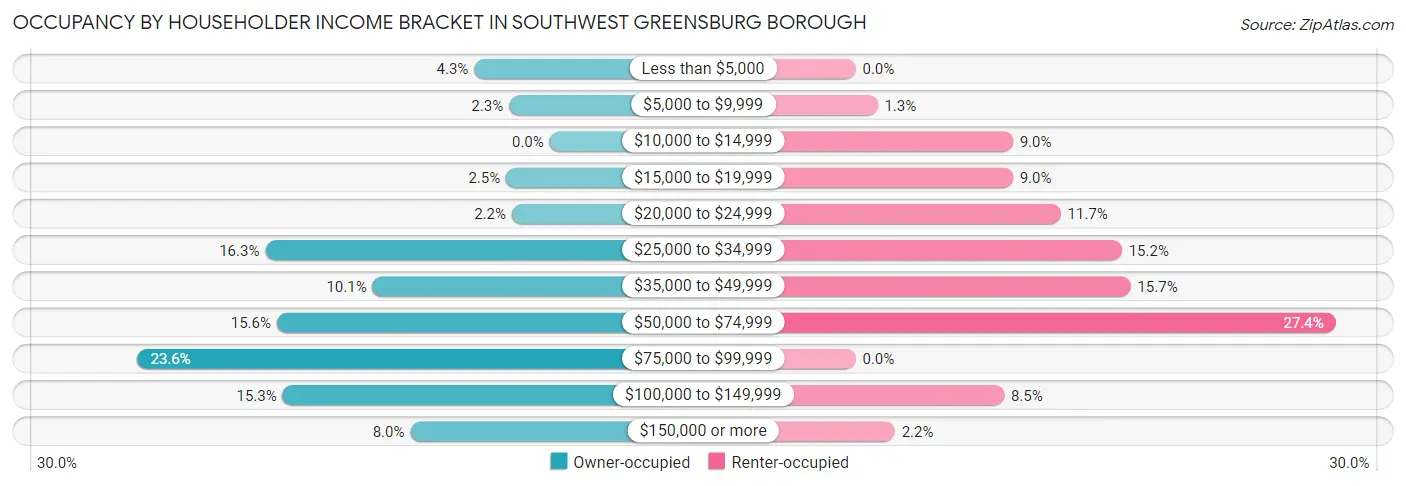
| Income Bracket | Owner-occupied | Renter-occupied |
| Less than $5,000 | 26 (4.3%) | 0 (0.0%) |
| $5,000 to $9,999 | 14 (2.3%) | 5 (1.3%) |
| $10,000 to $14,999 | 0 (0.0%) | 36 (9.0%) |
| $15,000 to $19,999 | 15 (2.5%) | 36 (9.0%) |
| $20,000 to $24,999 | 13 (2.2%) | 47 (11.7%) |
| $25,000 to $34,999 | 98 (16.3%) | 61 (15.2%) |
| $35,000 to $49,999 | 61 (10.1%) | 63 (15.7%) |
| $50,000 to $74,999 | 94 (15.6%) | 110 (27.4%) |
| $75,000 to $99,999 | 142 (23.5%) | 0 (0.0%) |
| $100,000 to $149,999 | 92 (15.3%) | 34 (8.5%) |
| $150,000 or more | 48 (8.0%) | 9 (2.2%) |
| Total | 603 (100.0%) | 401 (100.0%) |
Monthly Housing Cost Tiers in Southwest Greensburg borough
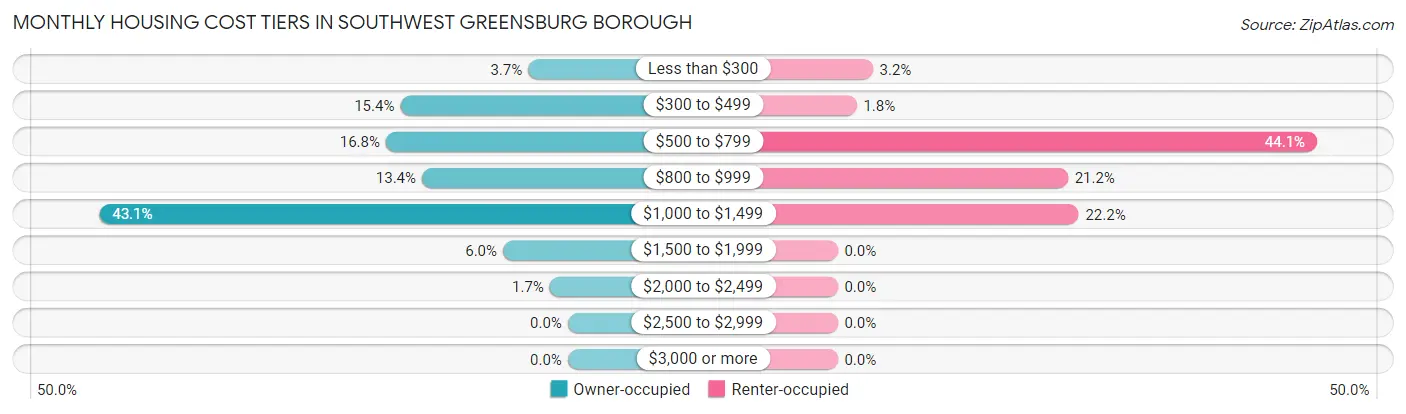
| Monthly Cost | Owner-occupied | Renter-occupied |
| Less than $300 | 22 (3.6%) | 13 (3.2%) |
| $300 to $499 | 93 (15.4%) | 7 (1.8%) |
| $500 to $799 | 101 (16.8%) | 177 (44.1%) |
| $800 to $999 | 81 (13.4%) | 85 (21.2%) |
| $1,000 to $1,499 | 260 (43.1%) | 89 (22.2%) |
| $1,500 to $1,999 | 36 (6.0%) | 0 (0.0%) |
| $2,000 to $2,499 | 10 (1.7%) | 0 (0.0%) |
| $2,500 to $2,999 | 0 (0.0%) | 0 (0.0%) |
| $3,000 or more | 0 (0.0%) | 0 (0.0%) |
| Total | 603 (100.0%) | 401 (100.0%) |
Physical Housing Characteristics in Southwest Greensburg borough
Housing Structures in Southwest Greensburg borough
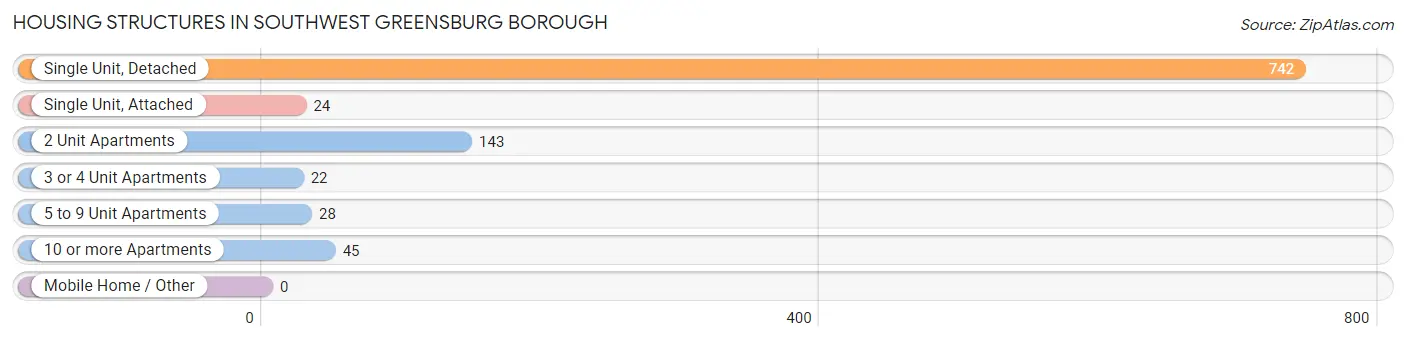
| Structure Type | # Housing Units | % Housing Units |
| Single Unit, Detached | 742 | 73.9% |
| Single Unit, Attached | 24 | 2.4% |
| 2 Unit Apartments | 143 | 14.2% |
| 3 or 4 Unit Apartments | 22 | 2.2% |
| 5 to 9 Unit Apartments | 28 | 2.8% |
| 10 or more Apartments | 45 | 4.5% |
| Mobile Home / Other | 0 | 0.0% |
| Total | 1,004 | 100.0% |
Housing Structures by Occupancy in Southwest Greensburg borough
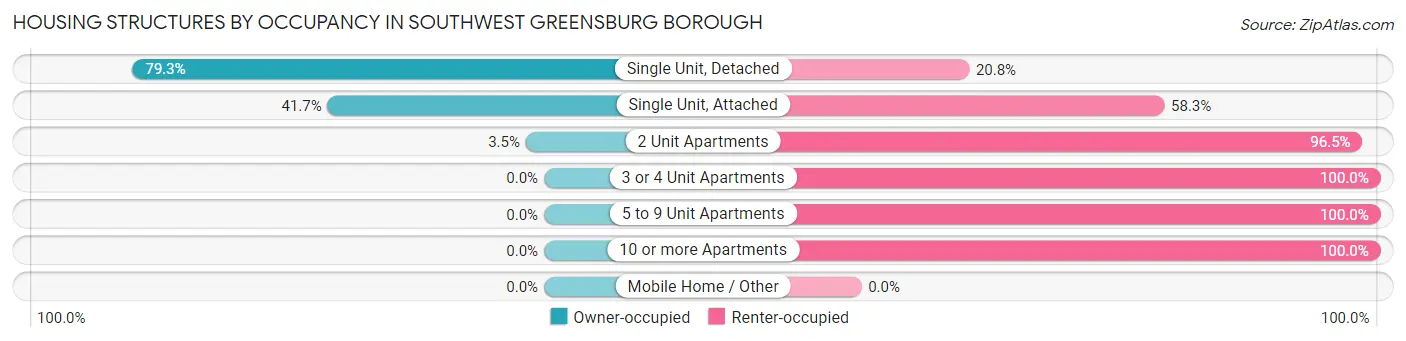
| Structure Type | Owner-occupied | Renter-occupied |
| Single Unit, Detached | 588 (79.2%) | 154 (20.7%) |
| Single Unit, Attached | 10 (41.7%) | 14 (58.3%) |
| 2 Unit Apartments | 5 (3.5%) | 138 (96.5%) |
| 3 or 4 Unit Apartments | 0 (0.0%) | 22 (100.0%) |
| 5 to 9 Unit Apartments | 0 (0.0%) | 28 (100.0%) |
| 10 or more Apartments | 0 (0.0%) | 45 (100.0%) |
| Mobile Home / Other | 0 (0.0%) | 0 (0.0%) |
| Total | 603 (60.1%) | 401 (39.9%) |
Housing Structures by Number of Rooms in Southwest Greensburg borough
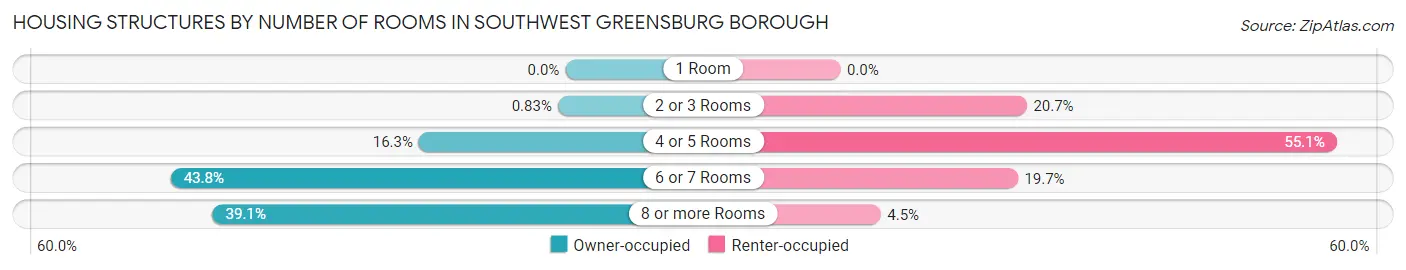
| Number of Rooms | Owner-occupied | Renter-occupied |
| 1 Room | 0 (0.0%) | 0 (0.0%) |
| 2 or 3 Rooms | 5 (0.8%) | 83 (20.7%) |
| 4 or 5 Rooms | 98 (16.3%) | 221 (55.1%) |
| 6 or 7 Rooms | 264 (43.8%) | 79 (19.7%) |
| 8 or more Rooms | 236 (39.1%) | 18 (4.5%) |
| Total | 603 (100.0%) | 401 (100.0%) |
Housing Structure by Heating Type in Southwest Greensburg borough
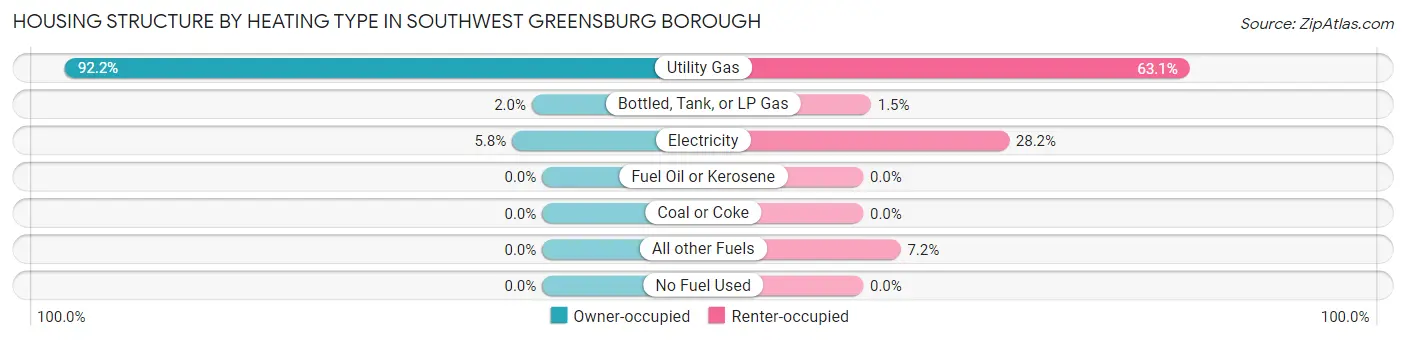
| Heating Type | Owner-occupied | Renter-occupied |
| Utility Gas | 556 (92.2%) | 253 (63.1%) |
| Bottled, Tank, or LP Gas | 12 (2.0%) | 6 (1.5%) |
| Electricity | 35 (5.8%) | 113 (28.2%) |
| Fuel Oil or Kerosene | 0 (0.0%) | 0 (0.0%) |
| Coal or Coke | 0 (0.0%) | 0 (0.0%) |
| All other Fuels | 0 (0.0%) | 29 (7.2%) |
| No Fuel Used | 0 (0.0%) | 0 (0.0%) |
| Total | 603 (100.0%) | 401 (100.0%) |
Household Vehicle Usage in Southwest Greensburg borough
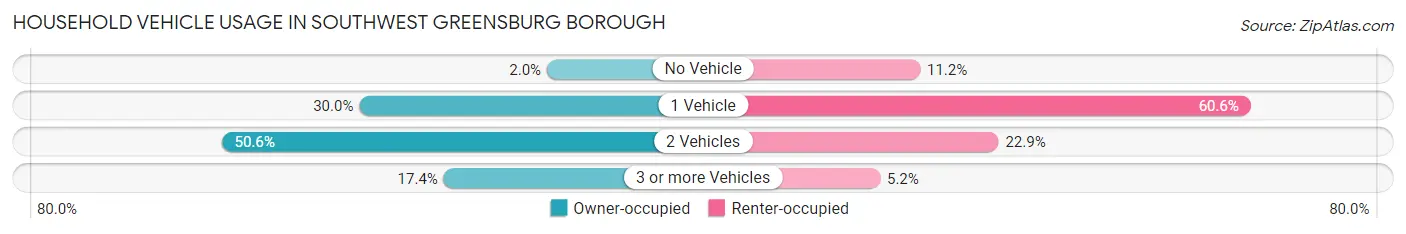
| Vehicles per Household | Owner-occupied | Renter-occupied |
| No Vehicle | 12 (2.0%) | 45 (11.2%) |
| 1 Vehicle | 181 (30.0%) | 243 (60.6%) |
| 2 Vehicles | 305 (50.6%) | 92 (22.9%) |
| 3 or more Vehicles | 105 (17.4%) | 21 (5.2%) |
| Total | 603 (100.0%) | 401 (100.0%) |
Real Estate & Mortgages in Southwest Greensburg borough
Real Estate and Mortgage Overview in Southwest Greensburg borough
| Characteristic | Without Mortgage | With Mortgage |
| Housing Units | 171 | 432 |
| Median Property Value | $161,900 | $142,100 |
| Median Household Income | $62,750 | $30 |
| Monthly Housing Costs | $460 | $0 |
| Real Estate Taxes | $1,780 | $5 |
Property Value by Mortgage Status in Southwest Greensburg borough
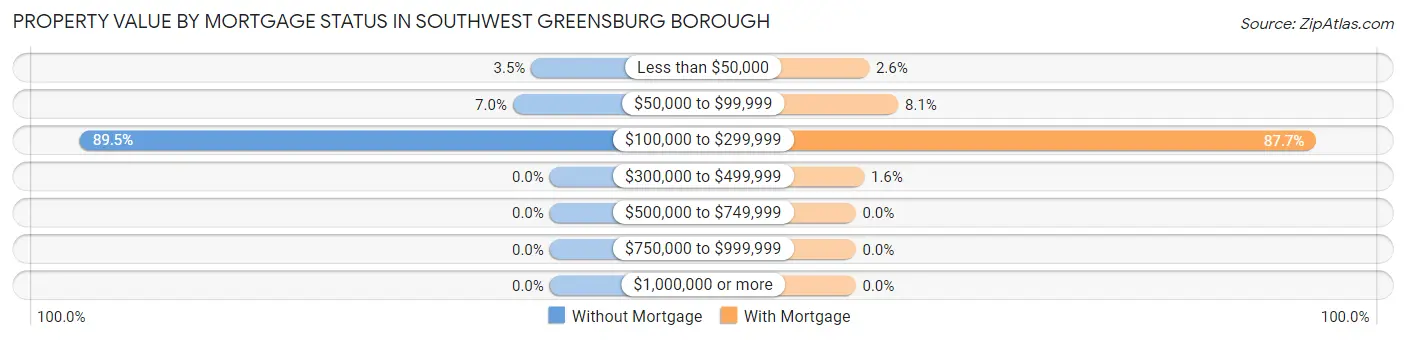
| Property Value | Without Mortgage | With Mortgage |
| Less than $50,000 | 6 (3.5%) | 11 (2.5%) |
| $50,000 to $99,999 | 12 (7.0%) | 35 (8.1%) |
| $100,000 to $299,999 | 153 (89.5%) | 379 (87.7%) |
| $300,000 to $499,999 | 0 (0.0%) | 7 (1.6%) |
| $500,000 to $749,999 | 0 (0.0%) | 0 (0.0%) |
| $750,000 to $999,999 | 0 (0.0%) | 0 (0.0%) |
| $1,000,000 or more | 0 (0.0%) | 0 (0.0%) |
| Total | 171 (100.0%) | 432 (100.0%) |
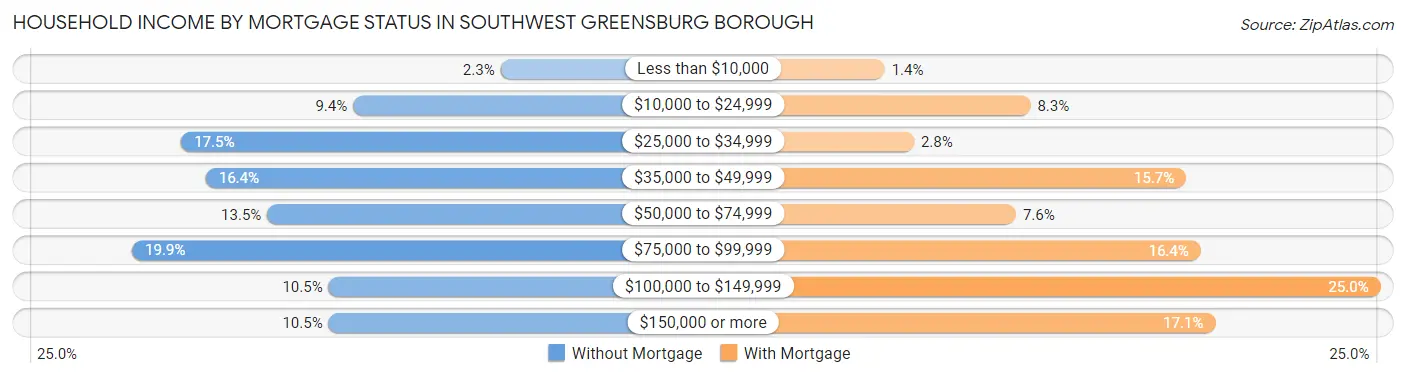
Household Income by Mortgage Status in Southwest Greensburg borough
| Household Income | Without Mortgage | With Mortgage |
| Less than $10,000 | 4 (2.3%) | 6 (1.4%) |
| $10,000 to $24,999 | 16 (9.4%) | 36 (8.3%) |
| $25,000 to $34,999 | 30 (17.5%) | 12 (2.8%) |
| $35,000 to $49,999 | 28 (16.4%) | 68 (15.7%) |
| $50,000 to $74,999 | 23 (13.5%) | 33 (7.6%) |
| $75,000 to $99,999 | 34 (19.9%) | 71 (16.4%) |
| $100,000 to $149,999 | 18 (10.5%) | 108 (25.0%) |
| $150,000 or more | 18 (10.5%) | 74 (17.1%) |
| Total | 171 (100.0%) | 432 (100.0%) |
Property Value to Household Income Ratio in Southwest Greensburg borough
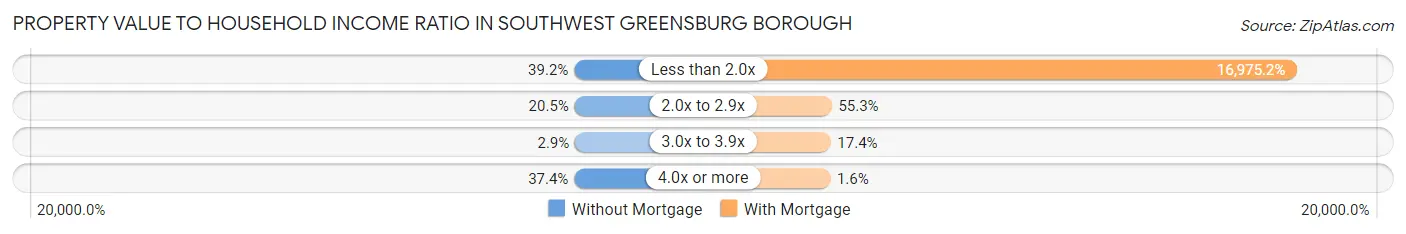
| Value-to-Income Ratio | Without Mortgage | With Mortgage |
| Less than 2.0x | 67 (39.2%) | 73,333 (16,975.2%) |
| 2.0x to 2.9x | 35 (20.5%) | 239 (55.3%) |
| 3.0x to 3.9x | 5 (2.9%) | 75 (17.4%) |
| 4.0x or more | 64 (37.4%) | 7 (1.6%) |
| Total | 171 (100.0%) | 432 (100.0%) |
Real Estate Taxes by Mortgage Status in Southwest Greensburg borough
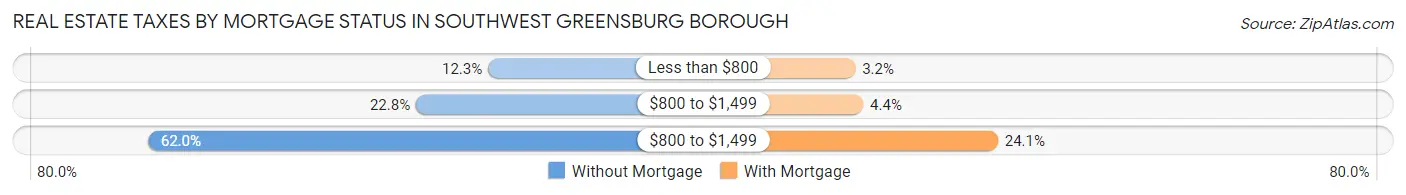
| Property Taxes | Without Mortgage | With Mortgage |
| Less than $800 | 21 (12.3%) | 14 (3.2%) |
| $800 to $1,499 | 39 (22.8%) | 19 (4.4%) |
| $800 to $1,499 | 106 (62.0%) | 104 (24.1%) |
| Total | 171 (100.0%) | 432 (100.0%) |
Health & Disability in Southwest Greensburg borough
Health Insurance Coverage by Age in Southwest Greensburg borough
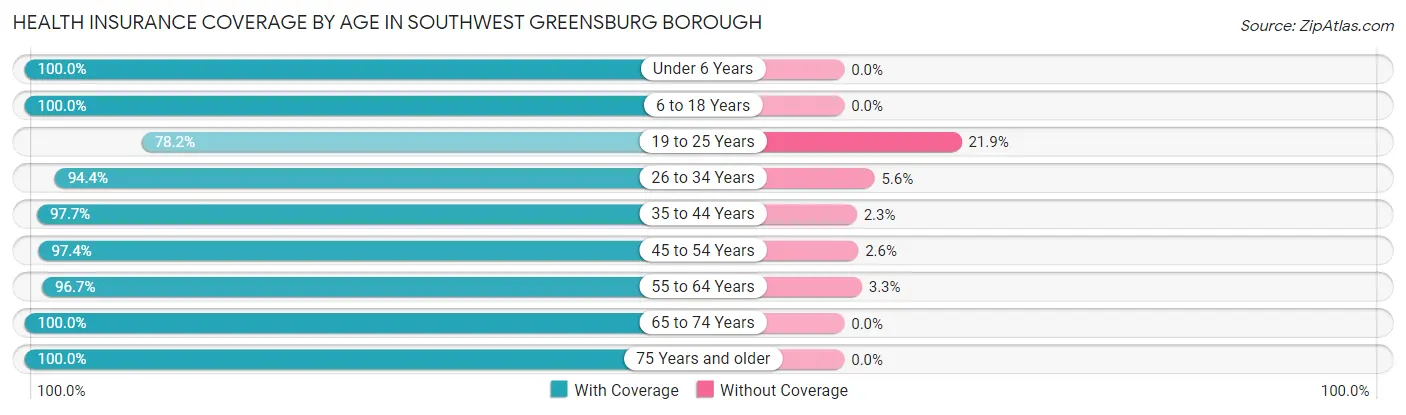
| Age Bracket | With Coverage | Without Coverage |
| Under 6 Years | 111 (100.0%) | 0 (0.0%) |
| 6 to 18 Years | 190 (100.0%) | 0 (0.0%) |
| 19 to 25 Years | 93 (78.1%) | 26 (21.8%) |
| 26 to 34 Years | 336 (94.4%) | 20 (5.6%) |
| 35 to 44 Years | 254 (97.7%) | 6 (2.3%) |
| 45 to 54 Years | 263 (97.4%) | 7 (2.6%) |
| 55 to 64 Years | 208 (96.7%) | 7 (3.3%) |
| 65 to 74 Years | 233 (100.0%) | 0 (0.0%) |
| 75 Years and older | 258 (100.0%) | 0 (0.0%) |
| Total | 1,946 (96.7%) | 66 (3.3%) |
Health Insurance Coverage by Citizenship Status in Southwest Greensburg borough
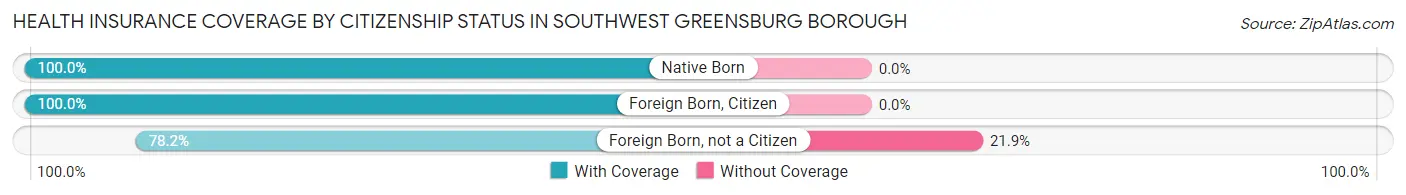
| Citizenship Status | With Coverage | Without Coverage |
| Native Born | 111 (100.0%) | 0 (0.0%) |
| Foreign Born, Citizen | 190 (100.0%) | 0 (0.0%) |
| Foreign Born, not a Citizen | 93 (78.1%) | 26 (21.8%) |
Health Insurance Coverage by Household Income in Southwest Greensburg borough
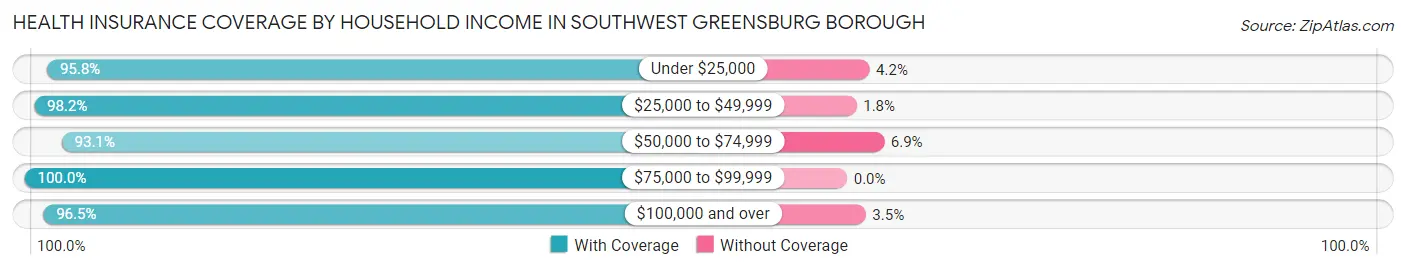
| Household Income | With Coverage | Without Coverage |
| Under $25,000 | 297 (95.8%) | 13 (4.2%) |
| $25,000 to $49,999 | 497 (98.2%) | 9 (1.8%) |
| $50,000 to $74,999 | 335 (93.1%) | 25 (6.9%) |
| $75,000 to $99,999 | 292 (100.0%) | 0 (0.0%) |
| $100,000 and over | 525 (96.5%) | 19 (3.5%) |
Public vs Private Health Insurance Coverage by Age in Southwest Greensburg borough
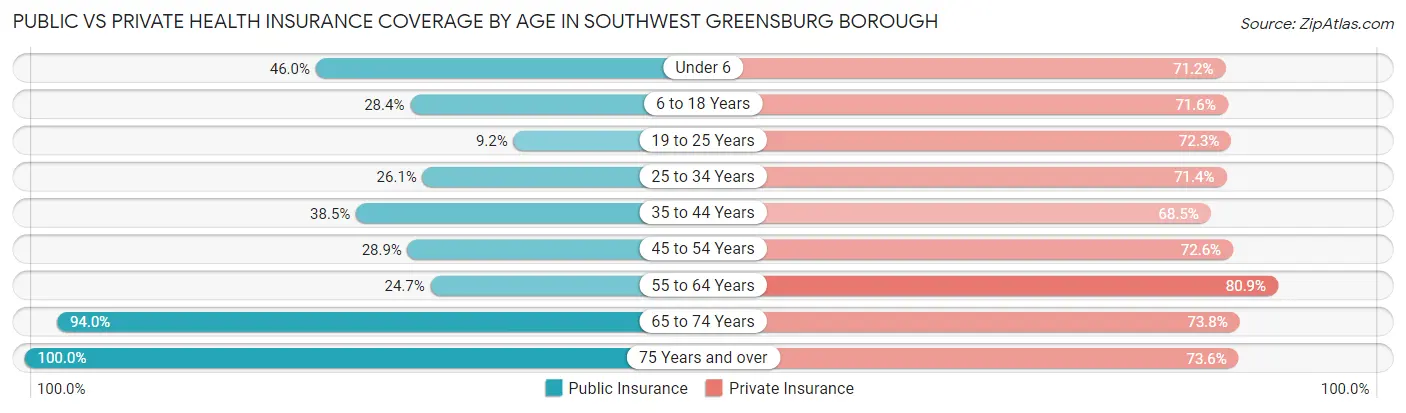
| Age Bracket | Public Insurance | Private Insurance |
| Under 6 | 51 (46.0%) | 79 (71.2%) |
| 6 to 18 Years | 54 (28.4%) | 136 (71.6%) |
| 19 to 25 Years | 11 (9.2%) | 86 (72.3%) |
| 25 to 34 Years | 93 (26.1%) | 254 (71.4%) |
| 35 to 44 Years | 100 (38.5%) | 178 (68.5%) |
| 45 to 54 Years | 78 (28.9%) | 196 (72.6%) |
| 55 to 64 Years | 53 (24.6%) | 174 (80.9%) |
| 65 to 74 Years | 219 (94.0%) | 172 (73.8%) |
| 75 Years and over | 258 (100.0%) | 190 (73.6%) |
| Total | 917 (45.6%) | 1,465 (72.8%) |
Disability Status by Sex by Age in Southwest Greensburg borough
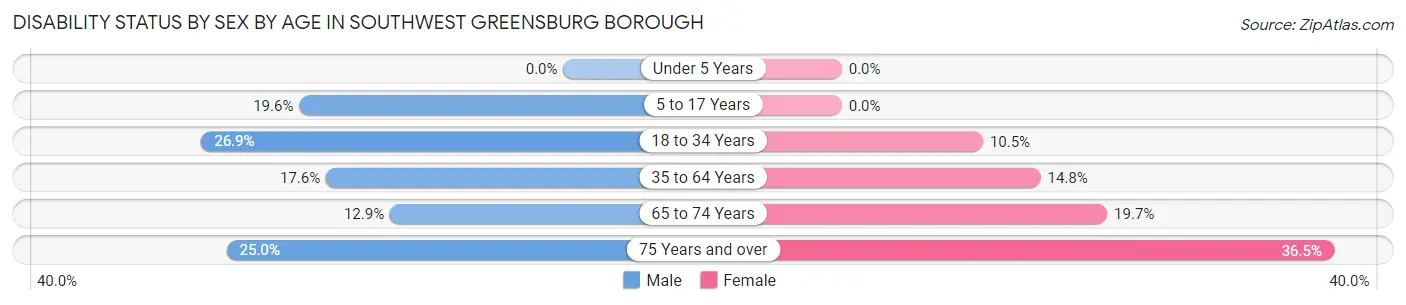
| Age Bracket | Male | Female |
| Under 5 Years | 0 (0.0%) | 0 (0.0%) |
| 5 to 17 Years | 20 (19.6%) | 0 (0.0%) |
| 18 to 34 Years | 68 (26.9%) | 24 (10.5%) |
| 35 to 64 Years | 68 (17.6%) | 53 (14.8%) |
| 65 to 74 Years | 13 (12.9%) | 26 (19.7%) |
| 75 Years and over | 20 (25.0%) | 65 (36.5%) |
Disability Class by Sex by Age in Southwest Greensburg borough
Disability Class: Hearing Difficulty
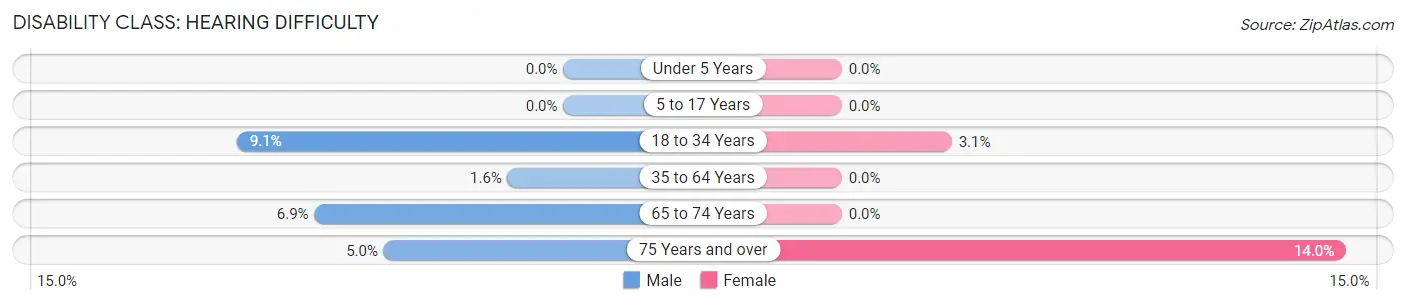
| Age Bracket | Male | Female |
| Under 5 Years | 0 (0.0%) | 0 (0.0%) |
| 5 to 17 Years | 0 (0.0%) | 0 (0.0%) |
| 18 to 34 Years | 23 (9.1%) | 7 (3.1%) |
| 35 to 64 Years | 6 (1.5%) | 0 (0.0%) |
| 65 to 74 Years | 7 (6.9%) | 0 (0.0%) |
| 75 Years and over | 4 (5.0%) | 25 (14.0%) |
Disability Class: Vision Difficulty
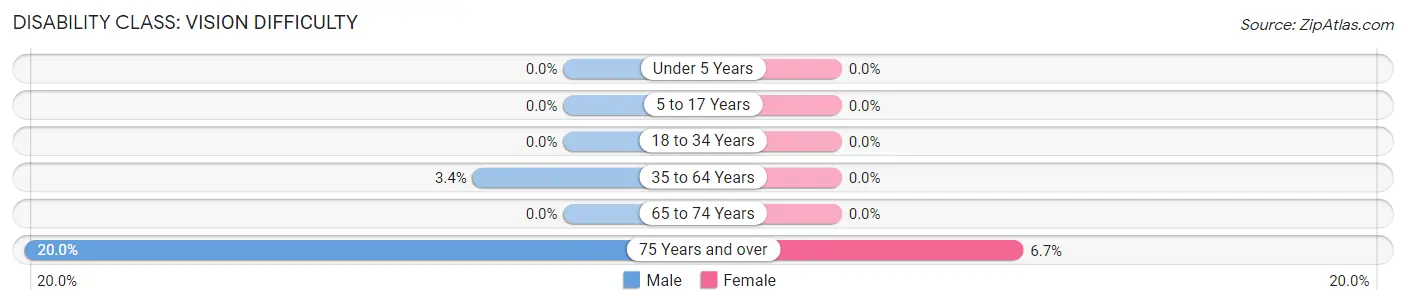
| Age Bracket | Male | Female |
| Under 5 Years | 0 (0.0%) | 0 (0.0%) |
| 5 to 17 Years | 0 (0.0%) | 0 (0.0%) |
| 18 to 34 Years | 0 (0.0%) | 0 (0.0%) |
| 35 to 64 Years | 13 (3.4%) | 0 (0.0%) |
| 65 to 74 Years | 0 (0.0%) | 0 (0.0%) |
| 75 Years and over | 16 (20.0%) | 12 (6.7%) |
Disability Class: Cognitive Difficulty
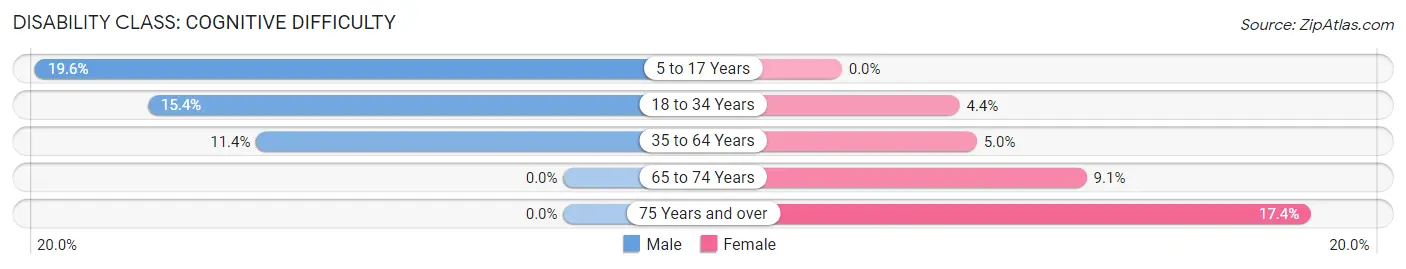
| Age Bracket | Male | Female |
| 5 to 17 Years | 20 (19.6%) | 0 (0.0%) |
| 18 to 34 Years | 39 (15.4%) | 10 (4.4%) |
| 35 to 64 Years | 44 (11.4%) | 18 (5.0%) |
| 65 to 74 Years | 0 (0.0%) | 12 (9.1%) |
| 75 Years and over | 0 (0.0%) | 31 (17.4%) |
Disability Class: Ambulatory Difficulty
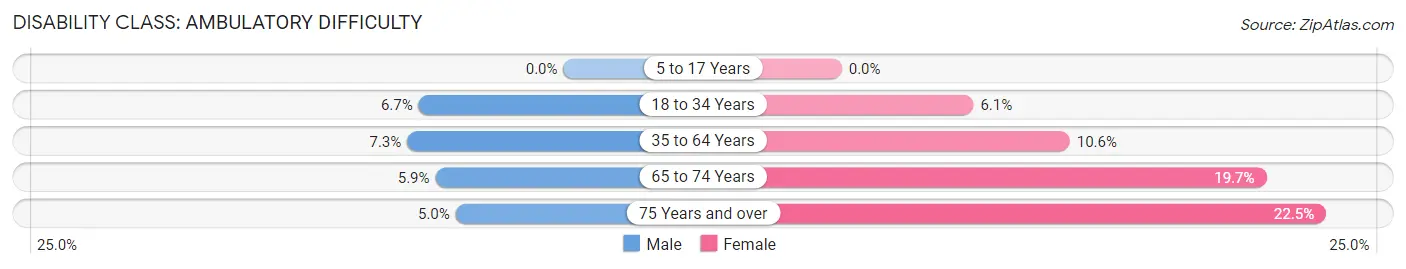
| Age Bracket | Male | Female |
| 5 to 17 Years | 0 (0.0%) | 0 (0.0%) |
| 18 to 34 Years | 17 (6.7%) | 14 (6.1%) |
| 35 to 64 Years | 28 (7.2%) | 38 (10.6%) |
| 65 to 74 Years | 6 (5.9%) | 26 (19.7%) |
| 75 Years and over | 4 (5.0%) | 40 (22.5%) |
Disability Class: Self-Care Difficulty
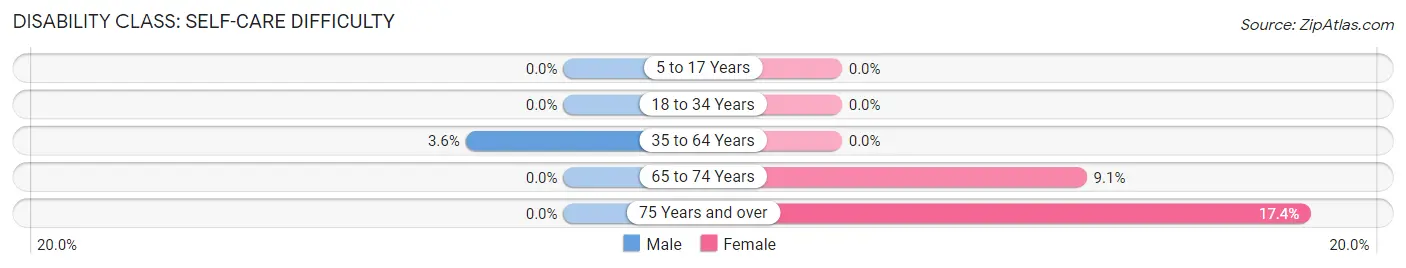
| Age Bracket | Male | Female |
| 5 to 17 Years | 0 (0.0%) | 0 (0.0%) |
| 18 to 34 Years | 0 (0.0%) | 0 (0.0%) |
| 35 to 64 Years | 14 (3.6%) | 0 (0.0%) |
| 65 to 74 Years | 0 (0.0%) | 12 (9.1%) |
| 75 Years and over | 0 (0.0%) | 31 (17.4%) |
Technology Access in Southwest Greensburg borough
Computing Device Access in Southwest Greensburg borough
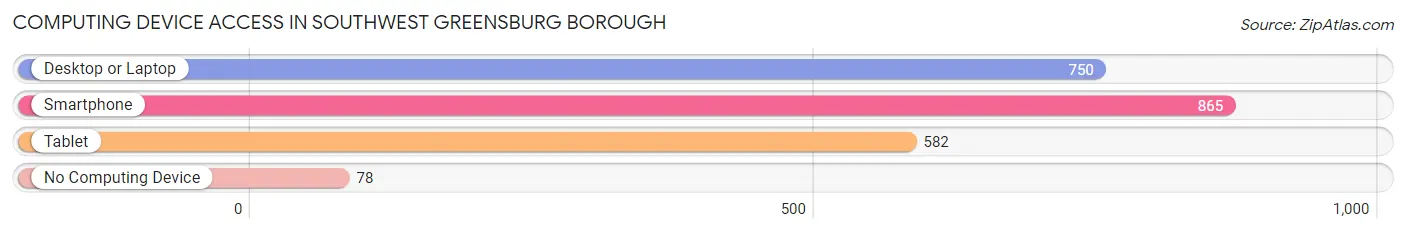
| Device Type | # Households | % Households |
| Desktop or Laptop | 750 | 74.7% |
| Smartphone | 865 | 86.2% |
| Tablet | 582 | 58.0% |
| No Computing Device | 78 | 7.8% |
| Total | 1,004 | 100.0% |
Internet Access in Southwest Greensburg borough
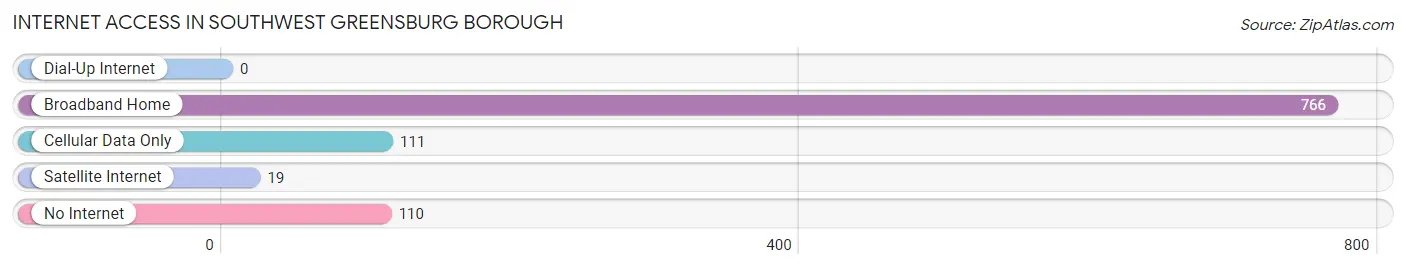
| Internet Type | # Households | % Households |
| Dial-Up Internet | 0 | 0.0% |
| Broadband Home | 766 | 76.3% |
| Cellular Data Only | 111 | 11.1% |
| Satellite Internet | 19 | 1.9% |
| No Internet | 110 | 11.0% |
| Total | 1,004 | 100.0% |
Southwest Greensburg borough Summary
Southwest Greensburg Borough is a small borough located in Westmoreland County, Pennsylvania. It is situated in the southwestern corner of the county, and is bordered by the townships of Hempfield, South Greensburg, and Salem. The borough is home to a population of approximately 1,400 people, and is part of the greater Greensburg metropolitan area.
History
Southwest Greensburg Borough was founded in 1872, when the area was still part of the larger Hempfield Township. The borough was created out of a portion of the township, and was named after the nearby city of Greensburg. The borough was officially incorporated in 1873, and the first mayor was elected in 1874.
The borough was originally a rural farming community, and the main industry was agriculture. In the early 1900s, the borough began to experience a period of growth and development. The population increased, and new businesses began to open. The borough was also home to several coal mines, which provided employment for many of the residents.
In the 1950s, the borough began to experience a period of decline. Many of the businesses closed, and the population began to decline. In the late 1970s, the borough began to experience a period of revitalization. New businesses opened, and the population began to increase.
Geography
Southwest Greensburg Borough is located in the southwestern corner of Westmoreland County, Pennsylvania. It is bordered by the townships of Hempfield, South Greensburg, and Salem. The borough is situated in the foothills of the Allegheny Mountains, and is located approximately 25 miles southeast of Pittsburgh.
The borough is home to a total area of 1.2 square miles, all of which is land. The borough is located in a hilly region, and is home to several small streams and creeks. The borough is also home to several parks and recreational areas, including the Southwest Greensburg Community Park.
Economy
The economy of Southwest Greensburg Borough is largely based on the service industry. The borough is home to several small businesses, including restaurants, retail stores, and professional services. The borough is also home to several manufacturing companies, including a steel mill and a paper mill.
The borough is also home to several educational institutions, including a community college and a technical school. The borough is also home to several healthcare facilities, including a hospital and several medical clinics.
Demographics
As of the 2010 census, the population of Southwest Greensburg Borough was 1,400. The racial makeup of the borough was 97.3% White, 0.9% African American, 0.3% Native American, 0.3% Asian, and 0.9% from other races. Hispanic or Latino of any race were 1.3% of the population.
The median household income in the borough was $37,500, and the median family income was $45,000. The per capita income in the borough was $19,000. Approximately 11.3% of the population was below the poverty line.
Common Questions
What is Per Capita Income in Southwest Greensburg borough?
Per Capita income in Southwest Greensburg borough is $37,820.
What is the Median Family Income in Southwest Greensburg borough?
Median Family Income in Southwest Greensburg borough is $70,750.
What is the Median Household income in Southwest Greensburg borough?
Median Household Income in Southwest Greensburg borough is $54,318.
What is Income or Wage Gap in Southwest Greensburg borough?
Income or Wage Gap in Southwest Greensburg borough is 29.2%.
Women in Southwest Greensburg borough earn 70.8 cents for every dollar earned by a man.
What is Inequality or Gini Index in Southwest Greensburg borough?
Inequality or Gini Index in Southwest Greensburg borough is 0.47.
What is the Total Population of Southwest Greensburg borough?
Total Population of Southwest Greensburg borough is 2,012.
What is the Total Male Population of Southwest Greensburg borough?
Total Male Population of Southwest Greensburg borough is 958.
What is the Total Female Population of Southwest Greensburg borough?
Total Female Population of Southwest Greensburg borough is 1,054.
What is the Ratio of Males per 100 Females in Southwest Greensburg borough?
There are 90.89 Males per 100 Females in Southwest Greensburg borough.
What is the Ratio of Females per 100 Males in Southwest Greensburg borough?
There are 110.02 Females per 100 Males in Southwest Greensburg borough.
What is the Median Population Age in Southwest Greensburg borough?
Median Population Age in Southwest Greensburg borough is 43.9 Years.
What is the Average Family Size in Southwest Greensburg borough
Average Family Size in Southwest Greensburg borough is 2.6 People.
What is the Average Household Size in Southwest Greensburg borough
Average Household Size in Southwest Greensburg borough is 2.0 People.
How Large is the Labor Force in Southwest Greensburg borough?
There are 1,123 People in the Labor Forcein in Southwest Greensburg borough.
What is the Percentage of People in the Labor Force in Southwest Greensburg borough?
63.6% of People are in the Labor Force in Southwest Greensburg borough.
What is the Unemployment Rate in Southwest Greensburg borough?
Unemployment Rate in Southwest Greensburg borough is 4.8%.