South Williamsport borough, PA Map & Demographics
South Williamsport borough Overview
$32,558
PER CAPITA INCOME
$77,813
AVG FAMILY INCOME
$60,020
AVG HOUSEHOLD INCOME
21.6%
WAGE / INCOME GAP [ % ]
78.4¢/ $1
WAGE / INCOME GAP [ $ ]
0.43
INEQUALITY / GINI INDEX
6,246
TOTAL POPULATION
3,155
MALE POPULATION
3,091
FEMALE POPULATION
102.07
MALES / 100 FEMALES
97.97
FEMALES / 100 MALES
41.7
MEDIAN AGE
2.9
AVG FAMILY SIZE
2.4
AVG HOUSEHOLD SIZE
3,196
LABOR FORCE [ PEOPLE ]
61.1%
PERCENT IN LABOR FORCE
6.4%
UNEMPLOYMENT RATE
Income in South Williamsport borough
Income Overview in South Williamsport borough
Per Capita Income in South Williamsport borough is $32,558, while median incomes of families and households are $77,813 and $60,020 respectively.
| Characteristic | Number | Measure |
| Per Capita Income | 6,246 | $32,558 |
| Median Family Income | 1,633 | $77,813 |
| Mean Family Income | 1,633 | $91,169 |
| Median Household Income | 2,600 | $60,020 |
| Mean Household Income | 2,600 | $76,706 |
| Income Deficit | 1,633 | $0 |
| Wage / Income Gap (%) | 6,246 | 21.60% |
| Wage / Income Gap ($) | 6,246 | 78.40¢ per $1 |
| Gini / Inequality Index | 6,246 | 0.43 |
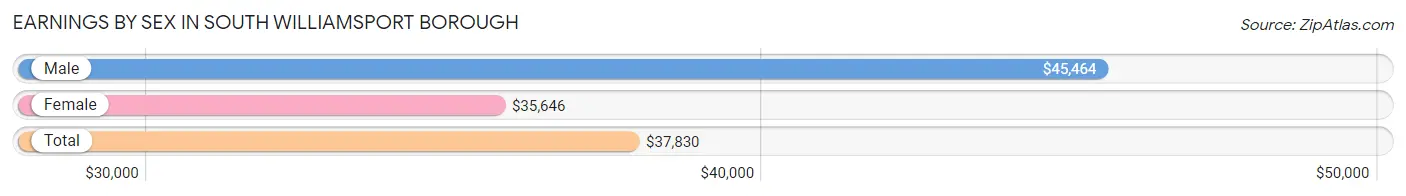
Earnings by Sex in South Williamsport borough
Average Earnings in South Williamsport borough are $37,830, $45,464 for men and $35,646 for women, a difference of 21.6%.
| Sex | Number | Average Earnings |
| Male | 1,730 (52.7%) | $45,464 |
| Female | 1,553 (47.3%) | $35,646 |
| Total | 3,283 (100.0%) | $37,830 |
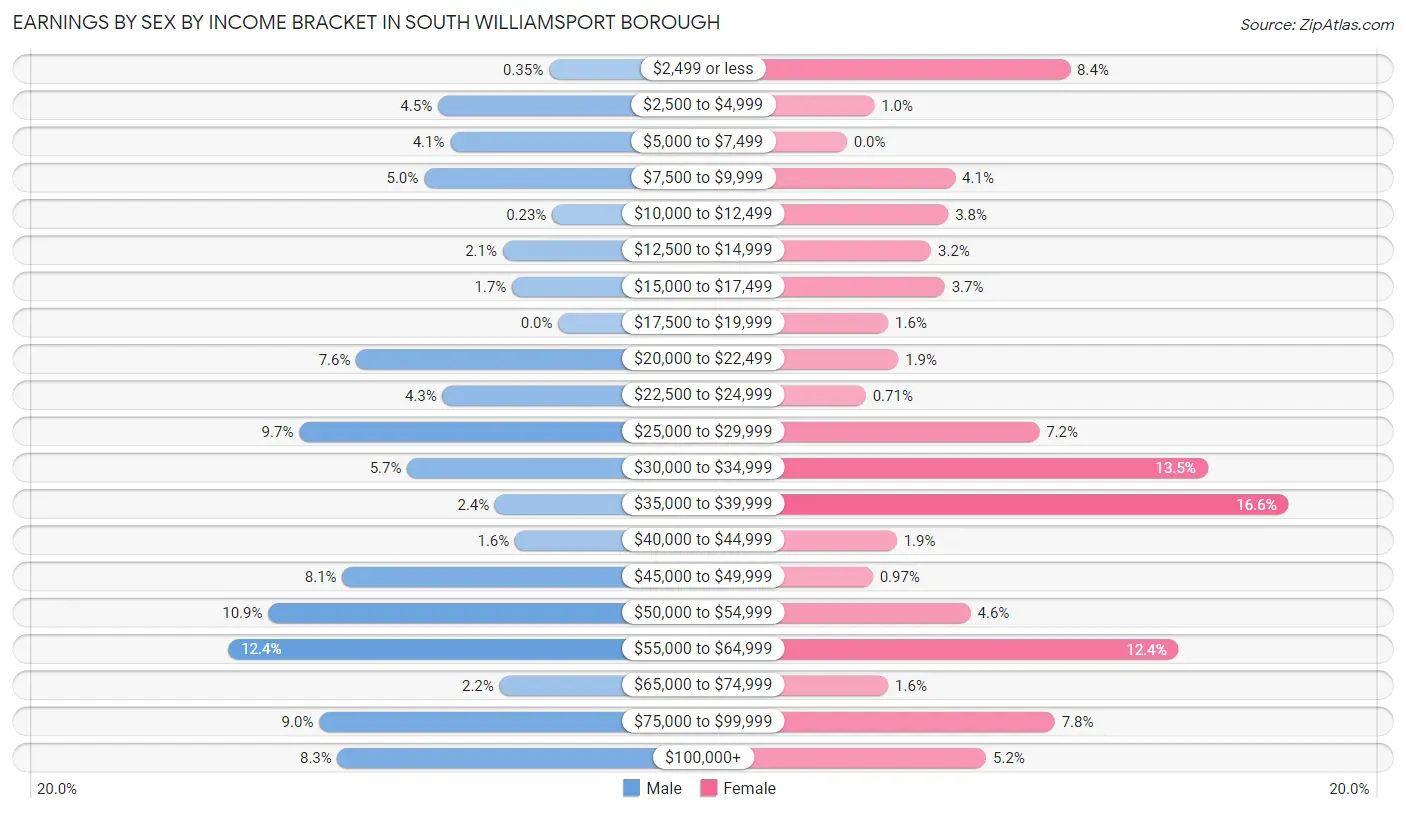
Earnings by Sex by Income Bracket in South Williamsport borough
The most common earnings brackets in South Williamsport borough are $55,000 to $64,999 for men (214 | 12.4%) and $35,000 to $39,999 for women (257 | 16.6%).
| Income | Male | Female |
| $2,499 or less | 6 (0.4%) | 130 (8.4%) |
| $2,500 to $4,999 | 78 (4.5%) | 16 (1.0%) |
| $5,000 to $7,499 | 70 (4.1%) | 0 (0.0%) |
| $7,500 to $9,999 | 87 (5.0%) | 63 (4.1%) |
| $10,000 to $12,499 | 4 (0.2%) | 59 (3.8%) |
| $12,500 to $14,999 | 36 (2.1%) | 49 (3.2%) |
| $15,000 to $17,499 | 30 (1.7%) | 57 (3.7%) |
| $17,500 to $19,999 | 0 (0.0%) | 24 (1.5%) |
| $20,000 to $22,499 | 131 (7.6%) | 30 (1.9%) |
| $22,500 to $24,999 | 75 (4.3%) | 11 (0.7%) |
| $25,000 to $29,999 | 168 (9.7%) | 112 (7.2%) |
| $30,000 to $34,999 | 98 (5.7%) | 210 (13.5%) |
| $35,000 to $39,999 | 41 (2.4%) | 257 (16.6%) |
| $40,000 to $44,999 | 28 (1.6%) | 29 (1.9%) |
| $45,000 to $49,999 | 140 (8.1%) | 15 (1.0%) |
| $50,000 to $54,999 | 188 (10.9%) | 72 (4.6%) |
| $55,000 to $64,999 | 214 (12.4%) | 193 (12.4%) |
| $65,000 to $74,999 | 38 (2.2%) | 24 (1.5%) |
| $75,000 to $99,999 | 155 (9.0%) | 121 (7.8%) |
| $100,000+ | 143 (8.3%) | 81 (5.2%) |
| Total | 1,730 (100.0%) | 1,553 (100.0%) |
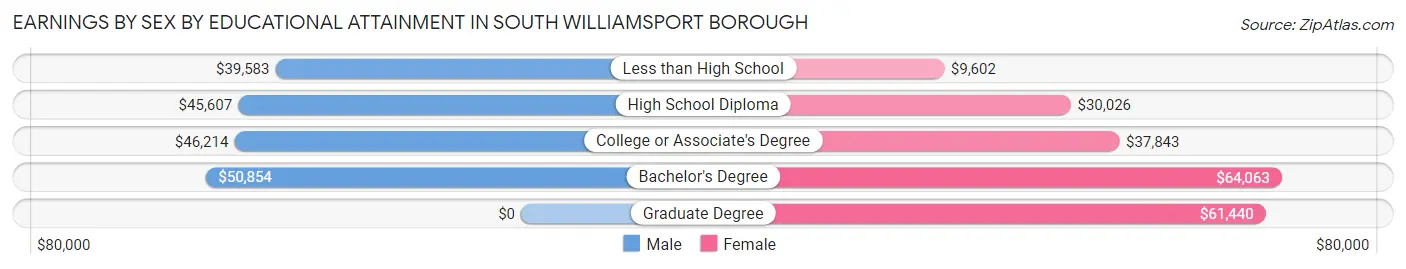
Earnings by Sex by Educational Attainment in South Williamsport borough
Average earnings in South Williamsport borough are $47,321 for men and $38,206 for women, a difference of 19.3%. Men with an educational attainment of bachelor's degree enjoy the highest average annual earnings of $50,854, while those with less than high school education earn the least with $39,583. Women with an educational attainment of bachelor's degree earn the most with the average annual earnings of $64,063, while those with less than high school education have the smallest earnings of $9,602.
| Educational Attainment | Male Income | Female Income |
| Less than High School | $39,583 | $9,602 |
| High School Diploma | $45,607 | $30,026 |
| College or Associate's Degree | $46,214 | $37,843 |
| Bachelor's Degree | $50,854 | $64,063 |
| Graduate Degree | - | - |
| Total | $47,321 | $38,206 |
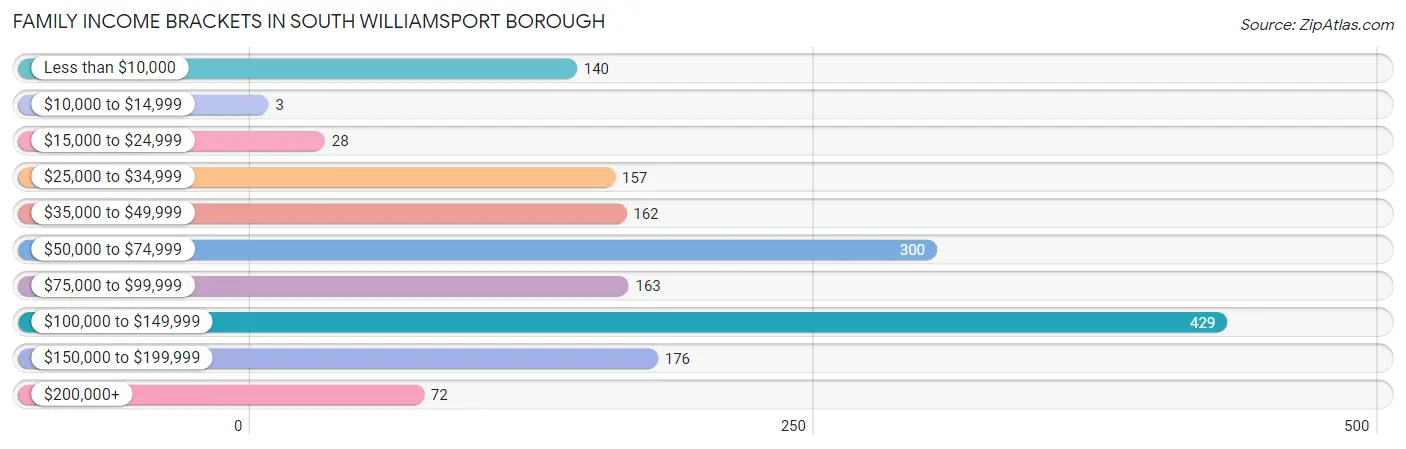
Family Income in South Williamsport borough
Family Income Brackets in South Williamsport borough
According to the South Williamsport borough family income data, there are 429 families falling into the $100,000 to $149,999 income range, which is the most common income bracket and makes up 26.3% of all families. Conversely, the $10,000 to $14,999 income bracket is the least frequent group with only 3 families (0.2%) belonging to this category.
| Income Bracket | # Families | % Families |
| Less than $10,000 | 140 | 8.6% |
| $10,000 to $14,999 | 3 | 0.2% |
| $15,000 to $24,999 | 28 | 1.7% |
| $25,000 to $34,999 | 157 | 9.6% |
| $35,000 to $49,999 | 162 | 9.9% |
| $50,000 to $74,999 | 300 | 18.4% |
| $75,000 to $99,999 | 163 | 10.0% |
| $100,000 to $149,999 | 429 | 26.3% |
| $150,000 to $199,999 | 176 | 10.8% |
| $200,000+ | 72 | 4.4% |
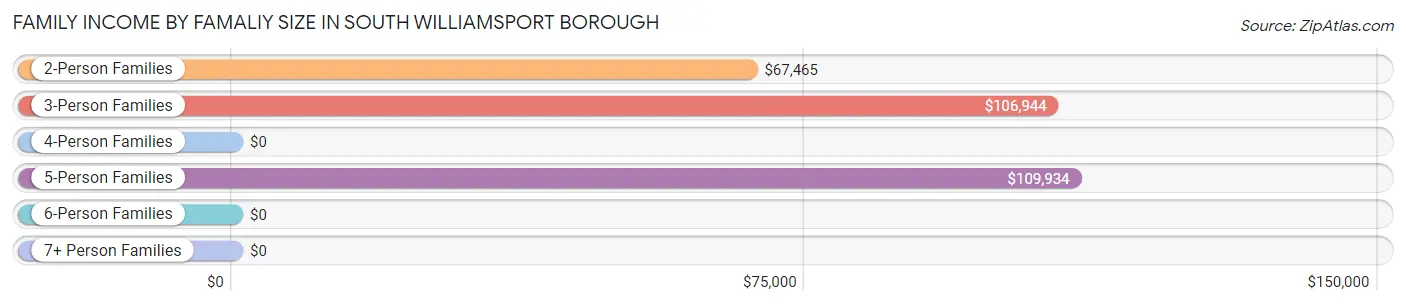
Family Income by Famaliy Size in South Williamsport borough
5-person families (133 | 8.1%) account for the highest median family income in South Williamsport borough with $109,934 per family, while 3-person families (228 | 14.0%) have the highest median income of $35,648 per family member.
| Income Bracket | # Families | Median Income |
| 2-Person Families | 981 (60.1%) | $67,465 |
| 3-Person Families | 228 (14.0%) | $106,944 |
| 4-Person Families | 224 (13.7%) | $0 |
| 5-Person Families | 133 (8.1%) | $109,934 |
| 6-Person Families | 48 (2.9%) | $0 |
| 7+ Person Families | 19 (1.2%) | $0 |
| Total | 1,633 (100.0%) | $77,813 |
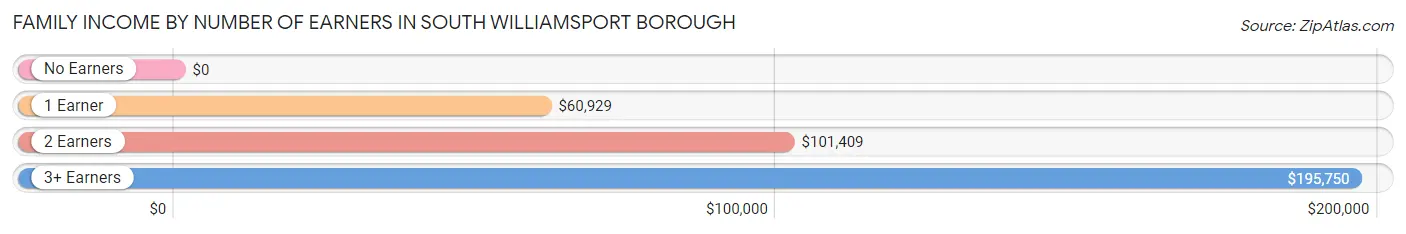
Family Income by Number of Earners in South Williamsport borough
| Number of Earners | # Families | Median Income |
| No Earners | 328 (20.1%) | $0 |
| 1 Earner | 518 (31.7%) | $60,929 |
| 2 Earners | 627 (38.4%) | $101,409 |
| 3+ Earners | 160 (9.8%) | $195,750 |
| Total | 1,633 (100.0%) | $77,813 |
Household Income in South Williamsport borough
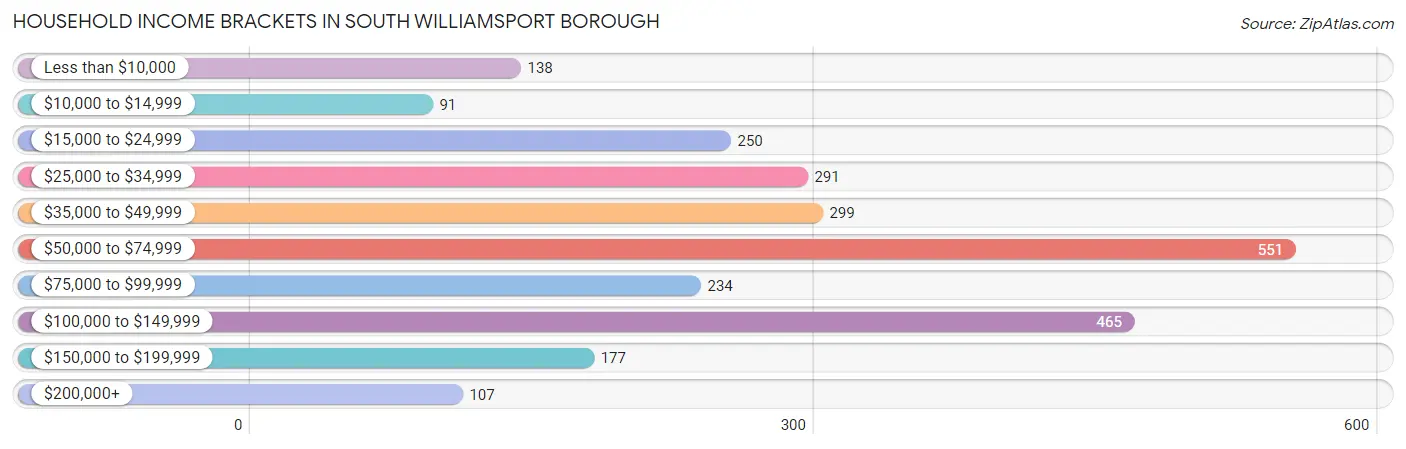
Household Income Brackets in South Williamsport borough
With 551 households falling in the category, the $50,000 to $74,999 income range is the most frequent in South Williamsport borough, accounting for 21.2% of all households. In contrast, only 91 households (3.5%) fall into the $10,000 to $14,999 income bracket, making it the least populous group.
| Income Bracket | # Households | % Households |
| Less than $10,000 | 138 | 5.3% |
| $10,000 to $14,999 | 91 | 3.5% |
| $15,000 to $24,999 | 250 | 9.6% |
| $25,000 to $34,999 | 291 | 11.2% |
| $35,000 to $49,999 | 299 | 11.5% |
| $50,000 to $74,999 | 551 | 21.2% |
| $75,000 to $99,999 | 234 | 9.0% |
| $100,000 to $149,999 | 465 | 17.9% |
| $150,000 to $199,999 | 177 | 6.8% |
| $200,000+ | 107 | 4.1% |
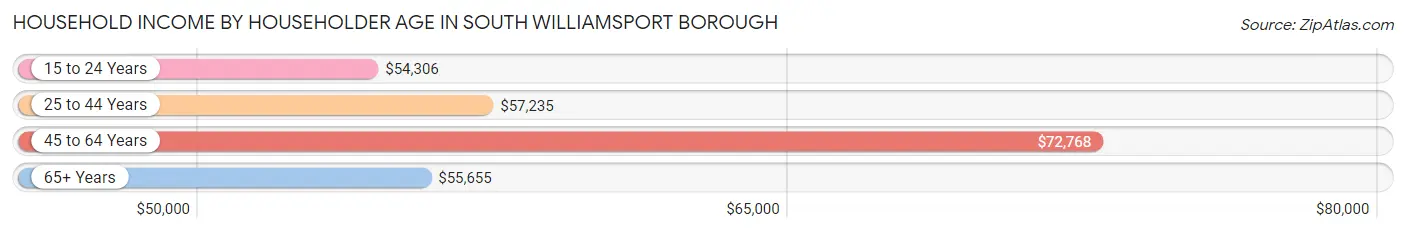
Household Income by Householder Age in South Williamsport borough
The median household income in South Williamsport borough is $60,020, with the highest median household income of $72,768 found in the 45 to 64 years age bracket for the primary householder. A total of 896 households (34.5%) fall into this category. Meanwhile, the 15 to 24 years age bracket for the primary householder has the lowest median household income of $54,306, with 84 households (3.2%) in this group.
| Income Bracket | # Households | Median Income |
| 15 to 24 Years | 84 (3.2%) | $54,306 |
| 25 to 44 Years | 889 (34.2%) | $57,235 |
| 45 to 64 Years | 896 (34.5%) | $72,768 |
| 65+ Years | 731 (28.1%) | $55,655 |
| Total | 2,600 (100.0%) | $60,020 |
Poverty in South Williamsport borough
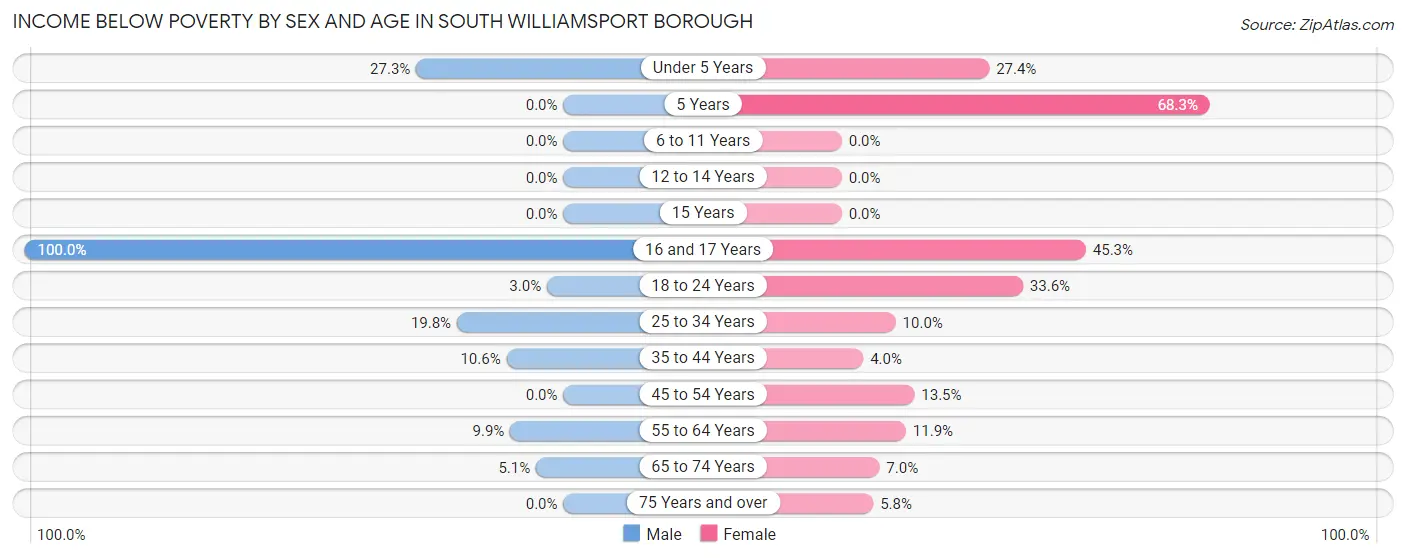
Income Below Poverty by Sex and Age in South Williamsport borough
With 10.9% poverty level for males and 13.0% for females among the residents of South Williamsport borough, 16 and 17 year old males and 5 year old females are the most vulnerable to poverty, with 93 males (100.0%) and 28 females (68.3%) in their respective age groups living below the poverty level.
| Age Bracket | Male | Female |
| Under 5 Years | 53 (27.3%) | 29 (27.4%) |
| 5 Years | 0 (0.0%) | 28 (68.3%) |
| 6 to 11 Years | 0 (0.0%) | 0 (0.0%) |
| 12 to 14 Years | 0 (0.0%) | 0 (0.0%) |
| 15 Years | 0 (0.0%) | 0 (0.0%) |
| 16 and 17 Years | 93 (100.0%) | 53 (45.3%) |
| 18 to 24 Years | 9 (3.0%) | 77 (33.6%) |
| 25 to 34 Years | 79 (19.8%) | 41 (10.0%) |
| 35 to 44 Years | 47 (10.6%) | 16 (4.0%) |
| 45 to 54 Years | 0 (0.0%) | 54 (13.5%) |
| 55 to 64 Years | 47 (9.9%) | 55 (11.9%) |
| 65 to 74 Years | 15 (5.1%) | 24 (7.0%) |
| 75 Years and over | 0 (0.0%) | 17 (5.8%) |
| Total | 343 (10.9%) | 394 (13.0%) |
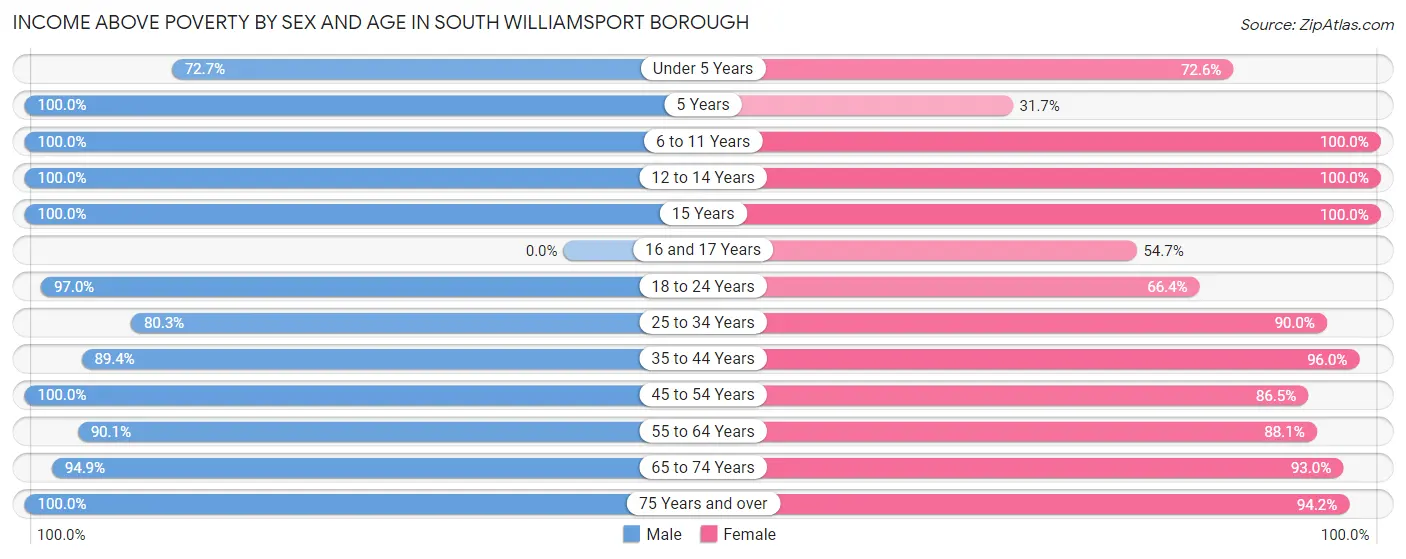
Income Above Poverty by Sex and Age in South Williamsport borough
According to the poverty statistics in South Williamsport borough, males aged 5 years and females aged 6 to 11 years are the age groups that are most secure financially, with 100.0% of males and 100.0% of females in these age groups living above the poverty line.
| Age Bracket | Male | Female |
| Under 5 Years | 141 (72.7%) | 77 (72.6%) |
| 5 Years | 42 (100.0%) | 13 (31.7%) |
| 6 to 11 Years | 127 (100.0%) | 140 (100.0%) |
| 12 to 14 Years | 120 (100.0%) | 86 (100.0%) |
| 15 Years | 105 (100.0%) | 3 (100.0%) |
| 16 and 17 Years | 0 (0.0%) | 64 (54.7%) |
| 18 to 24 Years | 287 (97.0%) | 152 (66.4%) |
| 25 to 34 Years | 321 (80.2%) | 369 (90.0%) |
| 35 to 44 Years | 398 (89.4%) | 387 (96.0%) |
| 45 to 54 Years | 256 (100.0%) | 347 (86.5%) |
| 55 to 64 Years | 429 (90.1%) | 407 (88.1%) |
| 65 to 74 Years | 281 (94.9%) | 320 (93.0%) |
| 75 Years and over | 297 (100.0%) | 274 (94.2%) |
| Total | 2,804 (89.1%) | 2,639 (87.0%) |
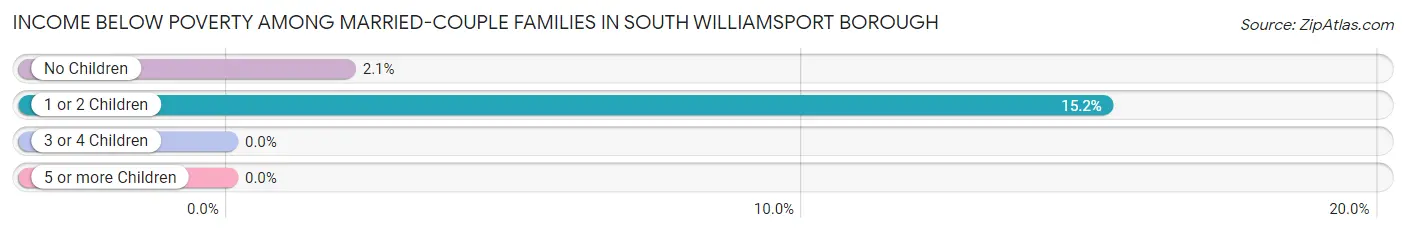
Income Below Poverty Among Married-Couple Families in South Williamsport borough
The poverty statistics for married-couple families in South Williamsport borough show that 3.6% or 44 of the total 1,231 families live below the poverty line. Families with 1 or 2 children have the highest poverty rate of 15.2%, comprising of 25 families. On the other hand, families with 3 or 4 children have the lowest poverty rate of 0.0%, which includes 0 families.
| Children | Above Poverty | Below Poverty |
| No Children | 907 (98.0%) | 19 (2.1%) |
| 1 or 2 Children | 139 (84.8%) | 25 (15.2%) |
| 3 or 4 Children | 141 (100.0%) | 0 (0.0%) |
| 5 or more Children | 0 (0.0%) | 0 (0.0%) |
| Total | 1,187 (96.4%) | 44 (3.6%) |
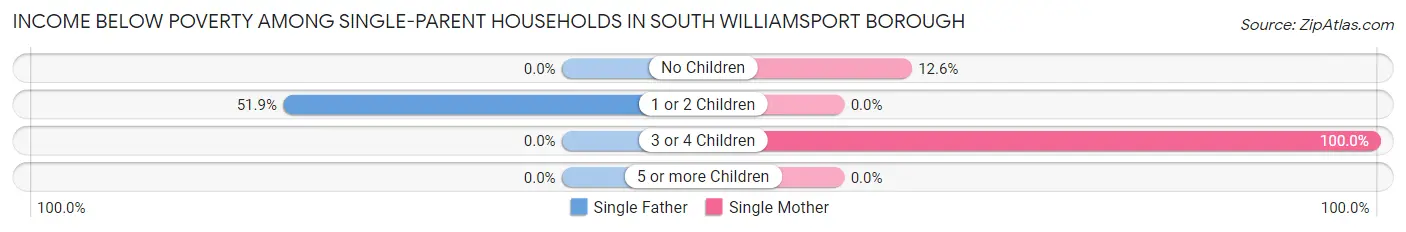
Income Below Poverty Among Single-Parent Households in South Williamsport borough
According to the poverty data in South Williamsport borough, 43.5% or 54 single-father households and 26.6% or 74 single-mother households are living below the poverty line. Among single-father households, those with 1 or 2 children have the highest poverty rate, with 54 households (51.9%) experiencing poverty. Likewise, among single-mother households, those with 3 or 4 children have the highest poverty rate, with 54 households (100.0%) falling below the poverty line.
| Children | Single Father | Single Mother |
| No Children | 0 (0.0%) | 20 (12.6%) |
| 1 or 2 Children | 54 (51.9%) | 0 (0.0%) |
| 3 or 4 Children | 0 (0.0%) | 54 (100.0%) |
| 5 or more Children | 0 (0.0%) | 0 (0.0%) |
| Total | 54 (43.5%) | 74 (26.6%) |
Income Below Poverty Among Married-Couple vs Single-Parent Households in South Williamsport borough
The poverty data for South Williamsport borough shows that 44 of the married-couple family households (3.6%) and 128 of the single-parent households (31.8%) are living below the poverty level. Within the married-couple family households, those with 1 or 2 children have the highest poverty rate, with 25 households (15.2%) falling below the poverty line. Among the single-parent households, those with 3 or 4 children have the highest poverty rate, with 54 household (100.0%) living below poverty.
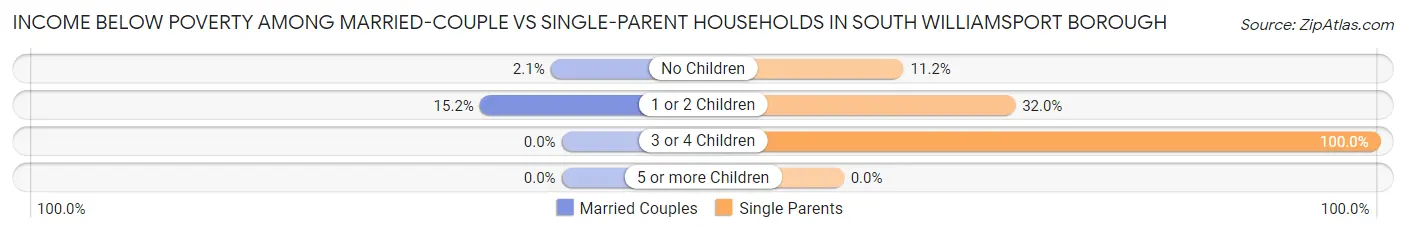
| Children | Married-Couple Families | Single-Parent Households |
| No Children | 19 (2.1%) | 20 (11.2%) |
| 1 or 2 Children | 25 (15.2%) | 54 (32.0%) |
| 3 or 4 Children | 0 (0.0%) | 54 (100.0%) |
| 5 or more Children | 0 (0.0%) | 0 (0.0%) |
| Total | 44 (3.6%) | 128 (31.8%) |
Race in South Williamsport borough
The most populous races in South Williamsport borough are White / Caucasian (5,555 | 88.9%), Asian (254 | 4.1%), and Black / African American (222 | 3.5%).
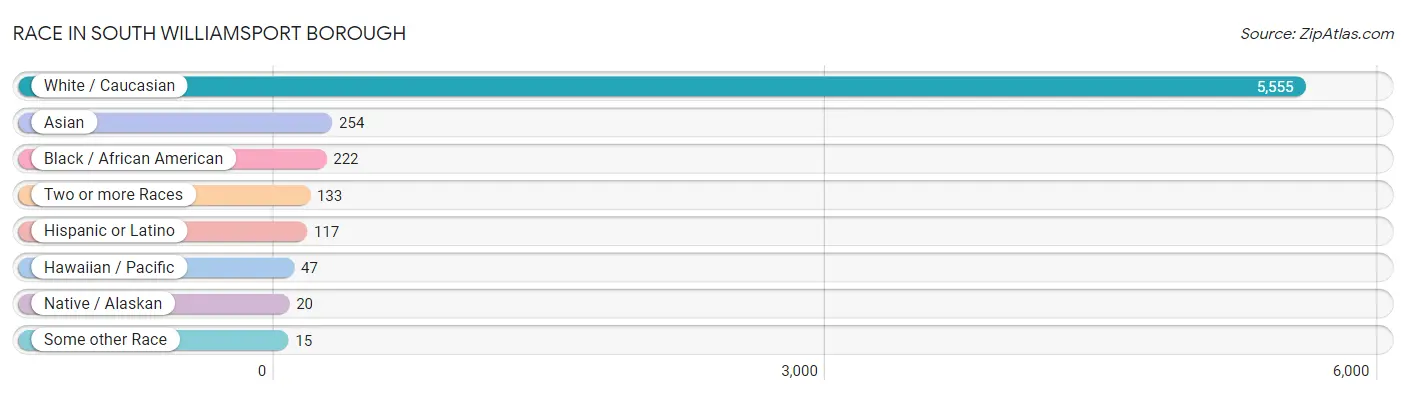
| Race | # Population | % Population |
| Asian | 254 | 4.1% |
| Black / African American | 222 | 3.5% |
| Hawaiian / Pacific | 47 | 0.7% |
| Hispanic or Latino | 117 | 1.9% |
| Native / Alaskan | 20 | 0.3% |
| White / Caucasian | 5,555 | 88.9% |
| Two or more Races | 133 | 2.1% |
| Some other Race | 15 | 0.2% |
| Total | 6,246 | 100.0% |
Ancestry in South Williamsport borough
The most populous ancestries reported in South Williamsport borough are German (1,607 | 25.7%), Irish (863 | 13.8%), Italian (549 | 8.8%), English (441 | 7.1%), and American (393 | 6.3%), together accounting for 61.7% of all South Williamsport borough residents.
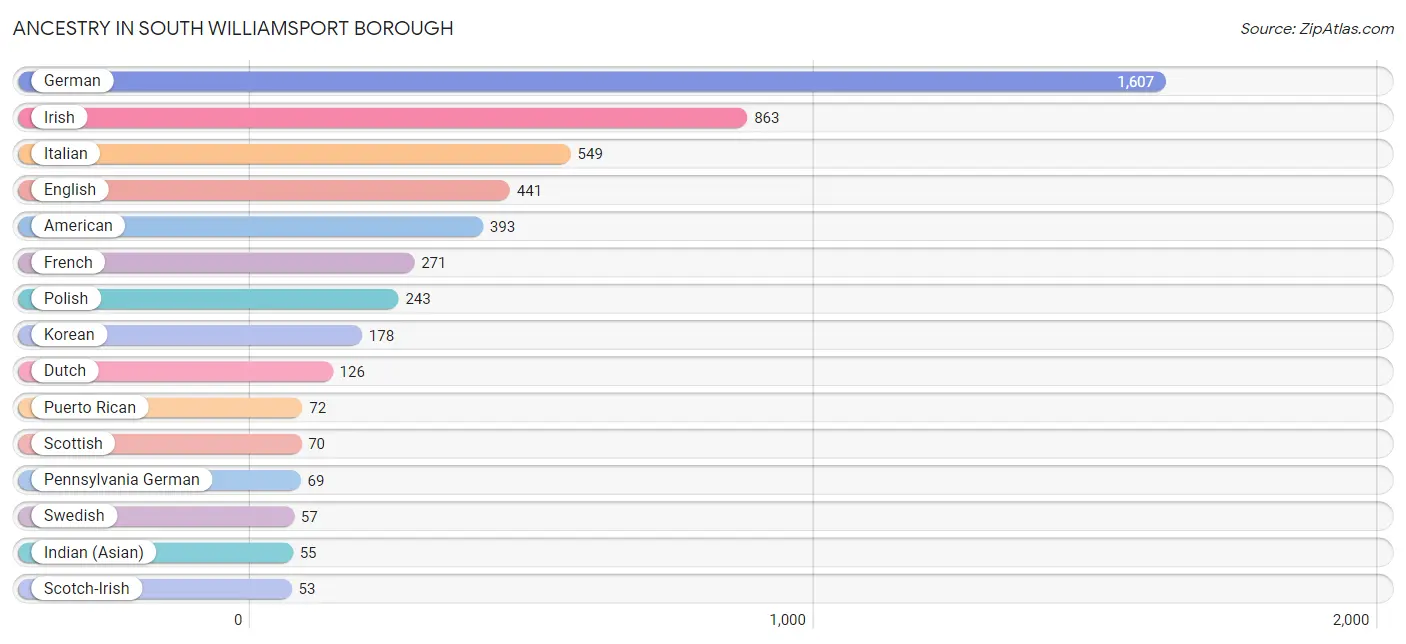
| Ancestry | # Population | % Population |
| American | 393 | 6.3% |
| Austrian | 28 | 0.4% |
| Bhutanese | 13 | 0.2% |
| British | 17 | 0.3% |
| Burmese | 23 | 0.4% |
| Canadian | 17 | 0.3% |
| Central American | 15 | 0.2% |
| Central American Indian | 20 | 0.3% |
| Cherokee | 17 | 0.3% |
| Dutch | 126 | 2.0% |
| English | 441 | 7.1% |
| French | 271 | 4.3% |
| French Canadian | 16 | 0.3% |
| German | 1,607 | 25.7% |
| Greek | 8 | 0.1% |
| Guatemalan | 15 | 0.2% |
| Hungarian | 22 | 0.4% |
| Indian (Asian) | 55 | 0.9% |
| Irish | 863 | 13.8% |
| Iroquois | 5 | 0.1% |
| Italian | 549 | 8.8% |
| Korean | 178 | 2.9% |
| Lithuanian | 27 | 0.4% |
| Mexican | 30 | 0.5% |
| Pennsylvania German | 69 | 1.1% |
| Polish | 243 | 3.9% |
| Puerto Rican | 72 | 1.1% |
| Russian | 19 | 0.3% |
| Samoan | 47 | 0.7% |
| Scotch-Irish | 53 | 0.9% |
| Scottish | 70 | 1.1% |
| Sri Lankan | 12 | 0.2% |
| Swedish | 57 | 0.9% |
| Swiss | 43 | 0.7% | View All 34 Rows |
Immigrants in South Williamsport borough
The most numerous immigrant groups reported in South Williamsport borough came from Asia (219 | 3.5%), South Eastern Asia (210 | 3.4%), Philippines (192 | 3.1%), Canada (93 | 1.5%), and Europe (44 | 0.7%), together accounting for 12.1% of all South Williamsport borough residents.
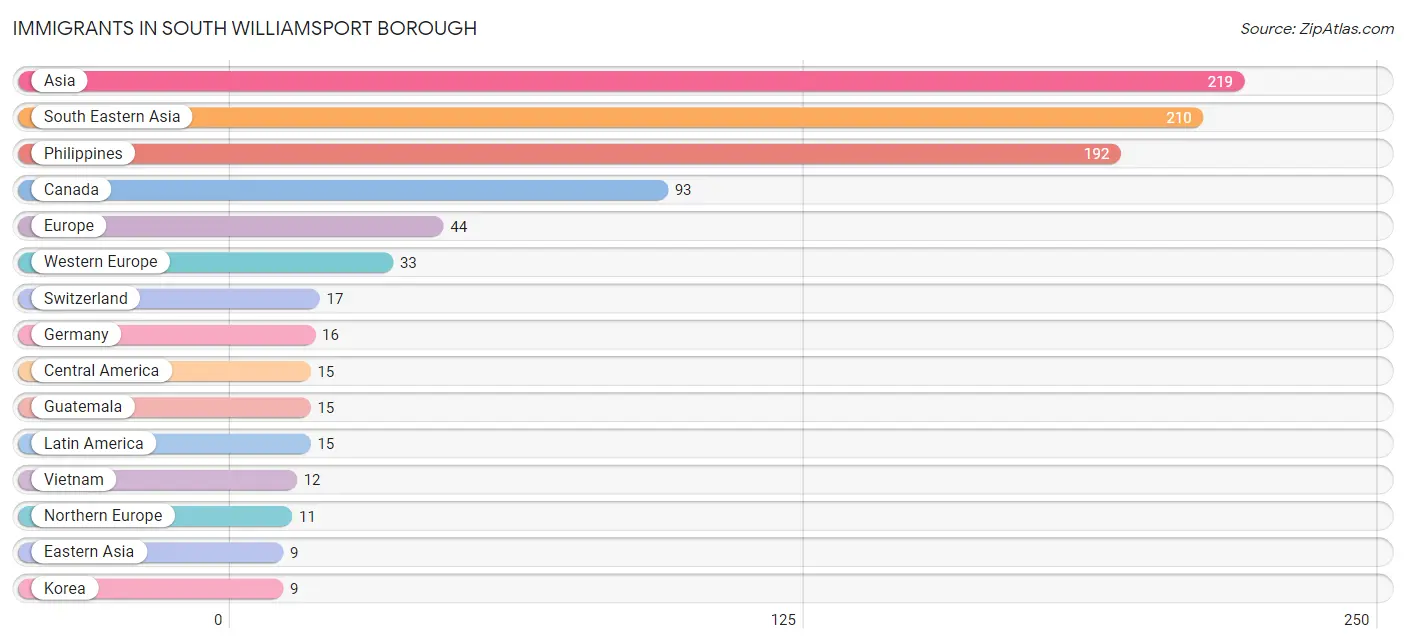
| Immigration Origin | # Population | % Population |
| Asia | 219 | 3.5% |
| Canada | 93 | 1.5% |
| Central America | 15 | 0.2% |
| Eastern Asia | 9 | 0.1% |
| Europe | 44 | 0.7% |
| Germany | 16 | 0.3% |
| Guatemala | 15 | 0.2% |
| Korea | 9 | 0.1% |
| Latin America | 15 | 0.2% |
| Northern Europe | 11 | 0.2% |
| Philippines | 192 | 3.1% |
| Singapore | 6 | 0.1% |
| South Eastern Asia | 210 | 3.4% |
| Switzerland | 17 | 0.3% |
| Vietnam | 12 | 0.2% |
| Western Europe | 33 | 0.5% | View All 16 Rows |
Sex and Age in South Williamsport borough
Sex and Age in South Williamsport borough
The most populous age groups in South Williamsport borough are 60 to 64 Years (356 | 11.3%) for men and 45 to 49 Years (238 | 7.7%) for women.
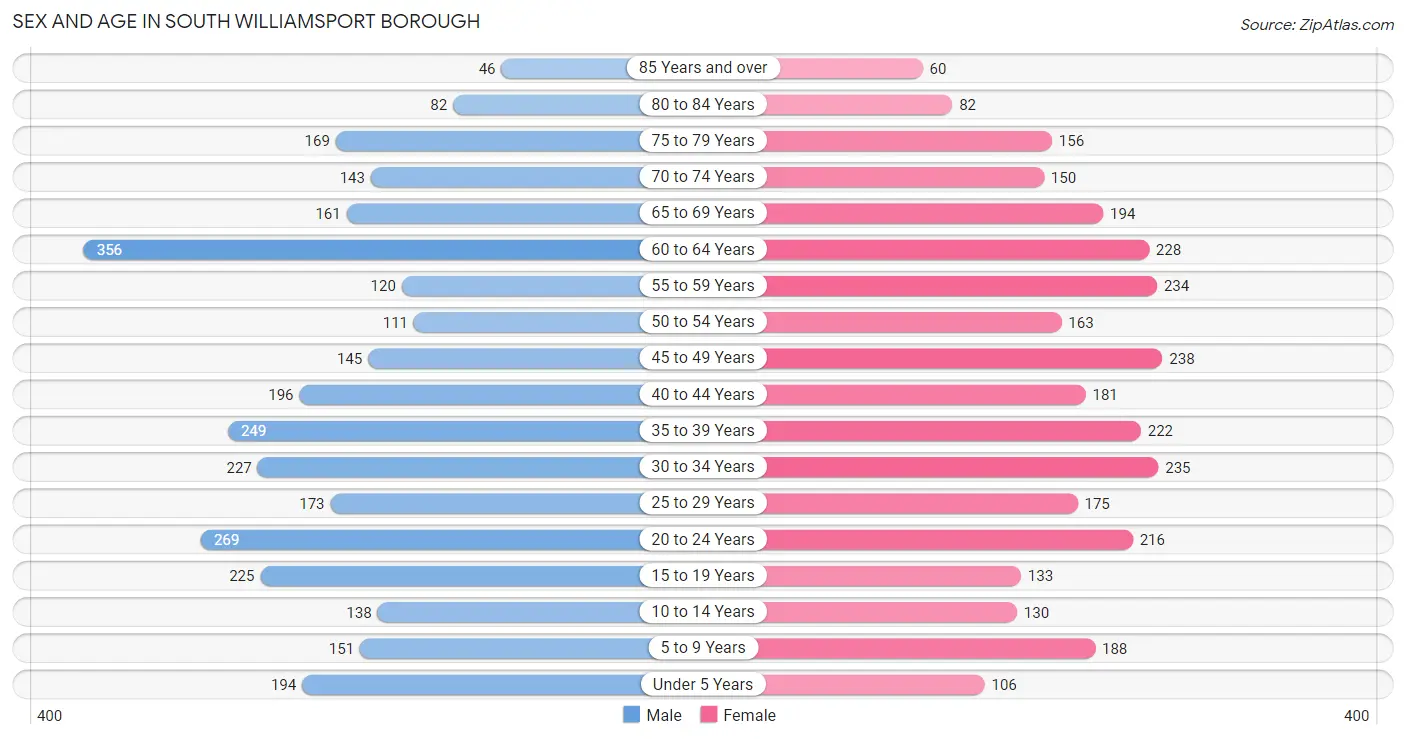
| Age Bracket | Male | Female |
| Under 5 Years | 194 (6.1%) | 106 (3.4%) |
| 5 to 9 Years | 151 (4.8%) | 188 (6.1%) |
| 10 to 14 Years | 138 (4.4%) | 130 (4.2%) |
| 15 to 19 Years | 225 (7.1%) | 133 (4.3%) |
| 20 to 24 Years | 269 (8.5%) | 216 (7.0%) |
| 25 to 29 Years | 173 (5.5%) | 175 (5.7%) |
| 30 to 34 Years | 227 (7.2%) | 235 (7.6%) |
| 35 to 39 Years | 249 (7.9%) | 222 (7.2%) |
| 40 to 44 Years | 196 (6.2%) | 181 (5.9%) |
| 45 to 49 Years | 145 (4.6%) | 238 (7.7%) |
| 50 to 54 Years | 111 (3.5%) | 163 (5.3%) |
| 55 to 59 Years | 120 (3.8%) | 234 (7.6%) |
| 60 to 64 Years | 356 (11.3%) | 228 (7.4%) |
| 65 to 69 Years | 161 (5.1%) | 194 (6.3%) |
| 70 to 74 Years | 143 (4.5%) | 150 (4.9%) |
| 75 to 79 Years | 169 (5.4%) | 156 (5.1%) |
| 80 to 84 Years | 82 (2.6%) | 82 (2.6%) |
| 85 Years and over | 46 (1.5%) | 60 (1.9%) |
| Total | 3,155 (100.0%) | 3,091 (100.0%) |
Families and Households in South Williamsport borough
Median Family Size in South Williamsport borough
The median family size in South Williamsport borough is 2.93 persons per family, with married-couple families (1,231 | 75.4%) accounting for the largest median family size of 3.02 persons per family. On the other hand, single male/father families (124 | 7.6%) represent the smallest median family size with 2.50 persons per family.
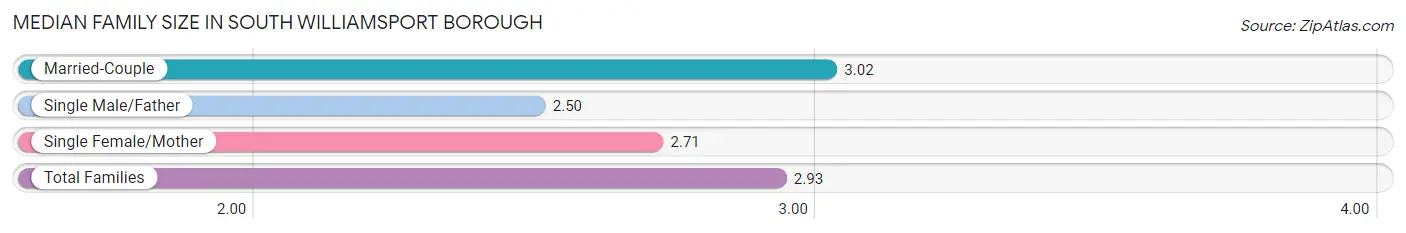
| Family Type | # Families | Family Size |
| Married-Couple | 1,231 (75.4%) | 3.02 |
| Single Male/Father | 124 (7.6%) | 2.50 |
| Single Female/Mother | 278 (17.0%) | 2.71 |
| Total Families | 1,633 (100.0%) | 2.93 |
Median Household Size in South Williamsport borough
The median household size in South Williamsport borough is 2.40 persons per household, with single male/father households (124 | 4.8%) accounting for the largest median household size of 4.37 persons per household. non-family households (967 | 37.2%) represent the smallest median household size with 1.16 persons per household.
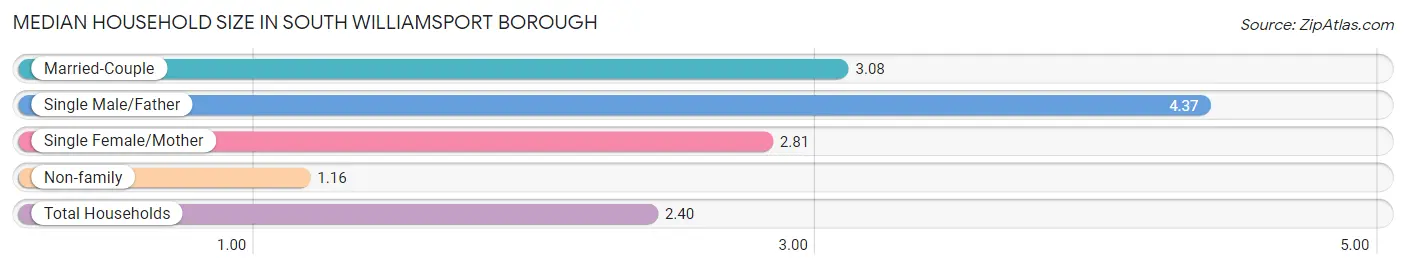
| Household Type | # Households | Household Size |
| Married-Couple | 1,231 (47.3%) | 3.08 |
| Single Male/Father | 124 (4.8%) | 4.37 |
| Single Female/Mother | 278 (10.7%) | 2.81 |
| Non-family | 967 (37.2%) | 1.16 |
| Total Households | 2,600 (100.0%) | 2.40 |
Household Size by Marriage Status in South Williamsport borough
Out of a total of 2,600 households in South Williamsport borough, 1,633 (62.8%) are family households, while 967 (37.2%) are nonfamily households. The most numerous type of family households are 2-person households, comprising 859, and the most common type of nonfamily households are 1-person households, comprising 838.
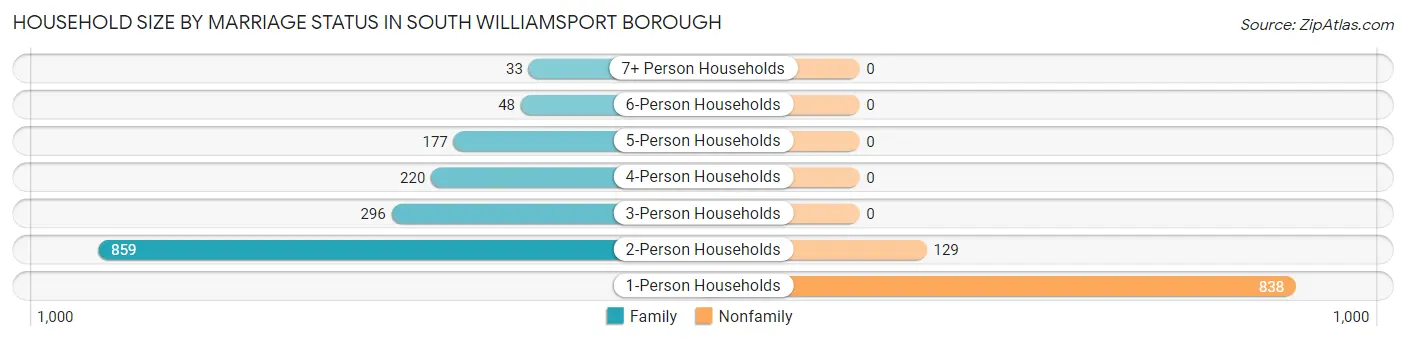
| Household Size | Family Households | Nonfamily Households |
| 1-Person Households | - | 838 (32.2%) |
| 2-Person Households | 859 (33.0%) | 129 (5.0%) |
| 3-Person Households | 296 (11.4%) | 0 (0.0%) |
| 4-Person Households | 220 (8.5%) | 0 (0.0%) |
| 5-Person Households | 177 (6.8%) | 0 (0.0%) |
| 6-Person Households | 48 (1.8%) | 0 (0.0%) |
| 7+ Person Households | 33 (1.3%) | 0 (0.0%) |
| Total | 1,633 (62.8%) | 967 (37.2%) |
Female Fertility in South Williamsport borough
Fertility by Age in South Williamsport borough
Average fertility rate in South Williamsport borough is 24.0 births per 1,000 women. Women in the age bracket of 35 to 50 years have the highest fertility rate with 52.0 births per 1,000 women. Women in the age bracket of 35 to 50 years acount for 100.0% of all women with births.
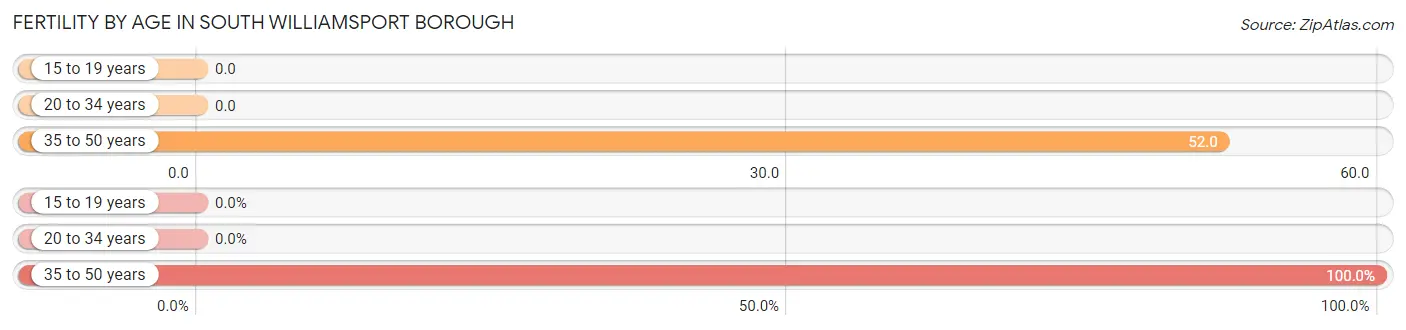
| Age Bracket | Women with Births | Births / 1,000 Women |
| 15 to 19 years | 0 (0.0%) | 0.0 |
| 20 to 34 years | 0 (0.0%) | 0.0 |
| 35 to 50 years | 35 (100.0%) | 52.0 |
| Total | 35 (100.0%) | 24.0 |
Fertility by Age by Marriage Status in South Williamsport borough
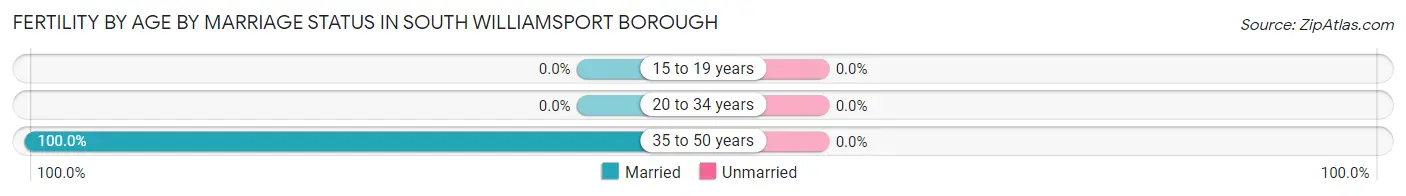
| Age Bracket | Married | Unmarried |
| 15 to 19 years | 0 (0.0%) | 0 (0.0%) |
| 20 to 34 years | 0 (0.0%) | 0 (0.0%) |
| 35 to 50 years | 35 (100.0%) | 0 (0.0%) |
| Total | 35 (100.0%) | 0 (0.0%) |
Fertility by Education in South Williamsport borough
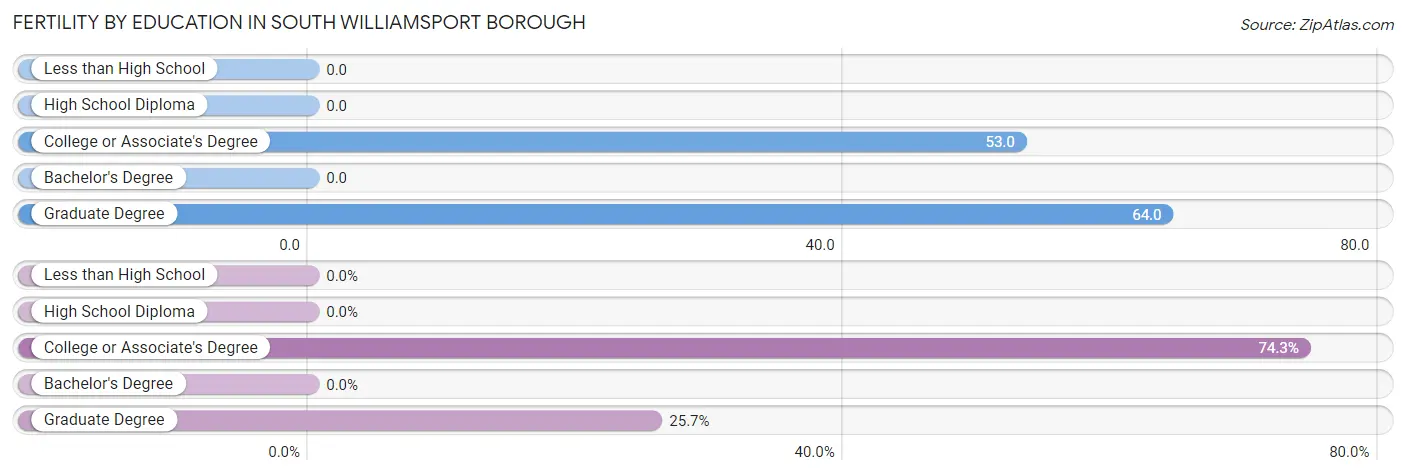
| Educational Attainment | Women with Births | Births / 1,000 Women |
| Less than High School | 0 (0.0%) | 0.0 |
| High School Diploma | 0 (0.0%) | 0.0 |
| College or Associate's Degree | 26 (74.3%) | 53.0 |
| Bachelor's Degree | 0 (0.0%) | 0.0 |
| Graduate Degree | 9 (25.7%) | 64.0 |
| Total | 35 (100.0%) | 24.0 |
Fertility by Education by Marriage Status in South Williamsport borough
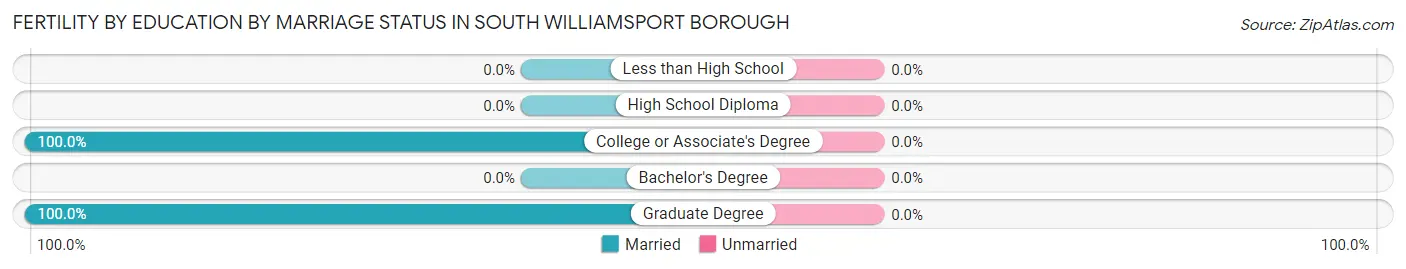
| Educational Attainment | Married | Unmarried |
| Less than High School | 0 (0.0%) | 0 (0.0%) |
| High School Diploma | 0 (0.0%) | 0 (0.0%) |
| College or Associate's Degree | 26 (100.0%) | 0 (0.0%) |
| Bachelor's Degree | 0 (0.0%) | 0 (0.0%) |
| Graduate Degree | 9 (100.0%) | 0 (0.0%) |
| Total | 35 (100.0%) | 0 (0.0%) |
Employment Characteristics in South Williamsport borough
Employment by Class of Employer in South Williamsport borough
Among the 2,931 employed individuals in South Williamsport borough, private company employees (1,932 | 65.9%), not-for-profit organizations (415 | 14.2%), and local government employees (293 | 10.0%) make up the most common classes of employment.
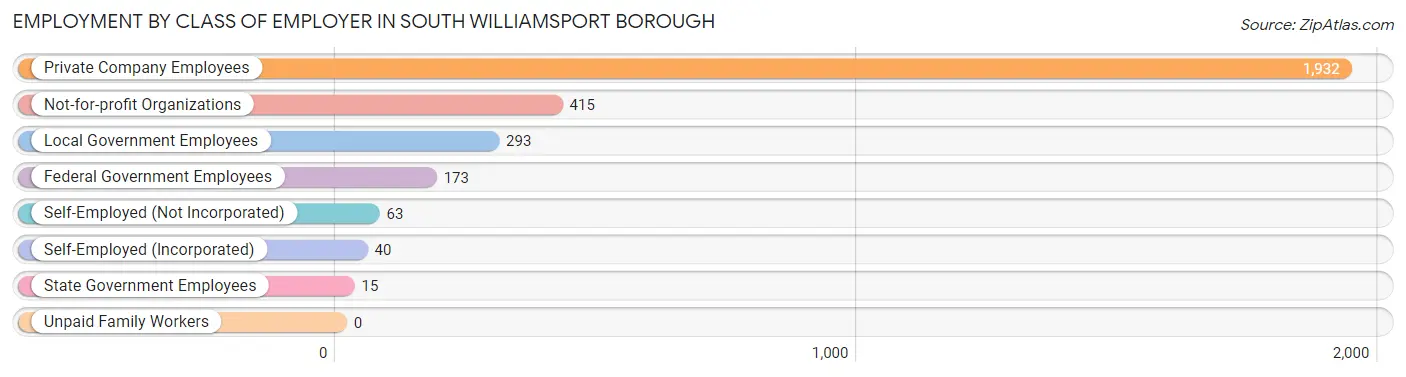
| Employer Class | # Employees | % Employees |
| Private Company Employees | 1,932 | 65.9% |
| Self-Employed (Incorporated) | 40 | 1.4% |
| Self-Employed (Not Incorporated) | 63 | 2.1% |
| Not-for-profit Organizations | 415 | 14.2% |
| Local Government Employees | 293 | 10.0% |
| State Government Employees | 15 | 0.5% |
| Federal Government Employees | 173 | 5.9% |
| Unpaid Family Workers | 0 | 0.0% |
| Total | 2,931 | 100.0% |
Employment Status by Age in South Williamsport borough
According to the labor force statistics for South Williamsport borough, out of the total population over 16 years of age (5,231), 61.1% or 3,196 individuals are in the labor force, with 6.4% or 205 of them unemployed. The age group with the highest labor force participation rate is 20 to 24 years, with 96.1% or 466 individuals in the labor force. Within the labor force, the 20 to 24 years age range has the highest percentage of unemployed individuals, with 27.9% or 130 of them being unemployed.
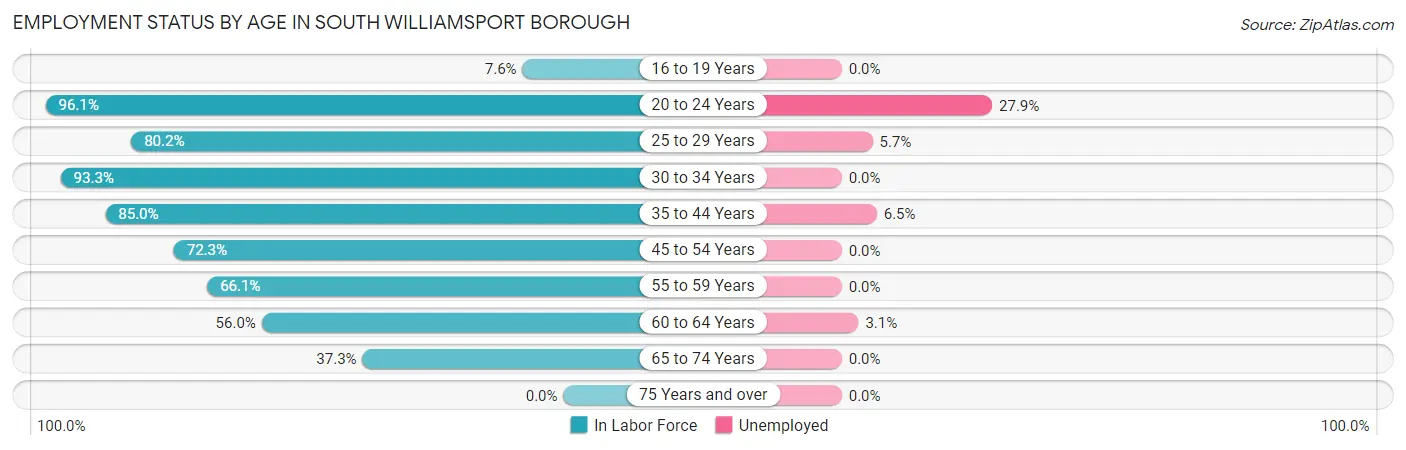
| Age Bracket | In Labor Force | Unemployed |
| 16 to 19 Years | 19 (7.6%) | 0 (0.0%) |
| 20 to 24 Years | 466 (96.1%) | 130 (27.9%) |
| 25 to 29 Years | 279 (80.2%) | 16 (5.7%) |
| 30 to 34 Years | 431 (93.3%) | 0 (0.0%) |
| 35 to 44 Years | 721 (85.0%) | 47 (6.5%) |
| 45 to 54 Years | 475 (72.3%) | 0 (0.0%) |
| 55 to 59 Years | 234 (66.1%) | 0 (0.0%) |
| 60 to 64 Years | 327 (56.0%) | 10 (3.1%) |
| 65 to 74 Years | 242 (37.3%) | 0 (0.0%) |
| 75 Years and over | 0 (0.0%) | 0 (0.0%) |
| Total | 3,196 (61.1%) | 205 (6.4%) |
Employment Status by Educational Attainment in South Williamsport borough
According to labor force statistics for South Williamsport borough, 75.8% of individuals (2,466) out of the total population between 25 and 64 years of age (3,253) are in the labor force, with 3.0% or 74 of them being unemployed. The group with the highest labor force participation rate are those with the educational attainment of high school diploma, with 82.1% or 878 individuals in the labor force. Within the labor force, individuals with high school diploma education have the highest percentage of unemployment, with 6.5% or 57 of them being unemployed.
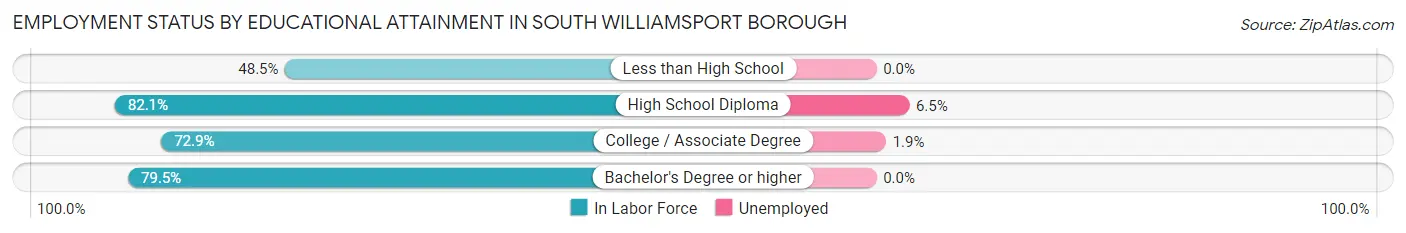
| Educational Attainment | In Labor Force | Unemployed |
| Less than High School | 110 (48.5%) | 0 (0.0%) |
| High School Diploma | 878 (82.1%) | 70 (6.5%) |
| College / Associate Degree | 840 (72.9%) | 22 (1.9%) |
| Bachelor's Degree or higher | 639 (79.5%) | 0 (0.0%) |
| Total | 2,466 (75.8%) | 98 (3.0%) |
Employment Occupations by Sex in South Williamsport borough
Management, Business, Science and Arts Occupations
The most common Management, Business, Science and Arts occupations in South Williamsport borough are Health Diagnosing & Treating (314 | 10.5%), Community & Social Service (254 | 8.5%), Health Technologists (200 | 6.7%), Management (152 | 5.1%), and Computers, Engineering & Science (113 | 3.8%).
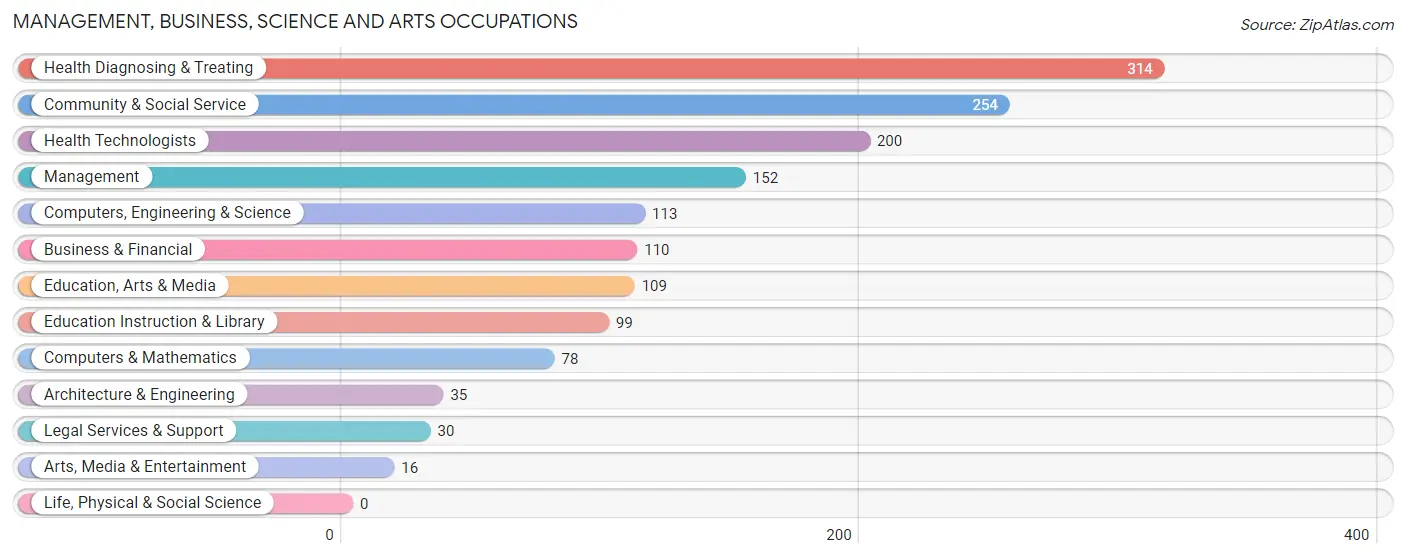
Management, Business, Science and Arts Occupations by Sex
Within the Management, Business, Science and Arts occupations in South Williamsport borough, the most male-oriented occupations are Architecture & Engineering (100.0%), Business & Financial (64.5%), and Computers, Engineering & Science (58.4%), while the most female-oriented occupations are Education Instruction & Library (100.0%), Arts, Media & Entertainment (100.0%), and Health Technologists (77.5%).
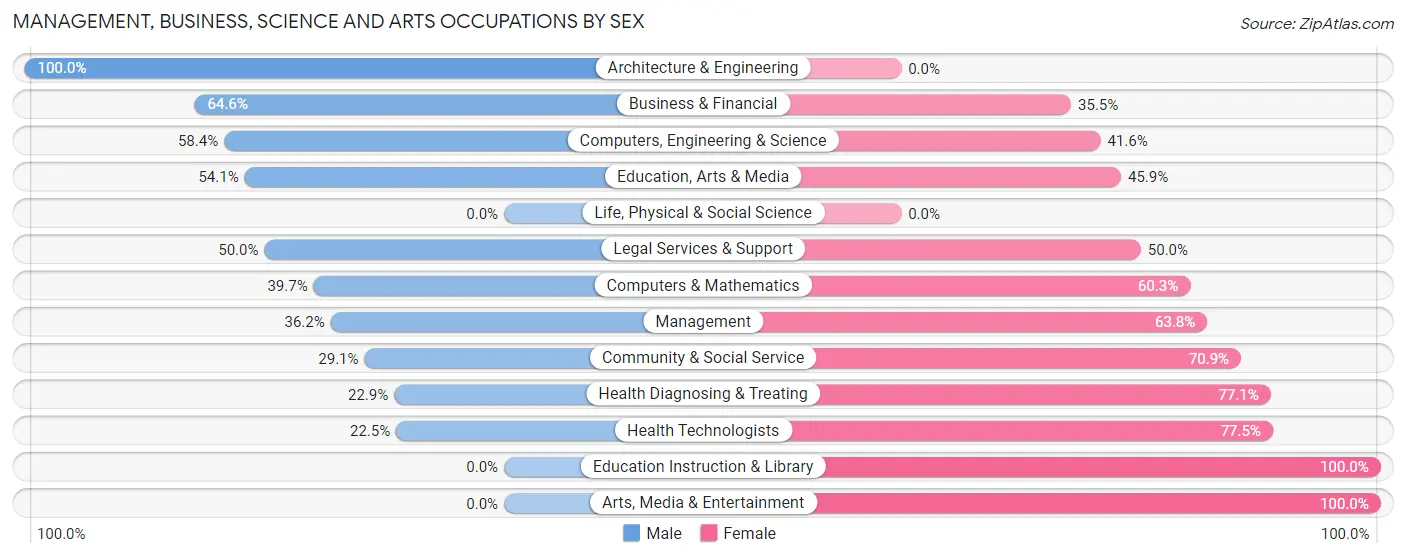
| Occupation | Male | Female |
| Management | 55 (36.2%) | 97 (63.8%) |
| Business & Financial | 71 (64.5%) | 39 (35.4%) |
| Computers, Engineering & Science | 66 (58.4%) | 47 (41.6%) |
| Computers & Mathematics | 31 (39.7%) | 47 (60.3%) |
| Architecture & Engineering | 35 (100.0%) | 0 (0.0%) |
| Life, Physical & Social Science | 0 (0.0%) | 0 (0.0%) |
| Community & Social Service | 74 (29.1%) | 180 (70.9%) |
| Education, Arts & Media | 59 (54.1%) | 50 (45.9%) |
| Legal Services & Support | 15 (50.0%) | 15 (50.0%) |
| Education Instruction & Library | 0 (0.0%) | 99 (100.0%) |
| Arts, Media & Entertainment | 0 (0.0%) | 16 (100.0%) |
| Health Diagnosing & Treating | 72 (22.9%) | 242 (77.1%) |
| Health Technologists | 45 (22.5%) | 155 (77.5%) |
| Total (Category) | 338 (35.8%) | 605 (64.2%) |
| Total (Overall) | 1,557 (52.1%) | 1,434 (47.9%) |
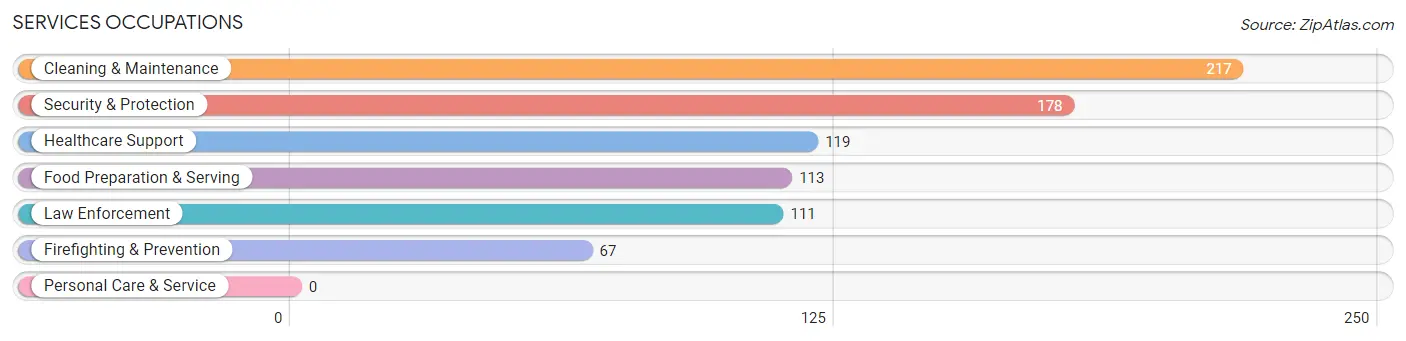
Services Occupations
The most common Services occupations in South Williamsport borough are Cleaning & Maintenance (217 | 7.3%), Security & Protection (178 | 5.9%), Healthcare Support (119 | 4.0%), Food Preparation & Serving (113 | 3.8%), and Law Enforcement (111 | 3.7%).
Services Occupations by Sex
Within the Services occupations in South Williamsport borough, the most male-oriented occupations are Law Enforcement (100.0%), Security & Protection (91.6%), and Firefighting & Prevention (77.6%), while the most female-oriented occupations are Food Preparation & Serving (65.5%), Healthcare Support (45.4%), and Cleaning & Maintenance (24.4%).
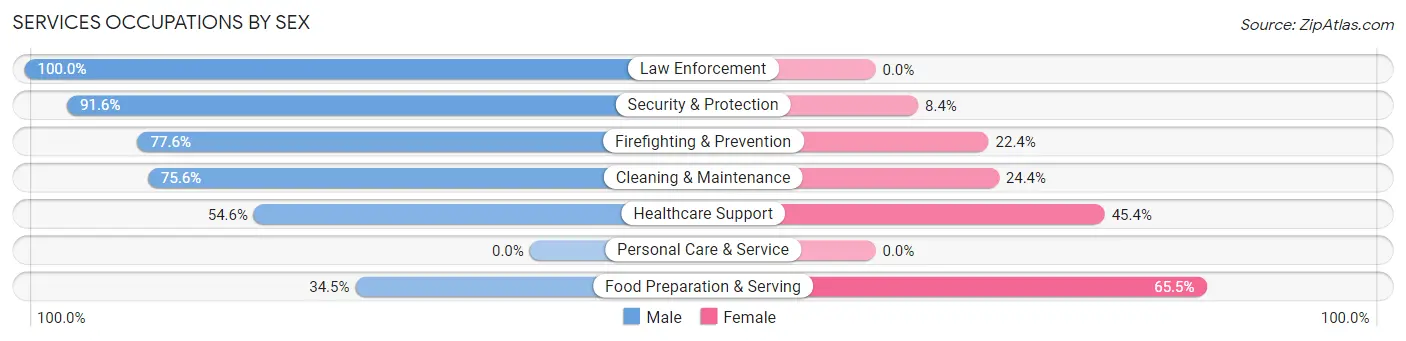
| Occupation | Male | Female |
| Healthcare Support | 65 (54.6%) | 54 (45.4%) |
| Security & Protection | 163 (91.6%) | 15 (8.4%) |
| Firefighting & Prevention | 52 (77.6%) | 15 (22.4%) |
| Law Enforcement | 111 (100.0%) | 0 (0.0%) |
| Food Preparation & Serving | 39 (34.5%) | 74 (65.5%) |
| Cleaning & Maintenance | 164 (75.6%) | 53 (24.4%) |
| Personal Care & Service | 0 (0.0%) | 0 (0.0%) |
| Total (Category) | 431 (68.7%) | 196 (31.3%) |
| Total (Overall) | 1,557 (52.1%) | 1,434 (47.9%) |
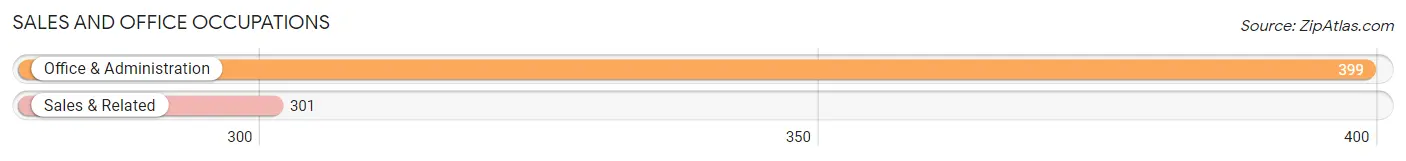
Sales and Office Occupations
The most common Sales and Office occupations in South Williamsport borough are Office & Administration (399 | 13.3%), and Sales & Related (301 | 10.1%).
Sales and Office Occupations by Sex
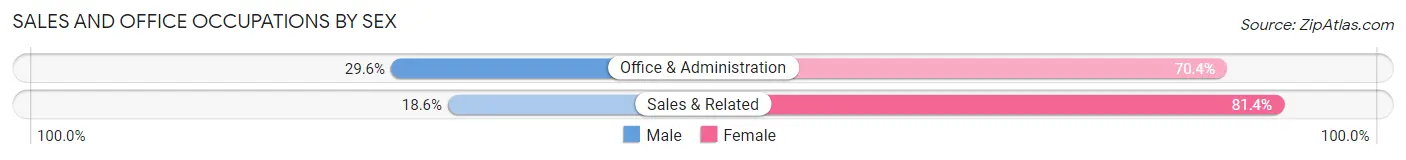
| Occupation | Male | Female |
| Sales & Related | 56 (18.6%) | 245 (81.4%) |
| Office & Administration | 118 (29.6%) | 281 (70.4%) |
| Total (Category) | 174 (24.9%) | 526 (75.1%) |
| Total (Overall) | 1,557 (52.1%) | 1,434 (47.9%) |
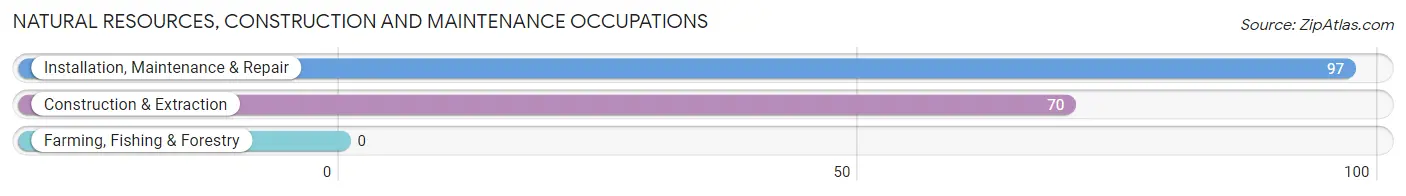
Natural Resources, Construction and Maintenance Occupations
The most common Natural Resources, Construction and Maintenance occupations in South Williamsport borough are Installation, Maintenance & Repair (97 | 3.2%), and Construction & Extraction (70 | 2.3%).
Natural Resources, Construction and Maintenance Occupations by Sex
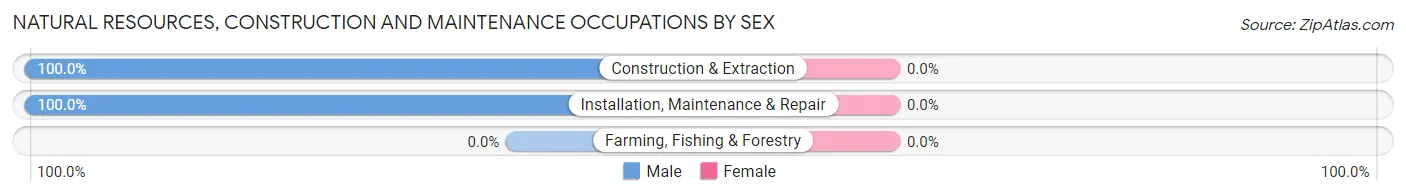
| Occupation | Male | Female |
| Farming, Fishing & Forestry | 0 (0.0%) | 0 (0.0%) |
| Construction & Extraction | 70 (100.0%) | 0 (0.0%) |
| Installation, Maintenance & Repair | 97 (100.0%) | 0 (0.0%) |
| Total (Category) | 167 (100.0%) | 0 (0.0%) |
| Total (Overall) | 1,557 (52.1%) | 1,434 (47.9%) |
Production, Transportation and Moving Occupations
The most common Production, Transportation and Moving occupations in South Williamsport borough are Production (328 | 11.0%), Material Moving (179 | 6.0%), and Transportation (47 | 1.6%).
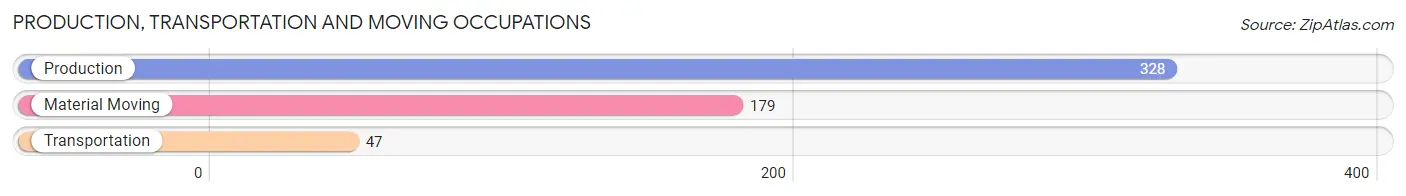
Production, Transportation and Moving Occupations by Sex
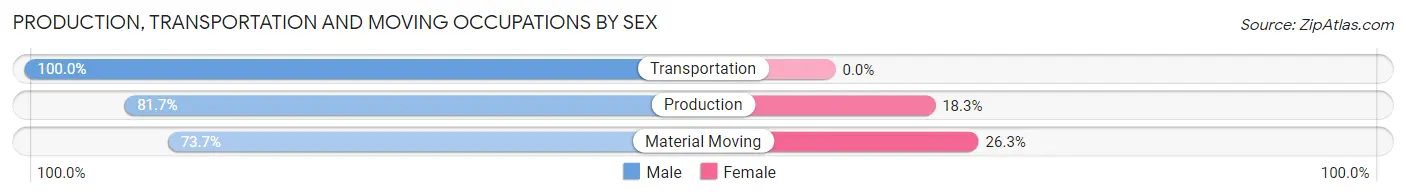
| Occupation | Male | Female |
| Production | 268 (81.7%) | 60 (18.3%) |
| Transportation | 47 (100.0%) | 0 (0.0%) |
| Material Moving | 132 (73.7%) | 47 (26.3%) |
| Total (Category) | 447 (80.7%) | 107 (19.3%) |
| Total (Overall) | 1,557 (52.1%) | 1,434 (47.9%) |
Employment Industries by Sex in South Williamsport borough
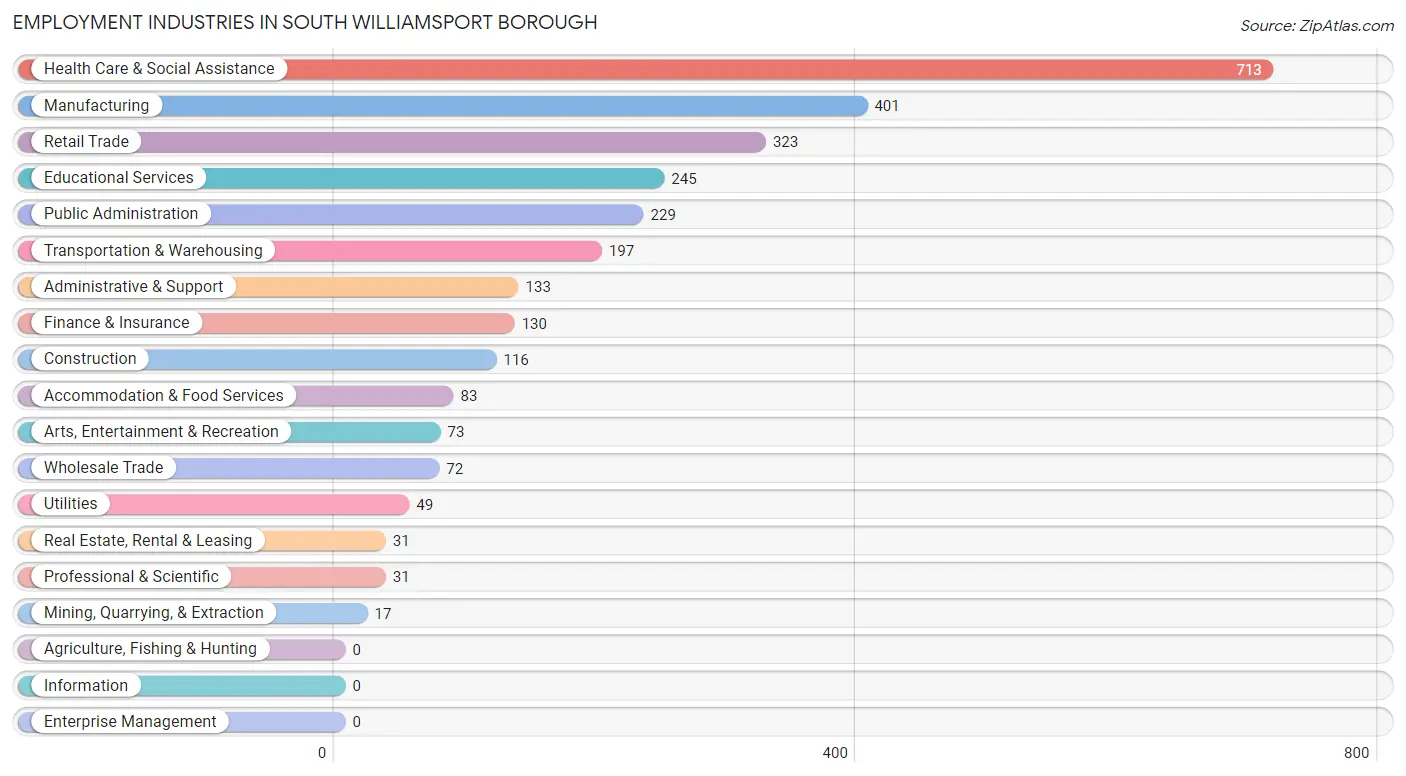
Employment Industries in South Williamsport borough
The major employment industries in South Williamsport borough include Health Care & Social Assistance (713 | 23.8%), Manufacturing (401 | 13.4%), Retail Trade (323 | 10.8%), Educational Services (245 | 8.2%), and Public Administration (229 | 7.7%).
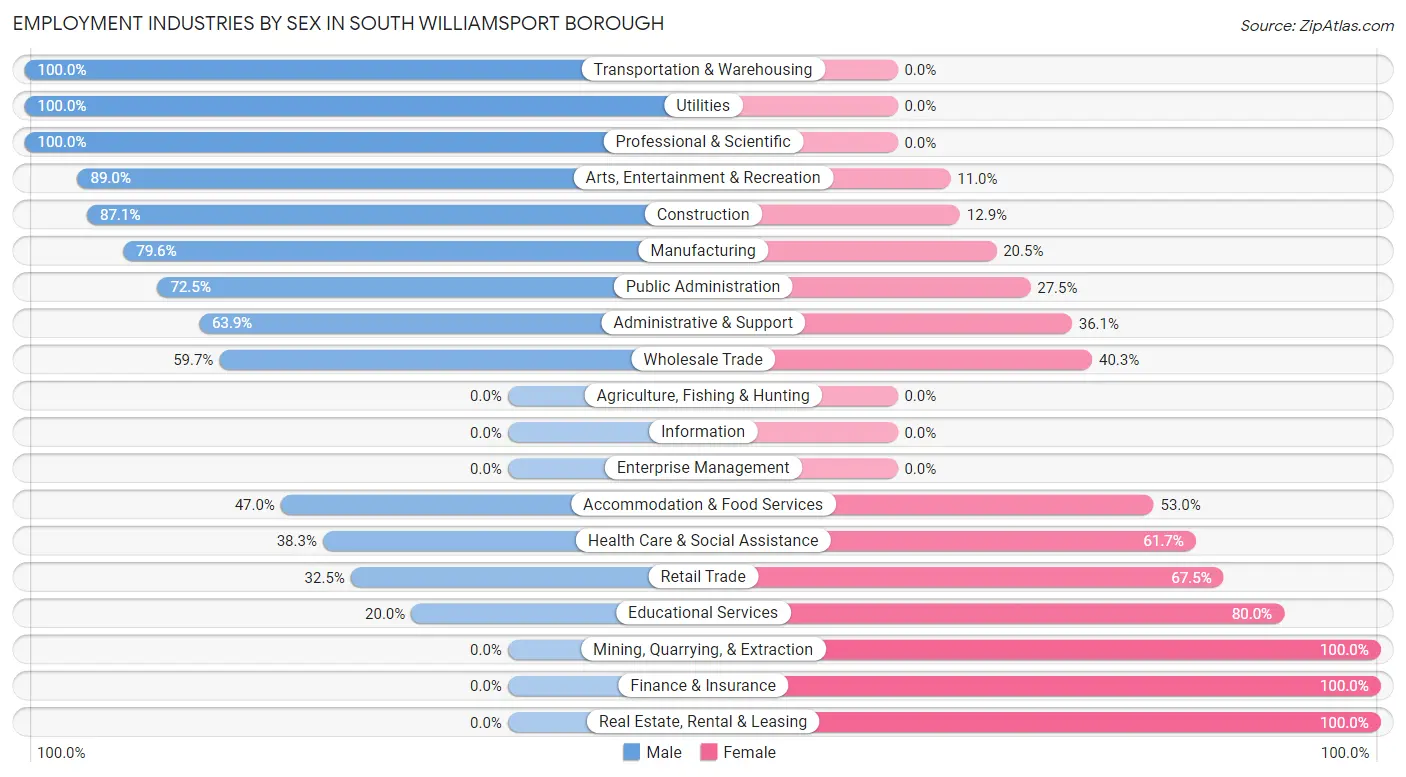
Employment Industries by Sex in South Williamsport borough
The South Williamsport borough industries that see more men than women are Transportation & Warehousing (100.0%), Utilities (100.0%), and Professional & Scientific (100.0%), whereas the industries that tend to have a higher number of women are Mining, Quarrying, & Extraction (100.0%), Finance & Insurance (100.0%), and Real Estate, Rental & Leasing (100.0%).
| Industry | Male | Female |
| Agriculture, Fishing & Hunting | 0 (0.0%) | 0 (0.0%) |
| Mining, Quarrying, & Extraction | 0 (0.0%) | 17 (100.0%) |
| Construction | 101 (87.1%) | 15 (12.9%) |
| Manufacturing | 319 (79.5%) | 82 (20.4%) |
| Wholesale Trade | 43 (59.7%) | 29 (40.3%) |
| Retail Trade | 105 (32.5%) | 218 (67.5%) |
| Transportation & Warehousing | 197 (100.0%) | 0 (0.0%) |
| Utilities | 49 (100.0%) | 0 (0.0%) |
| Information | 0 (0.0%) | 0 (0.0%) |
| Finance & Insurance | 0 (0.0%) | 130 (100.0%) |
| Real Estate, Rental & Leasing | 0 (0.0%) | 31 (100.0%) |
| Professional & Scientific | 31 (100.0%) | 0 (0.0%) |
| Enterprise Management | 0 (0.0%) | 0 (0.0%) |
| Administrative & Support | 85 (63.9%) | 48 (36.1%) |
| Educational Services | 49 (20.0%) | 196 (80.0%) |
| Health Care & Social Assistance | 273 (38.3%) | 440 (61.7%) |
| Arts, Entertainment & Recreation | 65 (89.0%) | 8 (11.0%) |
| Accommodation & Food Services | 39 (47.0%) | 44 (53.0%) |
| Public Administration | 166 (72.5%) | 63 (27.5%) |
| Total | 1,557 (52.1%) | 1,434 (47.9%) |
Education in South Williamsport borough
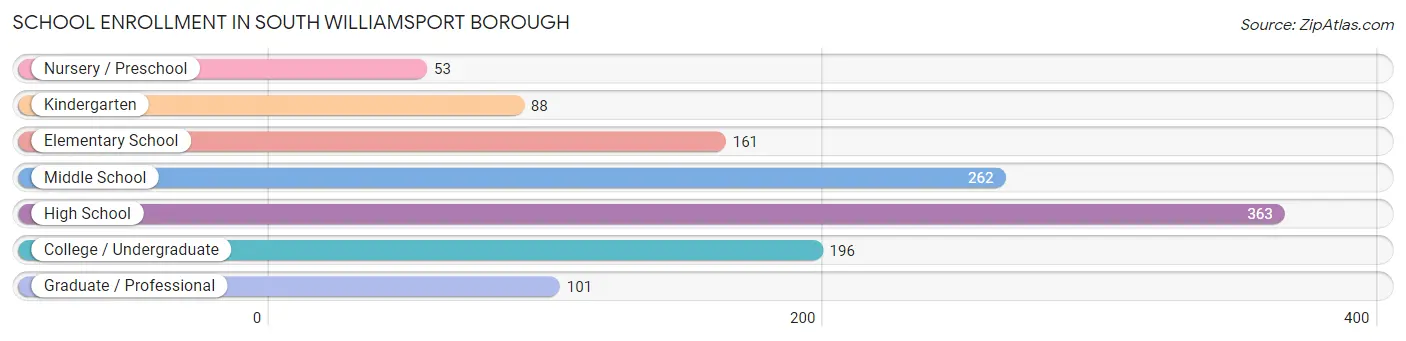
School Enrollment in South Williamsport borough
The most common levels of schooling among the 1,224 students in South Williamsport borough are high school (363 | 29.7%), middle school (262 | 21.4%), and college / undergraduate (196 | 16.0%).
| School Level | # Students | % Students |
| Nursery / Preschool | 53 | 4.3% |
| Kindergarten | 88 | 7.2% |
| Elementary School | 161 | 13.2% |
| Middle School | 262 | 21.4% |
| High School | 363 | 29.7% |
| College / Undergraduate | 196 | 16.0% |
| Graduate / Professional | 101 | 8.3% |
| Total | 1,224 | 100.0% |
School Enrollment by Age by Funding Source in South Williamsport borough
Out of a total of 1,224 students who are enrolled in schools in South Williamsport borough, 193 (15.8%) attend a private institution, while the remaining 1,031 (84.2%) are enrolled in public schools. The age group of 3 to 4 year olds has the highest likelihood of being enrolled in private schools, with 43 (81.1% in the age bracket) enrolled. Conversely, the age group of 15 to 17 year olds has the lowest likelihood of being enrolled in a private school, with 318 (100.0% in the age bracket) attending a public institution.
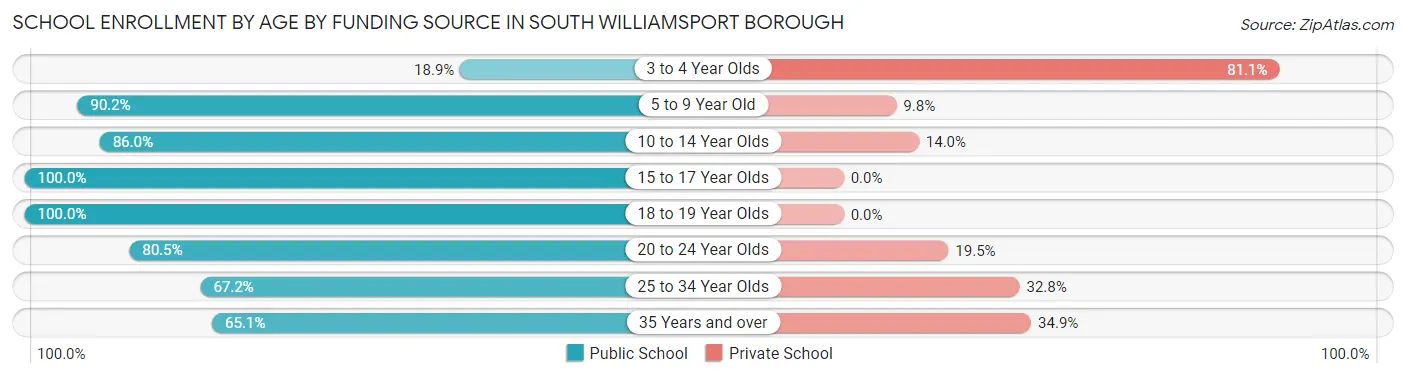
| Age Bracket | Public School | Private School |
| 3 to 4 Year Olds | 10 (18.9%) | 43 (81.1%) |
| 5 to 9 Year Old | 257 (90.2%) | 28 (9.8%) |
| 10 to 14 Year Olds | 215 (86.0%) | 35 (14.0%) |
| 15 to 17 Year Olds | 318 (100.0%) | 0 (0.0%) |
| 18 to 19 Year Olds | 40 (100.0%) | 0 (0.0%) |
| 20 to 24 Year Olds | 33 (80.5%) | 8 (19.5%) |
| 25 to 34 Year Olds | 117 (67.2%) | 57 (32.8%) |
| 35 Years and over | 41 (65.1%) | 22 (34.9%) |
| Total | 1,031 (84.2%) | 193 (15.8%) |
Educational Attainment by Field of Study in South Williamsport borough
Education (322 | 25.6%), science & technology (305 | 24.3%), business (138 | 11.0%), arts & humanities (108 | 8.6%), and psychology (94 | 7.5%) are the most common fields of study among 1,256 individuals in South Williamsport borough who have obtained a bachelor's degree or higher.
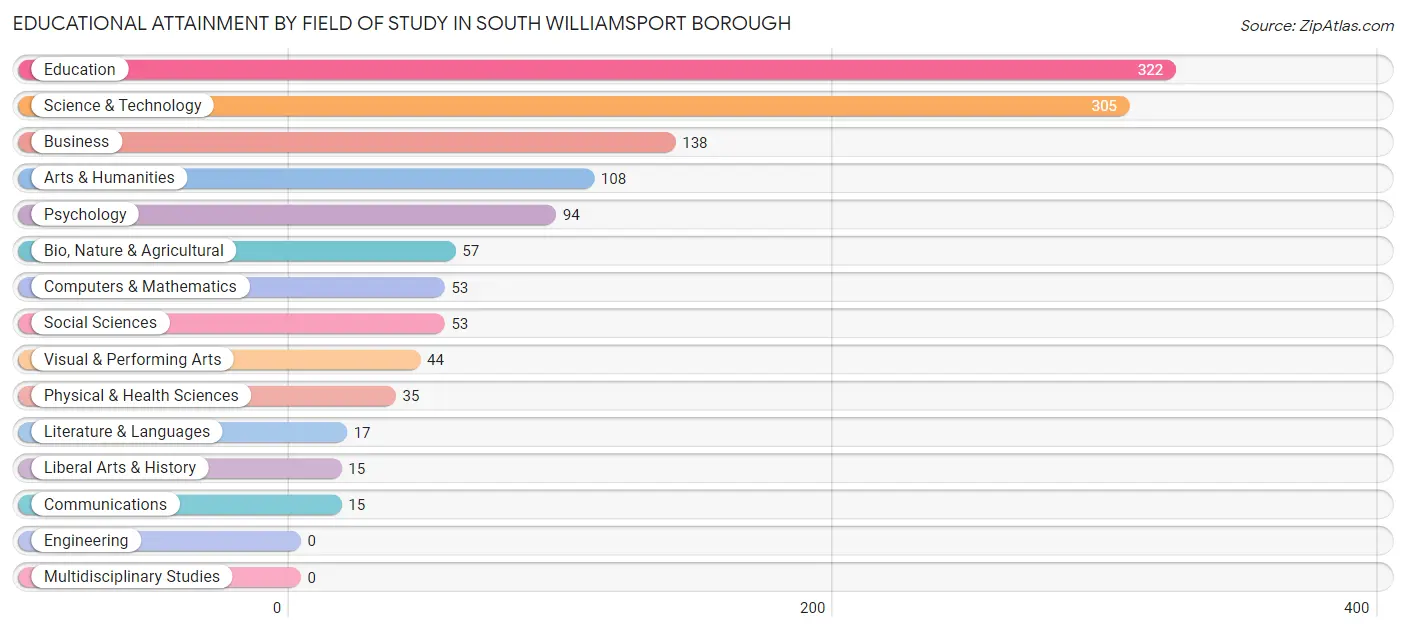
| Field of Study | # Graduates | % Graduates |
| Computers & Mathematics | 53 | 4.2% |
| Bio, Nature & Agricultural | 57 | 4.5% |
| Physical & Health Sciences | 35 | 2.8% |
| Psychology | 94 | 7.5% |
| Social Sciences | 53 | 4.2% |
| Engineering | 0 | 0.0% |
| Multidisciplinary Studies | 0 | 0.0% |
| Science & Technology | 305 | 24.3% |
| Business | 138 | 11.0% |
| Education | 322 | 25.6% |
| Literature & Languages | 17 | 1.3% |
| Liberal Arts & History | 15 | 1.2% |
| Visual & Performing Arts | 44 | 3.5% |
| Communications | 15 | 1.2% |
| Arts & Humanities | 108 | 8.6% |
| Total | 1,256 | 100.0% |
Transportation & Commute in South Williamsport borough
Vehicle Availability by Sex in South Williamsport borough
The most prevalent vehicle ownership categories in South Williamsport borough are males with 2 vehicles (664, accounting for 44.4%) and females with 2 vehicles (610, making up 46.3%).
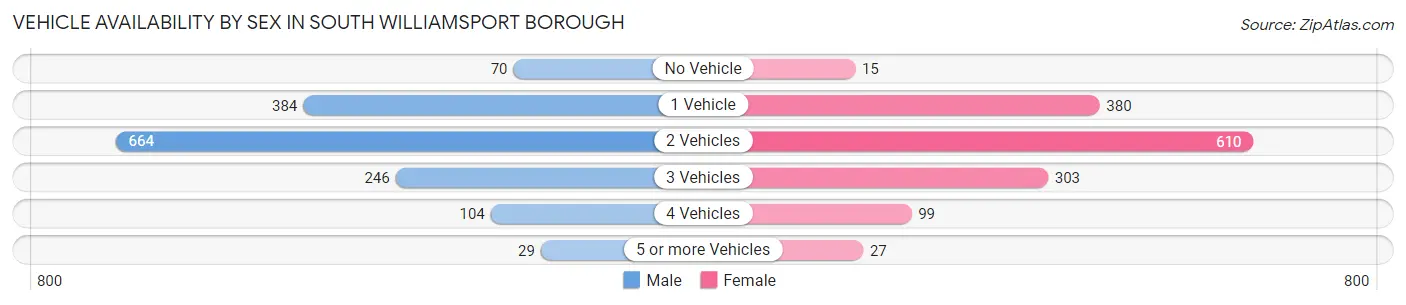
| Vehicles Available | Male | Female |
| No Vehicle | 70 (4.7%) | 15 (1.1%) |
| 1 Vehicle | 384 (25.7%) | 380 (26.5%) |
| 2 Vehicles | 664 (44.4%) | 610 (42.5%) |
| 3 Vehicles | 246 (16.4%) | 303 (21.1%) |
| 4 Vehicles | 104 (7.0%) | 99 (6.9%) |
| 5 or more Vehicles | 29 (1.9%) | 27 (1.9%) |
| Total | 1,497 (100.0%) | 1,434 (100.0%) |
Commute Time in South Williamsport borough
The most frequently occuring commute durations in South Williamsport borough are 10 to 14 minutes (827 commuters, 28.7%), 5 to 9 minutes (771 commuters, 26.8%), and 15 to 19 minutes (398 commuters, 13.8%).
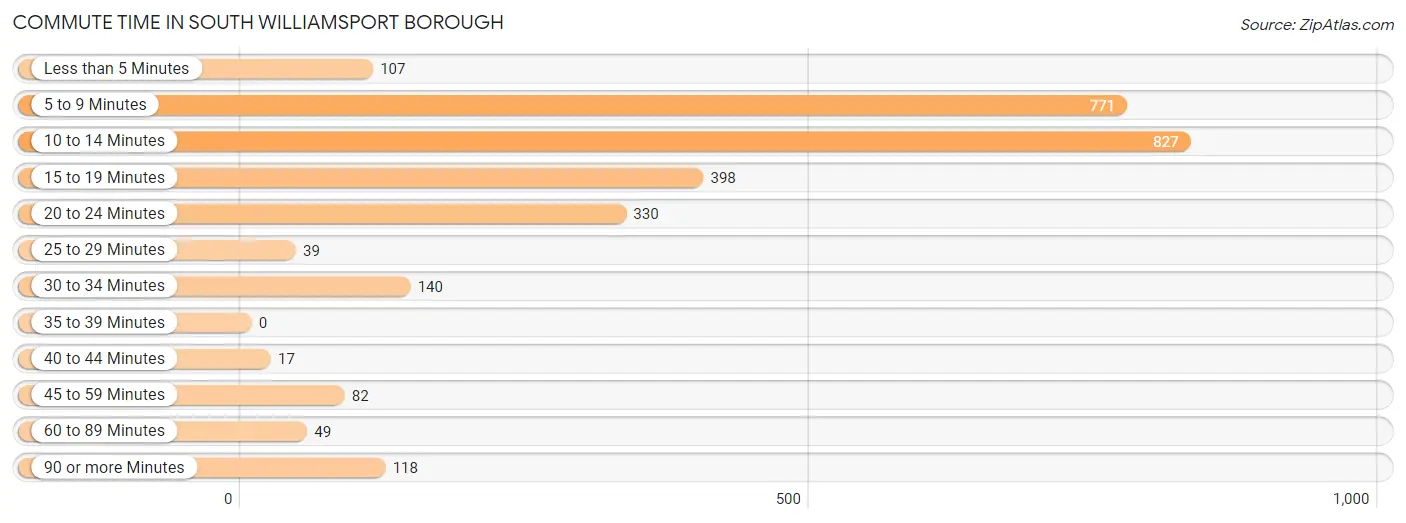
| Commute Time | # Commuters | % Commuters |
| Less than 5 Minutes | 107 | 3.7% |
| 5 to 9 Minutes | 771 | 26.8% |
| 10 to 14 Minutes | 827 | 28.7% |
| 15 to 19 Minutes | 398 | 13.8% |
| 20 to 24 Minutes | 330 | 11.5% |
| 25 to 29 Minutes | 39 | 1.4% |
| 30 to 34 Minutes | 140 | 4.9% |
| 35 to 39 Minutes | 0 | 0.0% |
| 40 to 44 Minutes | 17 | 0.6% |
| 45 to 59 Minutes | 82 | 2.9% |
| 60 to 89 Minutes | 49 | 1.7% |
| 90 or more Minutes | 118 | 4.1% |
Commute Time by Sex in South Williamsport borough
The most common commute times in South Williamsport borough are 10 to 14 minutes (418 commuters, 27.9%) for males and 10 to 14 minutes (409 commuters, 29.6%) for females.
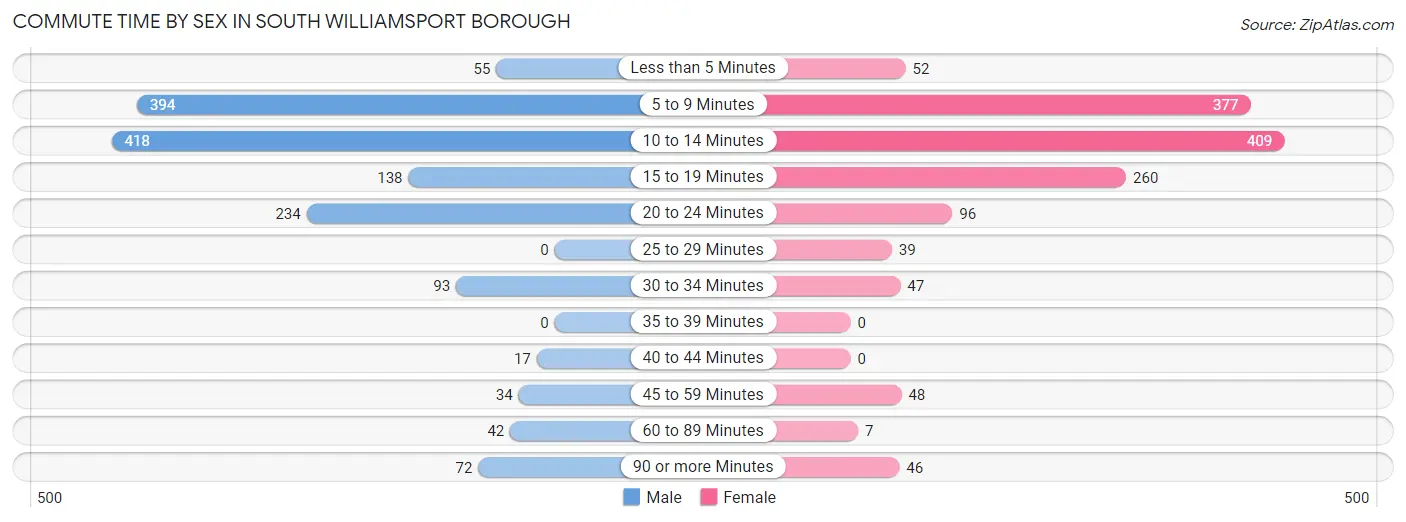
| Commute Time | Male | Female |
| Less than 5 Minutes | 55 (3.7%) | 52 (3.8%) |
| 5 to 9 Minutes | 394 (26.3%) | 377 (27.3%) |
| 10 to 14 Minutes | 418 (27.9%) | 409 (29.6%) |
| 15 to 19 Minutes | 138 (9.2%) | 260 (18.8%) |
| 20 to 24 Minutes | 234 (15.6%) | 96 (7.0%) |
| 25 to 29 Minutes | 0 (0.0%) | 39 (2.8%) |
| 30 to 34 Minutes | 93 (6.2%) | 47 (3.4%) |
| 35 to 39 Minutes | 0 (0.0%) | 0 (0.0%) |
| 40 to 44 Minutes | 17 (1.1%) | 0 (0.0%) |
| 45 to 59 Minutes | 34 (2.3%) | 48 (3.5%) |
| 60 to 89 Minutes | 42 (2.8%) | 7 (0.5%) |
| 90 or more Minutes | 72 (4.8%) | 46 (3.3%) |
Time of Departure to Work by Sex in South Williamsport borough
The most frequent times of departure to work in South Williamsport borough are 6:30 AM to 6:59 AM (350, 23.4%) for males and 8:00 AM to 8:29 AM (253, 18.3%) for females.
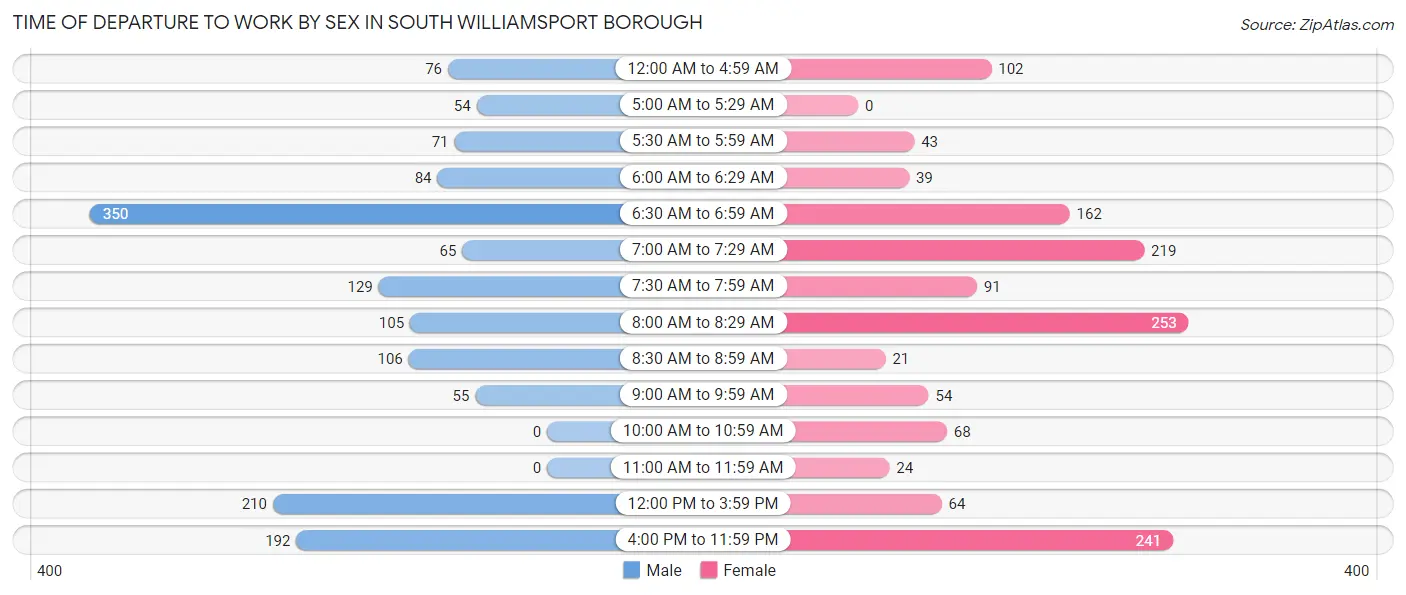
| Time of Departure | Male | Female |
| 12:00 AM to 4:59 AM | 76 (5.1%) | 102 (7.4%) |
| 5:00 AM to 5:29 AM | 54 (3.6%) | 0 (0.0%) |
| 5:30 AM to 5:59 AM | 71 (4.7%) | 43 (3.1%) |
| 6:00 AM to 6:29 AM | 84 (5.6%) | 39 (2.8%) |
| 6:30 AM to 6:59 AM | 350 (23.4%) | 162 (11.7%) |
| 7:00 AM to 7:29 AM | 65 (4.3%) | 219 (15.9%) |
| 7:30 AM to 7:59 AM | 129 (8.6%) | 91 (6.6%) |
| 8:00 AM to 8:29 AM | 105 (7.0%) | 253 (18.3%) |
| 8:30 AM to 8:59 AM | 106 (7.1%) | 21 (1.5%) |
| 9:00 AM to 9:59 AM | 55 (3.7%) | 54 (3.9%) |
| 10:00 AM to 10:59 AM | 0 (0.0%) | 68 (4.9%) |
| 11:00 AM to 11:59 AM | 0 (0.0%) | 24 (1.7%) |
| 12:00 PM to 3:59 PM | 210 (14.0%) | 64 (4.6%) |
| 4:00 PM to 11:59 PM | 192 (12.8%) | 241 (17.4%) |
| Total | 1,497 (100.0%) | 1,381 (100.0%) |
Housing Occupancy in South Williamsport borough
Occupancy by Ownership in South Williamsport borough
Of the total 2,600 dwellings in South Williamsport borough, owner-occupied units account for 1,631 (62.7%), while renter-occupied units make up 969 (37.3%).
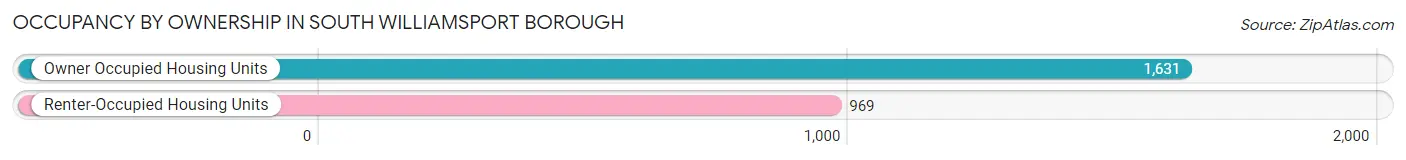
| Occupancy | # Housing Units | % Housing Units |
| Owner Occupied Housing Units | 1,631 | 62.7% |
| Renter-Occupied Housing Units | 969 | 37.3% |
| Total Occupied Housing Units | 2,600 | 100.0% |
Occupancy by Household Size in South Williamsport borough
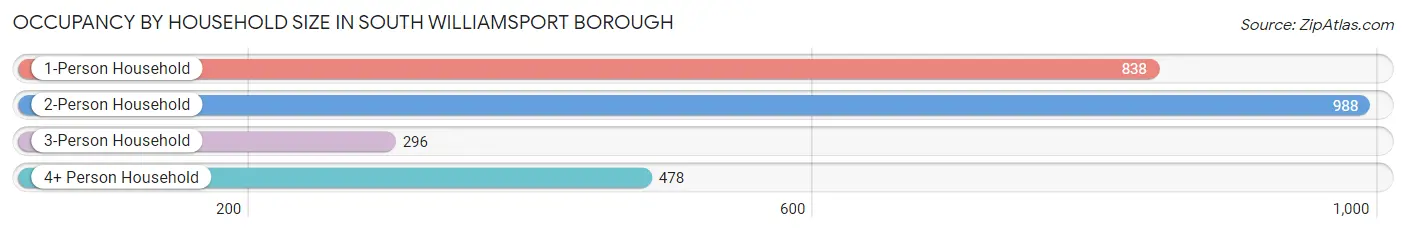
| Household Size | # Housing Units | % Housing Units |
| 1-Person Household | 838 | 32.2% |
| 2-Person Household | 988 | 38.0% |
| 3-Person Household | 296 | 11.4% |
| 4+ Person Household | 478 | 18.4% |
| Total Housing Units | 2,600 | 100.0% |
Occupancy by Ownership by Household Size in South Williamsport borough
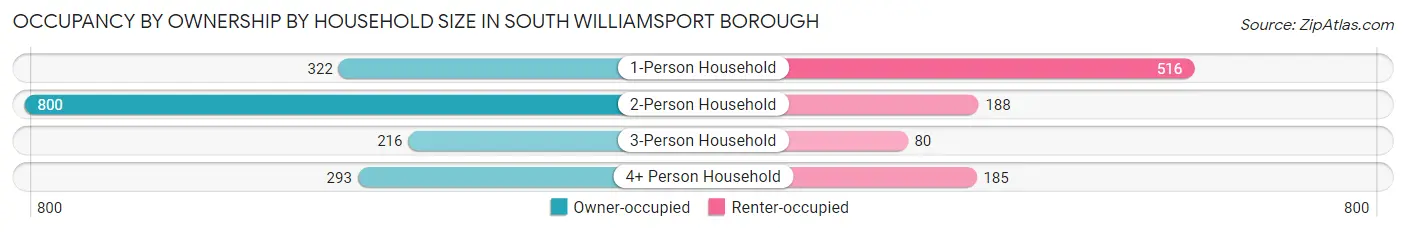
| Household Size | Owner-occupied | Renter-occupied |
| 1-Person Household | 322 (38.4%) | 516 (61.6%) |
| 2-Person Household | 800 (81.0%) | 188 (19.0%) |
| 3-Person Household | 216 (73.0%) | 80 (27.0%) |
| 4+ Person Household | 293 (61.3%) | 185 (38.7%) |
| Total Housing Units | 1,631 (62.7%) | 969 (37.3%) |
Occupancy by Educational Attainment in South Williamsport borough
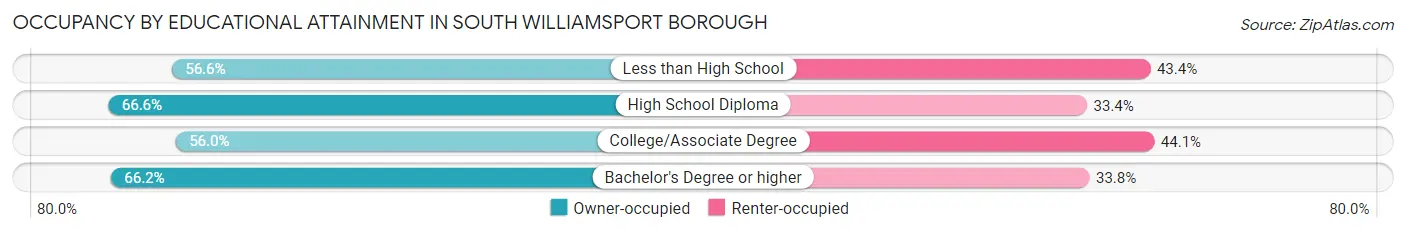
| Household Size | Owner-occupied | Renter-occupied |
| Less than High School | 56 (56.6%) | 43 (43.4%) |
| High School Diploma | 563 (66.6%) | 282 (33.4%) |
| College/Associate Degree | 461 (55.9%) | 363 (44.1%) |
| Bachelor's Degree or higher | 551 (66.2%) | 281 (33.8%) |
Occupancy by Age of Householder in South Williamsport borough
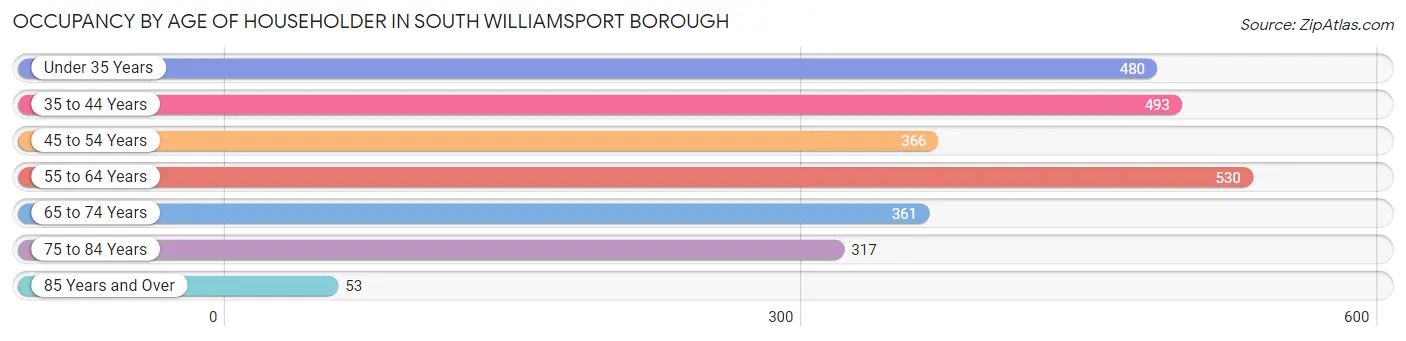
| Age Bracket | # Households | % Households |
| Under 35 Years | 480 | 18.5% |
| 35 to 44 Years | 493 | 19.0% |
| 45 to 54 Years | 366 | 14.1% |
| 55 to 64 Years | 530 | 20.4% |
| 65 to 74 Years | 361 | 13.9% |
| 75 to 84 Years | 317 | 12.2% |
| 85 Years and Over | 53 | 2.0% |
| Total | 2,600 | 100.0% |
Housing Finances in South Williamsport borough
Median Income by Occupancy in South Williamsport borough
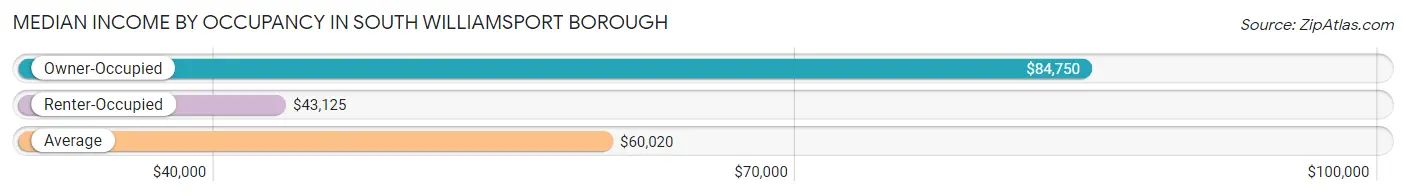
| Occupancy Type | # Households | Median Income |
| Owner-Occupied | 1,631 (62.7%) | $84,750 |
| Renter-Occupied | 969 (37.3%) | $43,125 |
| Average | 2,600 (100.0%) | $60,020 |
Occupancy by Householder Income Bracket in South Williamsport borough
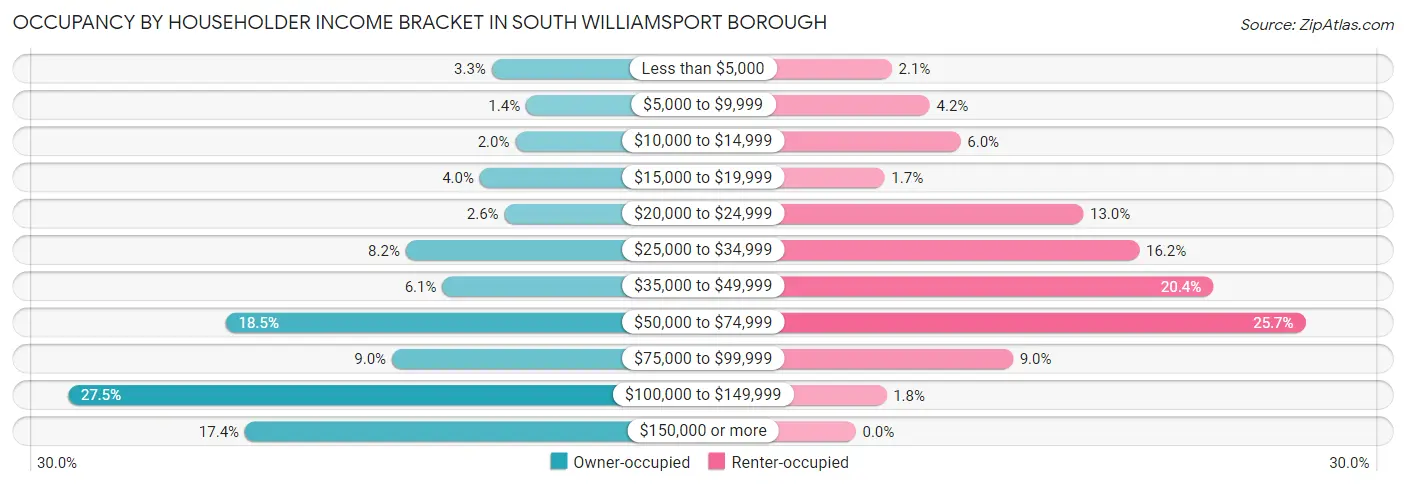
| Income Bracket | Owner-occupied | Renter-occupied |
| Less than $5,000 | 54 (3.3%) | 20 (2.1%) |
| $5,000 to $9,999 | 22 (1.3%) | 41 (4.2%) |
| $10,000 to $14,999 | 32 (2.0%) | 58 (6.0%) |
| $15,000 to $19,999 | 65 (4.0%) | 16 (1.7%) |
| $20,000 to $24,999 | 42 (2.6%) | 126 (13.0%) |
| $25,000 to $34,999 | 134 (8.2%) | 157 (16.2%) |
| $35,000 to $49,999 | 100 (6.1%) | 198 (20.4%) |
| $50,000 to $74,999 | 302 (18.5%) | 249 (25.7%) |
| $75,000 to $99,999 | 147 (9.0%) | 87 (9.0%) |
| $100,000 to $149,999 | 449 (27.5%) | 17 (1.8%) |
| $150,000 or more | 284 (17.4%) | 0 (0.0%) |
| Total | 1,631 (100.0%) | 969 (100.0%) |
Monthly Housing Cost Tiers in South Williamsport borough
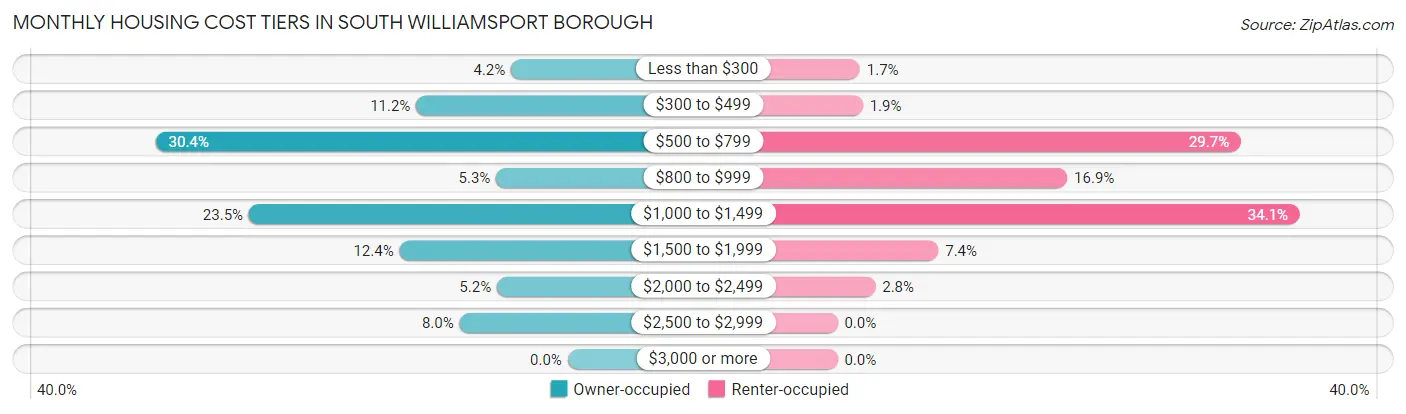
| Monthly Cost | Owner-occupied | Renter-occupied |
| Less than $300 | 68 (4.2%) | 16 (1.7%) |
| $300 to $499 | 182 (11.2%) | 18 (1.9%) |
| $500 to $799 | 495 (30.3%) | 288 (29.7%) |
| $800 to $999 | 86 (5.3%) | 164 (16.9%) |
| $1,000 to $1,499 | 383 (23.5%) | 330 (34.1%) |
| $1,500 to $1,999 | 202 (12.4%) | 72 (7.4%) |
| $2,000 to $2,499 | 85 (5.2%) | 27 (2.8%) |
| $2,500 to $2,999 | 130 (8.0%) | 0 (0.0%) |
| $3,000 or more | 0 (0.0%) | 0 (0.0%) |
| Total | 1,631 (100.0%) | 969 (100.0%) |
Physical Housing Characteristics in South Williamsport borough
Housing Structures in South Williamsport borough
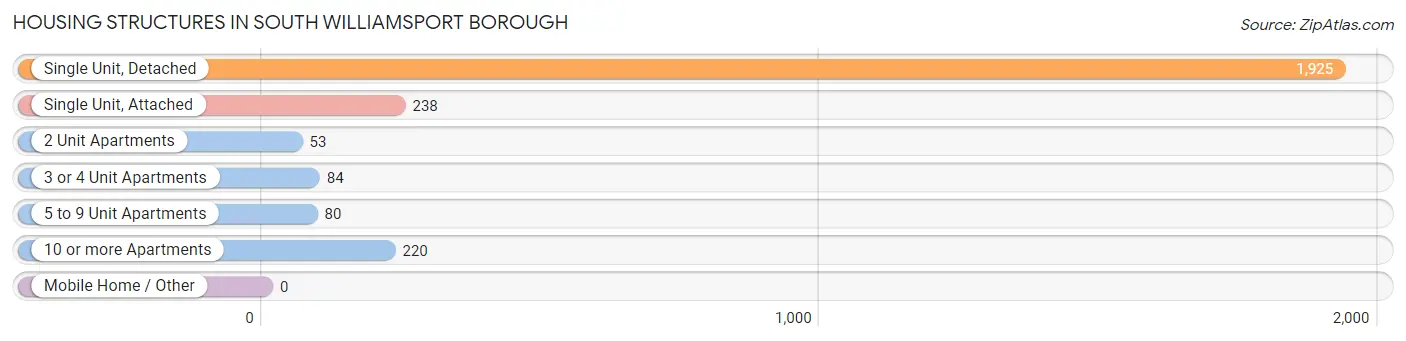
| Structure Type | # Housing Units | % Housing Units |
| Single Unit, Detached | 1,925 | 74.0% |
| Single Unit, Attached | 238 | 9.1% |
| 2 Unit Apartments | 53 | 2.0% |
| 3 or 4 Unit Apartments | 84 | 3.2% |
| 5 to 9 Unit Apartments | 80 | 3.1% |
| 10 or more Apartments | 220 | 8.5% |
| Mobile Home / Other | 0 | 0.0% |
| Total | 2,600 | 100.0% |
Housing Structures by Occupancy in South Williamsport borough
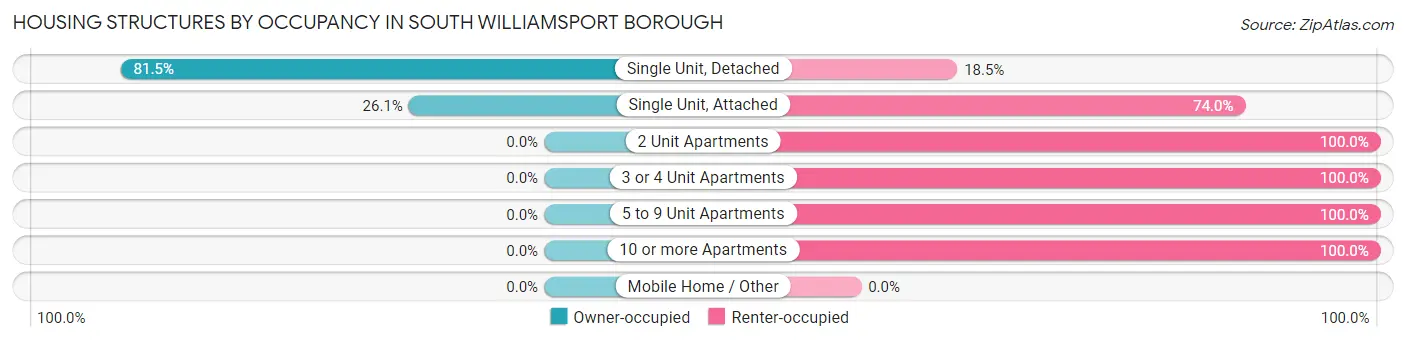
| Structure Type | Owner-occupied | Renter-occupied |
| Single Unit, Detached | 1,569 (81.5%) | 356 (18.5%) |
| Single Unit, Attached | 62 (26.1%) | 176 (74.0%) |
| 2 Unit Apartments | 0 (0.0%) | 53 (100.0%) |
| 3 or 4 Unit Apartments | 0 (0.0%) | 84 (100.0%) |
| 5 to 9 Unit Apartments | 0 (0.0%) | 80 (100.0%) |
| 10 or more Apartments | 0 (0.0%) | 220 (100.0%) |
| Mobile Home / Other | 0 (0.0%) | 0 (0.0%) |
| Total | 1,631 (62.7%) | 969 (37.3%) |
Housing Structures by Number of Rooms in South Williamsport borough
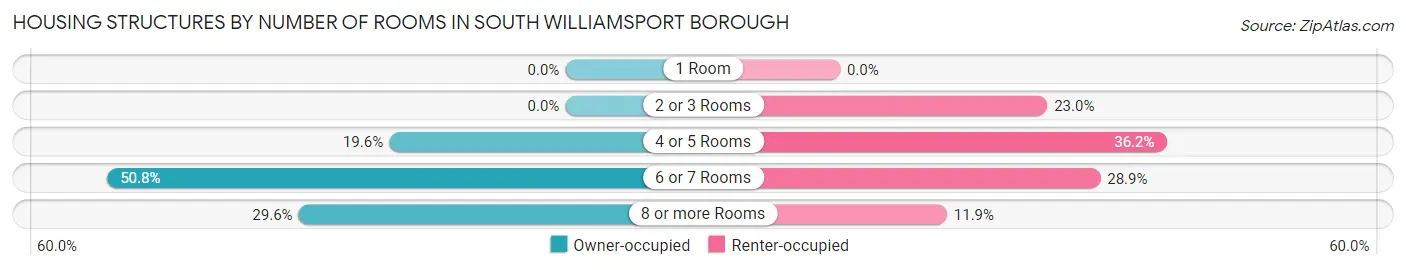
| Number of Rooms | Owner-occupied | Renter-occupied |
| 1 Room | 0 (0.0%) | 0 (0.0%) |
| 2 or 3 Rooms | 0 (0.0%) | 223 (23.0%) |
| 4 or 5 Rooms | 319 (19.6%) | 351 (36.2%) |
| 6 or 7 Rooms | 829 (50.8%) | 280 (28.9%) |
| 8 or more Rooms | 483 (29.6%) | 115 (11.9%) |
| Total | 1,631 (100.0%) | 969 (100.0%) |
Housing Structure by Heating Type in South Williamsport borough
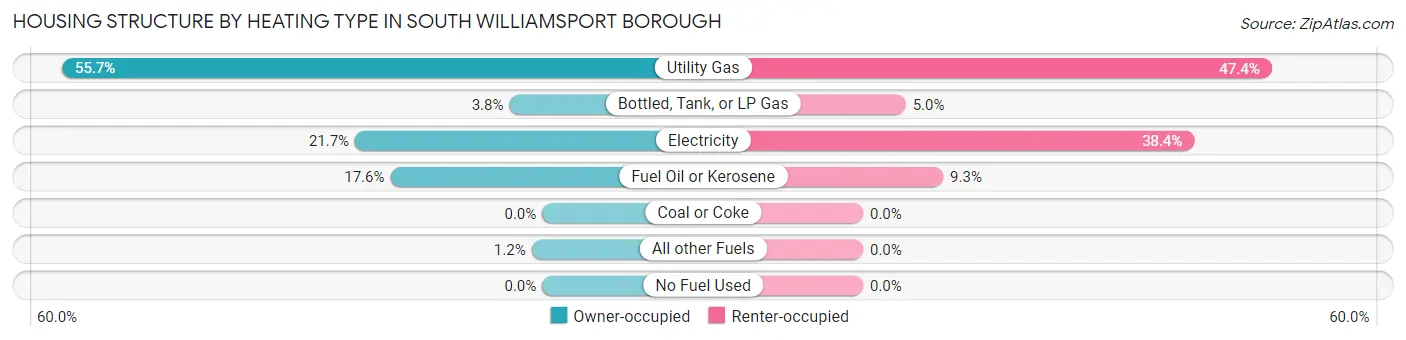
| Heating Type | Owner-occupied | Renter-occupied |
| Utility Gas | 908 (55.7%) | 459 (47.4%) |
| Bottled, Tank, or LP Gas | 62 (3.8%) | 48 (5.0%) |
| Electricity | 354 (21.7%) | 372 (38.4%) |
| Fuel Oil or Kerosene | 287 (17.6%) | 90 (9.3%) |
| Coal or Coke | 0 (0.0%) | 0 (0.0%) |
| All other Fuels | 20 (1.2%) | 0 (0.0%) |
| No Fuel Used | 0 (0.0%) | 0 (0.0%) |
| Total | 1,631 (100.0%) | 969 (100.0%) |
Household Vehicle Usage in South Williamsport borough
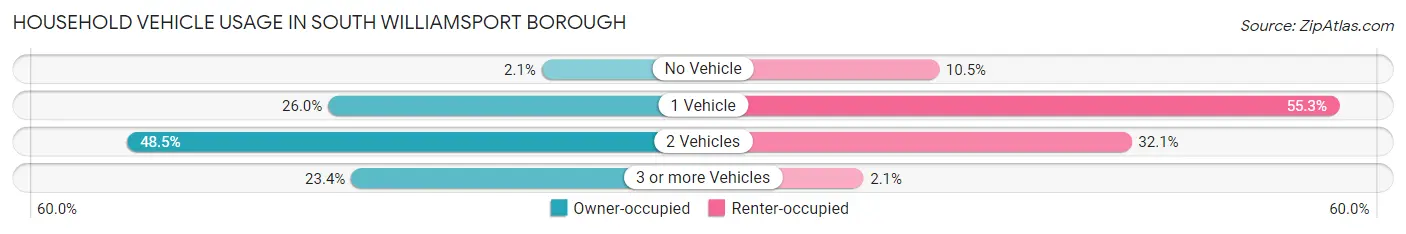
| Vehicles per Household | Owner-occupied | Renter-occupied |
| No Vehicle | 34 (2.1%) | 102 (10.5%) |
| 1 Vehicle | 424 (26.0%) | 536 (55.3%) |
| 2 Vehicles | 791 (48.5%) | 311 (32.1%) |
| 3 or more Vehicles | 382 (23.4%) | 20 (2.1%) |
| Total | 1,631 (100.0%) | 969 (100.0%) |
Real Estate & Mortgages in South Williamsport borough
Real Estate and Mortgage Overview in South Williamsport borough
| Characteristic | Without Mortgage | With Mortgage |
| Housing Units | 718 | 913 |
| Median Property Value | $169,400 | $170,400 |
| Median Household Income | $60,909 | $206 |
| Monthly Housing Costs | $539 | $0 |
| Real Estate Taxes | $2,446 | $0 |
Property Value by Mortgage Status in South Williamsport borough
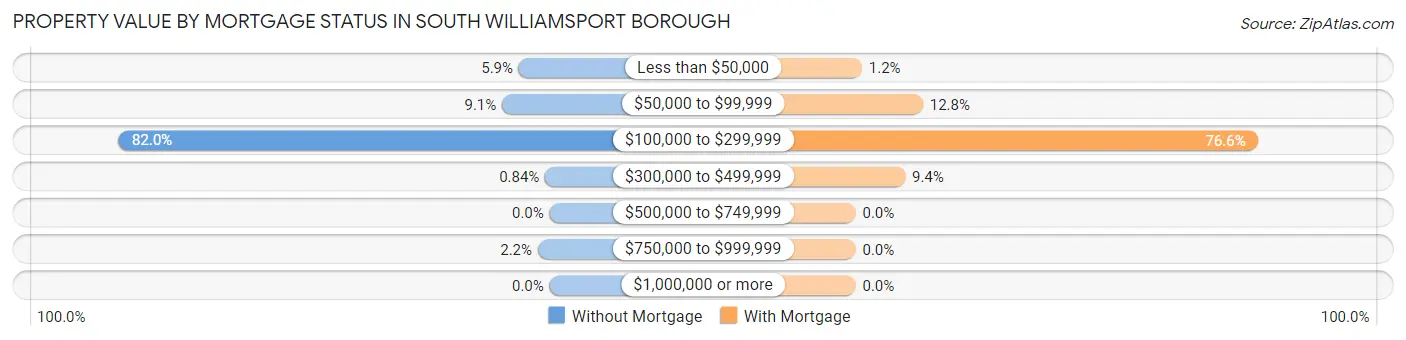
| Property Value | Without Mortgage | With Mortgage |
| Less than $50,000 | 42 (5.9%) | 11 (1.2%) |
| $50,000 to $99,999 | 65 (9.0%) | 117 (12.8%) |
| $100,000 to $299,999 | 589 (82.0%) | 699 (76.6%) |
| $300,000 to $499,999 | 6 (0.8%) | 86 (9.4%) |
| $500,000 to $749,999 | 0 (0.0%) | 0 (0.0%) |
| $750,000 to $999,999 | 16 (2.2%) | 0 (0.0%) |
| $1,000,000 or more | 0 (0.0%) | 0 (0.0%) |
| Total | 718 (100.0%) | 913 (100.0%) |
Household Income by Mortgage Status in South Williamsport borough
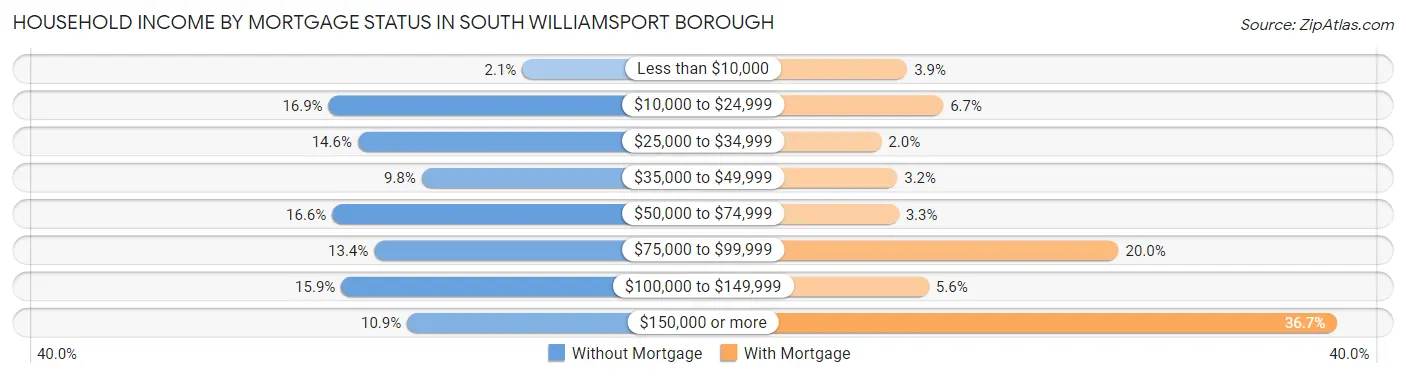
| Household Income | Without Mortgage | With Mortgage |
| Less than $10,000 | 15 (2.1%) | 36 (3.9%) |
| $10,000 to $24,999 | 121 (16.9%) | 61 (6.7%) |
| $25,000 to $34,999 | 105 (14.6%) | 18 (2.0%) |
| $35,000 to $49,999 | 70 (9.8%) | 29 (3.2%) |
| $50,000 to $74,999 | 119 (16.6%) | 30 (3.3%) |
| $75,000 to $99,999 | 96 (13.4%) | 183 (20.0%) |
| $100,000 to $149,999 | 114 (15.9%) | 51 (5.6%) |
| $150,000 or more | 78 (10.9%) | 335 (36.7%) |
| Total | 718 (100.0%) | 913 (100.0%) |
Property Value to Household Income Ratio in South Williamsport borough
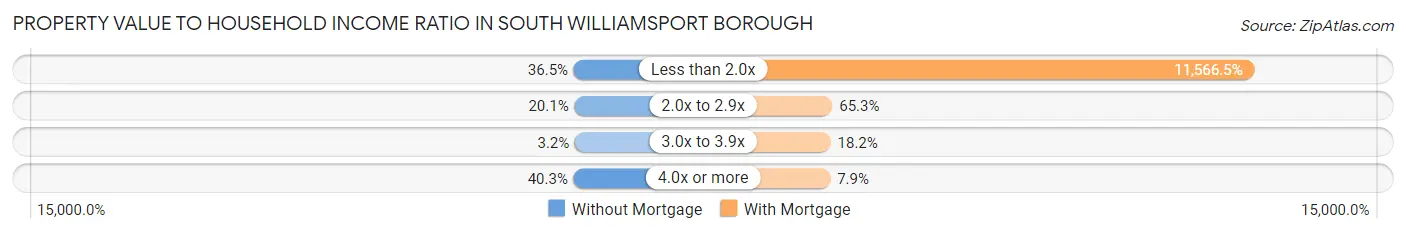
| Value-to-Income Ratio | Without Mortgage | With Mortgage |
| Less than 2.0x | 262 (36.5%) | 105,602 (11,566.5%) |
| 2.0x to 2.9x | 144 (20.1%) | 596 (65.3%) |
| 3.0x to 3.9x | 23 (3.2%) | 166 (18.2%) |
| 4.0x or more | 289 (40.3%) | 72 (7.9%) |
| Total | 718 (100.0%) | 913 (100.0%) |
Real Estate Taxes by Mortgage Status in South Williamsport borough
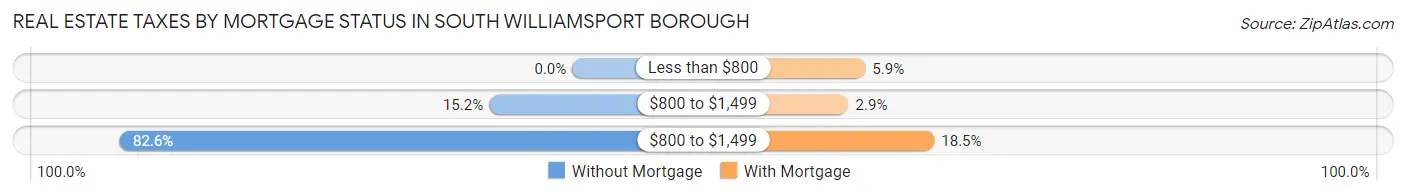
| Property Taxes | Without Mortgage | With Mortgage |
| Less than $800 | 0 (0.0%) | 54 (5.9%) |
| $800 to $1,499 | 109 (15.2%) | 26 (2.9%) |
| $800 to $1,499 | 593 (82.6%) | 169 (18.5%) |
| Total | 718 (100.0%) | 913 (100.0%) |
Health & Disability in South Williamsport borough
Health Insurance Coverage by Age in South Williamsport borough
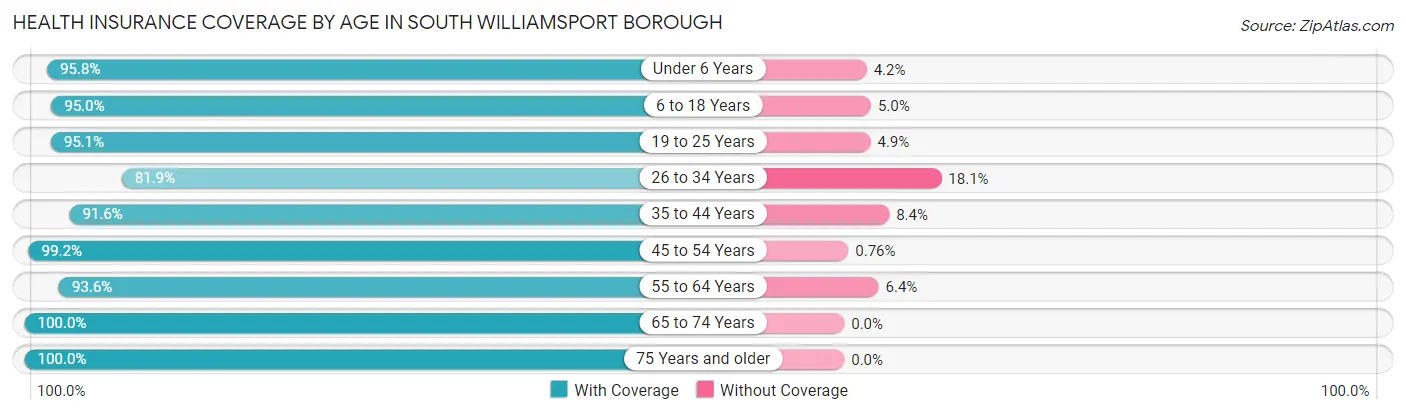
| Age Bracket | With Coverage | Without Coverage |
| Under 6 Years | 367 (95.8%) | 16 (4.2%) |
| 6 to 18 Years | 820 (95.0%) | 43 (5.0%) |
| 19 to 25 Years | 525 (95.1%) | 27 (4.9%) |
| 26 to 34 Years | 624 (81.9%) | 138 (18.1%) |
| 35 to 44 Years | 777 (91.6%) | 71 (8.4%) |
| 45 to 54 Years | 652 (99.2%) | 5 (0.8%) |
| 55 to 64 Years | 878 (93.6%) | 60 (6.4%) |
| 65 to 74 Years | 640 (100.0%) | 0 (0.0%) |
| 75 Years and older | 588 (100.0%) | 0 (0.0%) |
| Total | 5,871 (94.2%) | 360 (5.8%) |
Health Insurance Coverage by Citizenship Status in South Williamsport borough
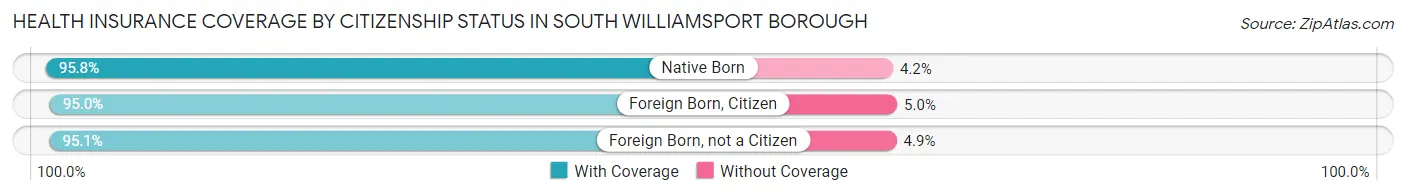
| Citizenship Status | With Coverage | Without Coverage |
| Native Born | 367 (95.8%) | 16 (4.2%) |
| Foreign Born, Citizen | 820 (95.0%) | 43 (5.0%) |
| Foreign Born, not a Citizen | 525 (95.1%) | 27 (4.9%) |
Health Insurance Coverage by Household Income in South Williamsport borough
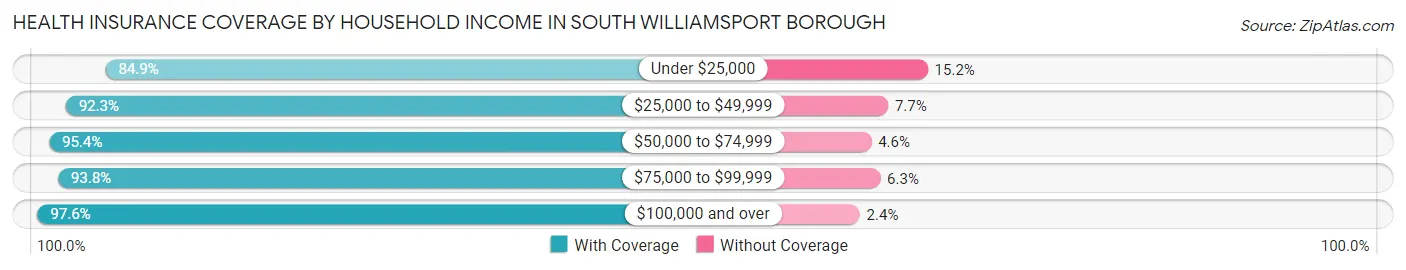
| Household Income | With Coverage | Without Coverage |
| Under $25,000 | 644 (84.9%) | 115 (15.1%) |
| $25,000 to $49,999 | 1,077 (92.3%) | 90 (7.7%) |
| $50,000 to $74,999 | 1,145 (95.4%) | 55 (4.6%) |
| $75,000 to $99,999 | 615 (93.8%) | 41 (6.2%) |
| $100,000 and over | 2,390 (97.6%) | 59 (2.4%) |
Public vs Private Health Insurance Coverage by Age in South Williamsport borough
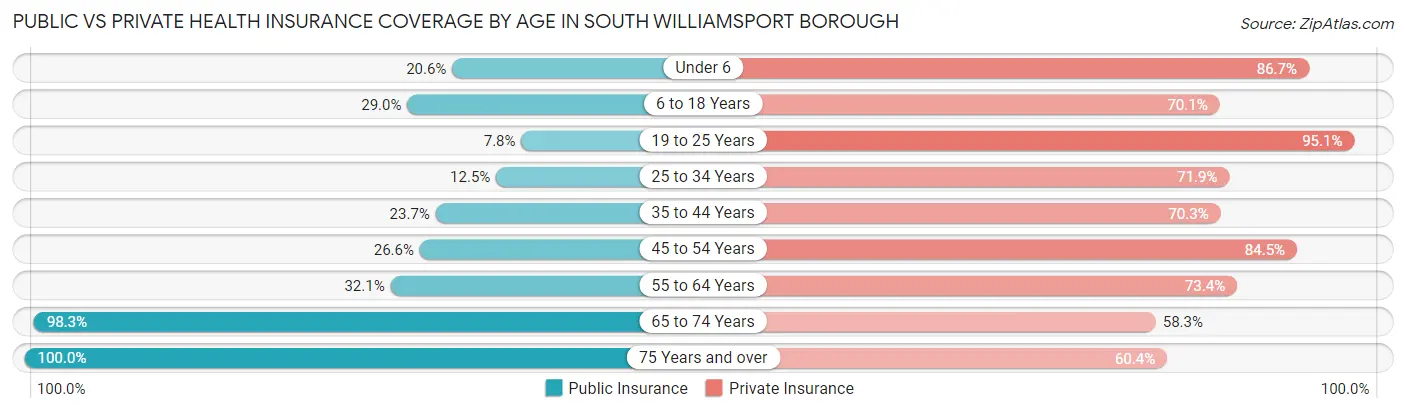
| Age Bracket | Public Insurance | Private Insurance |
| Under 6 | 79 (20.6%) | 332 (86.7%) |
| 6 to 18 Years | 250 (29.0%) | 605 (70.1%) |
| 19 to 25 Years | 43 (7.8%) | 525 (95.1%) |
| 25 to 34 Years | 95 (12.5%) | 548 (71.9%) |
| 35 to 44 Years | 201 (23.7%) | 596 (70.3%) |
| 45 to 54 Years | 175 (26.6%) | 555 (84.5%) |
| 55 to 64 Years | 301 (32.1%) | 688 (73.4%) |
| 65 to 74 Years | 629 (98.3%) | 373 (58.3%) |
| 75 Years and over | 588 (100.0%) | 355 (60.4%) |
| Total | 2,361 (37.9%) | 4,577 (73.5%) |
Disability Status by Sex by Age in South Williamsport borough
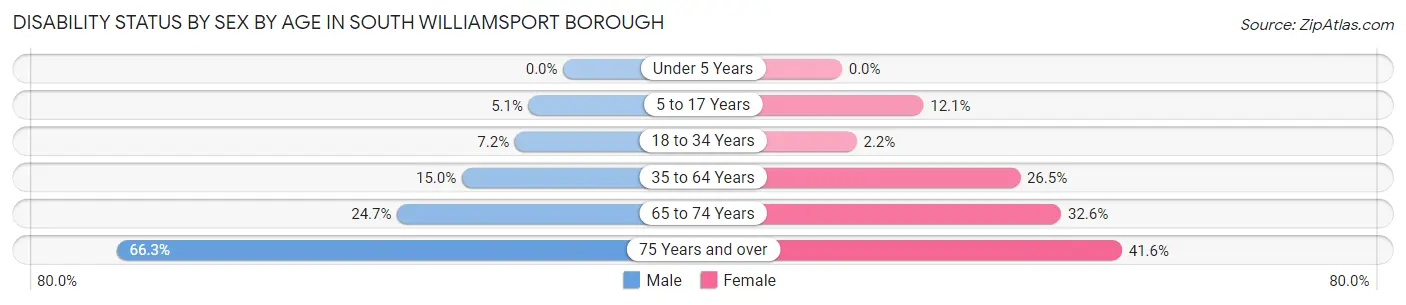
| Age Bracket | Male | Female |
| Under 5 Years | 0 (0.0%) | 0 (0.0%) |
| 5 to 17 Years | 25 (5.1%) | 53 (12.1%) |
| 18 to 34 Years | 50 (7.2%) | 14 (2.2%) |
| 35 to 64 Years | 177 (15.0%) | 335 (26.5%) |
| 65 to 74 Years | 73 (24.7%) | 112 (32.6%) |
| 75 Years and over | 197 (66.3%) | 121 (41.6%) |
Disability Class by Sex by Age in South Williamsport borough
Disability Class: Hearing Difficulty
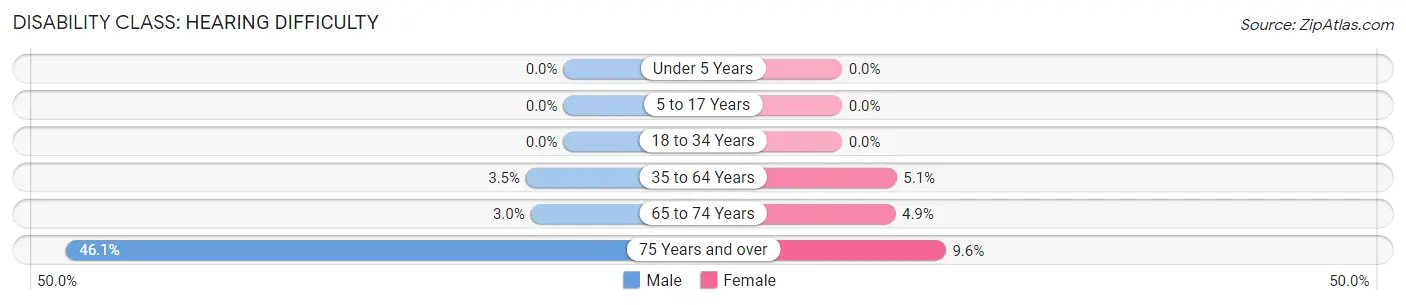
| Age Bracket | Male | Female |
| Under 5 Years | 0 (0.0%) | 0 (0.0%) |
| 5 to 17 Years | 0 (0.0%) | 0 (0.0%) |
| 18 to 34 Years | 0 (0.0%) | 0 (0.0%) |
| 35 to 64 Years | 41 (3.5%) | 64 (5.1%) |
| 65 to 74 Years | 9 (3.0%) | 17 (4.9%) |
| 75 Years and over | 137 (46.1%) | 28 (9.6%) |
Disability Class: Vision Difficulty
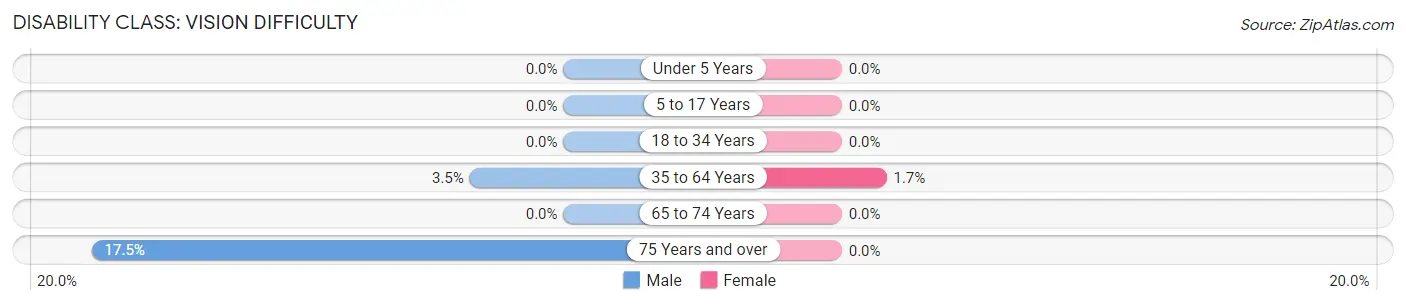
| Age Bracket | Male | Female |
| Under 5 Years | 0 (0.0%) | 0 (0.0%) |
| 5 to 17 Years | 0 (0.0%) | 0 (0.0%) |
| 18 to 34 Years | 0 (0.0%) | 0 (0.0%) |
| 35 to 64 Years | 41 (3.5%) | 21 (1.7%) |
| 65 to 74 Years | 0 (0.0%) | 0 (0.0%) |
| 75 Years and over | 52 (17.5%) | 0 (0.0%) |
Disability Class: Cognitive Difficulty
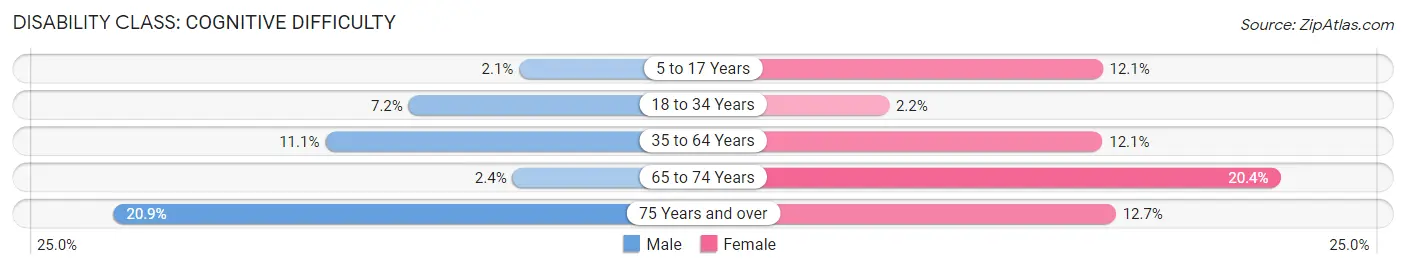
| Age Bracket | Male | Female |
| 5 to 17 Years | 10 (2.1%) | 53 (12.1%) |
| 18 to 34 Years | 50 (7.2%) | 14 (2.2%) |
| 35 to 64 Years | 130 (11.1%) | 153 (12.1%) |
| 65 to 74 Years | 7 (2.4%) | 70 (20.3%) |
| 75 Years and over | 62 (20.9%) | 37 (12.7%) |
Disability Class: Ambulatory Difficulty
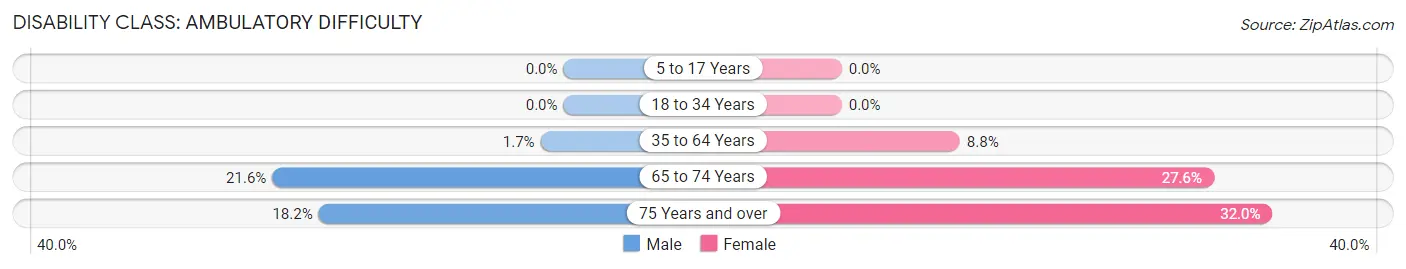
| Age Bracket | Male | Female |
| 5 to 17 Years | 0 (0.0%) | 0 (0.0%) |
| 18 to 34 Years | 0 (0.0%) | 0 (0.0%) |
| 35 to 64 Years | 20 (1.7%) | 111 (8.8%) |
| 65 to 74 Years | 64 (21.6%) | 95 (27.6%) |
| 75 Years and over | 54 (18.2%) | 93 (32.0%) |
Disability Class: Self-Care Difficulty
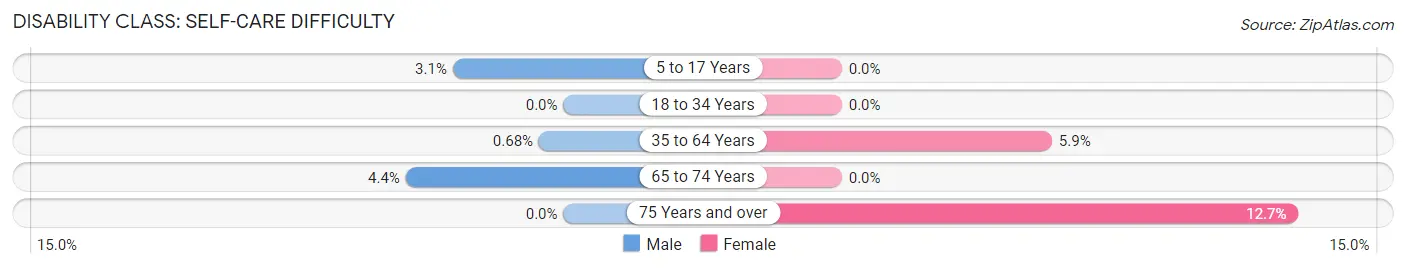
| Age Bracket | Male | Female |
| 5 to 17 Years | 15 (3.1%) | 0 (0.0%) |
| 18 to 34 Years | 0 (0.0%) | 0 (0.0%) |
| 35 to 64 Years | 8 (0.7%) | 74 (5.9%) |
| 65 to 74 Years | 13 (4.4%) | 0 (0.0%) |
| 75 Years and over | 0 (0.0%) | 37 (12.7%) |
Technology Access in South Williamsport borough
Computing Device Access in South Williamsport borough
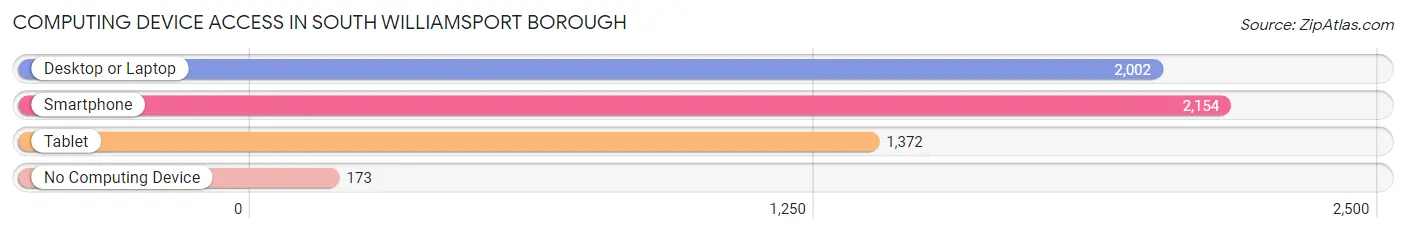
| Device Type | # Households | % Households |
| Desktop or Laptop | 2,002 | 77.0% |
| Smartphone | 2,154 | 82.9% |
| Tablet | 1,372 | 52.8% |
| No Computing Device | 173 | 6.7% |
| Total | 2,600 | 100.0% |
Internet Access in South Williamsport borough
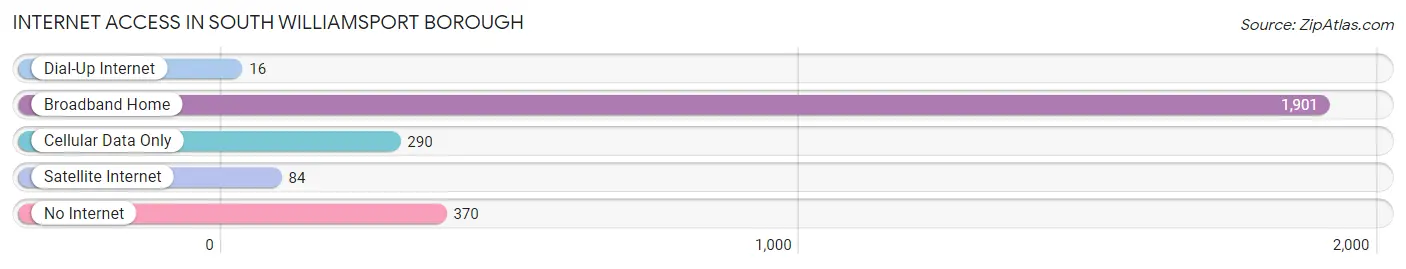
| Internet Type | # Households | % Households |
| Dial-Up Internet | 16 | 0.6% |
| Broadband Home | 1,901 | 73.1% |
| Cellular Data Only | 290 | 11.2% |
| Satellite Internet | 84 | 3.2% |
| No Internet | 370 | 14.2% |
| Total | 2,600 | 100.0% |
South Williamsport borough Summary
Williamsport Borough, Pennsylvania is located in Lycoming County in the north-central part of the state. It is the county seat and the largest city in the county. The city is situated along the West Branch Susquehanna River and is the principal city of the Williamsport, Pennsylvania Metropolitan Statistical Area. The city has a population of approximately 30,000 people and is the home of the Little League World Series.
History
The area that is now Williamsport was first settled in 1795 by John Farrand Sr. and his family. Farrand was a surveyor and a Revolutionary War veteran who had been granted a land grant from the Commonwealth of Pennsylvania. The area was originally known as Farrand's Settlement and was located along the West Branch Susquehanna River. In 1806, the settlement was renamed Williamsport in honor of William Hepburn, a local landowner and businessman.
The city was officially incorporated in 1866 and quickly became a major industrial center. The city was home to several lumber mills, tanneries, and other industries. The lumber industry was particularly important to the city's economy and the city was known as the "Lumber Capital of the World" for many years.
The city was also home to several major railroads, including the Pennsylvania Railroad, the Lehigh Valley Railroad, and the Reading Railroad. These railroads helped to make Williamsport a major transportation hub and helped to fuel the city's growth.
The city was also home to several major manufacturing companies, including the Williamsport Foundry and Machine Company, the Williamsport Wire Rope Company, and the Williamsport Textile Company. These companies helped to make Williamsport a major industrial center and helped to fuel the city's growth.
The city was also home to several major educational institutions, including the Williamsport Academy, the Williamsport Business College, and the Williamsport Technical Institute. These institutions helped to make Williamsport a major educational center and helped to fuel the city's growth.
Geography
Williamsport is located in north-central Pennsylvania, along the West Branch Susquehanna River. The city is situated at an elevation of approximately 500 feet above sea level. The city has a total area of 8.3 square miles, of which 8.2 square miles is land and 0.1 square miles is water.
The city is located in a humid continental climate zone and has four distinct seasons. Summers are typically hot and humid, while winters are cold and snowy. The average annual temperature is approximately 50 degrees Fahrenheit.
Economy
Williamsport's economy is largely based on manufacturing and services. The city is home to several major manufacturing companies, including the Williamsport Foundry and Machine Company, the Williamsport Wire Rope Company, and the Williamsport Textile Company. These companies help to make Williamsport a major industrial center and help to fuel the city's economy.
The city is also home to several major service industries, including healthcare, education, and retail. The city is home to several major healthcare providers, including UPMC Susquehanna, Susquehanna Health, and the Williamsport Regional Medical Center. The city is also home to several major educational institutions, including the Williamsport Academy, the Williamsport Business College, and the Williamsport Technical Institute. The city is also home to several major retail stores, including Walmart, Target, and Lowe's.
Demographics
As of the 2010 census, the city had a population of 29,381 people. The racial makeup of the city was 87.3% White, 8.2% African American, 0.3% Native American, 1.2% Asian, 0.1% Pacific Islander, 0.7% from other races, and 2.4% from two or more races. Hispanic or Latino of any race were 2.7% of the population.
The median household income in the city was $35,945 and the median family income was $45,837. The per capita income in the city was $20,845. About 16.2% of the population was below the poverty line.
Williamsport is a diverse city with a rich history and a vibrant economy. The city is home to several major industries, educational institutions, and service industries, which help to make it a major economic center in the region. The city is also home to a diverse population, which helps to make it a vibrant and welcoming place to live.
Common Questions
What is Per Capita Income in South Williamsport borough?
Per Capita income in South Williamsport borough is $32,558.
What is the Median Family Income in South Williamsport borough?
Median Family Income in South Williamsport borough is $77,813.
What is the Median Household income in South Williamsport borough?
Median Household Income in South Williamsport borough is $60,020.
What is Income or Wage Gap in South Williamsport borough?
Income or Wage Gap in South Williamsport borough is 21.6%.
Women in South Williamsport borough earn 78.4 cents for every dollar earned by a man.
What is Inequality or Gini Index in South Williamsport borough?
Inequality or Gini Index in South Williamsport borough is 0.43.
What is the Total Population of South Williamsport borough?
Total Population of South Williamsport borough is 6,246.
What is the Total Male Population of South Williamsport borough?
Total Male Population of South Williamsport borough is 3,155.
What is the Total Female Population of South Williamsport borough?
Total Female Population of South Williamsport borough is 3,091.
What is the Ratio of Males per 100 Females in South Williamsport borough?
There are 102.07 Males per 100 Females in South Williamsport borough.
What is the Ratio of Females per 100 Males in South Williamsport borough?
There are 97.97 Females per 100 Males in South Williamsport borough.
What is the Median Population Age in South Williamsport borough?
Median Population Age in South Williamsport borough is 41.7 Years.
What is the Average Family Size in South Williamsport borough
Average Family Size in South Williamsport borough is 2.9 People.
What is the Average Household Size in South Williamsport borough
Average Household Size in South Williamsport borough is 2.4 People.
How Large is the Labor Force in South Williamsport borough?
There are 3,196 People in the Labor Forcein in South Williamsport borough.
What is the Percentage of People in the Labor Force in South Williamsport borough?
61.1% of People are in the Labor Force in South Williamsport borough.
What is the Unemployment Rate in South Williamsport borough?
Unemployment Rate in South Williamsport borough is 6.4%.