Slickville, PA Map & Demographics
Slickville Map
Slickville Overview
$36,879
PER CAPITA INCOME
$97,689
AVG FAMILY INCOME
$83,036
AVG HOUSEHOLD INCOME
0.22
INEQUALITY / GINI INDEX
297
TOTAL POPULATION
156
MALE POPULATION
141
FEMALE POPULATION
110.64
MALES / 100 FEMALES
90.38
FEMALES / 100 MALES
57.6
MEDIAN AGE
2.2
AVG FAMILY SIZE
2.0
AVG HOUSEHOLD SIZE
105
LABOR FORCE [ PEOPLE ]
38.9%
PERCENT IN LABOR FORCE
Slickville Zip Codes
Slickville Area Codes
Income in Slickville
Income Overview in Slickville
Per Capita Income in Slickville is $36,879, while median incomes of families and households are $97,689 and $83,036 respectively.
| Characteristic | Number | Measure |
| Per Capita Income | 297 | $36,879 |
| Median Family Income | 118 | $97,689 |
| Mean Family Income | 118 | $77,254 |
| Median Household Income | 147 | $83,036 |
| Mean Household Income | 147 | $73,871 |
| Income Deficit | 118 | $0 |
| Wage / Income Gap (%) | 297 | 0.00% |
| Wage / Income Gap ($) | 297 | 100.00¢ per $1 |
| Gini / Inequality Index | 297 | 0.22 |
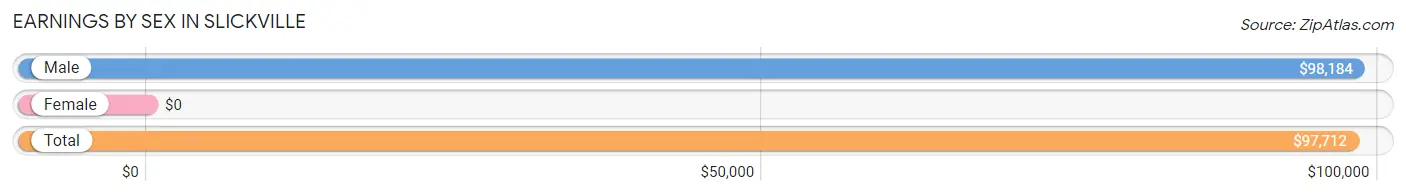
Earnings by Sex in Slickville
| Sex | Number | Average Earnings |
| Male | 85 (80.9%) | $98,184 |
| Female | 20 (19.1%) | $0 |
| Total | 105 (100.0%) | $97,712 |
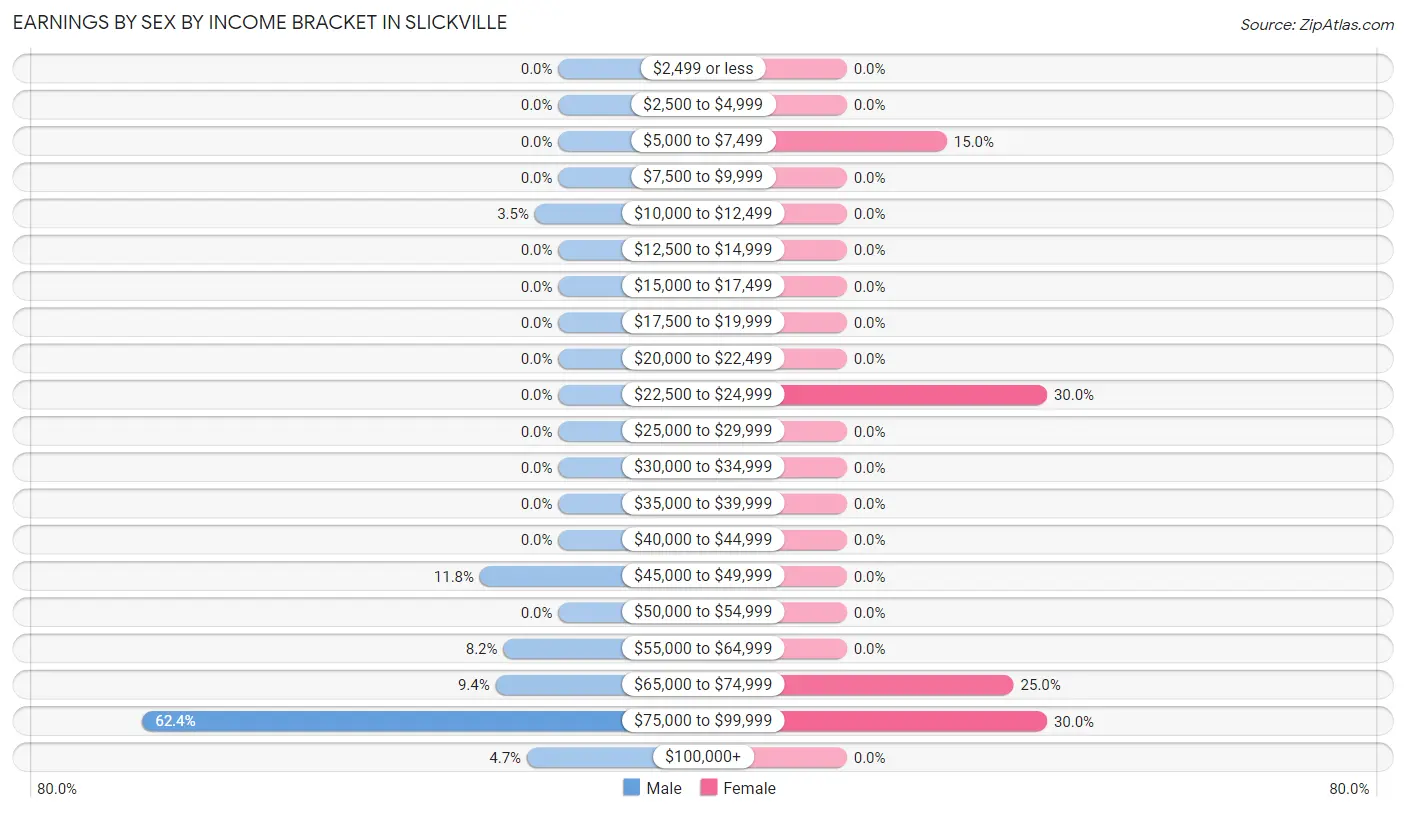
Earnings by Sex by Income Bracket in Slickville
The most common earnings brackets in Slickville are $75,000 to $99,999 for men (53 | 62.4%) and $22,500 to $24,999 for women (6 | 30.0%).
| Income | Male | Female |
| $2,499 or less | 0 (0.0%) | 0 (0.0%) |
| $2,500 to $4,999 | 0 (0.0%) | 0 (0.0%) |
| $5,000 to $7,499 | 0 (0.0%) | 3 (15.0%) |
| $7,500 to $9,999 | 0 (0.0%) | 0 (0.0%) |
| $10,000 to $12,499 | 3 (3.5%) | 0 (0.0%) |
| $12,500 to $14,999 | 0 (0.0%) | 0 (0.0%) |
| $15,000 to $17,499 | 0 (0.0%) | 0 (0.0%) |
| $17,500 to $19,999 | 0 (0.0%) | 0 (0.0%) |
| $20,000 to $22,499 | 0 (0.0%) | 0 (0.0%) |
| $22,500 to $24,999 | 0 (0.0%) | 6 (30.0%) |
| $25,000 to $29,999 | 0 (0.0%) | 0 (0.0%) |
| $30,000 to $34,999 | 0 (0.0%) | 0 (0.0%) |
| $35,000 to $39,999 | 0 (0.0%) | 0 (0.0%) |
| $40,000 to $44,999 | 0 (0.0%) | 0 (0.0%) |
| $45,000 to $49,999 | 10 (11.8%) | 0 (0.0%) |
| $50,000 to $54,999 | 0 (0.0%) | 0 (0.0%) |
| $55,000 to $64,999 | 7 (8.2%) | 0 (0.0%) |
| $65,000 to $74,999 | 8 (9.4%) | 5 (25.0%) |
| $75,000 to $99,999 | 53 (62.4%) | 6 (30.0%) |
| $100,000+ | 4 (4.7%) | 0 (0.0%) |
| Total | 85 (100.0%) | 20 (100.0%) |
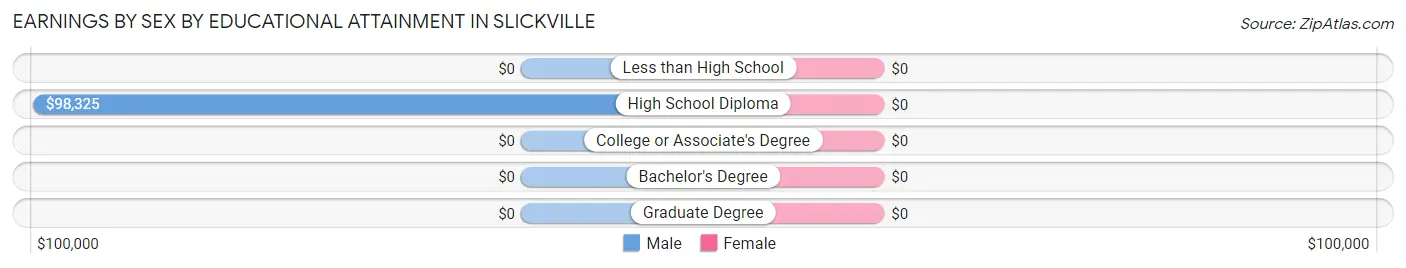
Earnings by Sex by Educational Attainment in Slickville
| Educational Attainment | Male Income | Female Income |
| Less than High School | - | - |
| High School Diploma | $98,325 | $0 |
| College or Associate's Degree | - | - |
| Bachelor's Degree | - | - |
| Graduate Degree | - | - |
| Total | $98,184 | $0 |
Family Income in Slickville
Family Income Brackets in Slickville
According to the Slickville family income data, there are 56 families falling into the $75,000 to $99,999 income range, which is the most common income bracket and makes up 47.5% of all families.
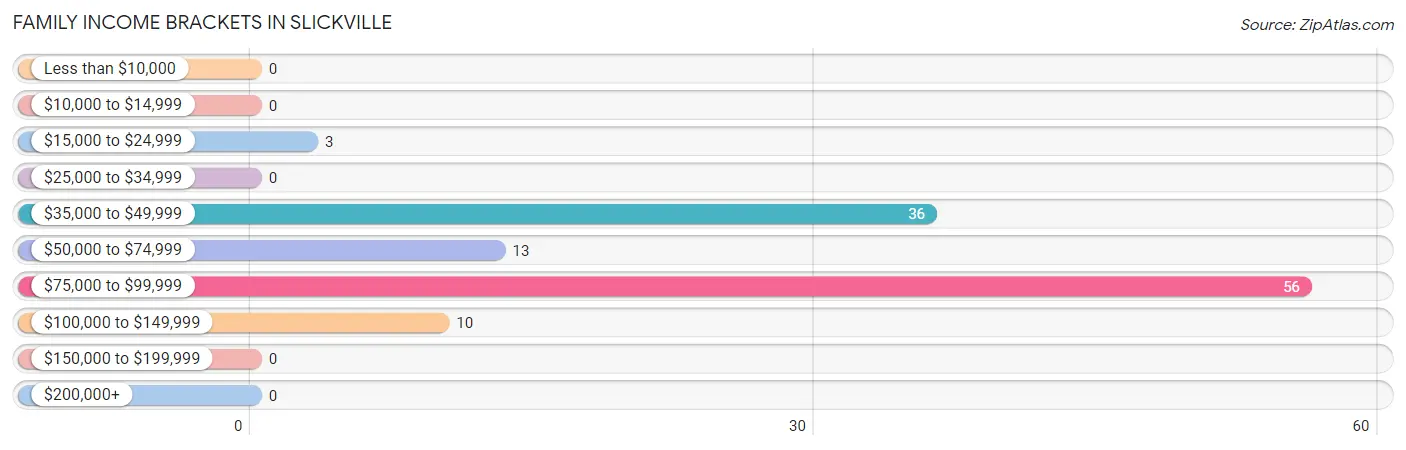
| Income Bracket | # Families | % Families |
| Less than $10,000 | 0 | 0.0% |
| $10,000 to $14,999 | 0 | 0.0% |
| $15,000 to $24,999 | 3 | 2.5% |
| $25,000 to $34,999 | 0 | 0.0% |
| $35,000 to $49,999 | 36 | 30.5% |
| $50,000 to $74,999 | 13 | 11.0% |
| $75,000 to $99,999 | 56 | 47.5% |
| $100,000 to $149,999 | 10 | 8.5% |
| $150,000 to $199,999 | 0 | 0.0% |
| $200,000+ | 0 | 0.0% |
Family Income by Famaliy Size in Slickville
2-person families (104 | 88.1%) account for the highest median family income in Slickville with $97,830 per family, while 2-person families (104 | 88.1%) have the highest median income of $48,915 per family member.
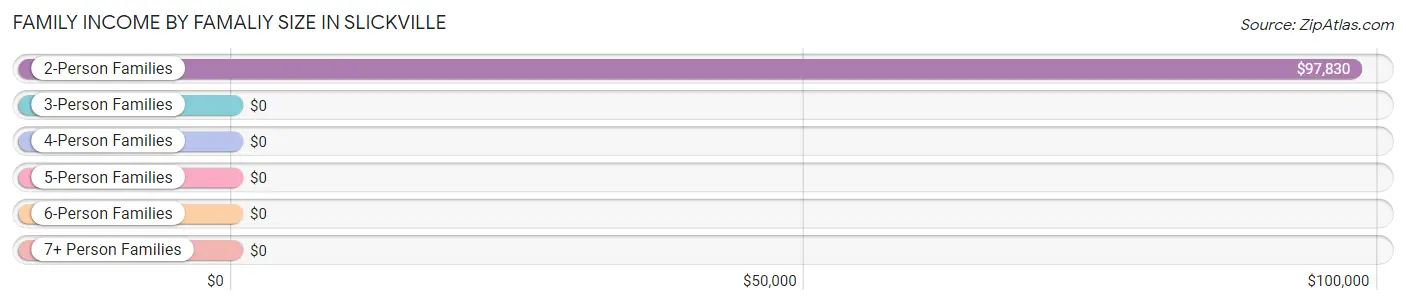
| Income Bracket | # Families | Median Income |
| 2-Person Families | 104 (88.1%) | $97,830 |
| 3-Person Families | 10 (8.5%) | $0 |
| 4-Person Families | 0 (0.0%) | $0 |
| 5-Person Families | 4 (3.4%) | $0 |
| 6-Person Families | 0 (0.0%) | $0 |
| 7+ Person Families | 0 (0.0%) | $0 |
| Total | 118 (100.0%) | $97,689 |
Family Income by Number of Earners in Slickville
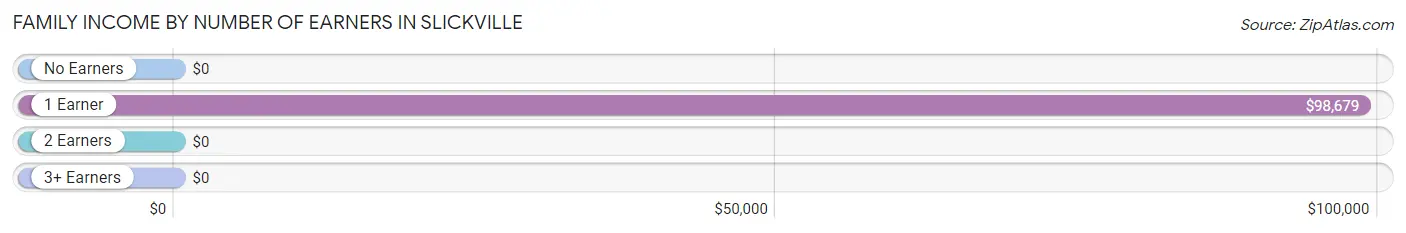
| Number of Earners | # Families | Median Income |
| No Earners | 39 (33.1%) | $0 |
| 1 Earner | 76 (64.4%) | $98,679 |
| 2 Earners | 3 (2.5%) | $0 |
| 3+ Earners | 0 (0.0%) | $0 |
| Total | 118 (100.0%) | $97,689 |
Household Income in Slickville
Household Income Brackets in Slickville
With 63 households falling in the category, the $75,000 to $99,999 income range is the most frequent in Slickville, accounting for 42.9% of all households.
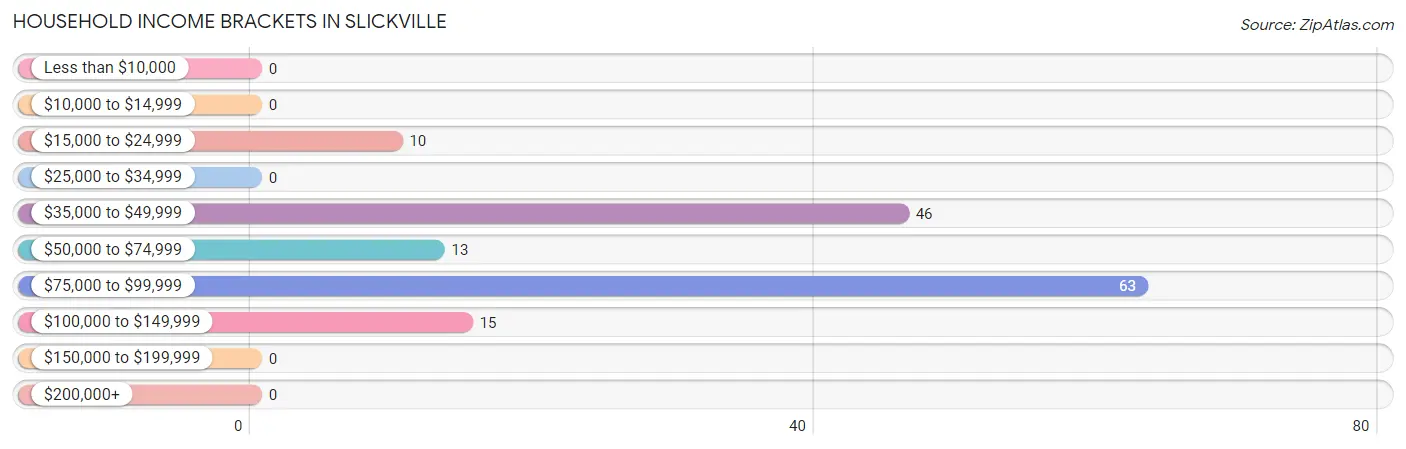
| Income Bracket | # Households | % Households |
| Less than $10,000 | 0 | 0.0% |
| $10,000 to $14,999 | 0 | 0.0% |
| $15,000 to $24,999 | 10 | 6.8% |
| $25,000 to $34,999 | 0 | 0.0% |
| $35,000 to $49,999 | 46 | 31.3% |
| $50,000 to $74,999 | 13 | 8.8% |
| $75,000 to $99,999 | 63 | 42.9% |
| $100,000 to $149,999 | 15 | 10.2% |
| $150,000 to $199,999 | 0 | 0.0% |
| $200,000+ | 0 | 0.0% |
Household Income by Householder Age in Slickville
The median household income in Slickville is $83,036, with the highest median household income of $98,656 found in the 45 to 64 years age bracket for the primary householder. A total of 87 households (59.2%) fall into this category.
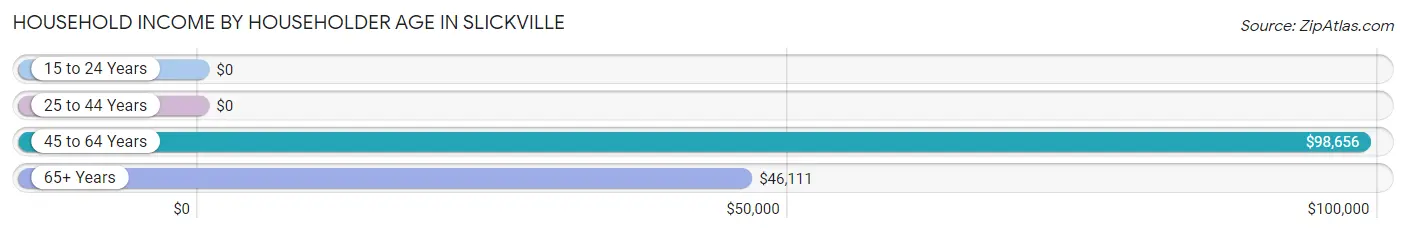
| Income Bracket | # Households | Median Income |
| 15 to 24 Years | 0 (0.0%) | $0 |
| 25 to 44 Years | 14 (9.5%) | $0 |
| 45 to 64 Years | 87 (59.2%) | $98,656 |
| 65+ Years | 46 (31.3%) | $46,111 |
| Total | 147 (100.0%) | $83,036 |
Poverty in Slickville
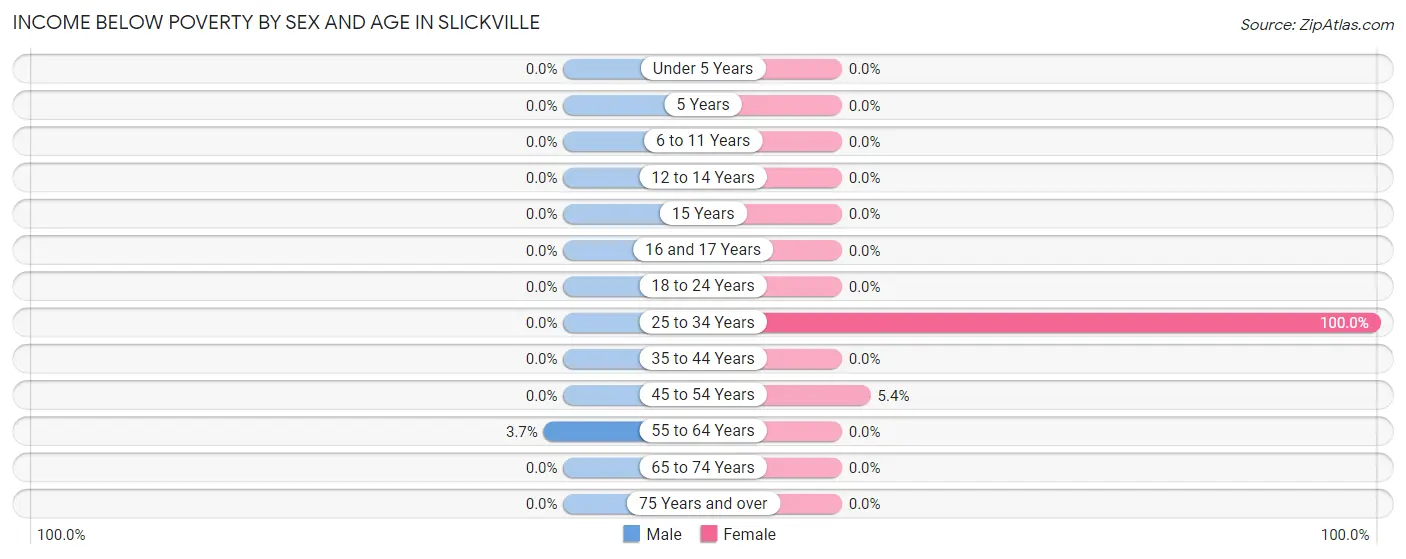
Income Below Poverty by Sex and Age in Slickville
With 1.9% poverty level for males and 4.3% for females among the residents of Slickville, 55 to 64 year old males and 25 to 34 year old females are the most vulnerable to poverty, with 3 males (3.7%) and 3 females (100.0%) in their respective age groups living below the poverty level.
| Age Bracket | Male | Female |
| Under 5 Years | 0 (0.0%) | 0 (0.0%) |
| 5 Years | 0 (0.0%) | 0 (0.0%) |
| 6 to 11 Years | 0 (0.0%) | 0 (0.0%) |
| 12 to 14 Years | 0 (0.0%) | 0 (0.0%) |
| 15 Years | 0 (0.0%) | 0 (0.0%) |
| 16 and 17 Years | 0 (0.0%) | 0 (0.0%) |
| 18 to 24 Years | 0 (0.0%) | 0 (0.0%) |
| 25 to 34 Years | 0 (0.0%) | 3 (100.0%) |
| 35 to 44 Years | 0 (0.0%) | 0 (0.0%) |
| 45 to 54 Years | 0 (0.0%) | 3 (5.4%) |
| 55 to 64 Years | 3 (3.7%) | 0 (0.0%) |
| 65 to 74 Years | 0 (0.0%) | 0 (0.0%) |
| 75 Years and over | 0 (0.0%) | 0 (0.0%) |
| Total | 3 (1.9%) | 6 (4.3%) |
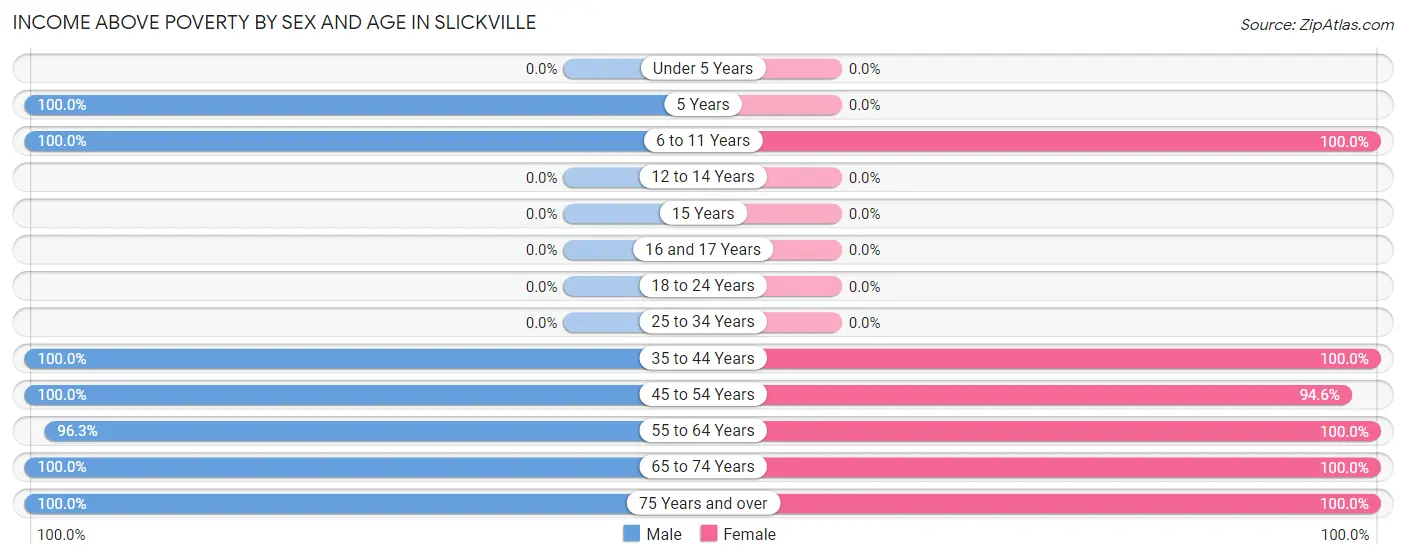
Income Above Poverty by Sex and Age in Slickville
According to the poverty statistics in Slickville, males aged 5 years and females aged 6 to 11 years are the age groups that are most secure financially, with 100.0% of males and 100.0% of females in these age groups living above the poverty line.
| Age Bracket | Male | Female |
| Under 5 Years | 0 (0.0%) | 0 (0.0%) |
| 5 Years | 4 (100.0%) | 0 (0.0%) |
| 6 to 11 Years | 11 (100.0%) | 12 (100.0%) |
| 12 to 14 Years | 0 (0.0%) | 0 (0.0%) |
| 15 Years | 0 (0.0%) | 0 (0.0%) |
| 16 and 17 Years | 0 (0.0%) | 0 (0.0%) |
| 18 to 24 Years | 0 (0.0%) | 0 (0.0%) |
| 25 to 34 Years | 0 (0.0%) | 0 (0.0%) |
| 35 to 44 Years | 15 (100.0%) | 7 (100.0%) |
| 45 to 54 Years | 4 (100.0%) | 53 (94.6%) |
| 55 to 64 Years | 79 (96.3%) | 12 (100.0%) |
| 65 to 74 Years | 4 (100.0%) | 8 (100.0%) |
| 75 Years and over | 36 (100.0%) | 43 (100.0%) |
| Total | 153 (98.1%) | 135 (95.7%) |
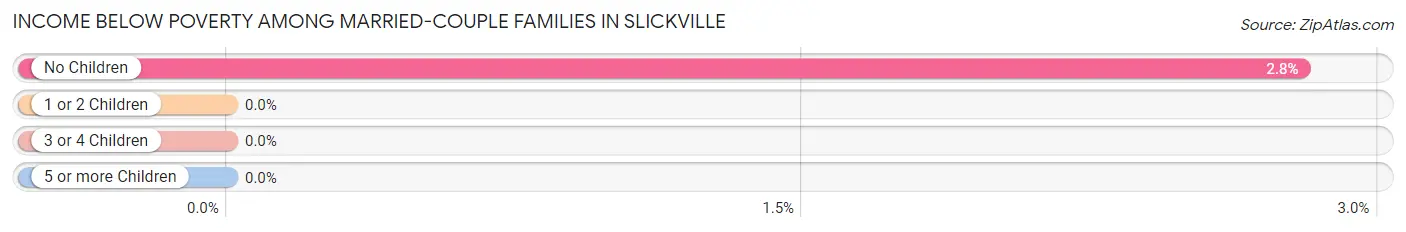
Income Below Poverty Among Married-Couple Families in Slickville
The poverty statistics for married-couple families in Slickville show that 2.7% or 3 of the total 111 families live below the poverty line. Families with no children have the highest poverty rate of 2.8%, comprising of 3 families. On the other hand, families with 3 or 4 children have the lowest poverty rate of 0.0%, which includes 0 families.
| Children | Above Poverty | Below Poverty |
| No Children | 104 (97.2%) | 3 (2.8%) |
| 1 or 2 Children | 0 (0.0%) | 0 (0.0%) |
| 3 or 4 Children | 4 (100.0%) | 0 (0.0%) |
| 5 or more Children | 0 (0.0%) | 0 (0.0%) |
| Total | 108 (97.3%) | 3 (2.7%) |
Income Below Poverty Among Single-Parent Households in Slickville
| Children | Single Father | Single Mother |
| No Children | 0 (0.0%) | 0 (0.0%) |
| 1 or 2 Children | 0 (0.0%) | 0 (0.0%) |
| 3 or 4 Children | 0 (0.0%) | 0 (0.0%) |
| 5 or more Children | 0 (0.0%) | 0 (0.0%) |
| Total | 0 (0.0%) | 0 (0.0%) |
Income Below Poverty Among Married-Couple vs Single-Parent Households in Slickville
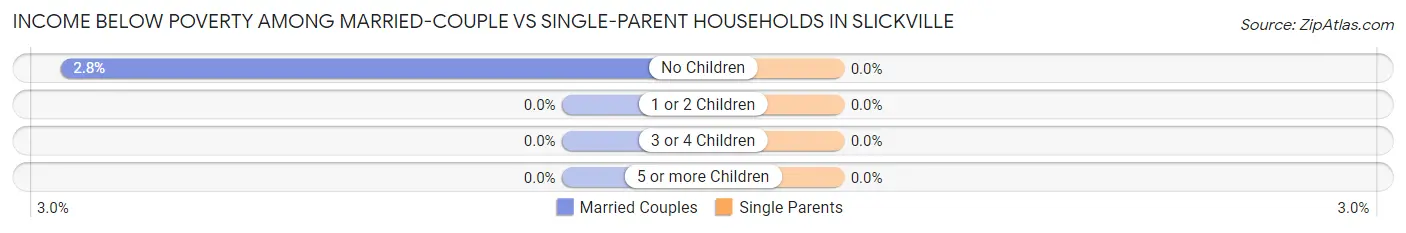
| Children | Married-Couple Families | Single-Parent Households |
| No Children | 3 (2.8%) | 0 (0.0%) |
| 1 or 2 Children | 0 (0.0%) | 0 (0.0%) |
| 3 or 4 Children | 0 (0.0%) | 0 (0.0%) |
| 5 or more Children | 0 (0.0%) | 0 (0.0%) |
| Total | 3 (2.7%) | 0 (0.0%) |
Race in Slickville
The most populous races in Slickville are , and White / Caucasian (297 | 100.0%).
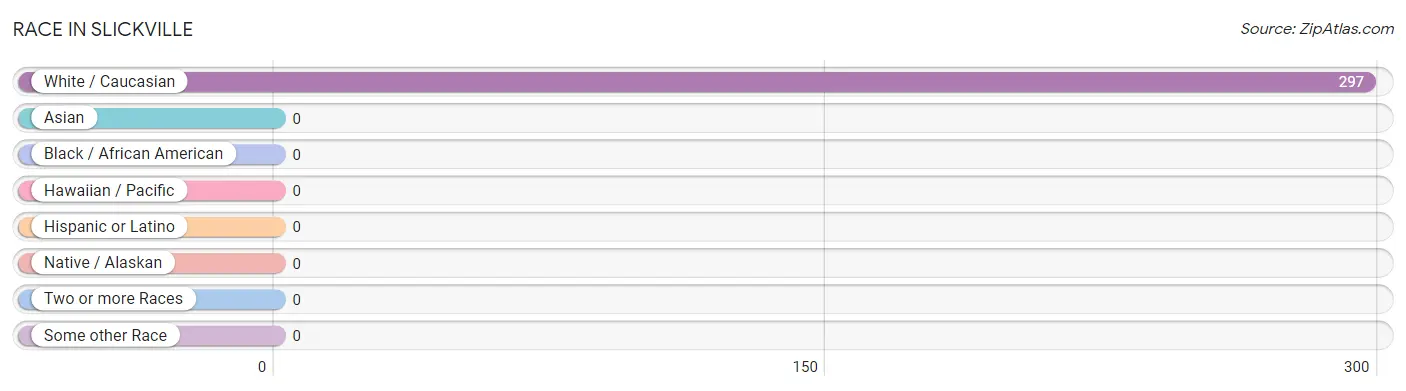
| Race | # Population | % Population |
| Asian | 0 | 0.0% |
| Black / African American | 0 | 0.0% |
| Hawaiian / Pacific | 0 | 0.0% |
| Hispanic or Latino | 0 | 0.0% |
| Native / Alaskan | 0 | 0.0% |
| White / Caucasian | 297 | 100.0% |
| Two or more Races | 0 | 0.0% |
| Some other Race | 0 | 0.0% |
| Total | 297 | 100.0% |
Ancestry in Slickville
The most populous ancestries reported in Slickville are Italian (84 | 28.3%), Irish (60 | 20.2%), Polish (57 | 19.2%), Ukrainian (53 | 17.8%), and English (36 | 12.1%), together accounting for 97.6% of all Slickville residents.
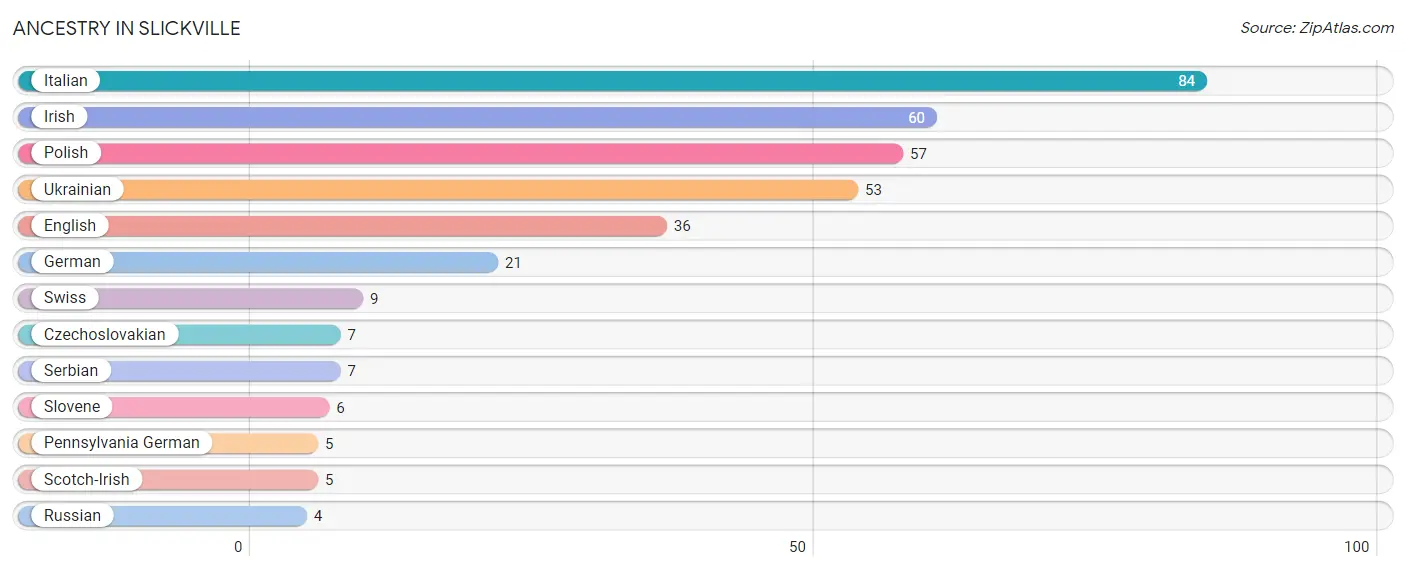
| Ancestry | # Population | % Population |
| Czechoslovakian | 7 | 2.4% |
| English | 36 | 12.1% |
| German | 21 | 7.1% |
| Irish | 60 | 20.2% |
| Italian | 84 | 28.3% |
| Pennsylvania German | 5 | 1.7% |
| Polish | 57 | 19.2% |
| Russian | 4 | 1.3% |
| Scotch-Irish | 5 | 1.7% |
| Serbian | 7 | 2.4% |
| Slovene | 6 | 2.0% |
| Swiss | 9 | 3.0% |
| Ukrainian | 53 | 17.8% | View All 13 Rows |
Immigrants in Slickville

| Immigration Origin | # Population | % Population | View All 0 Rows |
Sex and Age in Slickville
Sex and Age in Slickville
The most populous age groups in Slickville are 55 to 59 Years (73 | 46.8%) for men and 50 to 54 Years (52 | 36.9%) for women.
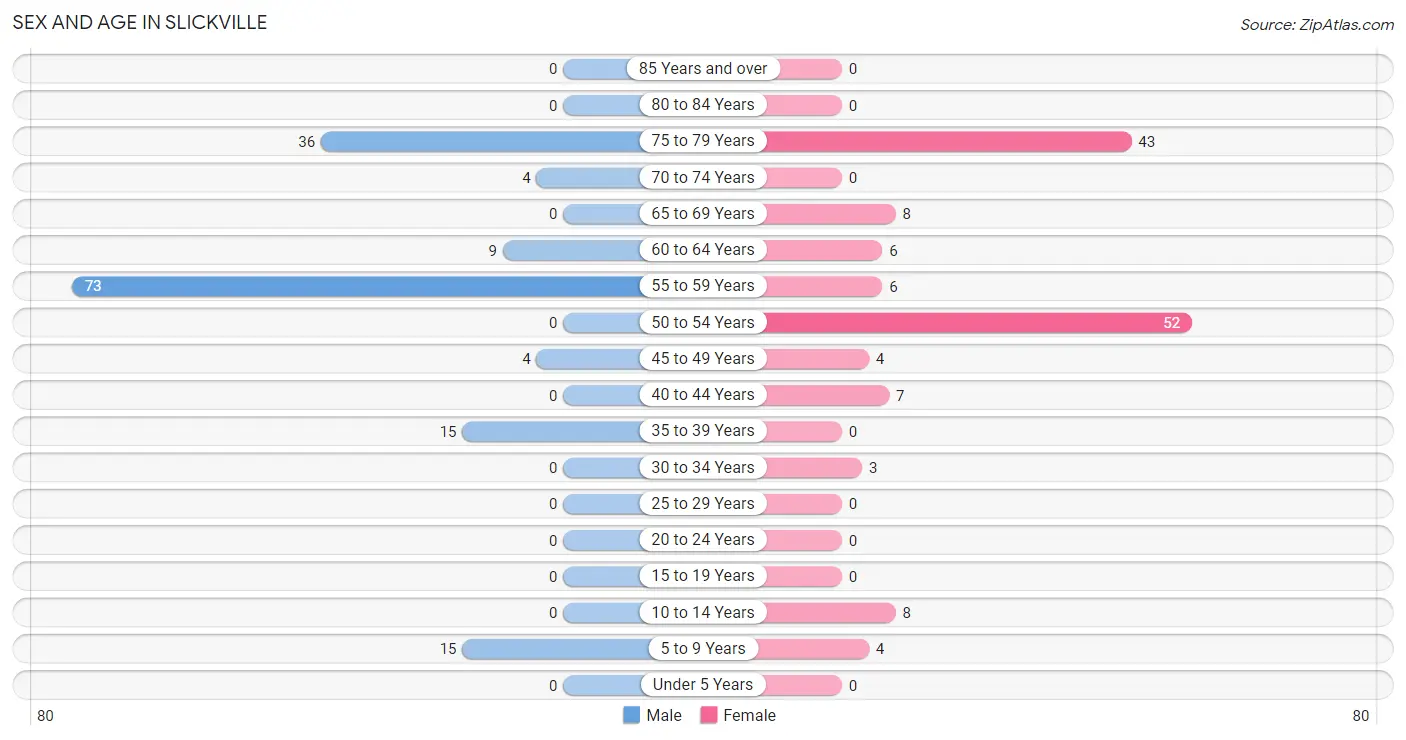
| Age Bracket | Male | Female |
| Under 5 Years | 0 (0.0%) | 0 (0.0%) |
| 5 to 9 Years | 15 (9.6%) | 4 (2.8%) |
| 10 to 14 Years | 0 (0.0%) | 8 (5.7%) |
| 15 to 19 Years | 0 (0.0%) | 0 (0.0%) |
| 20 to 24 Years | 0 (0.0%) | 0 (0.0%) |
| 25 to 29 Years | 0 (0.0%) | 0 (0.0%) |
| 30 to 34 Years | 0 (0.0%) | 3 (2.1%) |
| 35 to 39 Years | 15 (9.6%) | 0 (0.0%) |
| 40 to 44 Years | 0 (0.0%) | 7 (5.0%) |
| 45 to 49 Years | 4 (2.6%) | 4 (2.8%) |
| 50 to 54 Years | 0 (0.0%) | 52 (36.9%) |
| 55 to 59 Years | 73 (46.8%) | 6 (4.3%) |
| 60 to 64 Years | 9 (5.8%) | 6 (4.3%) |
| 65 to 69 Years | 0 (0.0%) | 8 (5.7%) |
| 70 to 74 Years | 4 (2.6%) | 0 (0.0%) |
| 75 to 79 Years | 36 (23.1%) | 43 (30.5%) |
| 80 to 84 Years | 0 (0.0%) | 0 (0.0%) |
| 85 Years and over | 0 (0.0%) | 0 (0.0%) |
| Total | 156 (100.0%) | 141 (100.0%) |
Families and Households in Slickville
Median Family Size in Slickville
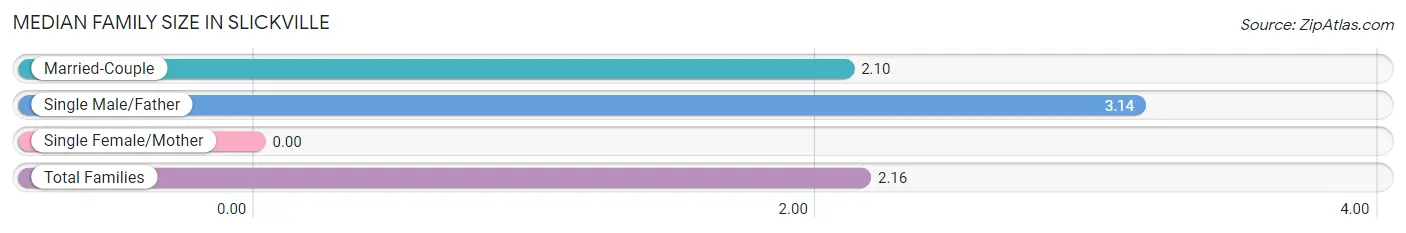
| Family Type | # Families | Family Size |
| Married-Couple | 111 (94.1%) | 2.10 |
| Single Male/Father | 7 (5.9%) | 3.14 |
| Single Female/Mother | 0 (0.0%) | - |
| Total Families | 118 (100.0%) | 2.16 |
Median Household Size in Slickville
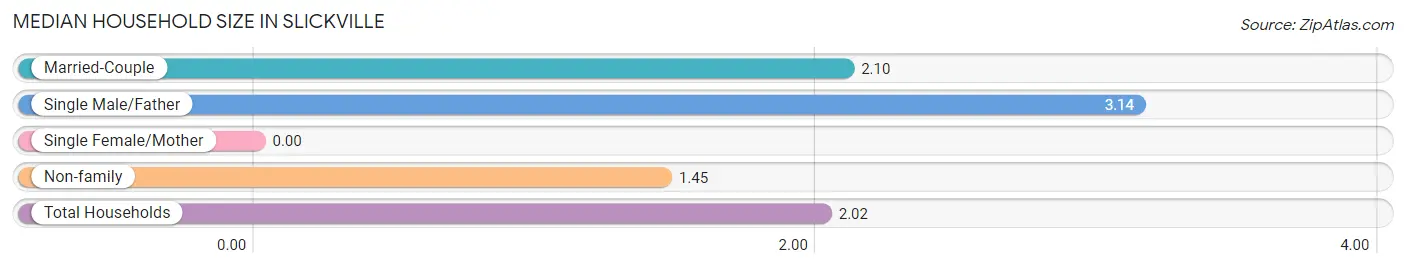
| Household Type | # Households | Household Size |
| Married-Couple | 111 (75.5%) | 2.10 |
| Single Male/Father | 7 (4.8%) | 3.14 |
| Single Female/Mother | 0 (0.0%) | - |
| Non-family | 29 (19.7%) | 1.45 |
| Total Households | 147 (100.0%) | 2.02 |
Household Size by Marriage Status in Slickville
Out of a total of 147 households in Slickville, 118 (80.3%) are family households, while 29 (19.7%) are nonfamily households. The most numerous type of family households are 2-person households, comprising 104, and the most common type of nonfamily households are 1-person households, comprising 17.
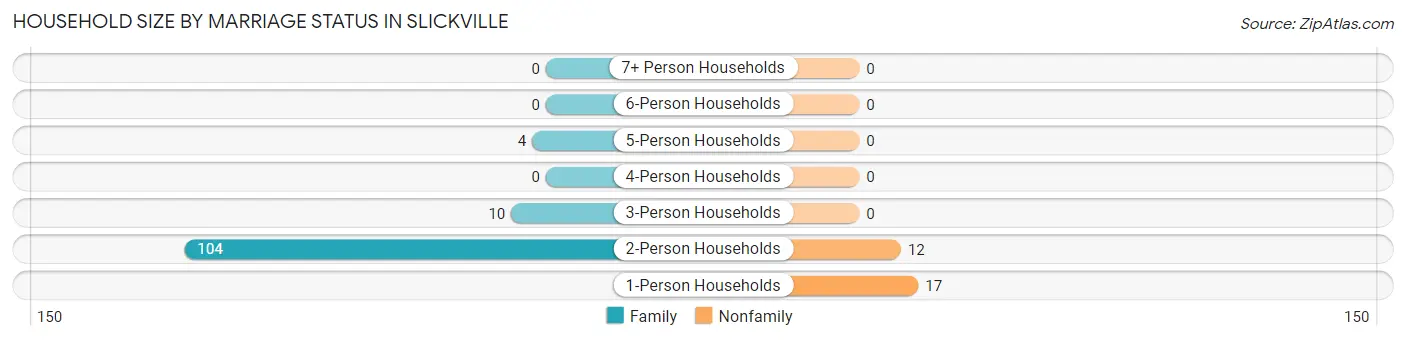
| Household Size | Family Households | Nonfamily Households |
| 1-Person Households | - | 17 (11.6%) |
| 2-Person Households | 104 (70.8%) | 12 (8.2%) |
| 3-Person Households | 10 (6.8%) | 0 (0.0%) |
| 4-Person Households | 0 (0.0%) | 0 (0.0%) |
| 5-Person Households | 4 (2.7%) | 0 (0.0%) |
| 6-Person Households | 0 (0.0%) | 0 (0.0%) |
| 7+ Person Households | 0 (0.0%) | 0 (0.0%) |
| Total | 118 (80.3%) | 29 (19.7%) |
Female Fertility in Slickville
Fertility by Age in Slickville
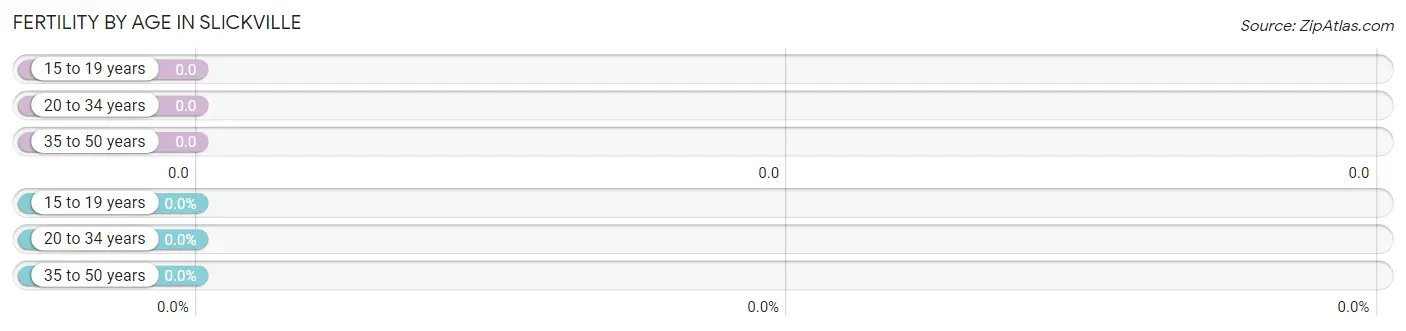
| Age Bracket | Women with Births | Births / 1,000 Women |
| 15 to 19 years | 0 (0.0%) | 0.0 |
| 20 to 34 years | 0 (0.0%) | 0.0 |
| 35 to 50 years | 0 (0.0%) | 0.0 |
| Total | 0 (0.0%) | 0.0 |
Fertility by Age by Marriage Status in Slickville
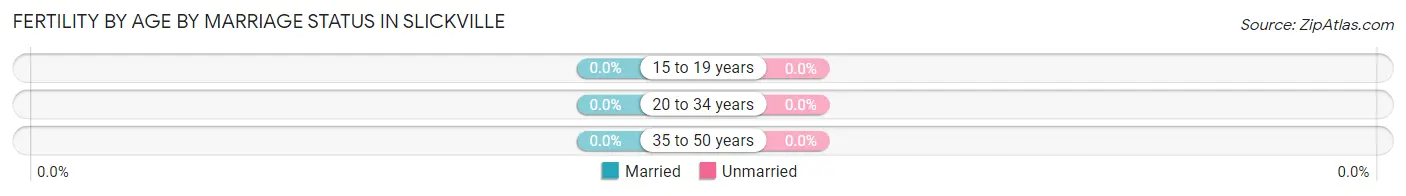
| Age Bracket | Married | Unmarried |
| 15 to 19 years | 0 (0.0%) | 0 (0.0%) |
| 20 to 34 years | 0 (0.0%) | 0 (0.0%) |
| 35 to 50 years | 0 (0.0%) | 0 (0.0%) |
| Total | 0 (0.0%) | 0 (0.0%) |
Fertility by Education in Slickville
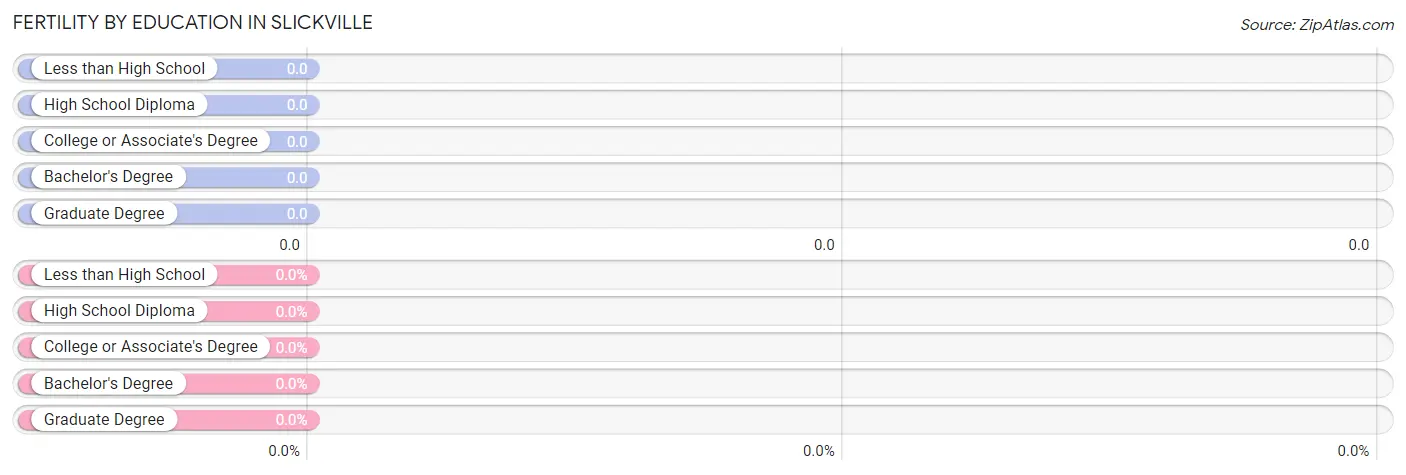
| Educational Attainment | Women with Births | Births / 1,000 Women |
| Less than High School | 0 (0.0%) | 0.0 |
| High School Diploma | 0 (0.0%) | 0.0 |
| College or Associate's Degree | 0 (0.0%) | 0.0 |
| Bachelor's Degree | 0 (0.0%) | 0.0 |
| Graduate Degree | 0 (0.0%) | 0.0 |
| Total | 0 (0.0%) | 0.0 |
Fertility by Education by Marriage Status in Slickville
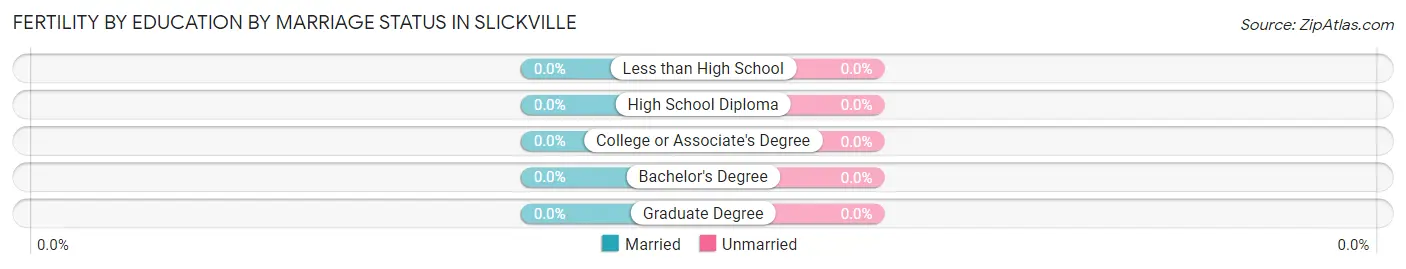
| Educational Attainment | Married | Unmarried |
| Less than High School | 0 (0.0%) | 0 (0.0%) |
| High School Diploma | 0 (0.0%) | 0 (0.0%) |
| College or Associate's Degree | 0 (0.0%) | 0 (0.0%) |
| Bachelor's Degree | 0 (0.0%) | 0 (0.0%) |
| Graduate Degree | 0 (0.0%) | 0 (0.0%) |
| Total | 0 (0.0%) | 0 (0.0%) |
Employment Characteristics in Slickville
Employment by Class of Employer in Slickville
Among the 100 employed individuals in Slickville, private company employees (94 | 94.0%), and not-for-profit organizations (6 | 6.0%) make up the most common classes of employment.
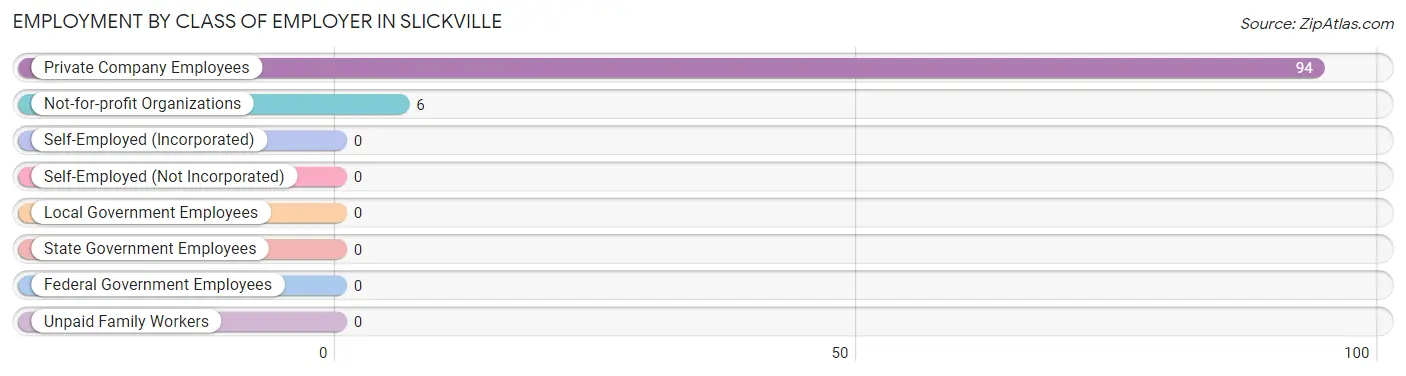
| Employer Class | # Employees | % Employees |
| Private Company Employees | 94 | 94.0% |
| Self-Employed (Incorporated) | 0 | 0.0% |
| Self-Employed (Not Incorporated) | 0 | 0.0% |
| Not-for-profit Organizations | 6 | 6.0% |
| Local Government Employees | 0 | 0.0% |
| State Government Employees | 0 | 0.0% |
| Federal Government Employees | 0 | 0.0% |
| Unpaid Family Workers | 0 | 0.0% |
| Total | 100 | 100.0% |
Employment Status by Age in Slickville
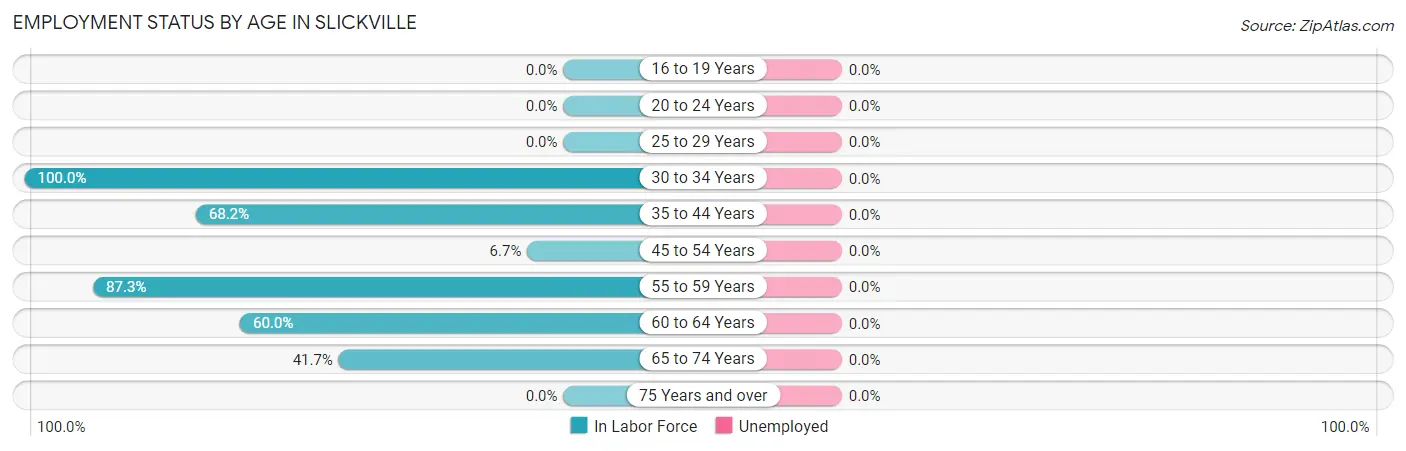
| Age Bracket | In Labor Force | Unemployed |
| 16 to 19 Years | 0 (0.0%) | 0 (0.0%) |
| 20 to 24 Years | 0 (0.0%) | 0 (0.0%) |
| 25 to 29 Years | 0 (0.0%) | 0 (0.0%) |
| 30 to 34 Years | 3 (100.0%) | 0 (0.0%) |
| 35 to 44 Years | 15 (68.2%) | 0 (0.0%) |
| 45 to 54 Years | 4 (6.7%) | 0 (0.0%) |
| 55 to 59 Years | 69 (87.3%) | 0 (0.0%) |
| 60 to 64 Years | 9 (60.0%) | 0 (0.0%) |
| 65 to 74 Years | 5 (41.7%) | 0 (0.0%) |
| 75 Years and over | 0 (0.0%) | 0 (0.0%) |
| Total | 105 (38.9%) | 0 (0.0%) |
Employment Status by Educational Attainment in Slickville
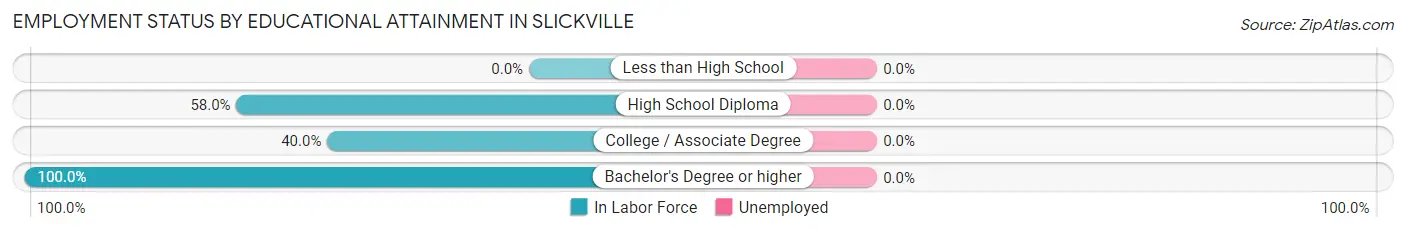
| Educational Attainment | In Labor Force | Unemployed |
| Less than High School | 0 (0.0%) | 0 (0.0%) |
| High School Diploma | 80 (58.0%) | 0 (0.0%) |
| College / Associate Degree | 14 (40.0%) | 0 (0.0%) |
| Bachelor's Degree or higher | 6 (100.0%) | 0 (0.0%) |
| Total | 100 (55.9%) | 0 (0.0%) |
Employment Occupations by Sex in Slickville
Management, Business, Science and Arts Occupations
The most common Management, Business, Science and Arts occupations in Slickville are Management (6 | 5.7%), Health Diagnosing & Treating (6 | 5.7%), and Health Technologists (6 | 5.7%).
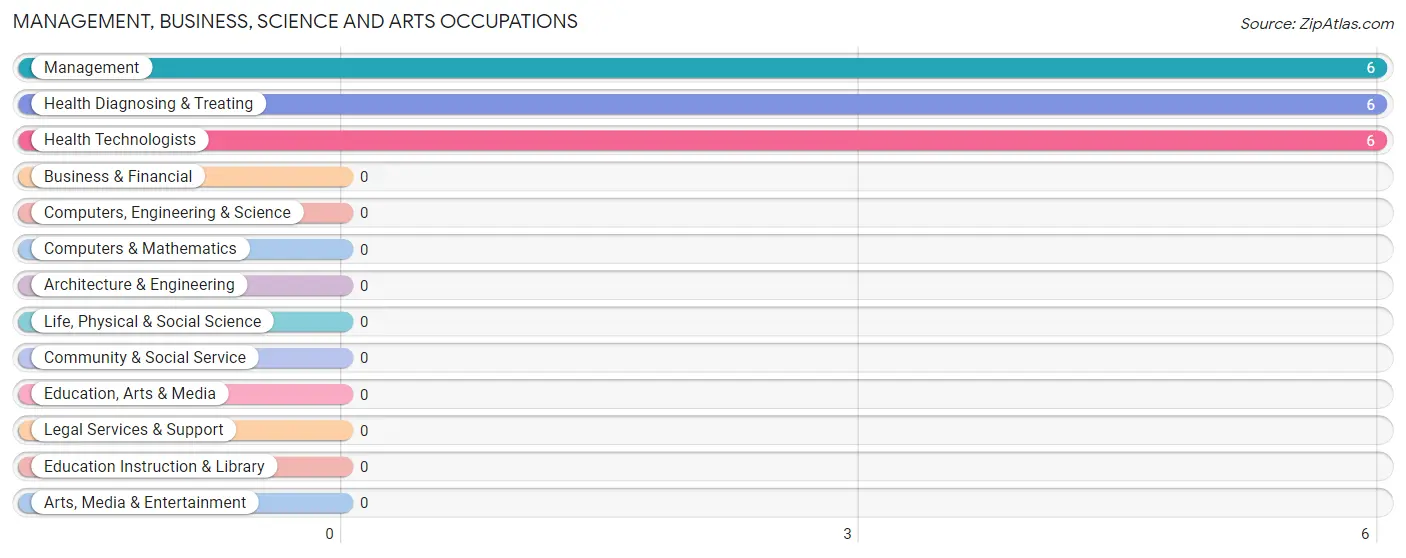
Management, Business, Science and Arts Occupations by Sex
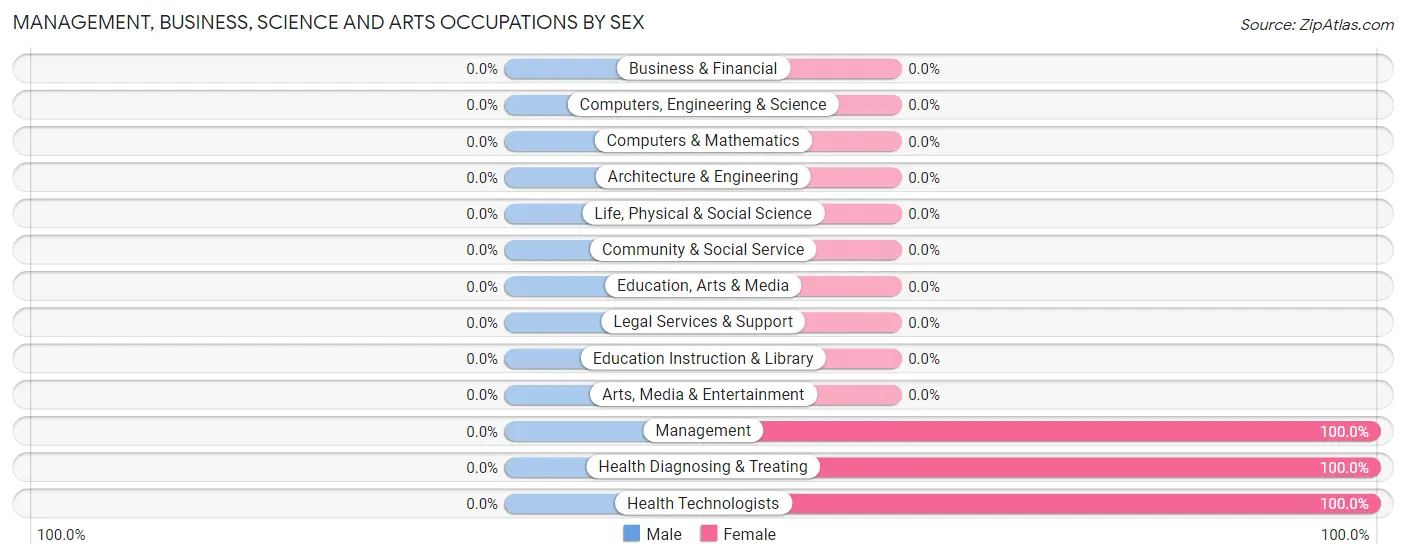
| Occupation | Male | Female |
| Management | 0 (0.0%) | 6 (100.0%) |
| Business & Financial | 0 (0.0%) | 0 (0.0%) |
| Computers, Engineering & Science | 0 (0.0%) | 0 (0.0%) |
| Computers & Mathematics | 0 (0.0%) | 0 (0.0%) |
| Architecture & Engineering | 0 (0.0%) | 0 (0.0%) |
| Life, Physical & Social Science | 0 (0.0%) | 0 (0.0%) |
| Community & Social Service | 0 (0.0%) | 0 (0.0%) |
| Education, Arts & Media | 0 (0.0%) | 0 (0.0%) |
| Legal Services & Support | 0 (0.0%) | 0 (0.0%) |
| Education Instruction & Library | 0 (0.0%) | 0 (0.0%) |
| Arts, Media & Entertainment | 0 (0.0%) | 0 (0.0%) |
| Health Diagnosing & Treating | 0 (0.0%) | 6 (100.0%) |
| Health Technologists | 0 (0.0%) | 6 (100.0%) |
| Total (Category) | 0 (0.0%) | 12 (100.0%) |
| Total (Overall) | 85 (80.9%) | 20 (19.1%) |
Services Occupations
The most common Services occupations in Slickville are , and Healthcare Support (3 | 2.9%).
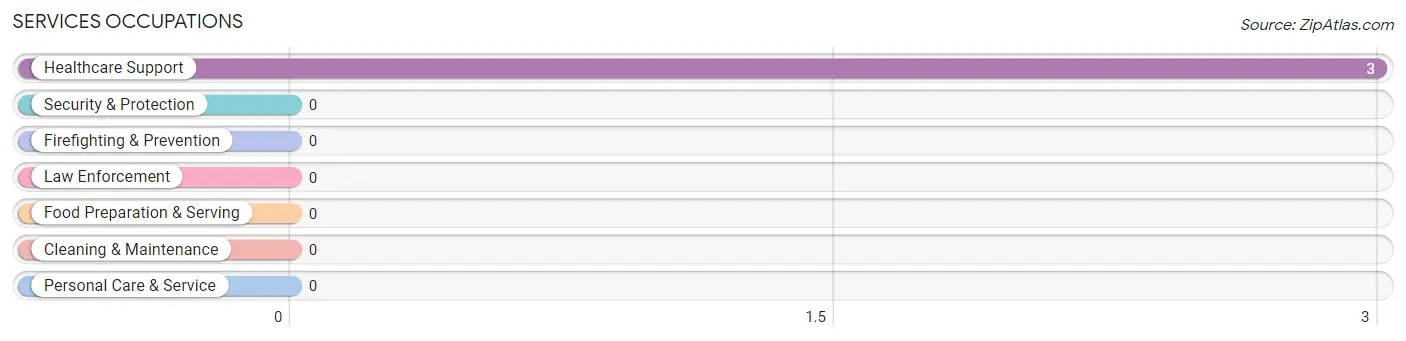
Services Occupations by Sex
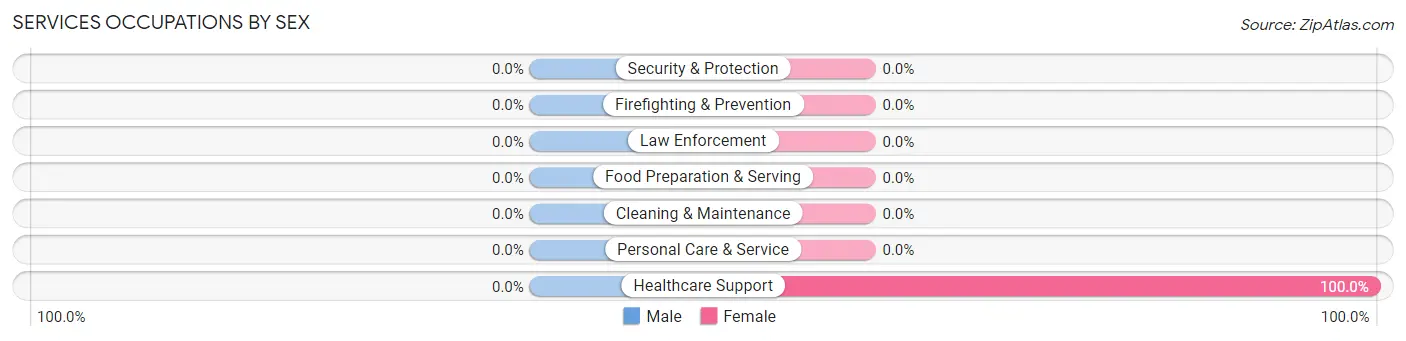
| Occupation | Male | Female |
| Healthcare Support | 0 (0.0%) | 3 (100.0%) |
| Security & Protection | 0 (0.0%) | 0 (0.0%) |
| Firefighting & Prevention | 0 (0.0%) | 0 (0.0%) |
| Law Enforcement | 0 (0.0%) | 0 (0.0%) |
| Food Preparation & Serving | 0 (0.0%) | 0 (0.0%) |
| Cleaning & Maintenance | 0 (0.0%) | 0 (0.0%) |
| Personal Care & Service | 0 (0.0%) | 0 (0.0%) |
| Total (Category) | 0 (0.0%) | 3 (100.0%) |
| Total (Overall) | 85 (80.9%) | 20 (19.1%) |
Sales and Office Occupations
The most common Sales and Office occupations in Slickville are Sales & Related (8 | 7.6%), and Office & Administration (5 | 4.8%).
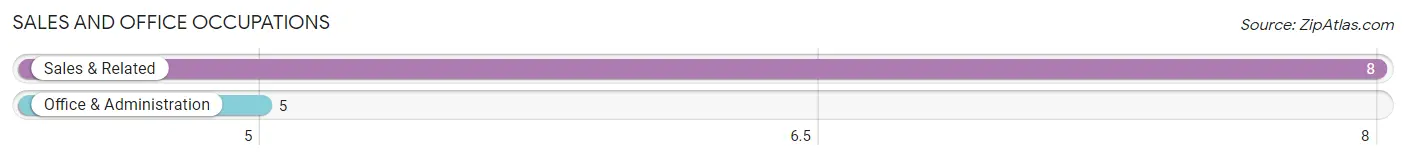
Sales and Office Occupations by Sex
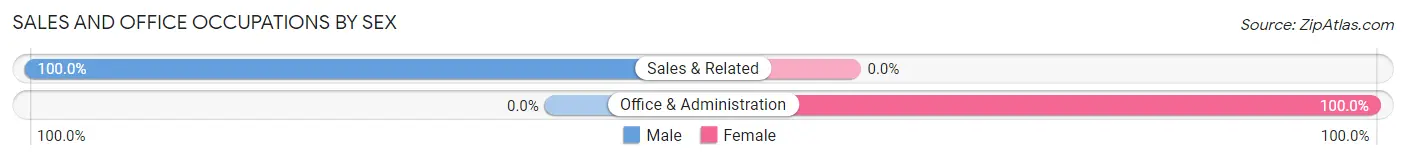
| Occupation | Male | Female |
| Sales & Related | 8 (100.0%) | 0 (0.0%) |
| Office & Administration | 0 (0.0%) | 5 (100.0%) |
| Total (Category) | 8 (61.5%) | 5 (38.5%) |
| Total (Overall) | 85 (80.9%) | 20 (19.1%) |
Natural Resources, Construction and Maintenance Occupations
The most common Natural Resources, Construction and Maintenance occupations in Slickville are , and Installation, Maintenance & Repair (11 | 10.5%).
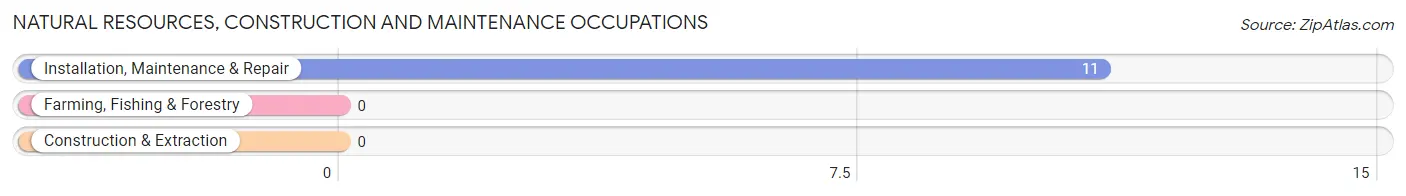
Natural Resources, Construction and Maintenance Occupations by Sex
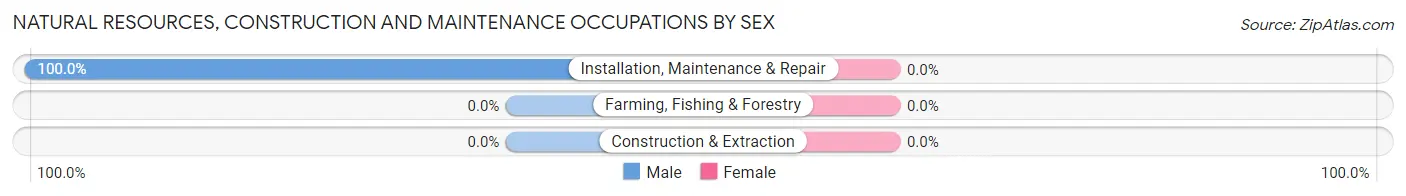
| Occupation | Male | Female |
| Farming, Fishing & Forestry | 0 (0.0%) | 0 (0.0%) |
| Construction & Extraction | 0 (0.0%) | 0 (0.0%) |
| Installation, Maintenance & Repair | 11 (100.0%) | 0 (0.0%) |
| Total (Category) | 11 (100.0%) | 0 (0.0%) |
| Total (Overall) | 85 (80.9%) | 20 (19.1%) |
Production, Transportation and Moving Occupations
The most common Production, Transportation and Moving occupations in Slickville are Production (63 | 60.0%), and Transportation (3 | 2.9%).
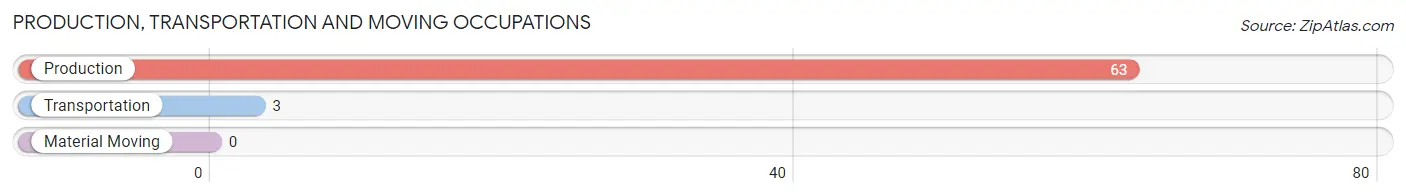
Production, Transportation and Moving Occupations by Sex
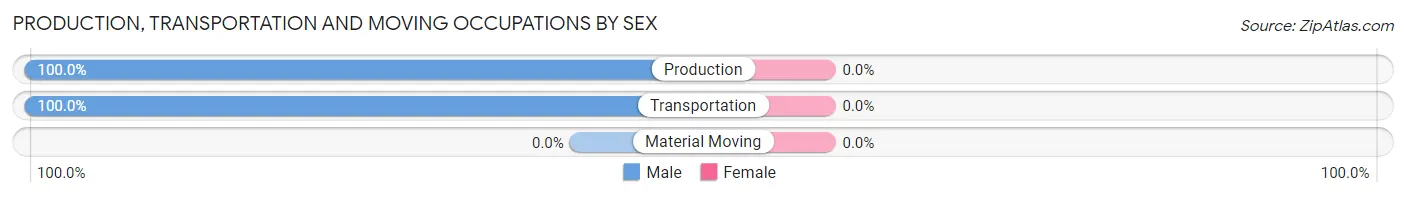
| Occupation | Male | Female |
| Production | 63 (100.0%) | 0 (0.0%) |
| Transportation | 3 (100.0%) | 0 (0.0%) |
| Material Moving | 0 (0.0%) | 0 (0.0%) |
| Total (Category) | 66 (100.0%) | 0 (0.0%) |
| Total (Overall) | 85 (80.9%) | 20 (19.1%) |
Employment Industries by Sex in Slickville
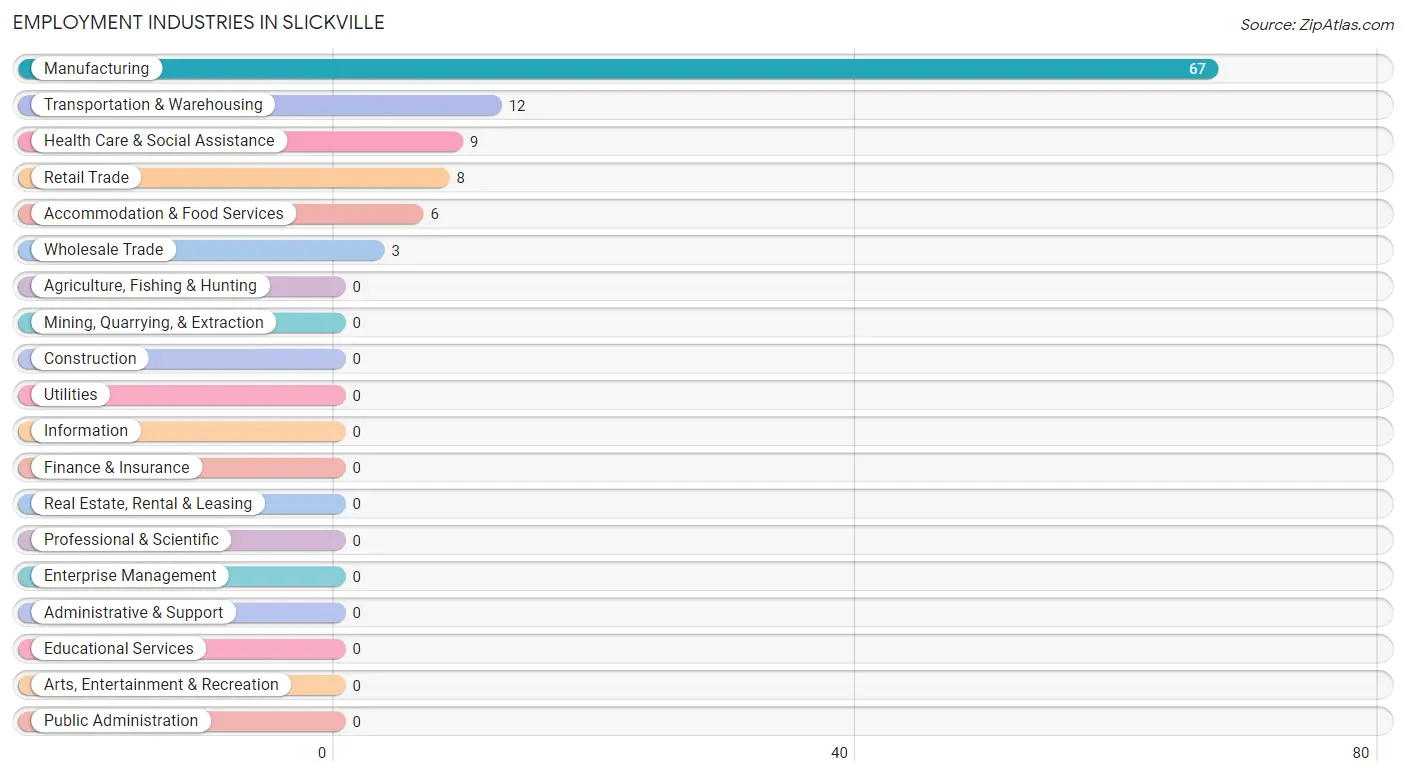
Employment Industries in Slickville
The major employment industries in Slickville include Manufacturing (67 | 63.8%), Transportation & Warehousing (12 | 11.4%), Health Care & Social Assistance (9 | 8.6%), Retail Trade (8 | 7.6%), and Accommodation & Food Services (6 | 5.7%).
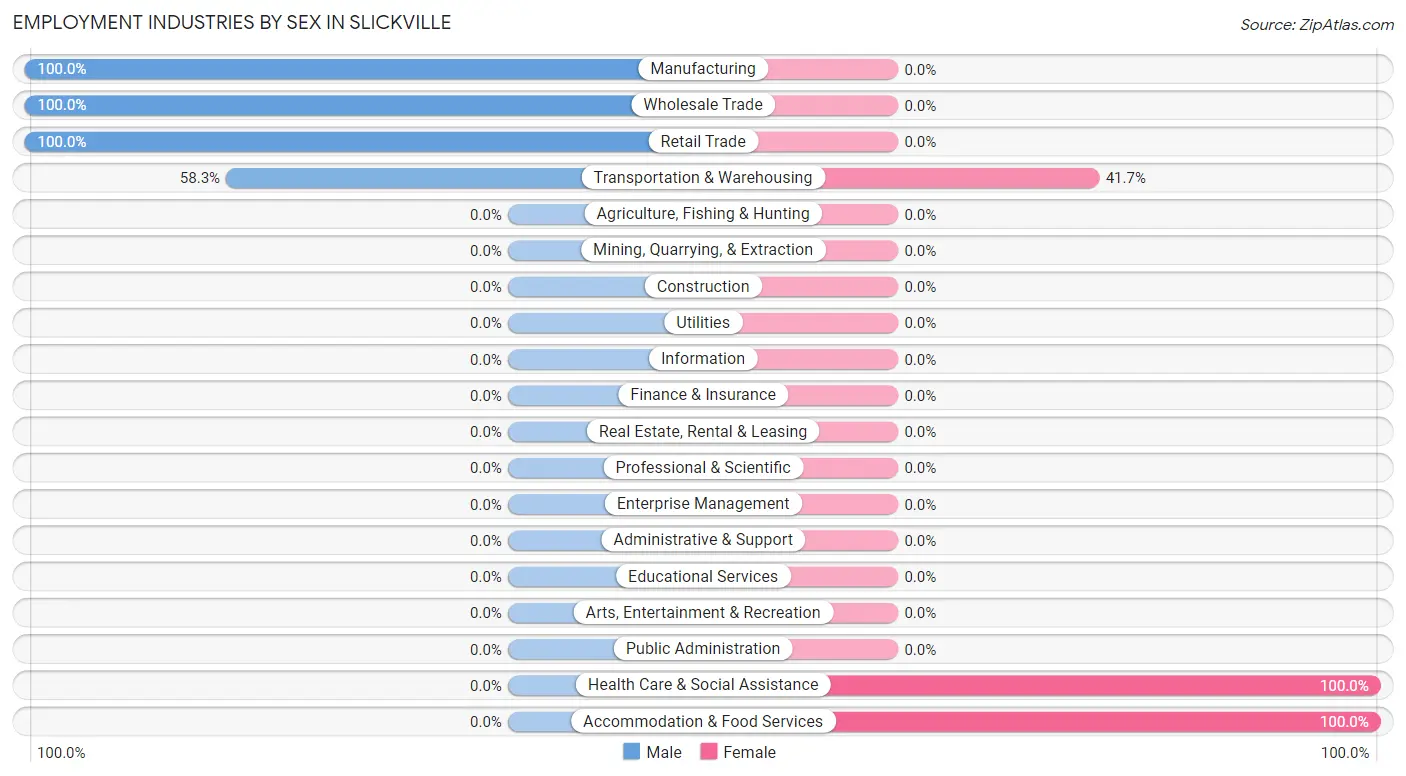
Employment Industries by Sex in Slickville
The Slickville industries that see more men than women are Manufacturing (100.0%), Wholesale Trade (100.0%), and Retail Trade (100.0%), whereas the industries that tend to have a higher number of women are Health Care & Social Assistance (100.0%), Accommodation & Food Services (100.0%), and Transportation & Warehousing (41.7%).
| Industry | Male | Female |
| Agriculture, Fishing & Hunting | 0 (0.0%) | 0 (0.0%) |
| Mining, Quarrying, & Extraction | 0 (0.0%) | 0 (0.0%) |
| Construction | 0 (0.0%) | 0 (0.0%) |
| Manufacturing | 67 (100.0%) | 0 (0.0%) |
| Wholesale Trade | 3 (100.0%) | 0 (0.0%) |
| Retail Trade | 8 (100.0%) | 0 (0.0%) |
| Transportation & Warehousing | 7 (58.3%) | 5 (41.7%) |
| Utilities | 0 (0.0%) | 0 (0.0%) |
| Information | 0 (0.0%) | 0 (0.0%) |
| Finance & Insurance | 0 (0.0%) | 0 (0.0%) |
| Real Estate, Rental & Leasing | 0 (0.0%) | 0 (0.0%) |
| Professional & Scientific | 0 (0.0%) | 0 (0.0%) |
| Enterprise Management | 0 (0.0%) | 0 (0.0%) |
| Administrative & Support | 0 (0.0%) | 0 (0.0%) |
| Educational Services | 0 (0.0%) | 0 (0.0%) |
| Health Care & Social Assistance | 0 (0.0%) | 9 (100.0%) |
| Arts, Entertainment & Recreation | 0 (0.0%) | 0 (0.0%) |
| Accommodation & Food Services | 0 (0.0%) | 6 (100.0%) |
| Public Administration | 0 (0.0%) | 0 (0.0%) |
| Total | 85 (80.9%) | 20 (19.1%) |
Education in Slickville
School Enrollment in Slickville
The most common levels of schooling among the 27 students in Slickville are elementary school (23 | 85.2%), and kindergarten (4 | 14.8%).
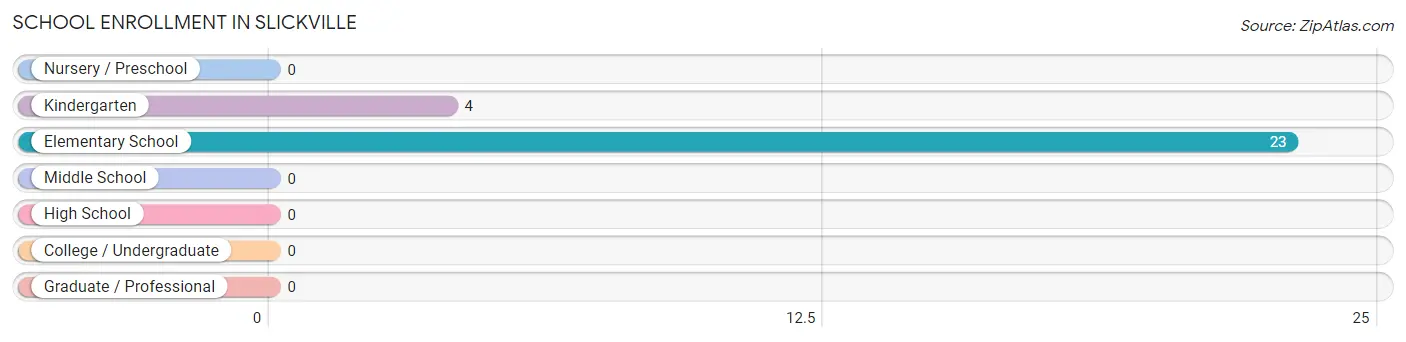
| School Level | # Students | % Students |
| Nursery / Preschool | 0 | 0.0% |
| Kindergarten | 4 | 14.8% |
| Elementary School | 23 | 85.2% |
| Middle School | 0 | 0.0% |
| High School | 0 | 0.0% |
| College / Undergraduate | 0 | 0.0% |
| Graduate / Professional | 0 | 0.0% |
| Total | 27 | 100.0% |
School Enrollment by Age by Funding Source in Slickville
Out of a total of 27 students who are enrolled in schools in Slickville, 12 (44.4%) attend a private institution, while the remaining 15 (55.6%) are enrolled in public schools. The age group of 5 to 9 year old has the highest likelihood of being enrolled in private schools, with 12 (63.2% in the age bracket) enrolled. Conversely, the age group of 10 to 14 year olds has the lowest likelihood of being enrolled in a private school, with 8 (100.0% in the age bracket) attending a public institution.
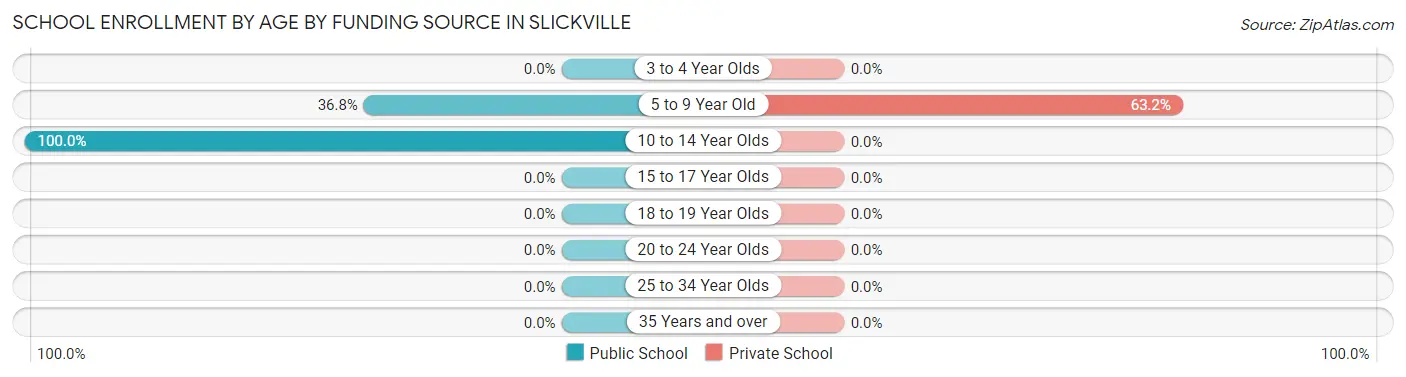
| Age Bracket | Public School | Private School |
| 3 to 4 Year Olds | 0 (0.0%) | 0 (0.0%) |
| 5 to 9 Year Old | 7 (36.8%) | 12 (63.2%) |
| 10 to 14 Year Olds | 8 (100.0%) | 0 (0.0%) |
| 15 to 17 Year Olds | 0 (0.0%) | 0 (0.0%) |
| 18 to 19 Year Olds | 0 (0.0%) | 0 (0.0%) |
| 20 to 24 Year Olds | 0 (0.0%) | 0 (0.0%) |
| 25 to 34 Year Olds | 0 (0.0%) | 0 (0.0%) |
| 35 Years and over | 0 (0.0%) | 0 (0.0%) |
| Total | 15 (55.6%) | 12 (44.4%) |
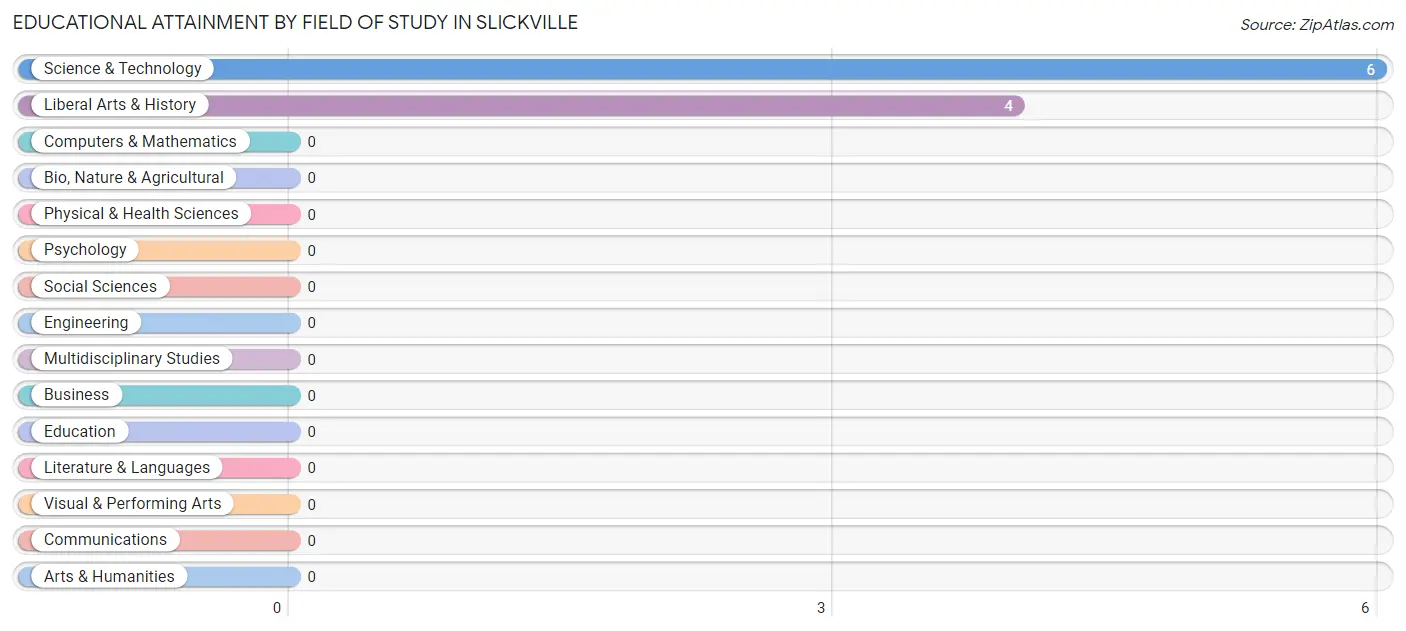
Educational Attainment by Field of Study in Slickville
Science & technology (6 | 60.0%), and liberal arts & history (4 | 40.0%) are the most common fields of study among 10 individuals in Slickville who have obtained a bachelor's degree or higher.
| Field of Study | # Graduates | % Graduates |
| Computers & Mathematics | 0 | 0.0% |
| Bio, Nature & Agricultural | 0 | 0.0% |
| Physical & Health Sciences | 0 | 0.0% |
| Psychology | 0 | 0.0% |
| Social Sciences | 0 | 0.0% |
| Engineering | 0 | 0.0% |
| Multidisciplinary Studies | 0 | 0.0% |
| Science & Technology | 6 | 60.0% |
| Business | 0 | 0.0% |
| Education | 0 | 0.0% |
| Literature & Languages | 0 | 0.0% |
| Liberal Arts & History | 4 | 40.0% |
| Visual & Performing Arts | 0 | 0.0% |
| Communications | 0 | 0.0% |
| Arts & Humanities | 0 | 0.0% |
| Total | 10 | 100.0% |
Transportation & Commute in Slickville
Vehicle Availability by Sex in Slickville
The most prevalent vehicle ownership categories in Slickville are males with 2 vehicles (68, accounting for 80.0%) and females with 2 vehicles (0, making up 453.3%).
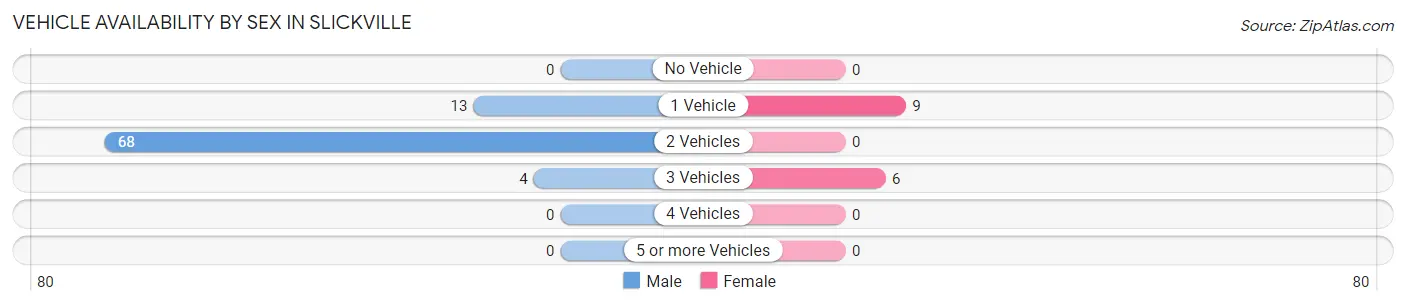
| Vehicles Available | Male | Female |
| No Vehicle | 0 (0.0%) | 0 (0.0%) |
| 1 Vehicle | 13 (15.3%) | 9 (60.0%) |
| 2 Vehicles | 68 (80.0%) | 0 (0.0%) |
| 3 Vehicles | 4 (4.7%) | 6 (40.0%) |
| 4 Vehicles | 0 (0.0%) | 0 (0.0%) |
| 5 or more Vehicles | 0 (0.0%) | 0 (0.0%) |
| Total | 85 (100.0%) | 15 (100.0%) |
Commute Time in Slickville
The most frequently occuring commute durations in Slickville are 25 to 29 minutes (57 commuters, 57.0%), 15 to 19 minutes (20 commuters, 20.0%), and 90 or more minutes (8 commuters, 8.0%).
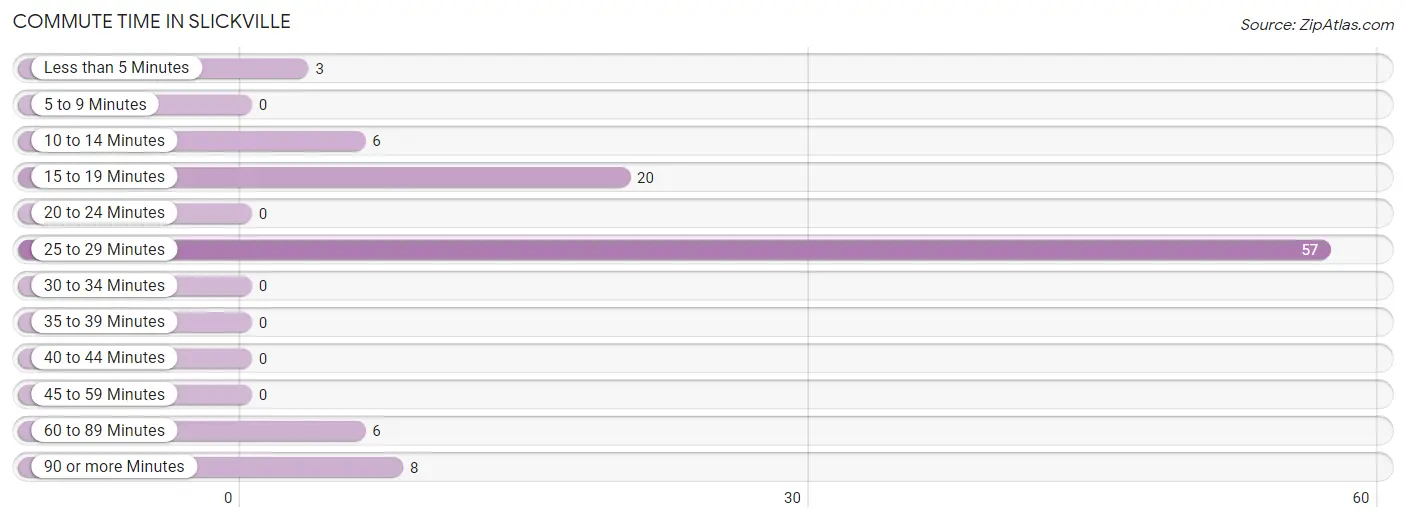
| Commute Time | # Commuters | % Commuters |
| Less than 5 Minutes | 3 | 3.0% |
| 5 to 9 Minutes | 0 | 0.0% |
| 10 to 14 Minutes | 6 | 6.0% |
| 15 to 19 Minutes | 20 | 20.0% |
| 20 to 24 Minutes | 0 | 0.0% |
| 25 to 29 Minutes | 57 | 57.0% |
| 30 to 34 Minutes | 0 | 0.0% |
| 35 to 39 Minutes | 0 | 0.0% |
| 40 to 44 Minutes | 0 | 0.0% |
| 45 to 59 Minutes | 0 | 0.0% |
| 60 to 89 Minutes | 6 | 6.0% |
| 90 or more Minutes | 8 | 8.0% |
Commute Time by Sex in Slickville
The most common commute times in Slickville are 25 to 29 minutes (57 commuters, 67.1%) for males and 10 to 14 minutes (6 commuters, 40.0%) for females.
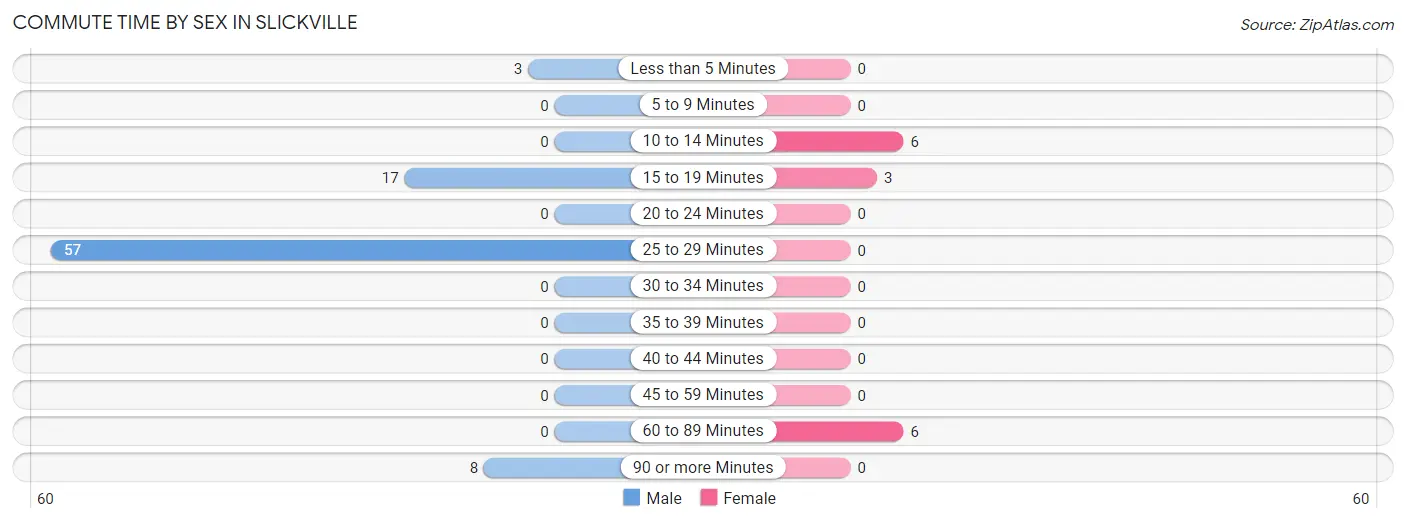
| Commute Time | Male | Female |
| Less than 5 Minutes | 3 (3.5%) | 0 (0.0%) |
| 5 to 9 Minutes | 0 (0.0%) | 0 (0.0%) |
| 10 to 14 Minutes | 0 (0.0%) | 6 (40.0%) |
| 15 to 19 Minutes | 17 (20.0%) | 3 (20.0%) |
| 20 to 24 Minutes | 0 (0.0%) | 0 (0.0%) |
| 25 to 29 Minutes | 57 (67.1%) | 0 (0.0%) |
| 30 to 34 Minutes | 0 (0.0%) | 0 (0.0%) |
| 35 to 39 Minutes | 0 (0.0%) | 0 (0.0%) |
| 40 to 44 Minutes | 0 (0.0%) | 0 (0.0%) |
| 45 to 59 Minutes | 0 (0.0%) | 0 (0.0%) |
| 60 to 89 Minutes | 0 (0.0%) | 6 (40.0%) |
| 90 or more Minutes | 8 (9.4%) | 0 (0.0%) |
Time of Departure to Work by Sex in Slickville
The most frequent times of departure to work in Slickville are 8:00 AM to 8:29 AM (56, 65.9%) for males and 7:00 AM to 7:29 AM (6, 40.0%) for females.
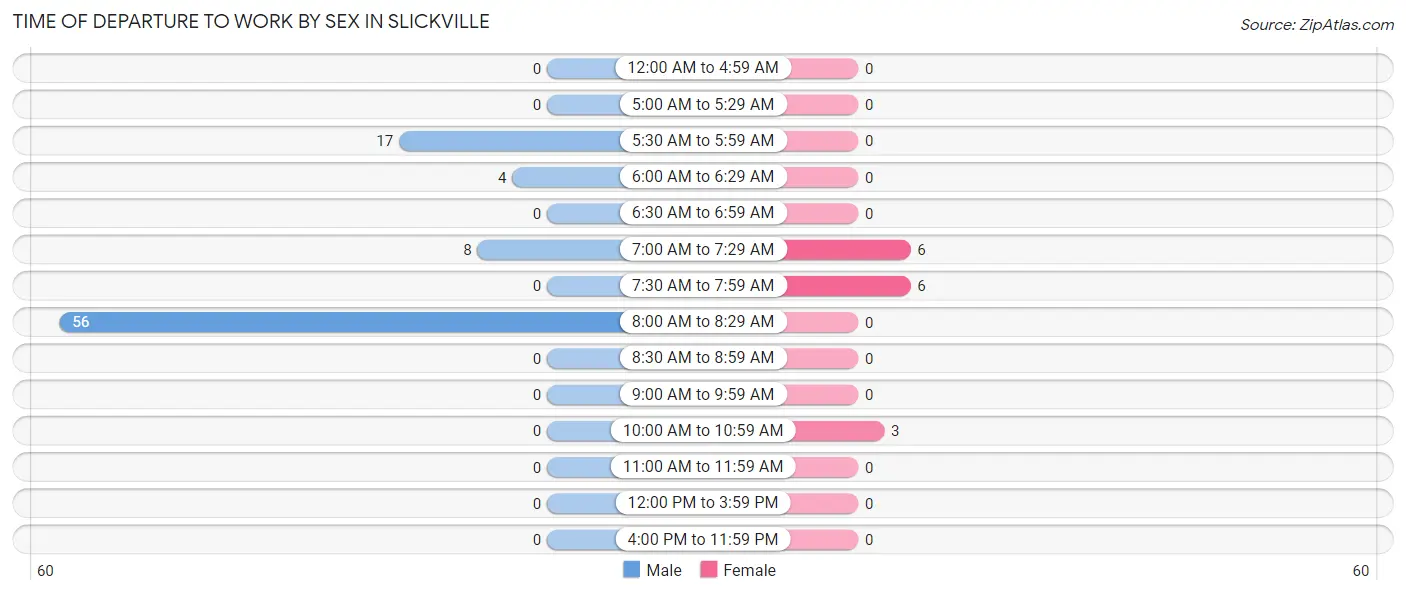
| Time of Departure | Male | Female |
| 12:00 AM to 4:59 AM | 0 (0.0%) | 0 (0.0%) |
| 5:00 AM to 5:29 AM | 0 (0.0%) | 0 (0.0%) |
| 5:30 AM to 5:59 AM | 17 (20.0%) | 0 (0.0%) |
| 6:00 AM to 6:29 AM | 4 (4.7%) | 0 (0.0%) |
| 6:30 AM to 6:59 AM | 0 (0.0%) | 0 (0.0%) |
| 7:00 AM to 7:29 AM | 8 (9.4%) | 6 (40.0%) |
| 7:30 AM to 7:59 AM | 0 (0.0%) | 6 (40.0%) |
| 8:00 AM to 8:29 AM | 56 (65.9%) | 0 (0.0%) |
| 8:30 AM to 8:59 AM | 0 (0.0%) | 0 (0.0%) |
| 9:00 AM to 9:59 AM | 0 (0.0%) | 0 (0.0%) |
| 10:00 AM to 10:59 AM | 0 (0.0%) | 3 (20.0%) |
| 11:00 AM to 11:59 AM | 0 (0.0%) | 0 (0.0%) |
| 12:00 PM to 3:59 PM | 0 (0.0%) | 0 (0.0%) |
| 4:00 PM to 11:59 PM | 0 (0.0%) | 0 (0.0%) |
| Total | 85 (100.0%) | 15 (100.0%) |
Housing Occupancy in Slickville
Occupancy by Ownership in Slickville
Of the total 147 dwellings in Slickville, owner-occupied units account for 140 (95.2%), while renter-occupied units make up 7 (4.8%).
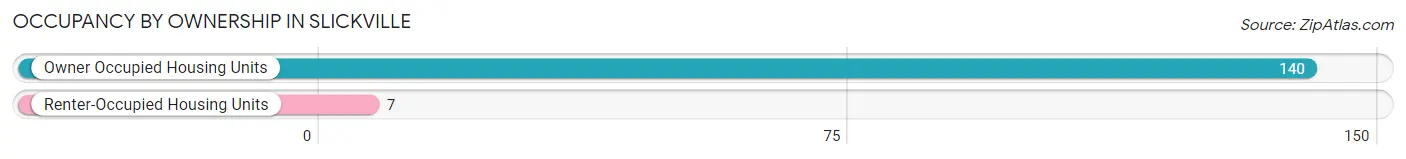
| Occupancy | # Housing Units | % Housing Units |
| Owner Occupied Housing Units | 140 | 95.2% |
| Renter-Occupied Housing Units | 7 | 4.8% |
| Total Occupied Housing Units | 147 | 100.0% |
Occupancy by Household Size in Slickville
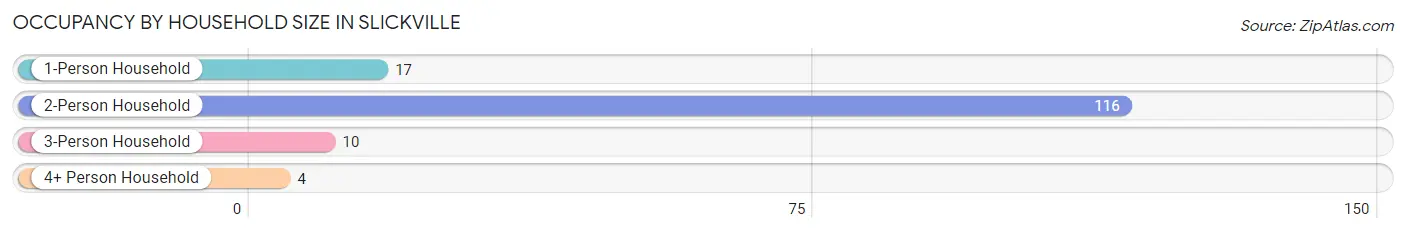
| Household Size | # Housing Units | % Housing Units |
| 1-Person Household | 17 | 11.6% |
| 2-Person Household | 116 | 78.9% |
| 3-Person Household | 10 | 6.8% |
| 4+ Person Household | 4 | 2.7% |
| Total Housing Units | 147 | 100.0% |
Occupancy by Ownership by Household Size in Slickville
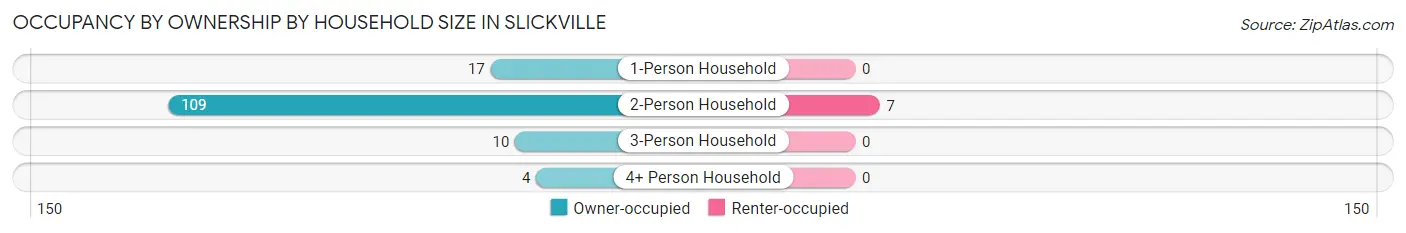
| Household Size | Owner-occupied | Renter-occupied |
| 1-Person Household | 17 (100.0%) | 0 (0.0%) |
| 2-Person Household | 109 (94.0%) | 7 (6.0%) |
| 3-Person Household | 10 (100.0%) | 0 (0.0%) |
| 4+ Person Household | 4 (100.0%) | 0 (0.0%) |
| Total Housing Units | 140 (95.2%) | 7 (4.8%) |
Occupancy by Educational Attainment in Slickville
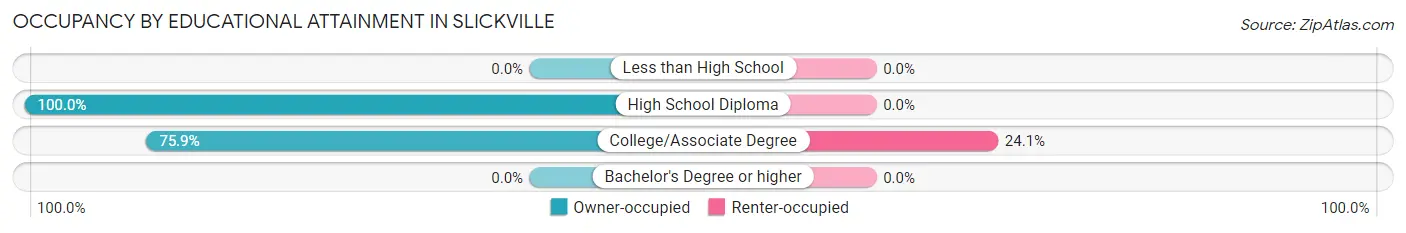
| Household Size | Owner-occupied | Renter-occupied |
| Less than High School | 0 (0.0%) | 0 (0.0%) |
| High School Diploma | 118 (100.0%) | 0 (0.0%) |
| College/Associate Degree | 22 (75.9%) | 7 (24.1%) |
| Bachelor's Degree or higher | 0 (0.0%) | 0 (0.0%) |
Occupancy by Age of Householder in Slickville
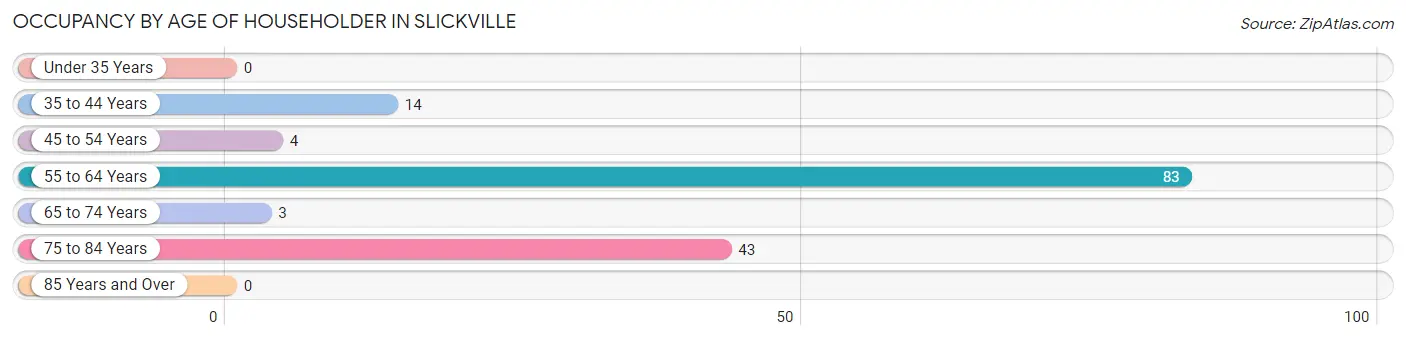
| Age Bracket | # Households | % Households |
| Under 35 Years | 0 | 0.0% |
| 35 to 44 Years | 14 | 9.5% |
| 45 to 54 Years | 4 | 2.7% |
| 55 to 64 Years | 83 | 56.5% |
| 65 to 74 Years | 3 | 2.0% |
| 75 to 84 Years | 43 | 29.2% |
| 85 Years and Over | 0 | 0.0% |
| Total | 147 | 100.0% |
Housing Finances in Slickville
Median Income by Occupancy in Slickville
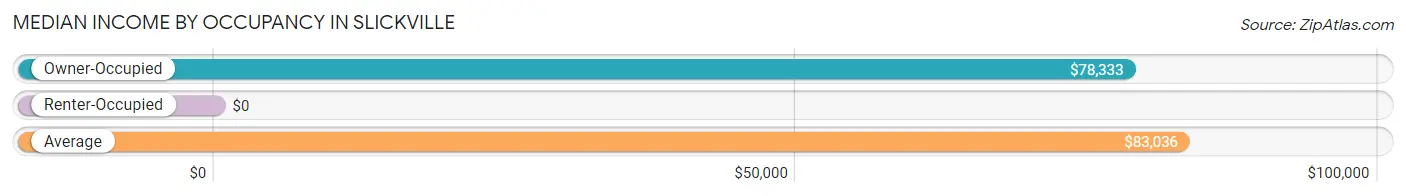
| Occupancy Type | # Households | Median Income |
| Owner-Occupied | 140 (95.2%) | $78,333 |
| Renter-Occupied | 7 (4.8%) | $0 |
| Average | 147 (100.0%) | $83,036 |
Occupancy by Householder Income Bracket in Slickville
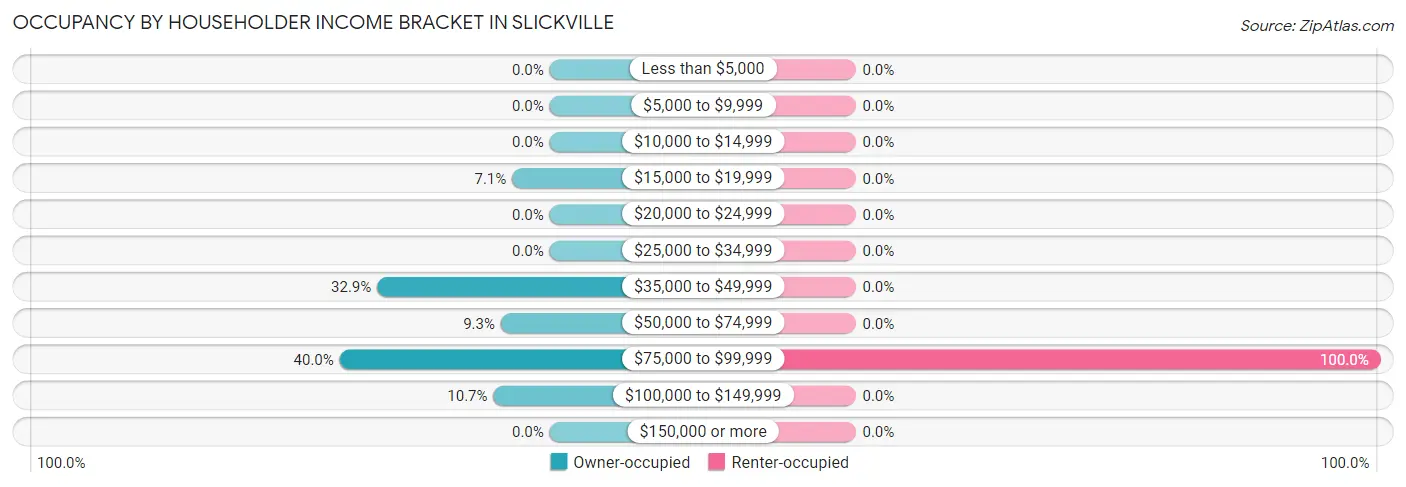
| Income Bracket | Owner-occupied | Renter-occupied |
| Less than $5,000 | 0 (0.0%) | 0 (0.0%) |
| $5,000 to $9,999 | 0 (0.0%) | 0 (0.0%) |
| $10,000 to $14,999 | 0 (0.0%) | 0 (0.0%) |
| $15,000 to $19,999 | 10 (7.1%) | 0 (0.0%) |
| $20,000 to $24,999 | 0 (0.0%) | 0 (0.0%) |
| $25,000 to $34,999 | 0 (0.0%) | 0 (0.0%) |
| $35,000 to $49,999 | 46 (32.9%) | 0 (0.0%) |
| $50,000 to $74,999 | 13 (9.3%) | 0 (0.0%) |
| $75,000 to $99,999 | 56 (40.0%) | 7 (100.0%) |
| $100,000 to $149,999 | 15 (10.7%) | 0 (0.0%) |
| $150,000 or more | 0 (0.0%) | 0 (0.0%) |
| Total | 140 (100.0%) | 7 (100.0%) |
Monthly Housing Cost Tiers in Slickville
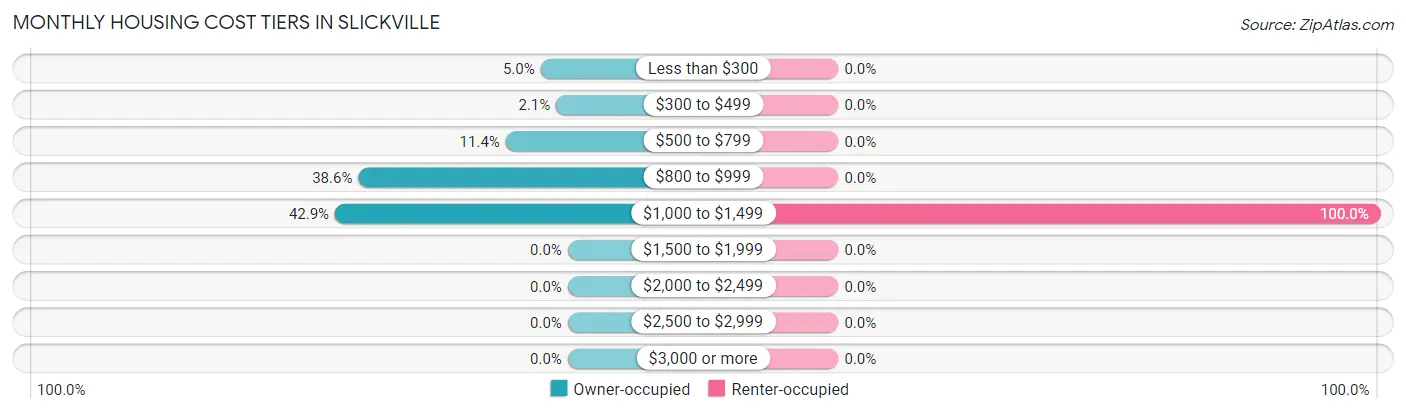
| Monthly Cost | Owner-occupied | Renter-occupied |
| Less than $300 | 7 (5.0%) | 0 (0.0%) |
| $300 to $499 | 3 (2.1%) | 0 (0.0%) |
| $500 to $799 | 16 (11.4%) | 0 (0.0%) |
| $800 to $999 | 54 (38.6%) | 0 (0.0%) |
| $1,000 to $1,499 | 60 (42.9%) | 7 (100.0%) |
| $1,500 to $1,999 | 0 (0.0%) | 0 (0.0%) |
| $2,000 to $2,499 | 0 (0.0%) | 0 (0.0%) |
| $2,500 to $2,999 | 0 (0.0%) | 0 (0.0%) |
| $3,000 or more | 0 (0.0%) | 0 (0.0%) |
| Total | 140 (100.0%) | 7 (100.0%) |
Physical Housing Characteristics in Slickville
Housing Structures in Slickville
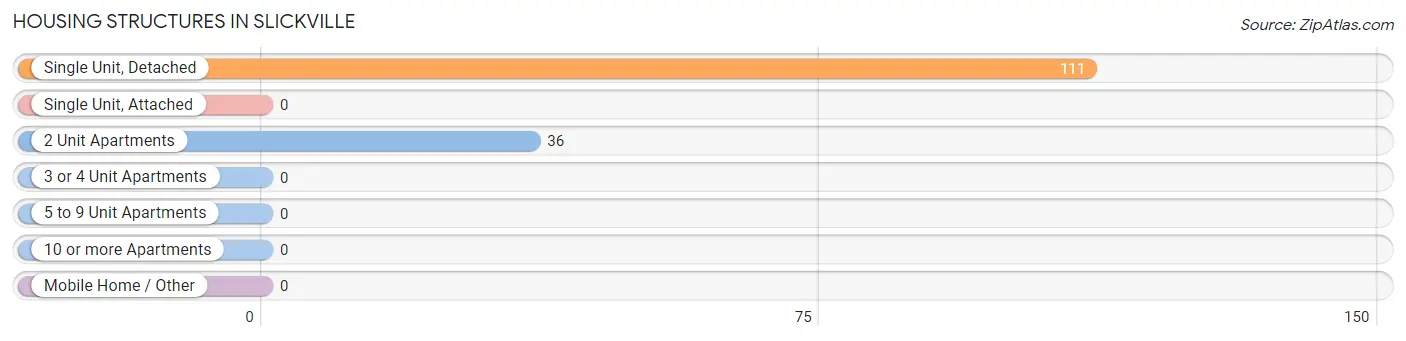
| Structure Type | # Housing Units | % Housing Units |
| Single Unit, Detached | 111 | 75.5% |
| Single Unit, Attached | 0 | 0.0% |
| 2 Unit Apartments | 36 | 24.5% |
| 3 or 4 Unit Apartments | 0 | 0.0% |
| 5 to 9 Unit Apartments | 0 | 0.0% |
| 10 or more Apartments | 0 | 0.0% |
| Mobile Home / Other | 0 | 0.0% |
| Total | 147 | 100.0% |
Housing Structures by Occupancy in Slickville
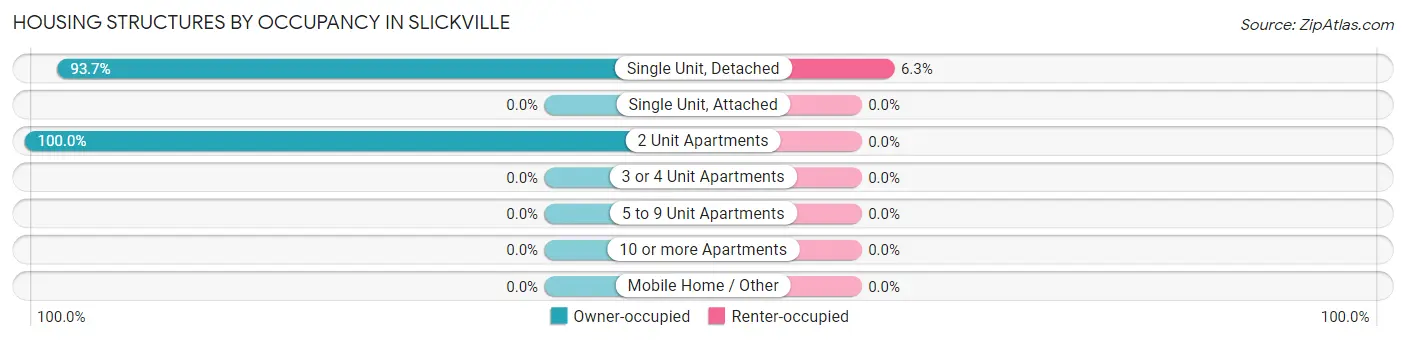
| Structure Type | Owner-occupied | Renter-occupied |
| Single Unit, Detached | 104 (93.7%) | 7 (6.3%) |
| Single Unit, Attached | 0 (0.0%) | 0 (0.0%) |
| 2 Unit Apartments | 36 (100.0%) | 0 (0.0%) |
| 3 or 4 Unit Apartments | 0 (0.0%) | 0 (0.0%) |
| 5 to 9 Unit Apartments | 0 (0.0%) | 0 (0.0%) |
| 10 or more Apartments | 0 (0.0%) | 0 (0.0%) |
| Mobile Home / Other | 0 (0.0%) | 0 (0.0%) |
| Total | 140 (95.2%) | 7 (4.8%) |
Housing Structures by Number of Rooms in Slickville
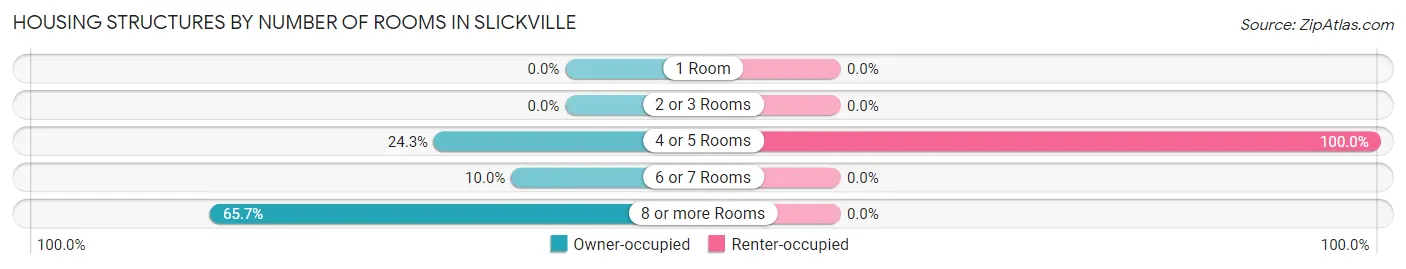
| Number of Rooms | Owner-occupied | Renter-occupied |
| 1 Room | 0 (0.0%) | 0 (0.0%) |
| 2 or 3 Rooms | 0 (0.0%) | 0 (0.0%) |
| 4 or 5 Rooms | 34 (24.3%) | 7 (100.0%) |
| 6 or 7 Rooms | 14 (10.0%) | 0 (0.0%) |
| 8 or more Rooms | 92 (65.7%) | 0 (0.0%) |
| Total | 140 (100.0%) | 7 (100.0%) |
Housing Structure by Heating Type in Slickville
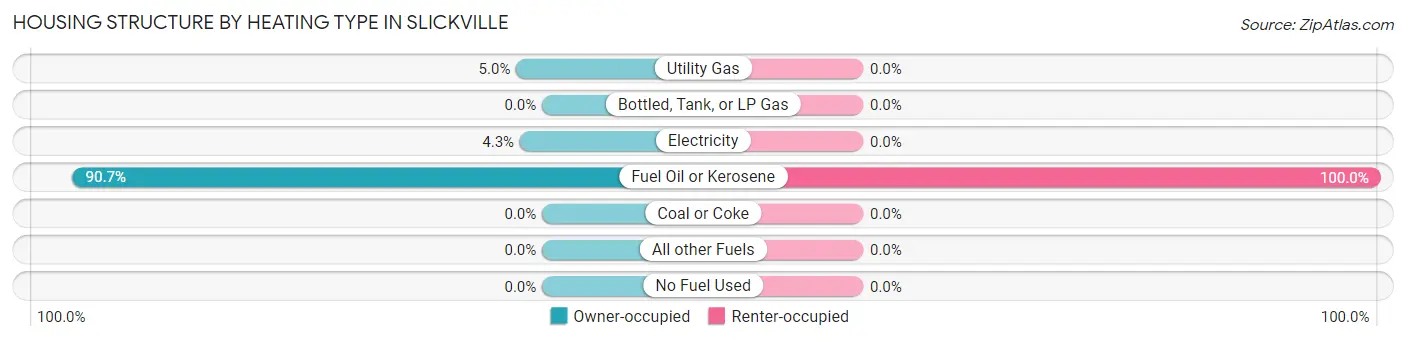
| Heating Type | Owner-occupied | Renter-occupied |
| Utility Gas | 7 (5.0%) | 0 (0.0%) |
| Bottled, Tank, or LP Gas | 0 (0.0%) | 0 (0.0%) |
| Electricity | 6 (4.3%) | 0 (0.0%) |
| Fuel Oil or Kerosene | 127 (90.7%) | 7 (100.0%) |
| Coal or Coke | 0 (0.0%) | 0 (0.0%) |
| All other Fuels | 0 (0.0%) | 0 (0.0%) |
| No Fuel Used | 0 (0.0%) | 0 (0.0%) |
| Total | 140 (100.0%) | 7 (100.0%) |
Household Vehicle Usage in Slickville
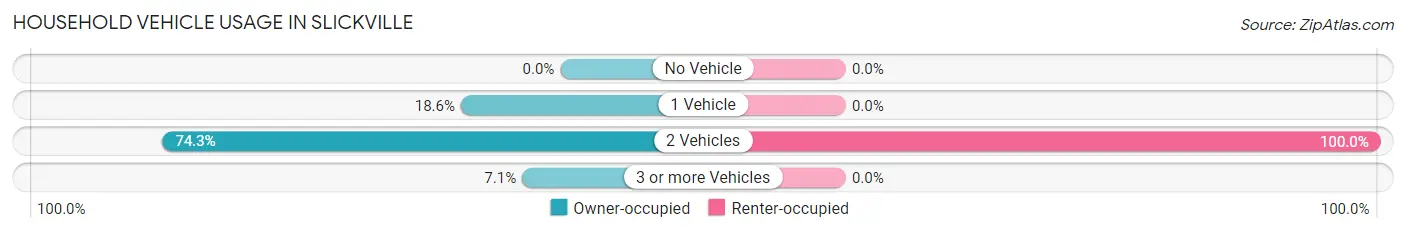
| Vehicles per Household | Owner-occupied | Renter-occupied |
| No Vehicle | 0 (0.0%) | 0 (0.0%) |
| 1 Vehicle | 26 (18.6%) | 0 (0.0%) |
| 2 Vehicles | 104 (74.3%) | 7 (100.0%) |
| 3 or more Vehicles | 10 (7.1%) | 0 (0.0%) |
| Total | 140 (100.0%) | 7 (100.0%) |
Real Estate & Mortgages in Slickville
Real Estate and Mortgage Overview in Slickville
| Characteristic | Without Mortgage | With Mortgage |
| Housing Units | 16 | 124 |
| Median Property Value | $98,900 | $0 |
| Median Household Income | - | - |
| Monthly Housing Costs | $433 | $0 |
| Real Estate Taxes | $633 | $0 |
Property Value by Mortgage Status in Slickville
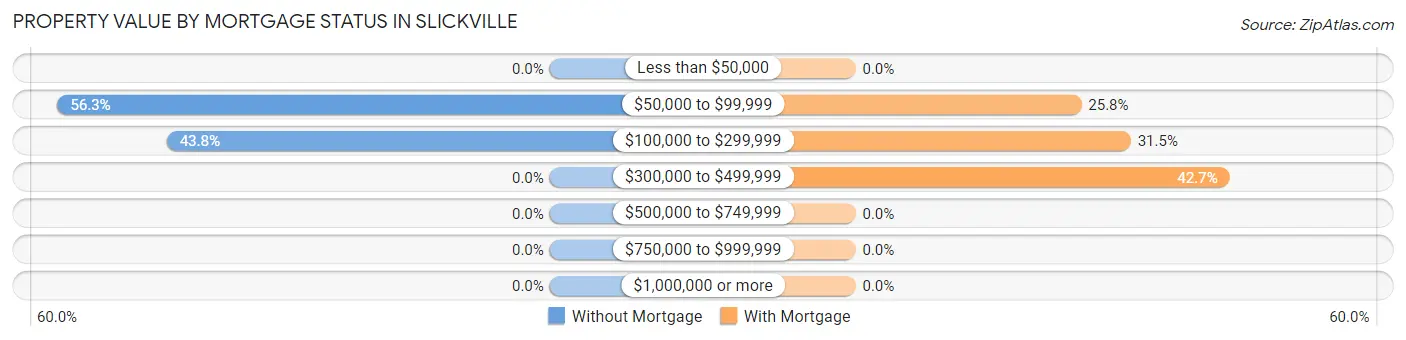
| Property Value | Without Mortgage | With Mortgage |
| Less than $50,000 | 0 (0.0%) | 0 (0.0%) |
| $50,000 to $99,999 | 9 (56.2%) | 32 (25.8%) |
| $100,000 to $299,999 | 7 (43.8%) | 39 (31.5%) |
| $300,000 to $499,999 | 0 (0.0%) | 53 (42.7%) |
| $500,000 to $749,999 | 0 (0.0%) | 0 (0.0%) |
| $750,000 to $999,999 | 0 (0.0%) | 0 (0.0%) |
| $1,000,000 or more | 0 (0.0%) | 0 (0.0%) |
| Total | 16 (100.0%) | 124 (100.0%) |
Household Income by Mortgage Status in Slickville
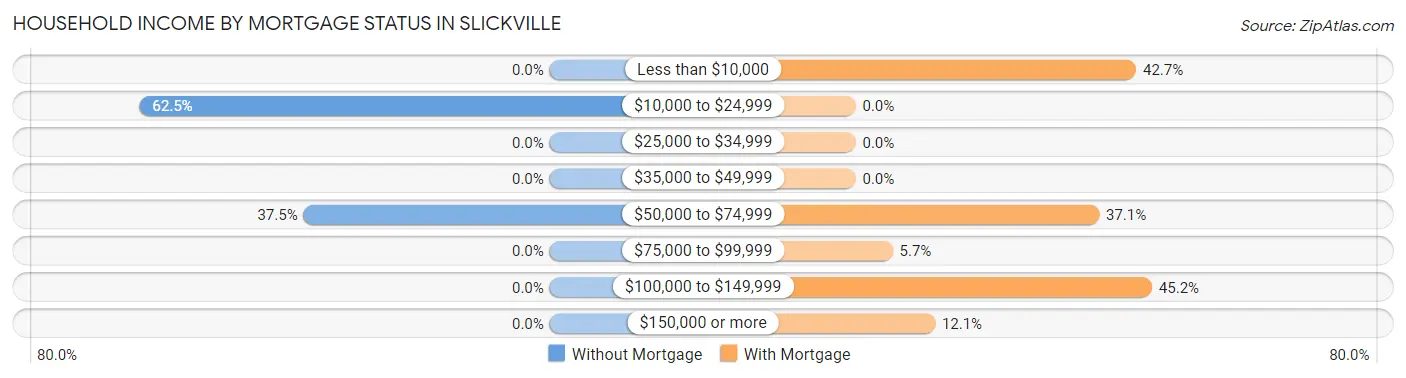
| Household Income | Without Mortgage | With Mortgage |
| Less than $10,000 | 0 (0.0%) | 53 (42.7%) |
| $10,000 to $24,999 | 10 (62.5%) | 0 (0.0%) |
| $25,000 to $34,999 | 0 (0.0%) | 0 (0.0%) |
| $35,000 to $49,999 | 0 (0.0%) | 0 (0.0%) |
| $50,000 to $74,999 | 6 (37.5%) | 46 (37.1%) |
| $75,000 to $99,999 | 0 (0.0%) | 7 (5.7%) |
| $100,000 to $149,999 | 0 (0.0%) | 56 (45.2%) |
| $150,000 or more | 0 (0.0%) | 15 (12.1%) |
| Total | 16 (100.0%) | 124 (100.0%) |
Property Value to Household Income Ratio in Slickville
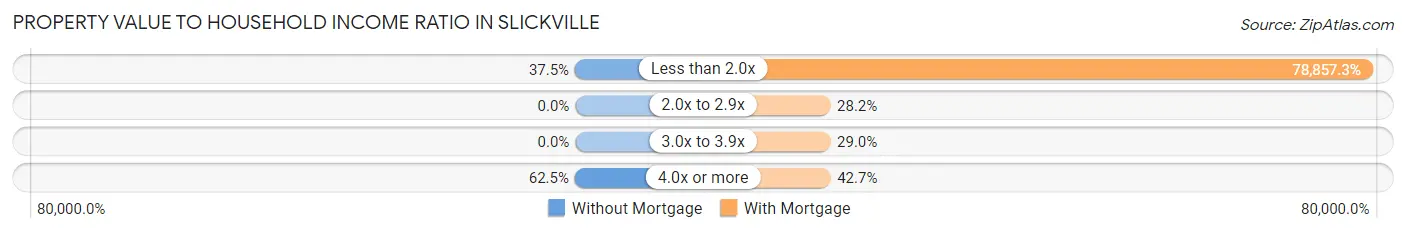
| Value-to-Income Ratio | Without Mortgage | With Mortgage |
| Less than 2.0x | 6 (37.5%) | 97,783 (78,857.3%) |
| 2.0x to 2.9x | 0 (0.0%) | 35 (28.2%) |
| 3.0x to 3.9x | 0 (0.0%) | 36 (29.0%) |
| 4.0x or more | 10 (62.5%) | 53 (42.7%) |
| Total | 16 (100.0%) | 124 (100.0%) |
Real Estate Taxes by Mortgage Status in Slickville
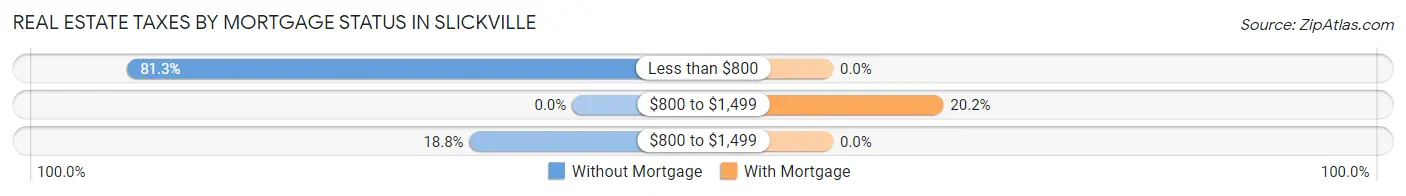
| Property Taxes | Without Mortgage | With Mortgage |
| Less than $800 | 13 (81.2%) | 0 (0.0%) |
| $800 to $1,499 | 0 (0.0%) | 25 (20.2%) |
| $800 to $1,499 | 3 (18.8%) | 0 (0.0%) |
| Total | 16 (100.0%) | 124 (100.0%) |
Health & Disability in Slickville
Health Insurance Coverage by Age in Slickville
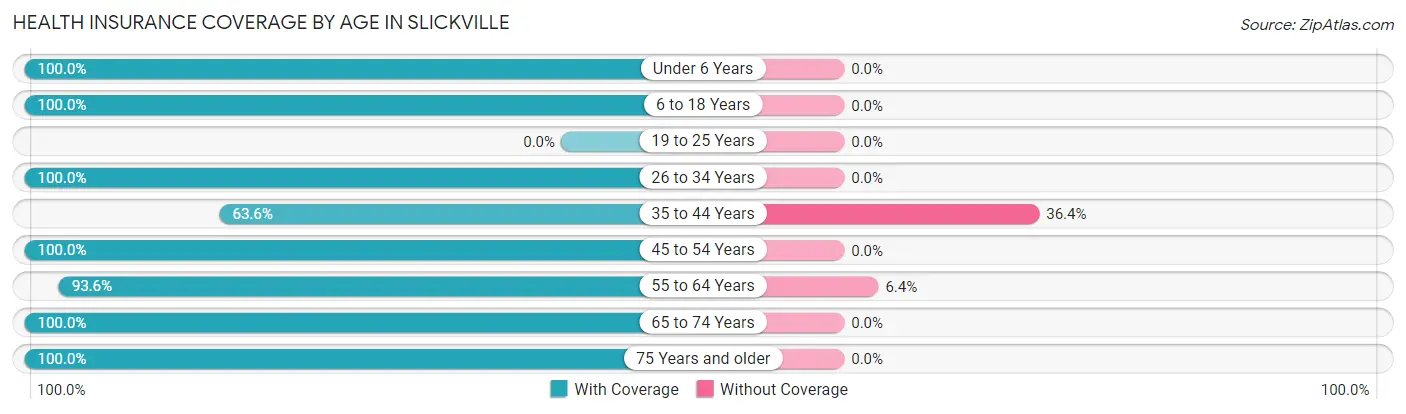
| Age Bracket | With Coverage | Without Coverage |
| Under 6 Years | 4 (100.0%) | 0 (0.0%) |
| 6 to 18 Years | 23 (100.0%) | 0 (0.0%) |
| 19 to 25 Years | 0 (0.0%) | 0 (0.0%) |
| 26 to 34 Years | 3 (100.0%) | 0 (0.0%) |
| 35 to 44 Years | 14 (63.6%) | 8 (36.4%) |
| 45 to 54 Years | 60 (100.0%) | 0 (0.0%) |
| 55 to 64 Years | 88 (93.6%) | 6 (6.4%) |
| 65 to 74 Years | 12 (100.0%) | 0 (0.0%) |
| 75 Years and older | 79 (100.0%) | 0 (0.0%) |
| Total | 283 (95.3%) | 14 (4.7%) |
Health Insurance Coverage by Citizenship Status in Slickville
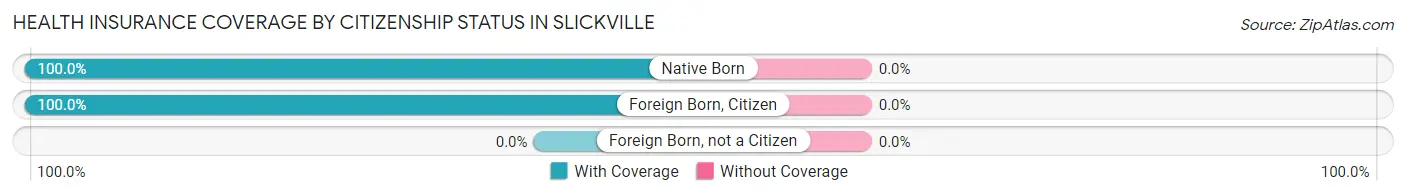
| Citizenship Status | With Coverage | Without Coverage |
| Native Born | 4 (100.0%) | 0 (0.0%) |
| Foreign Born, Citizen | 23 (100.0%) | 0 (0.0%) |
| Foreign Born, not a Citizen | 0 (0.0%) | 0 (0.0%) |
Health Insurance Coverage by Household Income in Slickville
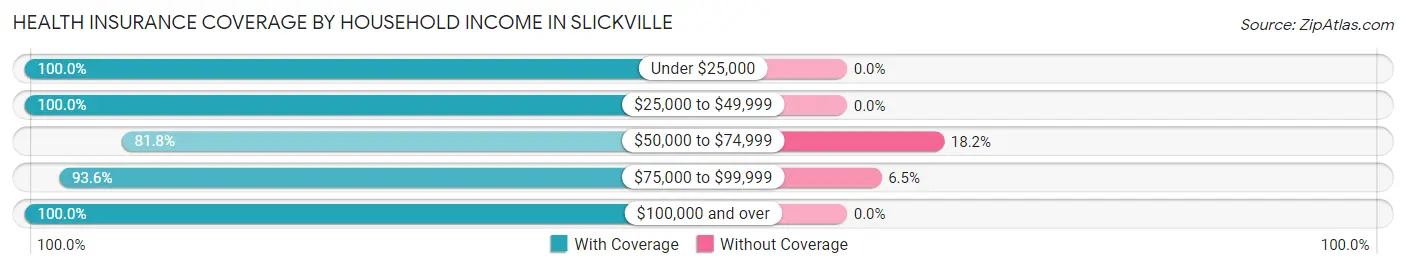
| Household Income | With Coverage | Without Coverage |
| Under $25,000 | 16 (100.0%) | 0 (0.0%) |
| $25,000 to $49,999 | 82 (100.0%) | 0 (0.0%) |
| $50,000 to $74,999 | 27 (81.8%) | 6 (18.2%) |
| $75,000 to $99,999 | 116 (93.5%) | 8 (6.5%) |
| $100,000 and over | 42 (100.0%) | 0 (0.0%) |
Public vs Private Health Insurance Coverage by Age in Slickville
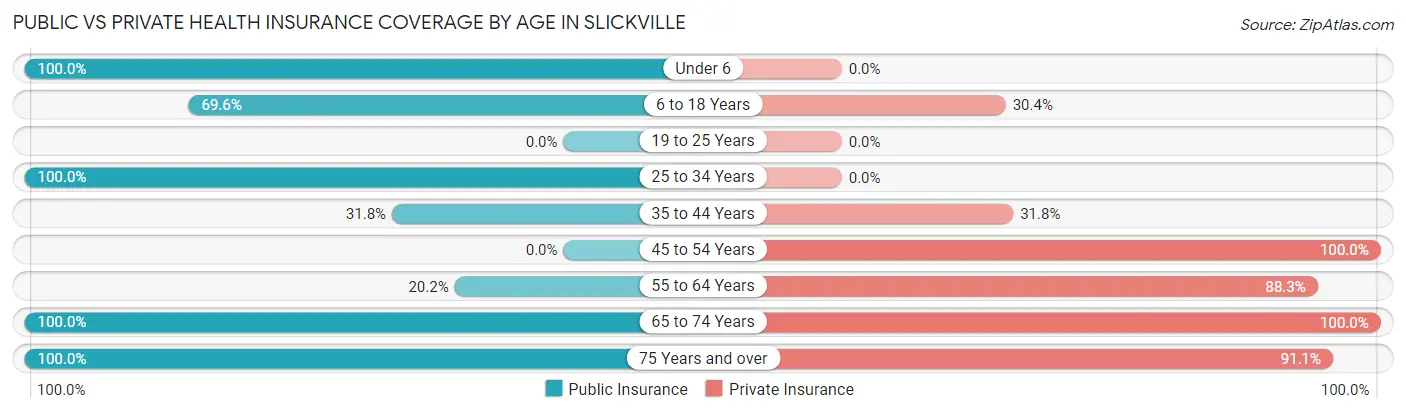
| Age Bracket | Public Insurance | Private Insurance |
| Under 6 | 4 (100.0%) | 0 (0.0%) |
| 6 to 18 Years | 16 (69.6%) | 7 (30.4%) |
| 19 to 25 Years | 0 (0.0%) | 0 (0.0%) |
| 25 to 34 Years | 3 (100.0%) | 0 (0.0%) |
| 35 to 44 Years | 7 (31.8%) | 7 (31.8%) |
| 45 to 54 Years | 0 (0.0%) | 60 (100.0%) |
| 55 to 64 Years | 19 (20.2%) | 83 (88.3%) |
| 65 to 74 Years | 12 (100.0%) | 12 (100.0%) |
| 75 Years and over | 79 (100.0%) | 72 (91.1%) |
| Total | 140 (47.1%) | 241 (81.1%) |
Disability Status by Sex by Age in Slickville
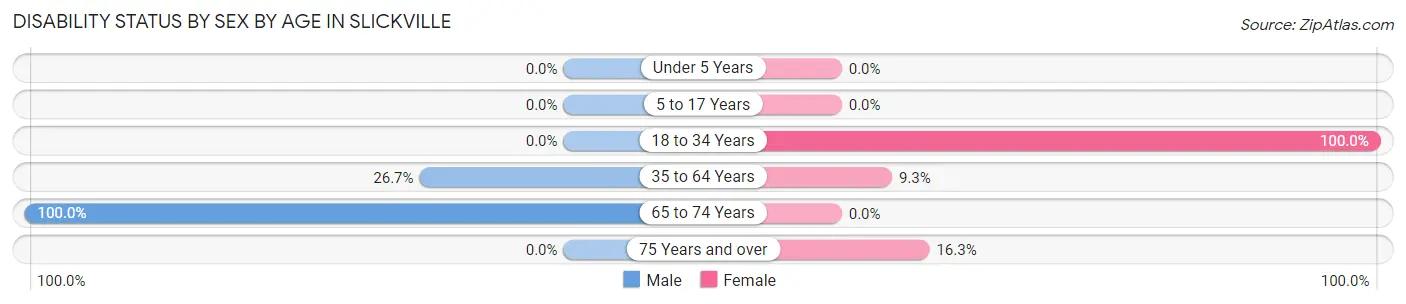
| Age Bracket | Male | Female |
| Under 5 Years | 0 (0.0%) | 0 (0.0%) |
| 5 to 17 Years | 0 (0.0%) | 0 (0.0%) |
| 18 to 34 Years | 0 (0.0%) | 3 (100.0%) |
| 35 to 64 Years | 27 (26.7%) | 7 (9.3%) |
| 65 to 74 Years | 4 (100.0%) | 0 (0.0%) |
| 75 Years and over | 0 (0.0%) | 7 (16.3%) |
Disability Class by Sex by Age in Slickville
Disability Class: Hearing Difficulty
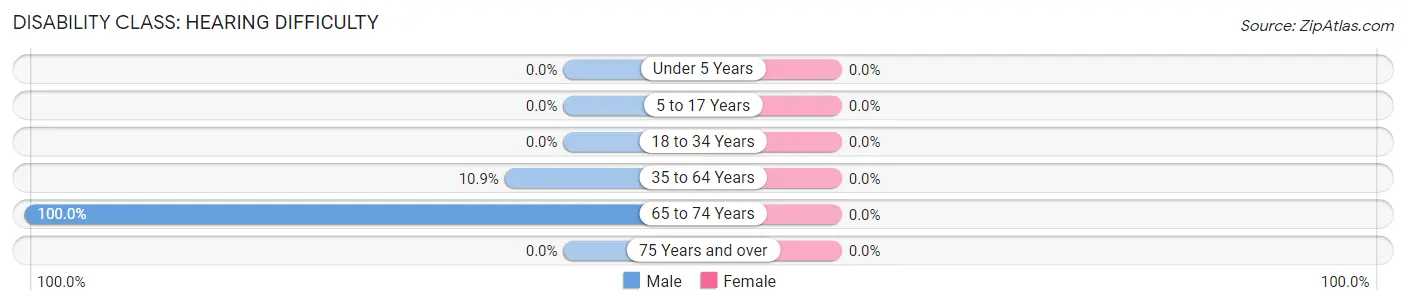
| Age Bracket | Male | Female |
| Under 5 Years | 0 (0.0%) | 0 (0.0%) |
| 5 to 17 Years | 0 (0.0%) | 0 (0.0%) |
| 18 to 34 Years | 0 (0.0%) | 0 (0.0%) |
| 35 to 64 Years | 11 (10.9%) | 0 (0.0%) |
| 65 to 74 Years | 4 (100.0%) | 0 (0.0%) |
| 75 Years and over | 0 (0.0%) | 0 (0.0%) |
Disability Class: Vision Difficulty
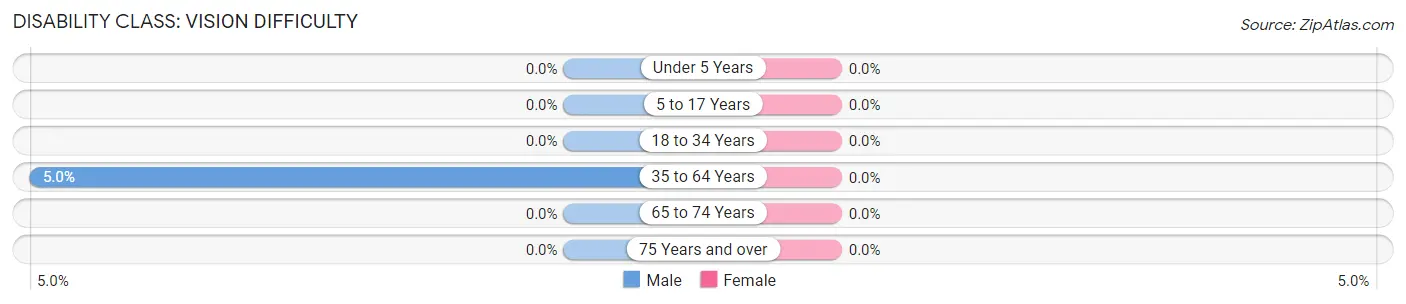
| Age Bracket | Male | Female |
| Under 5 Years | 0 (0.0%) | 0 (0.0%) |
| 5 to 17 Years | 0 (0.0%) | 0 (0.0%) |
| 18 to 34 Years | 0 (0.0%) | 0 (0.0%) |
| 35 to 64 Years | 5 (5.0%) | 0 (0.0%) |
| 65 to 74 Years | 0 (0.0%) | 0 (0.0%) |
| 75 Years and over | 0 (0.0%) | 0 (0.0%) |
Disability Class: Cognitive Difficulty
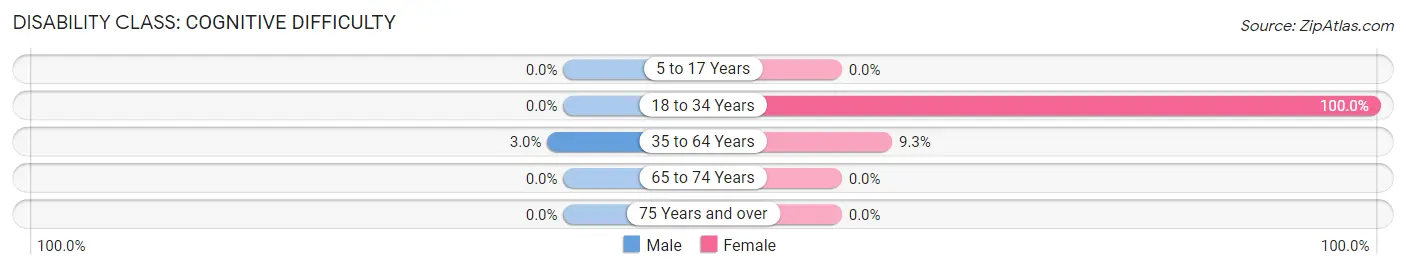
| Age Bracket | Male | Female |
| 5 to 17 Years | 0 (0.0%) | 0 (0.0%) |
| 18 to 34 Years | 0 (0.0%) | 3 (100.0%) |
| 35 to 64 Years | 3 (3.0%) | 7 (9.3%) |
| 65 to 74 Years | 0 (0.0%) | 0 (0.0%) |
| 75 Years and over | 0 (0.0%) | 0 (0.0%) |
Disability Class: Ambulatory Difficulty
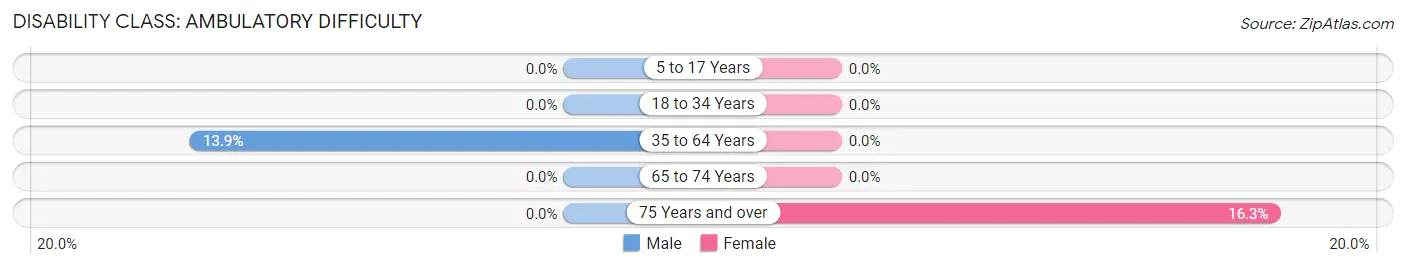
| Age Bracket | Male | Female |
| 5 to 17 Years | 0 (0.0%) | 0 (0.0%) |
| 18 to 34 Years | 0 (0.0%) | 0 (0.0%) |
| 35 to 64 Years | 14 (13.9%) | 0 (0.0%) |
| 65 to 74 Years | 0 (0.0%) | 0 (0.0%) |
| 75 Years and over | 0 (0.0%) | 7 (16.3%) |
Disability Class: Self-Care Difficulty
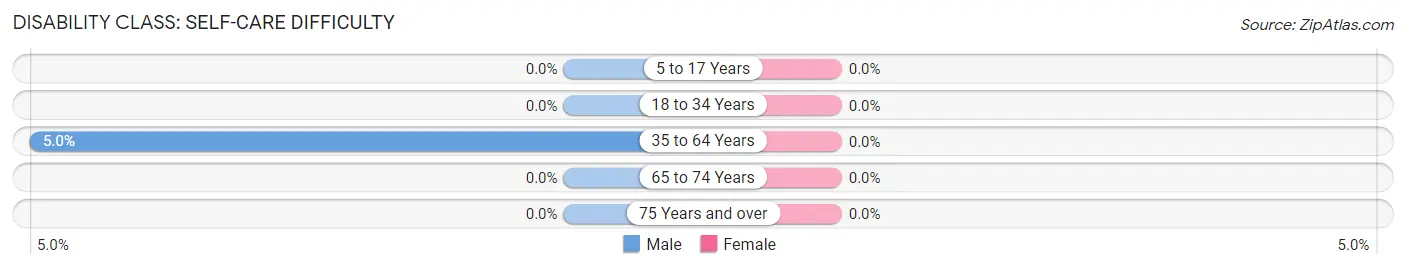
| Age Bracket | Male | Female |
| 5 to 17 Years | 0 (0.0%) | 0 (0.0%) |
| 18 to 34 Years | 0 (0.0%) | 0 (0.0%) |
| 35 to 64 Years | 5 (5.0%) | 0 (0.0%) |
| 65 to 74 Years | 0 (0.0%) | 0 (0.0%) |
| 75 Years and over | 0 (0.0%) | 0 (0.0%) |
Technology Access in Slickville
Computing Device Access in Slickville
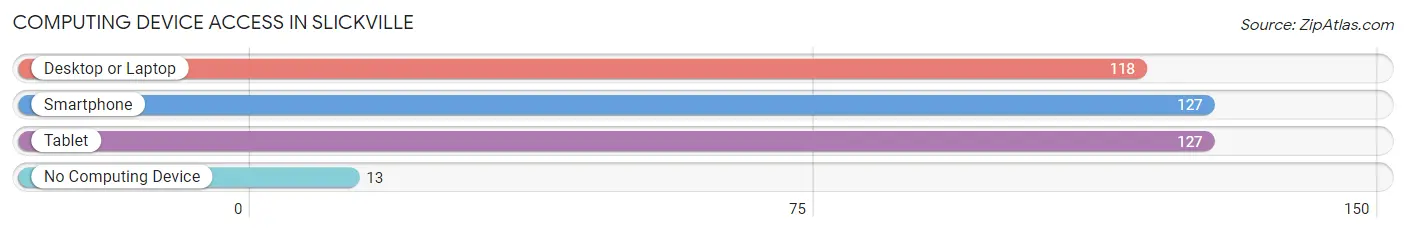
| Device Type | # Households | % Households |
| Desktop or Laptop | 118 | 80.3% |
| Smartphone | 127 | 86.4% |
| Tablet | 127 | 86.4% |
| No Computing Device | 13 | 8.8% |
| Total | 147 | 100.0% |
Internet Access in Slickville
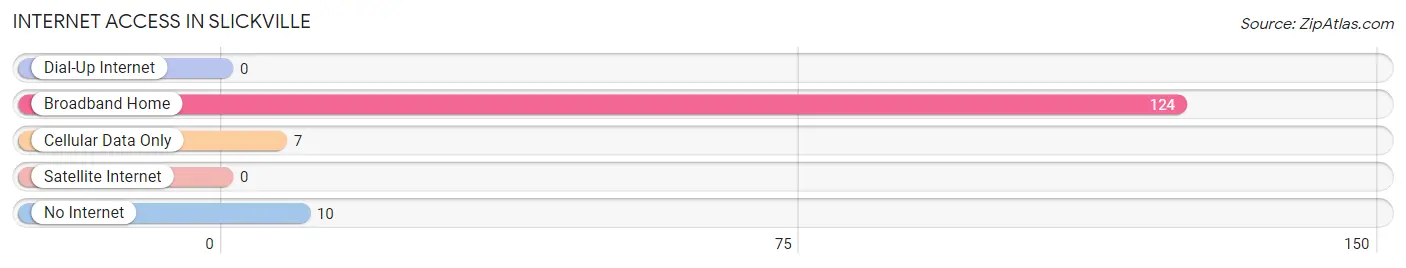
| Internet Type | # Households | % Households |
| Dial-Up Internet | 0 | 0.0% |
| Broadband Home | 124 | 84.4% |
| Cellular Data Only | 7 | 4.8% |
| Satellite Internet | 0 | 0.0% |
| No Internet | 10 | 6.8% |
| Total | 147 | 100.0% |
Slickville Summary
Slickville, Pennsylvania is a small borough located in Westmoreland County, Pennsylvania. It is situated in the Laurel Highlands region of the state, approximately 40 miles southeast of Pittsburgh. The borough was founded in 1876 and is home to a population of approximately 1,000 people.
History
Slickville was founded in 1876 by John Slick, a local farmer and entrepreneur. Slick purchased a large tract of land in the area and began to develop it into a small town. He built a general store, a post office, and a hotel, and the town quickly grew. By the early 1900s, Slickville had become a thriving community with a population of over 1,000 people.
The town was known for its coal mining industry, which provided employment for many of its residents. The coal mines were in operation until the 1950s, when the industry began to decline. The town also had a thriving manufacturing industry, which included a glass factory and a furniture factory.
Geography
Slickville is located in the Laurel Highlands region of Pennsylvania. It is situated in the foothills of the Allegheny Mountains, approximately 40 miles southeast of Pittsburgh. The borough is bordered by the towns of Derry, New Alexandria, and Loyalhanna.
The borough is situated on the banks of the Loyalhanna Creek, which flows through the town. The terrain is mostly hilly, with some flat areas. The climate is humid continental, with cold winters and hot, humid summers.
Economy
The economy of Slickville is largely based on agriculture and tourism. The town is home to several farms, which produce a variety of crops, including corn, soybeans, and hay. The town also has a thriving tourism industry, with many visitors coming to the area to enjoy the natural beauty of the Laurel Highlands.
The town also has a small manufacturing sector, which includes a furniture factory and a glass factory. The town also has a few small businesses, including a grocery store, a hardware store, and a few restaurants.
Demographics
As of the 2010 census, the population of Slickville was 1,000 people. The racial makeup of the town was 97.2% White, 0.7% African American, 0.3% Native American, 0.3% Asian, and 1.5% from other races. The median household income was $37,500, and the median family income was $45,000.
The town is served by the Derry Area School District, which includes two elementary schools, a middle school, and a high school. The town also has a public library and a few churches.
Conclusion
Slickville, Pennsylvania is a small borough located in Westmoreland County, Pennsylvania. It is situated in the Laurel Highlands region of the state, approximately 40 miles southeast of Pittsburgh. The borough was founded in 1876 and is home to a population of approximately 1,000 people. The economy of Slickville is largely based on agriculture and tourism, and the town is served by the Derry Area School District. The racial makeup of the town is 97.2% White, 0.7% African American, 0.3% Native American, 0.3% Asian, and 1.5% from other races. Slickville is a small, rural community with a rich history and a bright future.
Common Questions
What is Per Capita Income in Slickville?
Per Capita income in Slickville is $36,879.
What is the Median Family Income in Slickville?
Median Family Income in Slickville is $97,689.
What is the Median Household income in Slickville?
Median Household Income in Slickville is $83,036.
What is Inequality or Gini Index in Slickville?
Inequality or Gini Index in Slickville is 0.22.
What is the Total Population of Slickville?
Total Population of Slickville is 297.
What is the Total Male Population of Slickville?
Total Male Population of Slickville is 156.
What is the Total Female Population of Slickville?
Total Female Population of Slickville is 141.
What is the Ratio of Males per 100 Females in Slickville?
There are 110.64 Males per 100 Females in Slickville.
What is the Ratio of Females per 100 Males in Slickville?
There are 90.38 Females per 100 Males in Slickville.
What is the Median Population Age in Slickville?
Median Population Age in Slickville is 57.6 Years.
What is the Average Family Size in Slickville
Average Family Size in Slickville is 2.2 People.
What is the Average Household Size in Slickville
Average Household Size in Slickville is 2.0 People.
How Large is the Labor Force in Slickville?
There are 105 People in the Labor Forcein in Slickville.
What is the Percentage of People in the Labor Force in Slickville?
38.9% of People are in the Labor Force in Slickville.