Slatington borough, PA Map & Demographics
Slatington borough Overview
$24,064
PER CAPITA INCOME
$53,958
AVG FAMILY INCOME
$43,823
AVG HOUSEHOLD INCOME
36.1%
WAGE / INCOME GAP [ % ]
63.9¢/ $1
WAGE / INCOME GAP [ $ ]
0.47
INEQUALITY / GINI INDEX
4,283
TOTAL POPULATION
2,180
MALE POPULATION
2,103
FEMALE POPULATION
103.66
MALES / 100 FEMALES
96.47
FEMALES / 100 MALES
34.7
MEDIAN AGE
3.3
AVG FAMILY SIZE
2.5
AVG HOUSEHOLD SIZE
1,851
LABOR FORCE [ PEOPLE ]
59.8%
PERCENT IN LABOR FORCE
4.8%
UNEMPLOYMENT RATE
Income in Slatington borough
Income Overview in Slatington borough
Per Capita Income in Slatington borough is $24,064, while median incomes of families and households are $53,958 and $43,823 respectively.
| Characteristic | Number | Measure |
| Per Capita Income | 4,283 | $24,064 |
| Median Family Income | 1,051 | $53,958 |
| Mean Family Income | 1,051 | $72,191 |
| Median Household Income | 1,681 | $43,823 |
| Mean Household Income | 1,681 | $60,215 |
| Income Deficit | 1,051 | $0 |
| Wage / Income Gap (%) | 4,283 | 36.12% |
| Wage / Income Gap ($) | 4,283 | 63.88¢ per $1 |
| Gini / Inequality Index | 4,283 | 0.47 |
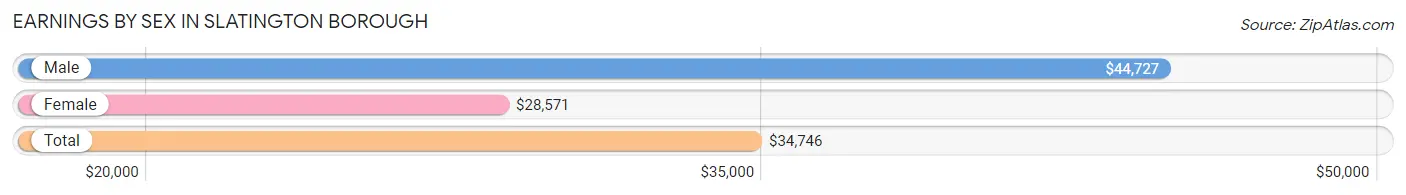
Earnings by Sex in Slatington borough
Average Earnings in Slatington borough are $34,746, $44,727 for men and $28,571 for women, a difference of 36.1%.
| Sex | Number | Average Earnings |
| Male | 981 (51.5%) | $44,727 |
| Female | 922 (48.4%) | $28,571 |
| Total | 1,903 (100.0%) | $34,746 |
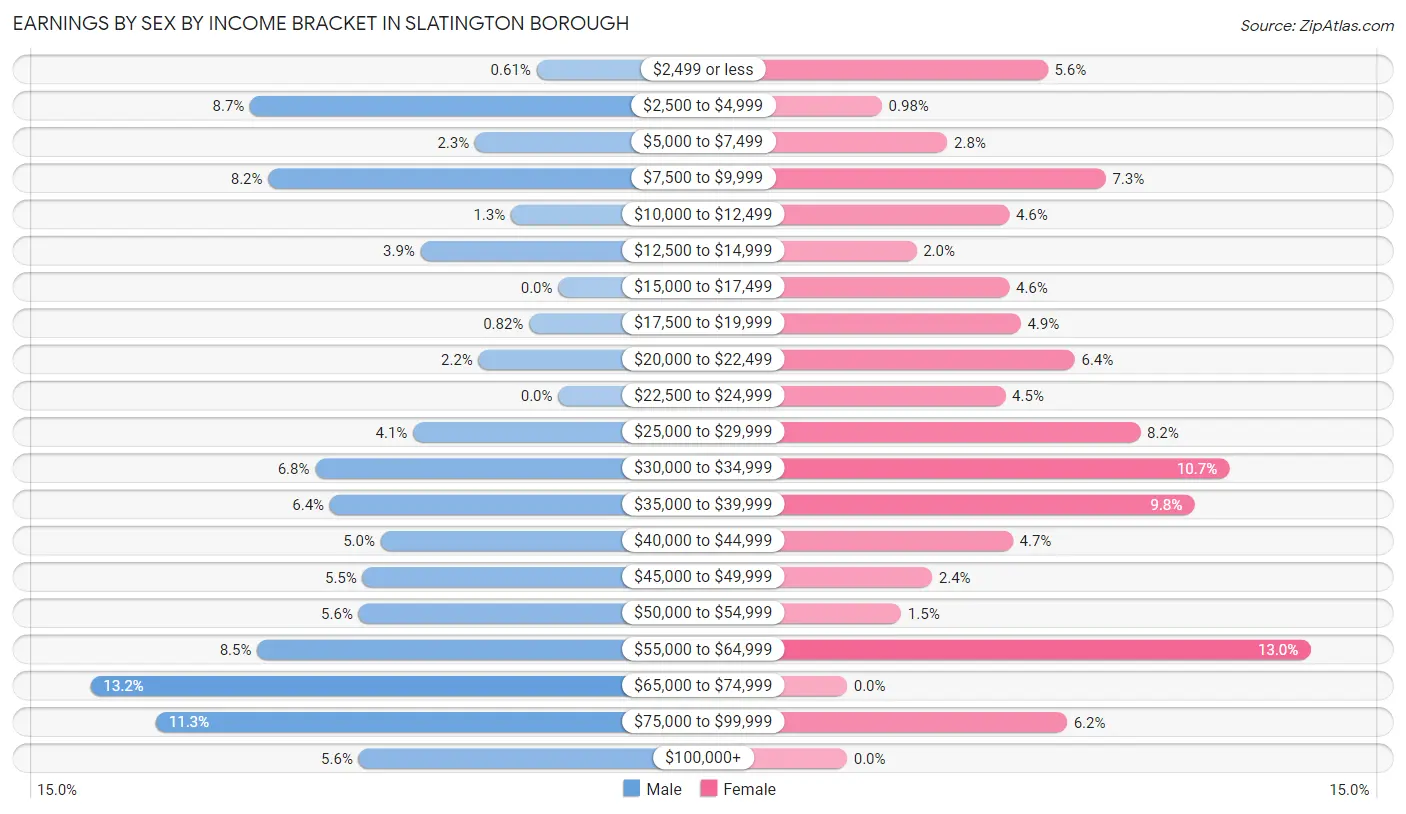
Earnings by Sex by Income Bracket in Slatington borough
The most common earnings brackets in Slatington borough are $65,000 to $74,999 for men (129 | 13.2%) and $55,000 to $64,999 for women (120 | 13.0%).
| Income | Male | Female |
| $2,499 or less | 6 (0.6%) | 52 (5.6%) |
| $2,500 to $4,999 | 85 (8.7%) | 9 (1.0%) |
| $5,000 to $7,499 | 23 (2.3%) | 26 (2.8%) |
| $7,500 to $9,999 | 80 (8.2%) | 67 (7.3%) |
| $10,000 to $12,499 | 13 (1.3%) | 42 (4.6%) |
| $12,500 to $14,999 | 38 (3.9%) | 18 (1.9%) |
| $15,000 to $17,499 | 0 (0.0%) | 42 (4.6%) |
| $17,500 to $19,999 | 8 (0.8%) | 45 (4.9%) |
| $20,000 to $22,499 | 22 (2.2%) | 59 (6.4%) |
| $22,500 to $24,999 | 0 (0.0%) | 41 (4.4%) |
| $25,000 to $29,999 | 40 (4.1%) | 76 (8.2%) |
| $30,000 to $34,999 | 67 (6.8%) | 99 (10.7%) |
| $35,000 to $39,999 | 63 (6.4%) | 90 (9.8%) |
| $40,000 to $44,999 | 49 (5.0%) | 43 (4.7%) |
| $45,000 to $49,999 | 54 (5.5%) | 22 (2.4%) |
| $50,000 to $54,999 | 55 (5.6%) | 14 (1.5%) |
| $55,000 to $64,999 | 83 (8.5%) | 120 (13.0%) |
| $65,000 to $74,999 | 129 (13.2%) | 0 (0.0%) |
| $75,000 to $99,999 | 111 (11.3%) | 57 (6.2%) |
| $100,000+ | 55 (5.6%) | 0 (0.0%) |
| Total | 981 (100.0%) | 922 (100.0%) |
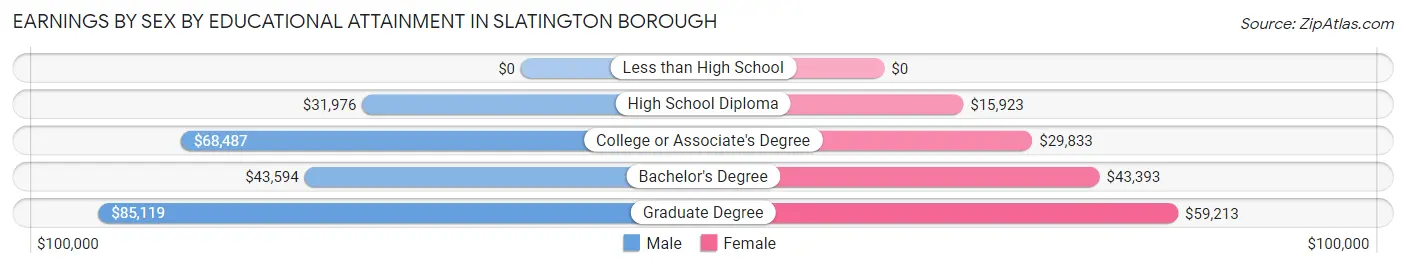
Earnings by Sex by Educational Attainment in Slatington borough
Average earnings in Slatington borough are $45,643 for men and $29,241 for women, a difference of 35.9%. Men with an educational attainment of graduate degree enjoy the highest average annual earnings of $85,119, while those with high school diploma education earn the least with $31,976. Women with an educational attainment of graduate degree earn the most with the average annual earnings of $59,213, while those with high school diploma education have the smallest earnings of $15,923.
| Educational Attainment | Male Income | Female Income |
| Less than High School | - | - |
| High School Diploma | $31,976 | $15,923 |
| College or Associate's Degree | $68,487 | $29,833 |
| Bachelor's Degree | $43,594 | $43,393 |
| Graduate Degree | $85,119 | $59,213 |
| Total | $45,643 | $29,241 |
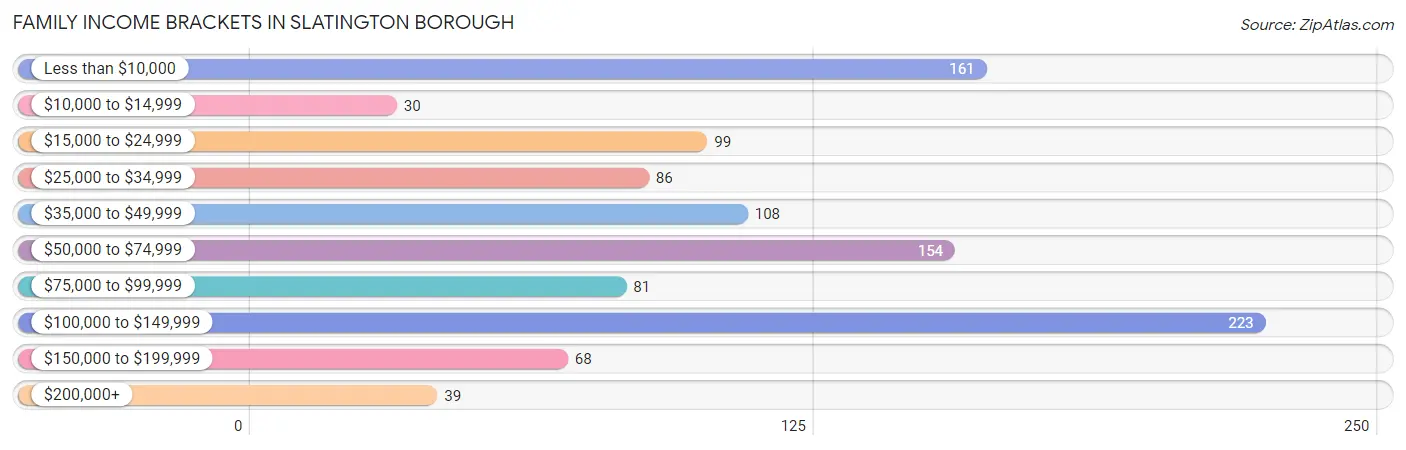
Family Income in Slatington borough
Family Income Brackets in Slatington borough
According to the Slatington borough family income data, there are 223 families falling into the $100,000 to $149,999 income range, which is the most common income bracket and makes up 21.2% of all families. Conversely, the $10,000 to $14,999 income bracket is the least frequent group with only 30 families (2.9%) belonging to this category.
| Income Bracket | # Families | % Families |
| Less than $10,000 | 161 | 15.3% |
| $10,000 to $14,999 | 30 | 2.9% |
| $15,000 to $24,999 | 99 | 9.4% |
| $25,000 to $34,999 | 86 | 8.2% |
| $35,000 to $49,999 | 108 | 10.3% |
| $50,000 to $74,999 | 154 | 14.7% |
| $75,000 to $99,999 | 81 | 7.7% |
| $100,000 to $149,999 | 223 | 21.2% |
| $150,000 to $199,999 | 68 | 6.5% |
| $200,000+ | 39 | 3.7% |
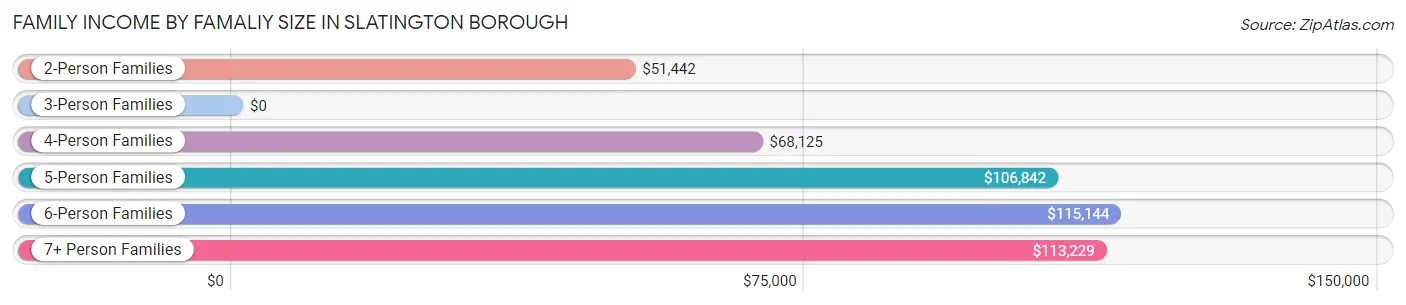
Family Income by Famaliy Size in Slatington borough
6-person families (49 | 4.7%) account for the highest median family income in Slatington borough with $115,144 per family, while 2-person families (407 | 38.7%) have the highest median income of $25,721 per family member.
| Income Bracket | # Families | Median Income |
| 2-Person Families | 407 (38.7%) | $51,442 |
| 3-Person Families | 228 (21.7%) | $0 |
| 4-Person Families | 264 (25.1%) | $68,125 |
| 5-Person Families | 72 (6.9%) | $106,842 |
| 6-Person Families | 49 (4.7%) | $115,144 |
| 7+ Person Families | 31 (2.9%) | $113,229 |
| Total | 1,051 (100.0%) | $53,958 |
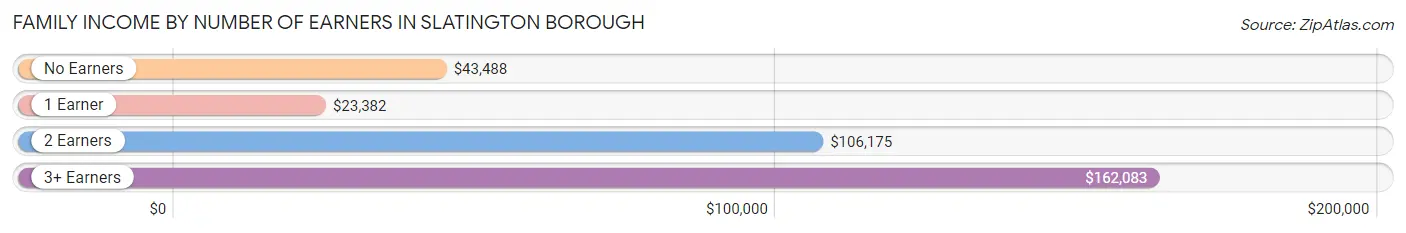
Family Income by Number of Earners in Slatington borough
The median family income in Slatington borough is $53,958, with families comprising 3+ earners (68) having the highest median family income of $162,083, while families with 1 earner (432) have the lowest median family income of $23,382, accounting for 6.5% and 41.1% of families, respectively.
| Number of Earners | # Families | Median Income |
| No Earners | 190 (18.1%) | $43,488 |
| 1 Earner | 432 (41.1%) | $23,382 |
| 2 Earners | 361 (34.4%) | $106,175 |
| 3+ Earners | 68 (6.5%) | $162,083 |
| Total | 1,051 (100.0%) | $53,958 |
Household Income in Slatington borough
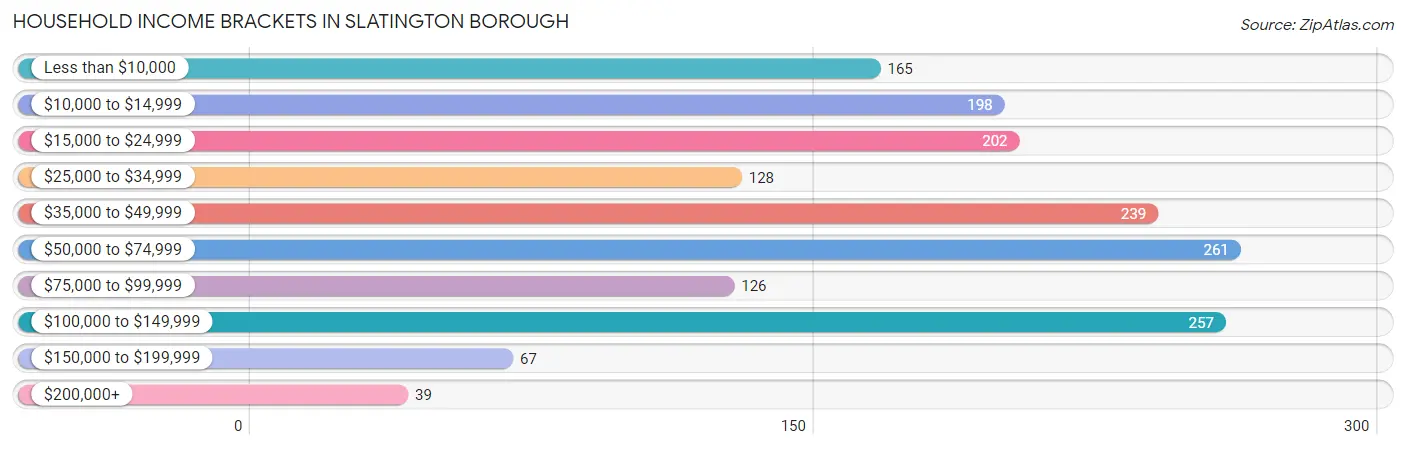
Household Income Brackets in Slatington borough
With 261 households falling in the category, the $50,000 to $74,999 income range is the most frequent in Slatington borough, accounting for 15.5% of all households. In contrast, only 39 households (2.3%) fall into the $200,000+ income bracket, making it the least populous group.
| Income Bracket | # Households | % Households |
| Less than $10,000 | 165 | 9.8% |
| $10,000 to $14,999 | 198 | 11.8% |
| $15,000 to $24,999 | 202 | 12.0% |
| $25,000 to $34,999 | 128 | 7.6% |
| $35,000 to $49,999 | 239 | 14.2% |
| $50,000 to $74,999 | 261 | 15.5% |
| $75,000 to $99,999 | 126 | 7.5% |
| $100,000 to $149,999 | 257 | 15.3% |
| $150,000 to $199,999 | 67 | 4.0% |
| $200,000+ | 39 | 2.3% |
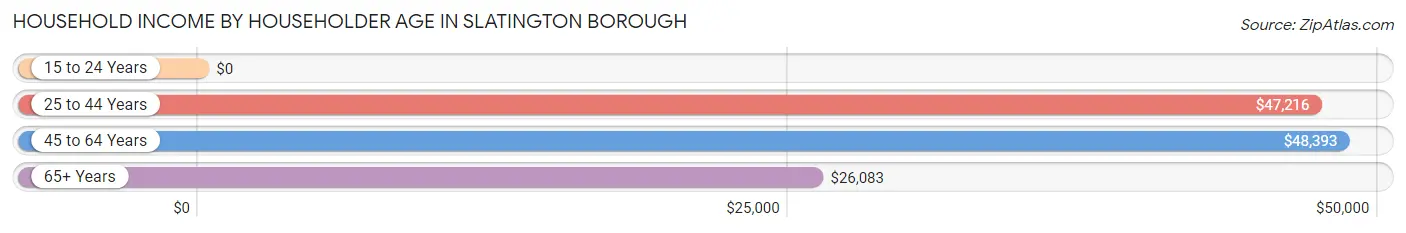
Household Income by Householder Age in Slatington borough
The median household income in Slatington borough is $43,823, with the highest median household income of $48,393 found in the 45 to 64 years age bracket for the primary householder. A total of 493 households (29.3%) fall into this category.
| Income Bracket | # Households | Median Income |
| 15 to 24 Years | 0 (0.0%) | $0 |
| 25 to 44 Years | 717 (42.6%) | $47,216 |
| 45 to 64 Years | 493 (29.3%) | $48,393 |
| 65+ Years | 471 (28.0%) | $26,083 |
| Total | 1,681 (100.0%) | $43,823 |
Poverty in Slatington borough
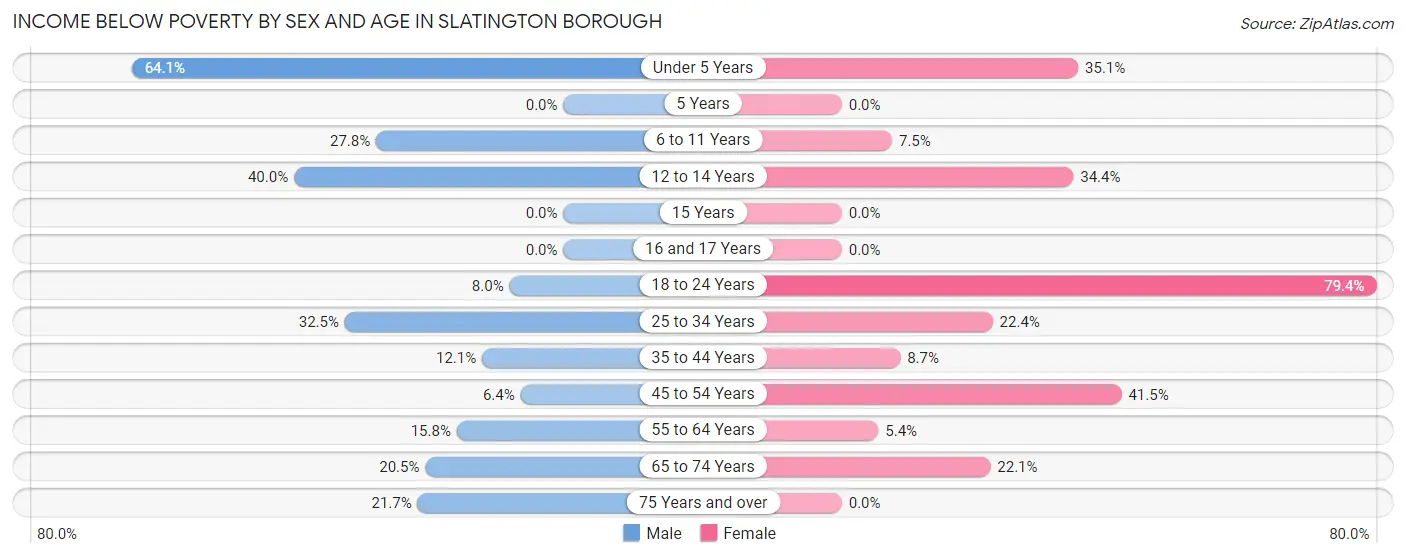
Income Below Poverty by Sex and Age in Slatington borough
With 28.0% poverty level for males and 20.3% for females among the residents of Slatington borough, under 5 year old males and 18 to 24 year old females are the most vulnerable to poverty, with 191 males (64.1%) and 100 females (79.4%) in their respective age groups living below the poverty level.
| Age Bracket | Male | Female |
| Under 5 Years | 191 (64.1%) | 40 (35.1%) |
| 5 Years | 0 (0.0%) | 0 (0.0%) |
| 6 to 11 Years | 94 (27.8%) | 20 (7.5%) |
| 12 to 14 Years | 46 (40.0%) | 11 (34.4%) |
| 15 Years | 0 (0.0%) | 0 (0.0%) |
| 16 and 17 Years | 0 (0.0%) | 0 (0.0%) |
| 18 to 24 Years | 2 (8.0%) | 100 (79.4%) |
| 25 to 34 Years | 134 (32.5%) | 82 (22.4%) |
| 35 to 44 Years | 28 (12.1%) | 29 (8.7%) |
| 45 to 54 Years | 12 (6.4%) | 76 (41.5%) |
| 55 to 64 Years | 41 (15.8%) | 10 (5.4%) |
| 65 to 74 Years | 41 (20.5%) | 60 (22.1%) |
| 75 Years and over | 21 (21.6%) | 0 (0.0%) |
| Total | 610 (28.0%) | 428 (20.3%) |
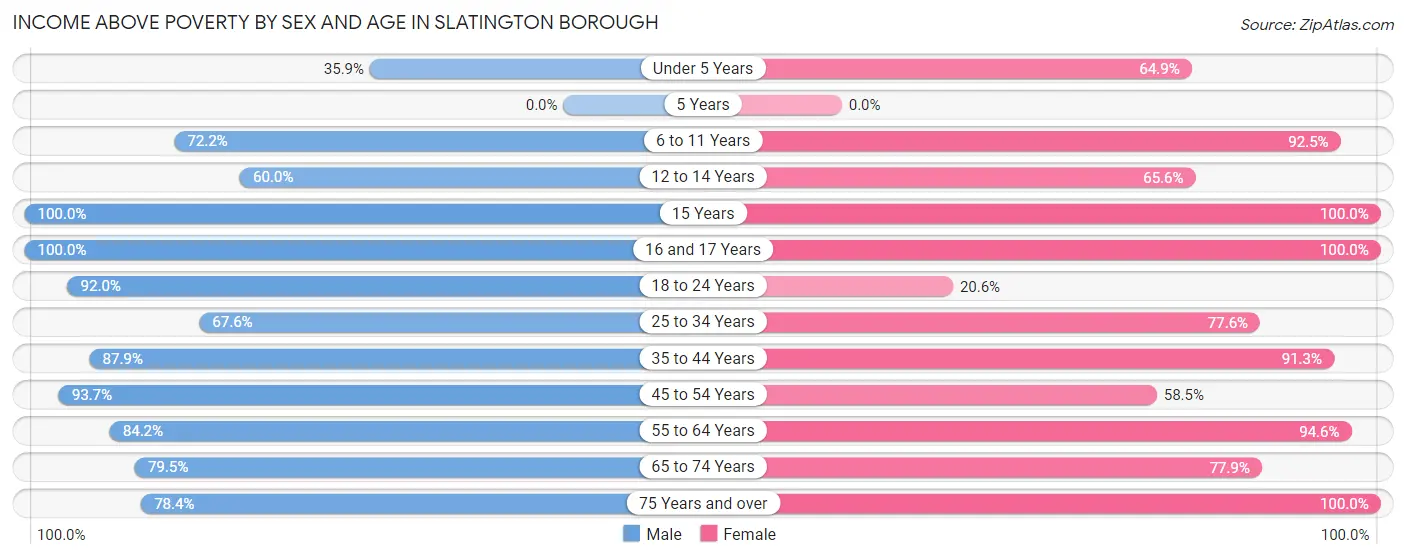
Income Above Poverty by Sex and Age in Slatington borough
According to the poverty statistics in Slatington borough, males aged 15 years and females aged 15 years are the age groups that are most secure financially, with 100.0% of males and 100.0% of females in these age groups living above the poverty line.
| Age Bracket | Male | Female |
| Under 5 Years | 107 (35.9%) | 74 (64.9%) |
| 5 Years | 0 (0.0%) | 0 (0.0%) |
| 6 to 11 Years | 244 (72.2%) | 248 (92.5%) |
| 12 to 14 Years | 69 (60.0%) | 21 (65.6%) |
| 15 Years | 7 (100.0%) | 15 (100.0%) |
| 16 and 17 Years | 7 (100.0%) | 21 (100.0%) |
| 18 to 24 Years | 23 (92.0%) | 26 (20.6%) |
| 25 to 34 Years | 279 (67.5%) | 284 (77.6%) |
| 35 to 44 Years | 204 (87.9%) | 305 (91.3%) |
| 45 to 54 Years | 177 (93.6%) | 107 (58.5%) |
| 55 to 64 Years | 218 (84.2%) | 174 (94.6%) |
| 65 to 74 Years | 159 (79.5%) | 212 (77.9%) |
| 75 Years and over | 76 (78.3%) | 188 (100.0%) |
| Total | 1,570 (72.0%) | 1,675 (79.6%) |
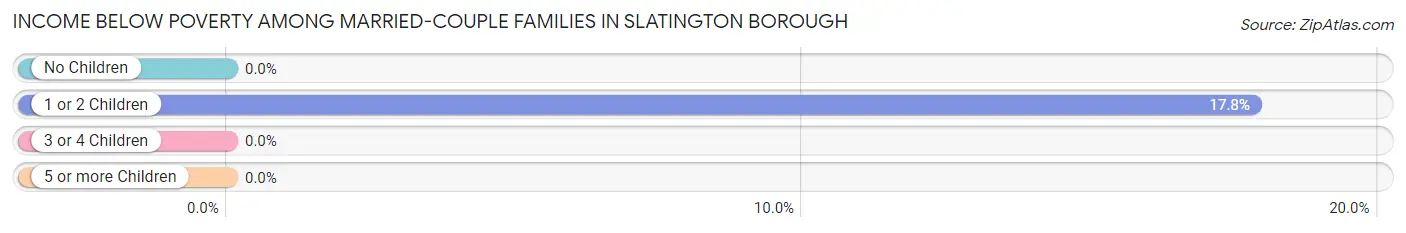
Income Below Poverty Among Married-Couple Families in Slatington borough
The poverty statistics for married-couple families in Slatington borough show that 7.4% or 49 of the total 661 families live below the poverty line. Families with 1 or 2 children have the highest poverty rate of 17.8%, comprising of 49 families. On the other hand, families with no children have the lowest poverty rate of 0.0%, which includes 0 families.
| Children | Above Poverty | Below Poverty |
| No Children | 288 (100.0%) | 0 (0.0%) |
| 1 or 2 Children | 226 (82.2%) | 49 (17.8%) |
| 3 or 4 Children | 98 (100.0%) | 0 (0.0%) |
| 5 or more Children | 0 (0.0%) | 0 (0.0%) |
| Total | 612 (92.6%) | 49 (7.4%) |
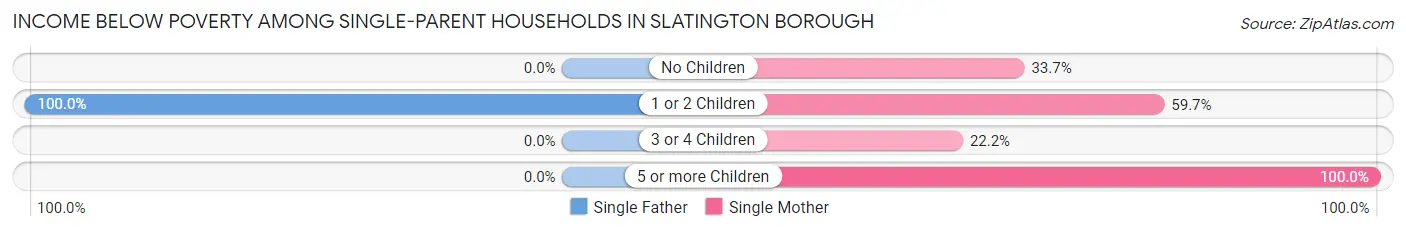
Income Below Poverty Among Single-Parent Households in Slatington borough
According to the poverty data in Slatington borough, 73.3% or 85 single-father households and 50.0% or 137 single-mother households are living below the poverty line. Among single-father households, those with 1 or 2 children have the highest poverty rate, with 85 households (100.0%) experiencing poverty. Likewise, among single-mother households, those with 5 or more children have the highest poverty rate, with 12 households (100.0%) falling below the poverty line.
| Children | Single Father | Single Mother |
| No Children | 0 (0.0%) | 32 (33.7%) |
| 1 or 2 Children | 85 (100.0%) | 89 (59.7%) |
| 3 or 4 Children | 0 (0.0%) | 4 (22.2%) |
| 5 or more Children | 0 (0.0%) | 12 (100.0%) |
| Total | 85 (73.3%) | 137 (50.0%) |
Income Below Poverty Among Married-Couple vs Single-Parent Households in Slatington borough
The poverty data for Slatington borough shows that 49 of the married-couple family households (7.4%) and 222 of the single-parent households (56.9%) are living below the poverty level. Within the married-couple family households, those with 1 or 2 children have the highest poverty rate, with 49 households (17.8%) falling below the poverty line. Among the single-parent households, those with 5 or more children have the highest poverty rate, with 12 household (100.0%) living below poverty.
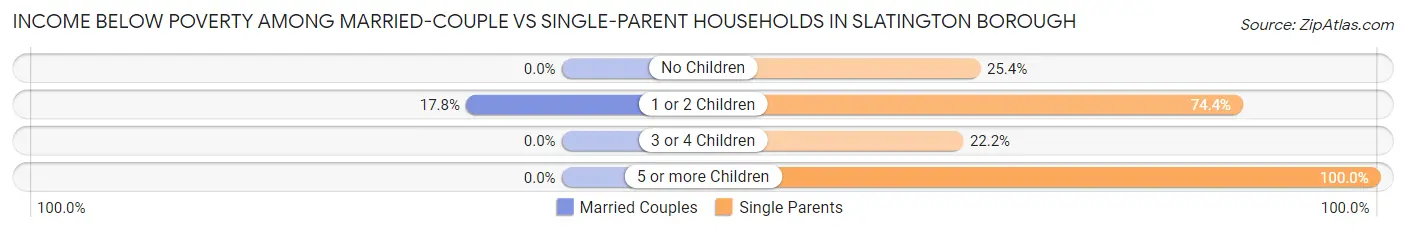
| Children | Married-Couple Families | Single-Parent Households |
| No Children | 0 (0.0%) | 32 (25.4%) |
| 1 or 2 Children | 49 (17.8%) | 174 (74.4%) |
| 3 or 4 Children | 0 (0.0%) | 4 (22.2%) |
| 5 or more Children | 0 (0.0%) | 12 (100.0%) |
| Total | 49 (7.4%) | 222 (56.9%) |
Race in Slatington borough
The most populous races in Slatington borough are White / Caucasian (3,972 | 92.7%), Hispanic or Latino (679 | 15.9%), and Some other Race (218 | 5.1%).
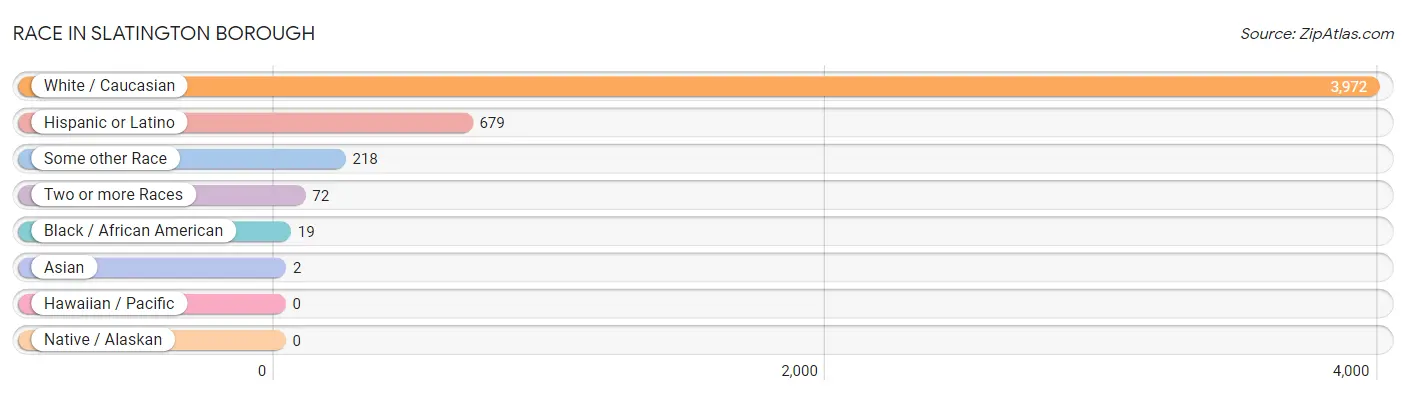
| Race | # Population | % Population |
| Asian | 2 | 0.1% |
| Black / African American | 19 | 0.4% |
| Hawaiian / Pacific | 0 | 0.0% |
| Hispanic or Latino | 679 | 15.9% |
| Native / Alaskan | 0 | 0.0% |
| White / Caucasian | 3,972 | 92.7% |
| Two or more Races | 72 | 1.7% |
| Some other Race | 218 | 5.1% |
| Total | 4,283 | 100.0% |
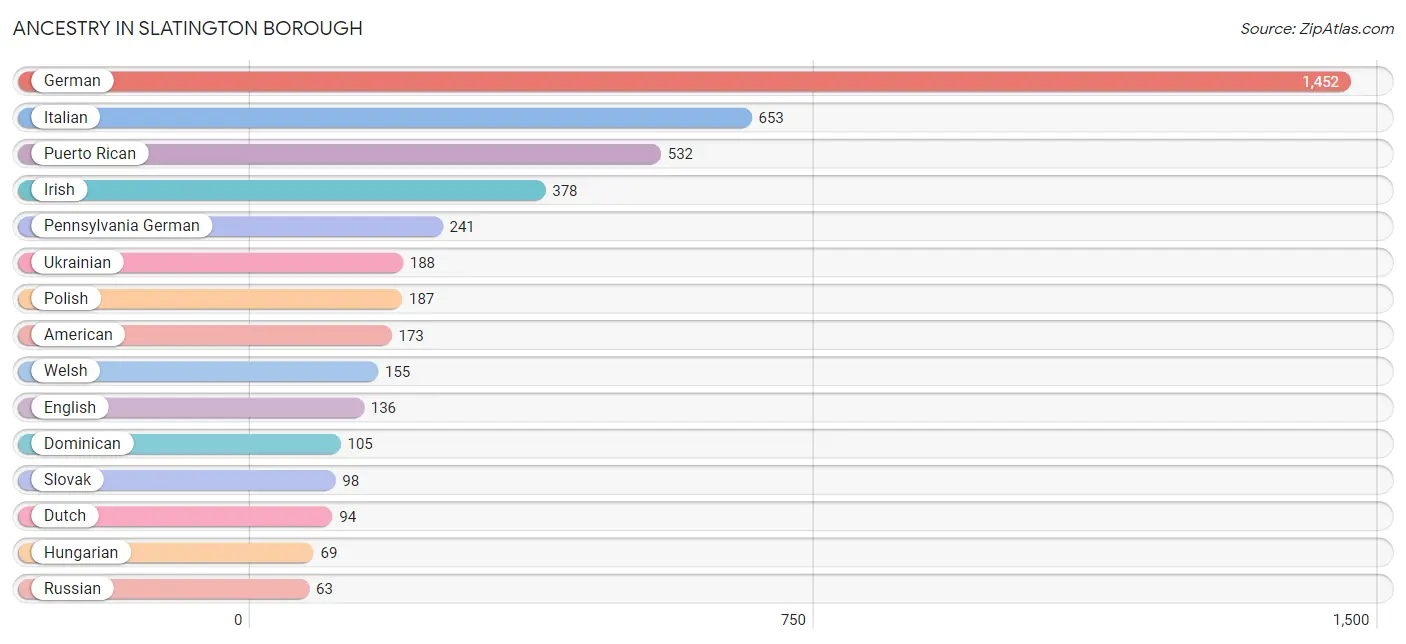
Ancestry in Slatington borough
The most populous ancestries reported in Slatington borough are German (1,452 | 33.9%), Italian (653 | 15.2%), Puerto Rican (532 | 12.4%), Irish (378 | 8.8%), and Pennsylvania German (241 | 5.6%), together accounting for 76.0% of all Slatington borough residents.
| Ancestry | # Population | % Population |
| American | 173 | 4.0% |
| Austrian | 9 | 0.2% |
| Danish | 21 | 0.5% |
| Dominican | 105 | 2.5% |
| Dutch | 94 | 2.2% |
| Eastern European | 14 | 0.3% |
| English | 136 | 3.2% |
| European | 11 | 0.3% |
| French | 20 | 0.5% |
| French Canadian | 14 | 0.3% |
| German | 1,452 | 33.9% |
| Greek | 7 | 0.2% |
| Hungarian | 69 | 1.6% |
| Irish | 378 | 8.8% |
| Italian | 653 | 15.2% |
| Lithuanian | 20 | 0.5% |
| Macedonian | 20 | 0.5% |
| Nigerian | 3 | 0.1% |
| Pennsylvania German | 241 | 5.6% |
| Polish | 187 | 4.4% |
| Puerto Rican | 532 | 12.4% |
| Russian | 63 | 1.5% |
| Scotch-Irish | 7 | 0.2% |
| Scottish | 48 | 1.1% |
| Slovak | 98 | 2.3% |
| Spanish | 42 | 1.0% |
| Subsaharan African | 3 | 0.1% |
| Swedish | 38 | 0.9% |
| Thai | 2 | 0.1% |
| Turkish | 10 | 0.2% |
| Ukrainian | 188 | 4.4% |
| Welsh | 155 | 3.6% |
| Yugoslavian | 47 | 1.1% | View All 33 Rows |
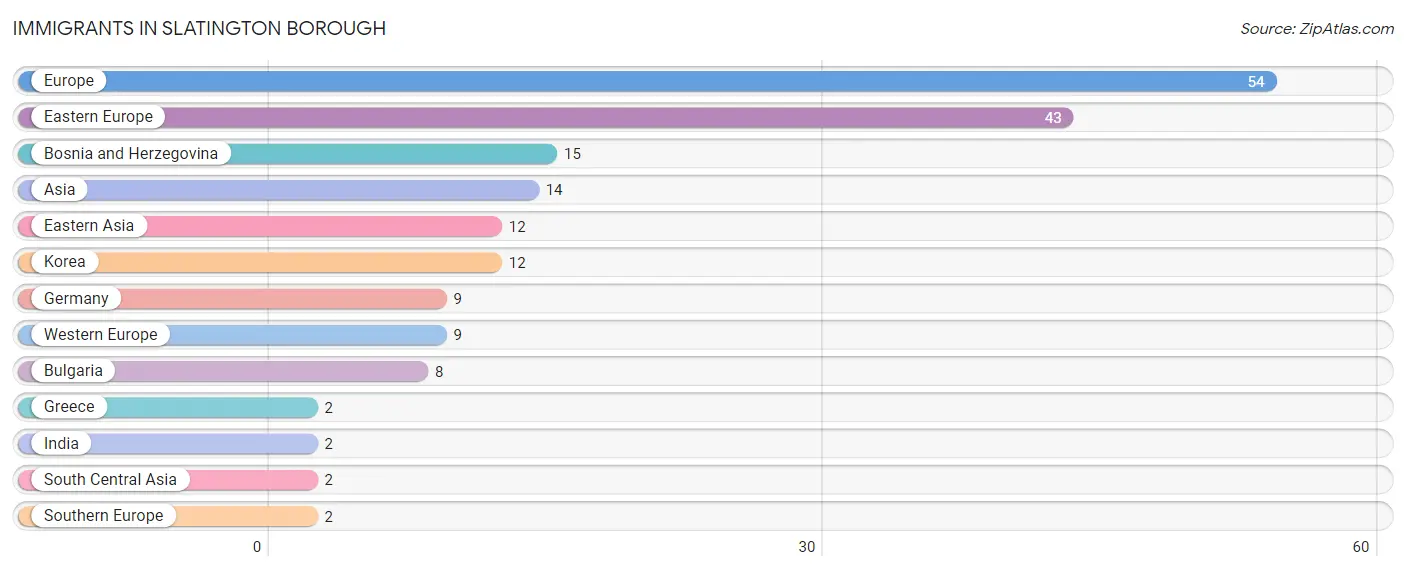
Immigrants in Slatington borough
The most numerous immigrant groups reported in Slatington borough came from Europe (54 | 1.3%), Eastern Europe (43 | 1.0%), Bosnia and Herzegovina (15 | 0.4%), Asia (14 | 0.3%), and Eastern Asia (12 | 0.3%), together accounting for 3.2% of all Slatington borough residents.
| Immigration Origin | # Population | % Population |
| Asia | 14 | 0.3% |
| Bosnia and Herzegovina | 15 | 0.4% |
| Bulgaria | 8 | 0.2% |
| Eastern Asia | 12 | 0.3% |
| Eastern Europe | 43 | 1.0% |
| Europe | 54 | 1.3% |
| Germany | 9 | 0.2% |
| Greece | 2 | 0.1% |
| India | 2 | 0.1% |
| Korea | 12 | 0.3% |
| South Central Asia | 2 | 0.1% |
| Southern Europe | 2 | 0.1% |
| Western Europe | 9 | 0.2% | View All 13 Rows |
Sex and Age in Slatington borough
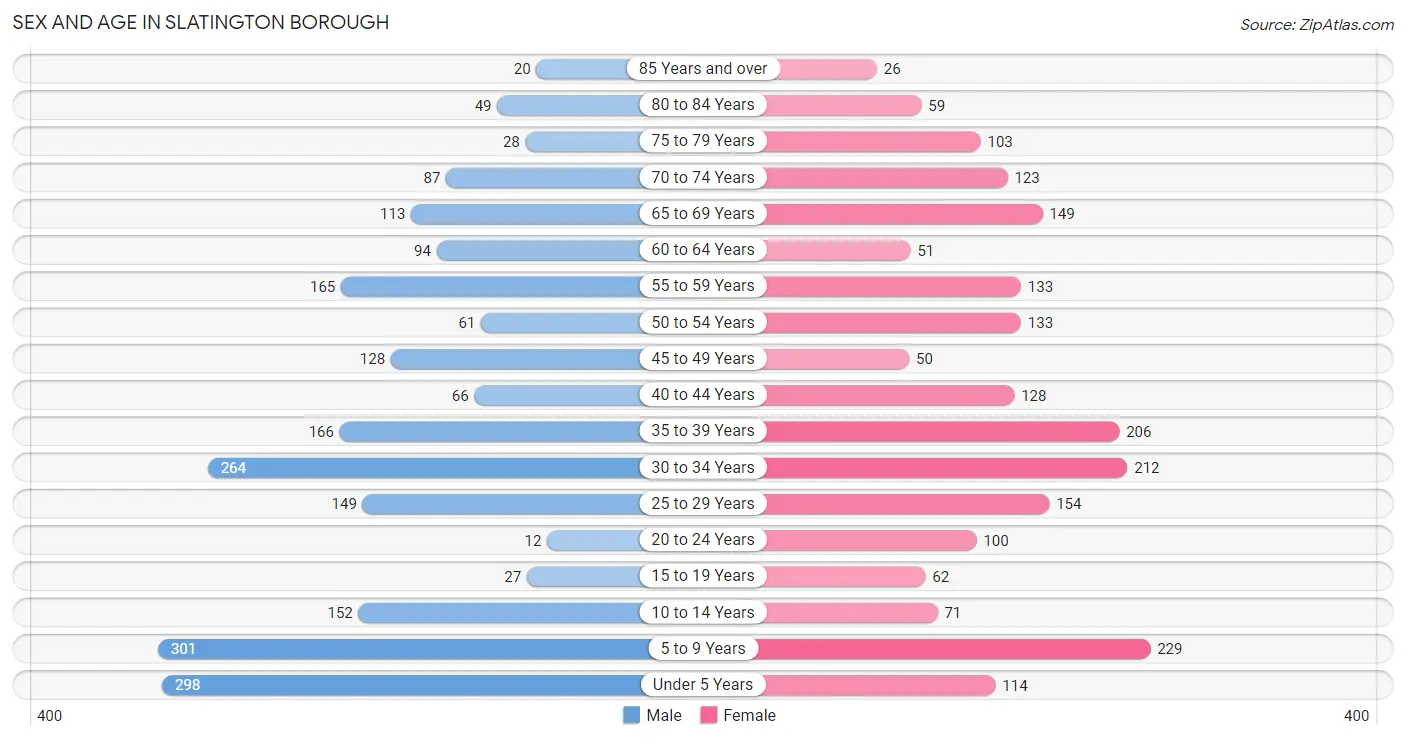
Sex and Age in Slatington borough
The most populous age groups in Slatington borough are 5 to 9 Years (301 | 13.8%) for men and 5 to 9 Years (229 | 10.9%) for women.
| Age Bracket | Male | Female |
| Under 5 Years | 298 (13.7%) | 114 (5.4%) |
| 5 to 9 Years | 301 (13.8%) | 229 (10.9%) |
| 10 to 14 Years | 152 (7.0%) | 71 (3.4%) |
| 15 to 19 Years | 27 (1.2%) | 62 (2.9%) |
| 20 to 24 Years | 12 (0.5%) | 100 (4.8%) |
| 25 to 29 Years | 149 (6.8%) | 154 (7.3%) |
| 30 to 34 Years | 264 (12.1%) | 212 (10.1%) |
| 35 to 39 Years | 166 (7.6%) | 206 (9.8%) |
| 40 to 44 Years | 66 (3.0%) | 128 (6.1%) |
| 45 to 49 Years | 128 (5.9%) | 50 (2.4%) |
| 50 to 54 Years | 61 (2.8%) | 133 (6.3%) |
| 55 to 59 Years | 165 (7.6%) | 133 (6.3%) |
| 60 to 64 Years | 94 (4.3%) | 51 (2.4%) |
| 65 to 69 Years | 113 (5.2%) | 149 (7.1%) |
| 70 to 74 Years | 87 (4.0%) | 123 (5.9%) |
| 75 to 79 Years | 28 (1.3%) | 103 (4.9%) |
| 80 to 84 Years | 49 (2.2%) | 59 (2.8%) |
| 85 Years and over | 20 (0.9%) | 26 (1.2%) |
| Total | 2,180 (100.0%) | 2,103 (100.0%) |
Families and Households in Slatington borough
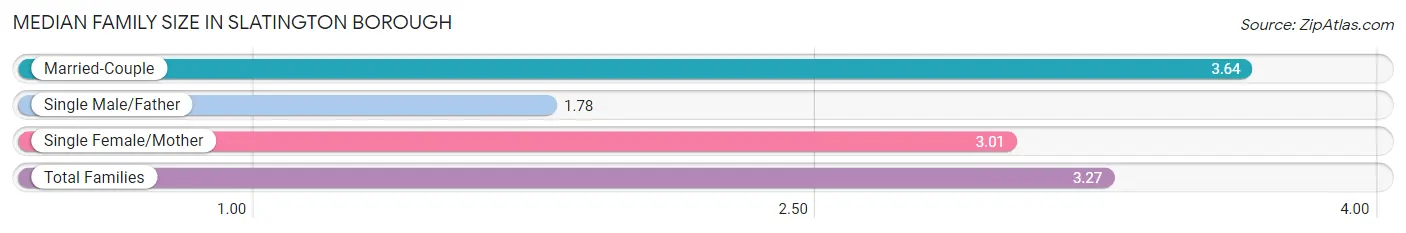
Median Family Size in Slatington borough
The median family size in Slatington borough is 3.27 persons per family, with married-couple families (661 | 62.9%) accounting for the largest median family size of 3.64 persons per family. On the other hand, single male/father families (116 | 11.0%) represent the smallest median family size with 1.78 persons per family.
| Family Type | # Families | Family Size |
| Married-Couple | 661 (62.9%) | 3.64 |
| Single Male/Father | 116 (11.0%) | 1.78 |
| Single Female/Mother | 274 (26.1%) | 3.01 |
| Total Families | 1,051 (100.0%) | 3.27 |
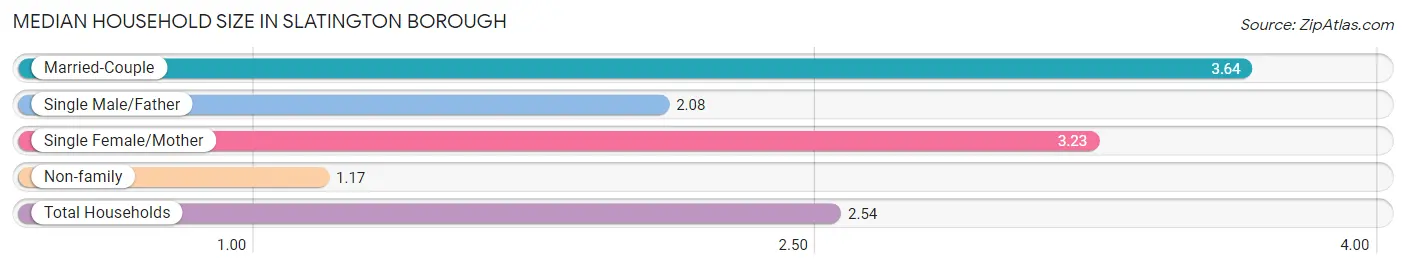
Median Household Size in Slatington borough
The median household size in Slatington borough is 2.54 persons per household, with married-couple households (661 | 39.3%) accounting for the largest median household size of 3.64 persons per household. non-family households (630 | 37.5%) represent the smallest median household size with 1.17 persons per household.
| Household Type | # Households | Household Size |
| Married-Couple | 661 (39.3%) | 3.64 |
| Single Male/Father | 116 (6.9%) | 2.08 |
| Single Female/Mother | 274 (16.3%) | 3.23 |
| Non-family | 630 (37.5%) | 1.17 |
| Total Households | 1,681 (100.0%) | 2.54 |
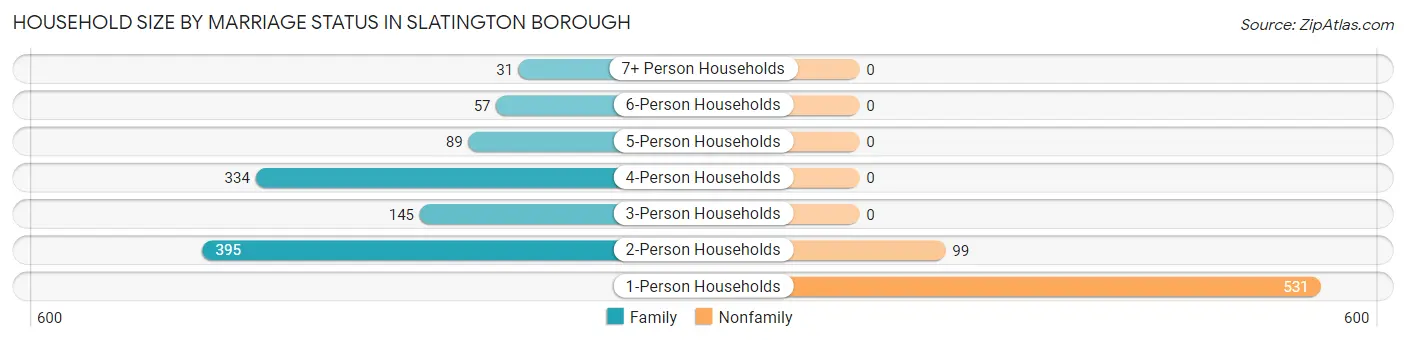
Household Size by Marriage Status in Slatington borough
Out of a total of 1,681 households in Slatington borough, 1,051 (62.5%) are family households, while 630 (37.5%) are nonfamily households. The most numerous type of family households are 2-person households, comprising 395, and the most common type of nonfamily households are 1-person households, comprising 531.
| Household Size | Family Households | Nonfamily Households |
| 1-Person Households | - | 531 (31.6%) |
| 2-Person Households | 395 (23.5%) | 99 (5.9%) |
| 3-Person Households | 145 (8.6%) | 0 (0.0%) |
| 4-Person Households | 334 (19.9%) | 0 (0.0%) |
| 5-Person Households | 89 (5.3%) | 0 (0.0%) |
| 6-Person Households | 57 (3.4%) | 0 (0.0%) |
| 7+ Person Households | 31 (1.8%) | 0 (0.0%) |
| Total | 1,051 (62.5%) | 630 (37.5%) |
Female Fertility in Slatington borough
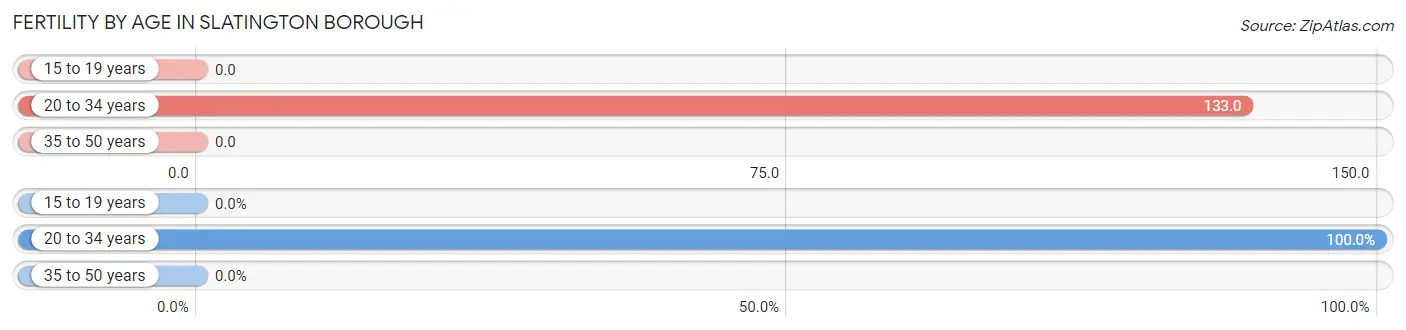
Fertility by Age in Slatington borough
Average fertility rate in Slatington borough is 66.0 births per 1,000 women. Women in the age bracket of 20 to 34 years have the highest fertility rate with 133.0 births per 1,000 women. Women in the age bracket of 20 to 34 years acount for 100.0% of all women with births.
| Age Bracket | Women with Births | Births / 1,000 Women |
| 15 to 19 years | 0 (0.0%) | 0.0 |
| 20 to 34 years | 62 (100.0%) | 133.0 |
| 35 to 50 years | 0 (0.0%) | 0.0 |
| Total | 62 (100.0%) | 66.0 |
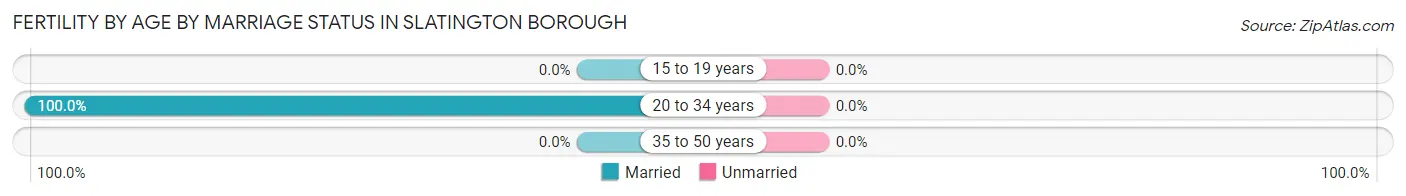
Fertility by Age by Marriage Status in Slatington borough
| Age Bracket | Married | Unmarried |
| 15 to 19 years | 0 (0.0%) | 0 (0.0%) |
| 20 to 34 years | 62 (100.0%) | 0 (0.0%) |
| 35 to 50 years | 0 (0.0%) | 0 (0.0%) |
| Total | 62 (100.0%) | 0 (0.0%) |
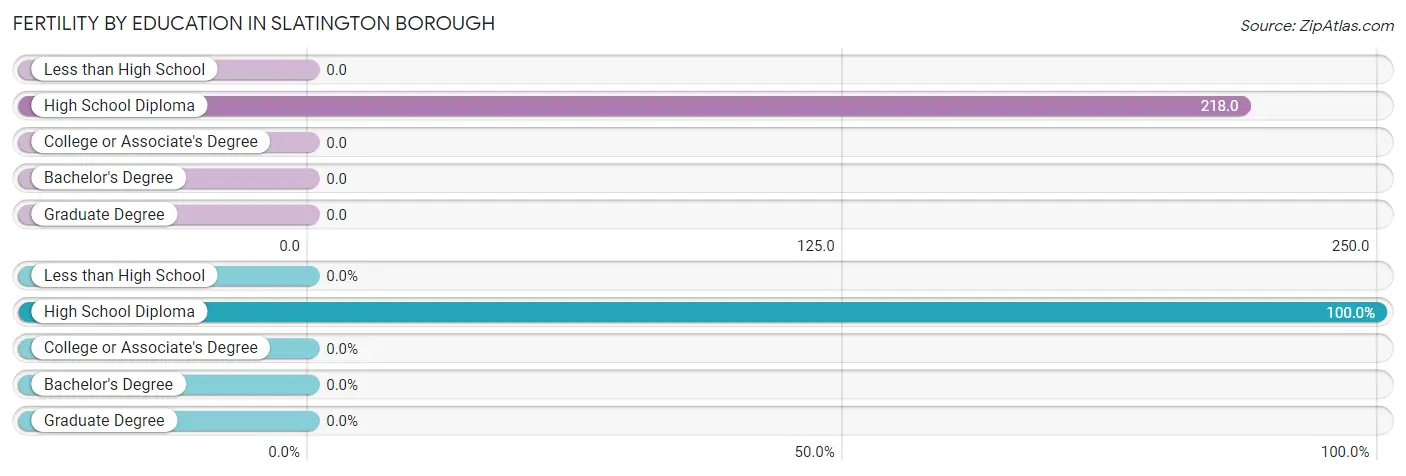
Fertility by Education in Slatington borough
| Educational Attainment | Women with Births | Births / 1,000 Women |
| Less than High School | 0 (0.0%) | 0.0 |
| High School Diploma | 62 (100.0%) | 218.0 |
| College or Associate's Degree | 0 (0.0%) | 0.0 |
| Bachelor's Degree | 0 (0.0%) | 0.0 |
| Graduate Degree | 0 (0.0%) | 0.0 |
| Total | 62 (100.0%) | 66.0 |
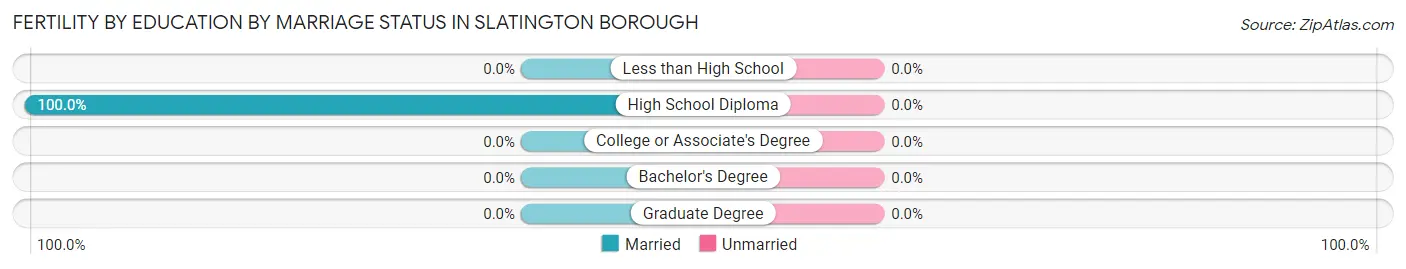
Fertility by Education by Marriage Status in Slatington borough
| Educational Attainment | Married | Unmarried |
| Less than High School | 0 (0.0%) | 0 (0.0%) |
| High School Diploma | 62 (100.0%) | 0 (0.0%) |
| College or Associate's Degree | 0 (0.0%) | 0 (0.0%) |
| Bachelor's Degree | 0 (0.0%) | 0 (0.0%) |
| Graduate Degree | 0 (0.0%) | 0 (0.0%) |
| Total | 62 (100.0%) | 0 (0.0%) |
Employment Characteristics in Slatington borough
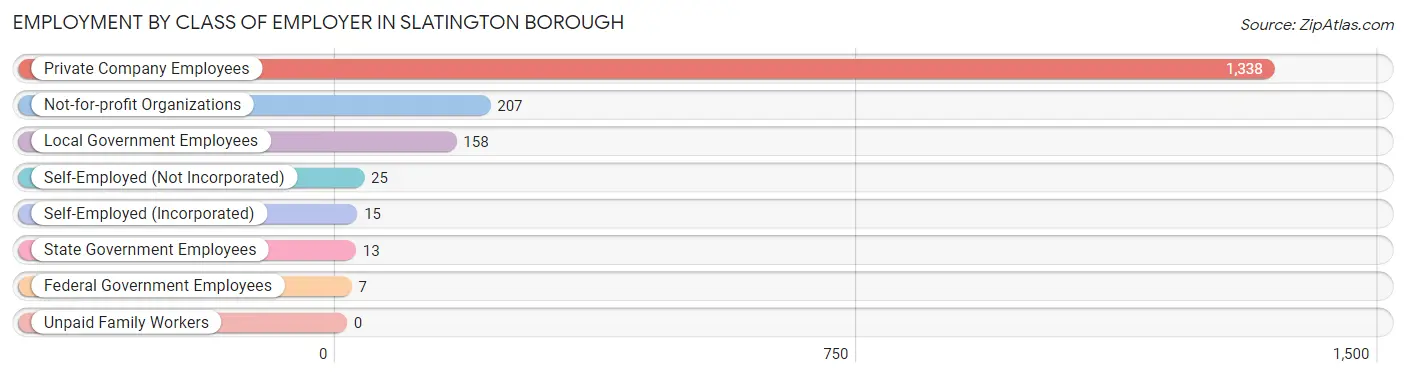
Employment by Class of Employer in Slatington borough
Among the 1,763 employed individuals in Slatington borough, private company employees (1,338 | 75.9%), not-for-profit organizations (207 | 11.7%), and local government employees (158 | 9.0%) make up the most common classes of employment.
| Employer Class | # Employees | % Employees |
| Private Company Employees | 1,338 | 75.9% |
| Self-Employed (Incorporated) | 15 | 0.9% |
| Self-Employed (Not Incorporated) | 25 | 1.4% |
| Not-for-profit Organizations | 207 | 11.7% |
| Local Government Employees | 158 | 9.0% |
| State Government Employees | 13 | 0.7% |
| Federal Government Employees | 7 | 0.4% |
| Unpaid Family Workers | 0 | 0.0% |
| Total | 1,763 | 100.0% |
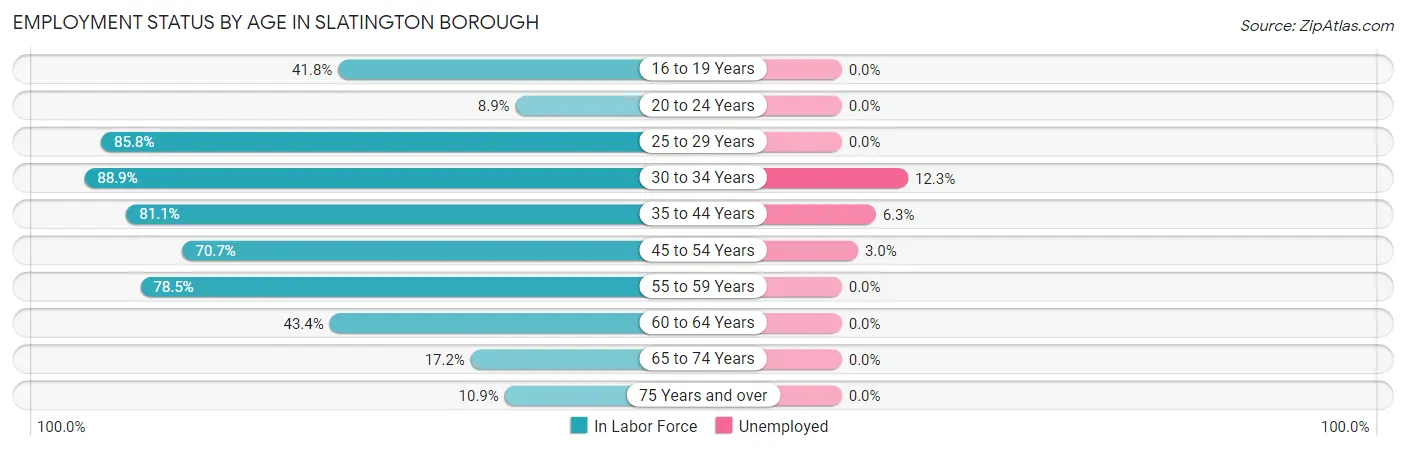
Employment Status by Age in Slatington borough
According to the labor force statistics for Slatington borough, out of the total population over 16 years of age (3,096), 59.8% or 1,851 individuals are in the labor force, with 4.8% or 89 of them unemployed. The age group with the highest labor force participation rate is 30 to 34 years, with 88.9% or 423 individuals in the labor force. Within the labor force, the 30 to 34 years age range has the highest percentage of unemployed individuals, with 12.3% or 52 of them being unemployed.
| Age Bracket | In Labor Force | Unemployed |
| 16 to 19 Years | 28 (41.8%) | 0 (0.0%) |
| 20 to 24 Years | 10 (8.9%) | 0 (0.0%) |
| 25 to 29 Years | 260 (85.8%) | 0 (0.0%) |
| 30 to 34 Years | 423 (88.9%) | 52 (12.3%) |
| 35 to 44 Years | 459 (81.1%) | 29 (6.3%) |
| 45 to 54 Years | 263 (70.7%) | 8 (3.0%) |
| 55 to 59 Years | 234 (78.5%) | 0 (0.0%) |
| 60 to 64 Years | 63 (43.4%) | 0 (0.0%) |
| 65 to 74 Years | 81 (17.2%) | 0 (0.0%) |
| 75 Years and over | 31 (10.9%) | 0 (0.0%) |
| Total | 1,851 (59.8%) | 89 (4.8%) |
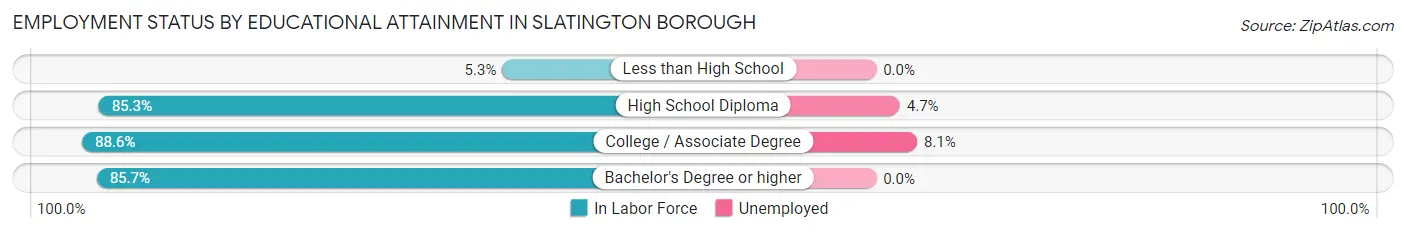
Employment Status by Educational Attainment in Slatington borough
According to labor force statistics for Slatington borough, 78.8% of individuals (1,702) out of the total population between 25 and 64 years of age (2,160) are in the labor force, with 5.2% or 89 of them being unemployed. The group with the highest labor force participation rate are those with the educational attainment of college / associate degree, with 88.6% or 670 individuals in the labor force. Within the labor force, individuals with college / associate degree education have the highest percentage of unemployment, with 8.1% or 54 of them being unemployed.
| Educational Attainment | In Labor Force | Unemployed |
| Less than High School | 11 (5.3%) | 0 (0.0%) |
| High School Diploma | 745 (85.3%) | 41 (4.7%) |
| College / Associate Degree | 670 (88.6%) | 61 (8.1%) |
| Bachelor's Degree or higher | 276 (85.7%) | 0 (0.0%) |
| Total | 1,702 (78.8%) | 112 (5.2%) |
Employment Occupations by Sex in Slatington borough
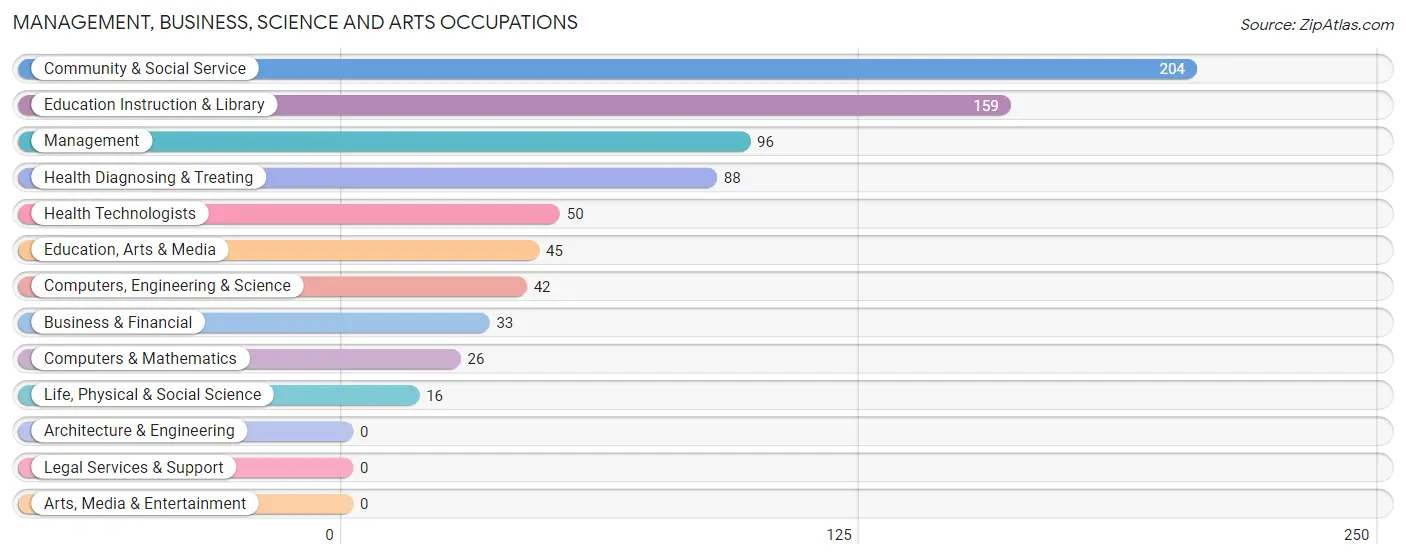
Management, Business, Science and Arts Occupations
The most common Management, Business, Science and Arts occupations in Slatington borough are Community & Social Service (204 | 11.6%), Education Instruction & Library (159 | 9.0%), Management (96 | 5.4%), Health Diagnosing & Treating (88 | 5.0%), and Health Technologists (50 | 2.8%).
Management, Business, Science and Arts Occupations by Sex
Within the Management, Business, Science and Arts occupations in Slatington borough, the most male-oriented occupations are Life, Physical & Social Science (100.0%), Business & Financial (87.9%), and Computers, Engineering & Science (69.1%), while the most female-oriented occupations are Health Diagnosing & Treating (93.2%), Health Technologists (88.0%), and Education, Arts & Media (77.8%).
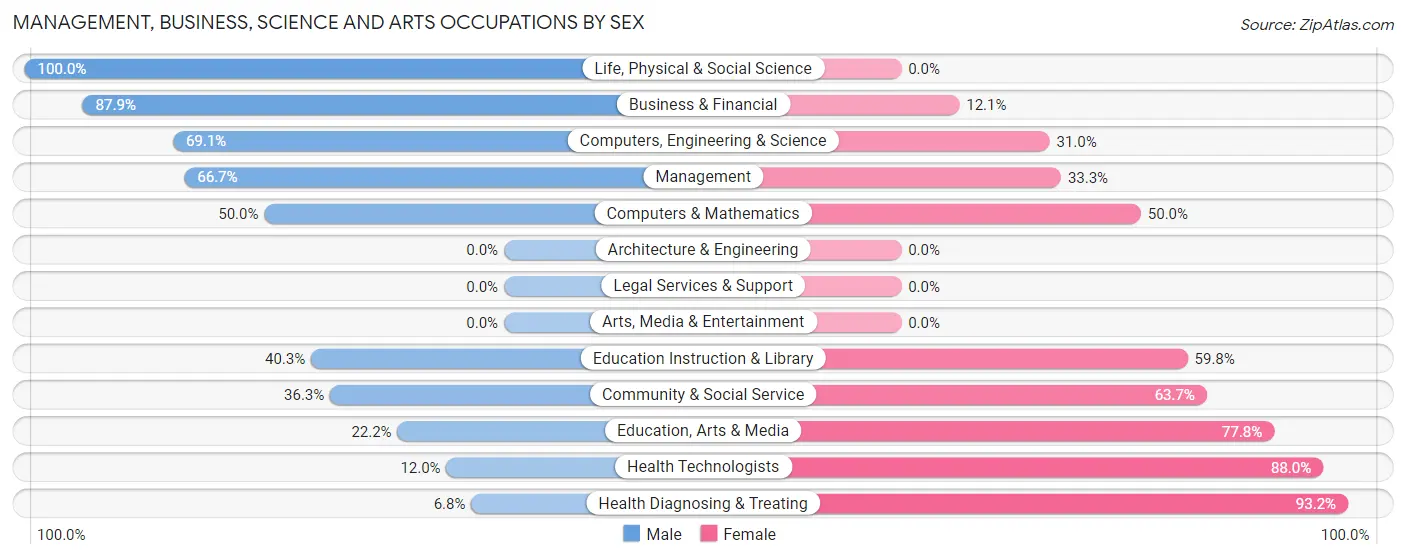
| Occupation | Male | Female |
| Management | 64 (66.7%) | 32 (33.3%) |
| Business & Financial | 29 (87.9%) | 4 (12.1%) |
| Computers, Engineering & Science | 29 (69.1%) | 13 (30.9%) |
| Computers & Mathematics | 13 (50.0%) | 13 (50.0%) |
| Architecture & Engineering | 0 (0.0%) | 0 (0.0%) |
| Life, Physical & Social Science | 16 (100.0%) | 0 (0.0%) |
| Community & Social Service | 74 (36.3%) | 130 (63.7%) |
| Education, Arts & Media | 10 (22.2%) | 35 (77.8%) |
| Legal Services & Support | 0 (0.0%) | 0 (0.0%) |
| Education Instruction & Library | 64 (40.3%) | 95 (59.8%) |
| Arts, Media & Entertainment | 0 (0.0%) | 0 (0.0%) |
| Health Diagnosing & Treating | 6 (6.8%) | 82 (93.2%) |
| Health Technologists | 6 (12.0%) | 44 (88.0%) |
| Total (Category) | 202 (43.6%) | 261 (56.4%) |
| Total (Overall) | 963 (54.6%) | 800 (45.4%) |
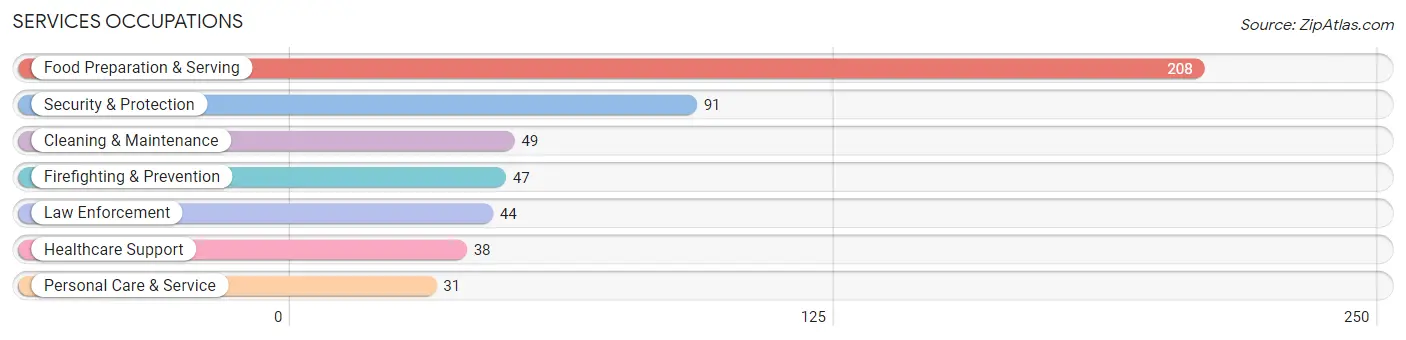
Services Occupations
The most common Services occupations in Slatington borough are Food Preparation & Serving (208 | 11.8%), Security & Protection (91 | 5.2%), Cleaning & Maintenance (49 | 2.8%), Firefighting & Prevention (47 | 2.7%), and Law Enforcement (44 | 2.5%).
Services Occupations by Sex
Within the Services occupations in Slatington borough, the most male-oriented occupations are Law Enforcement (100.0%), Cleaning & Maintenance (79.6%), and Security & Protection (74.7%), while the most female-oriented occupations are Personal Care & Service (100.0%), Healthcare Support (73.7%), and Food Preparation & Serving (52.9%).
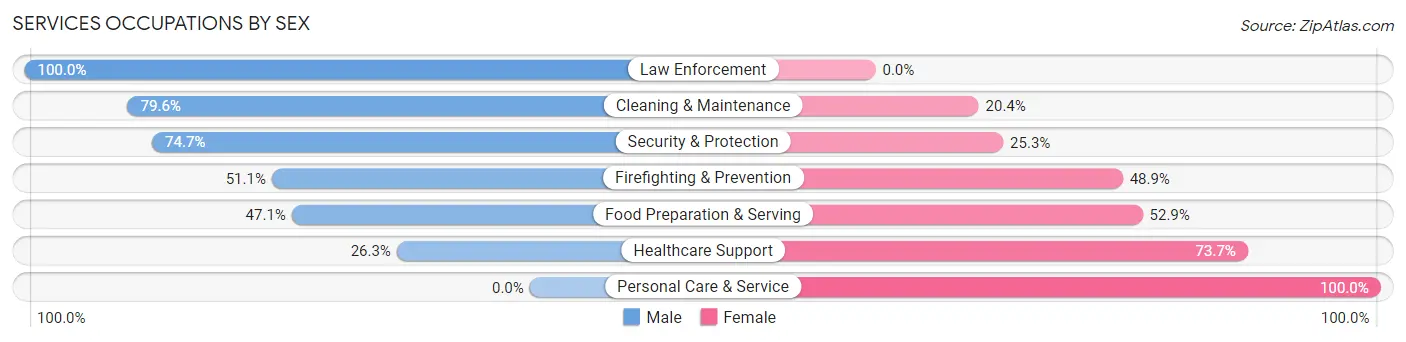
| Occupation | Male | Female |
| Healthcare Support | 10 (26.3%) | 28 (73.7%) |
| Security & Protection | 68 (74.7%) | 23 (25.3%) |
| Firefighting & Prevention | 24 (51.1%) | 23 (48.9%) |
| Law Enforcement | 44 (100.0%) | 0 (0.0%) |
| Food Preparation & Serving | 98 (47.1%) | 110 (52.9%) |
| Cleaning & Maintenance | 39 (79.6%) | 10 (20.4%) |
| Personal Care & Service | 0 (0.0%) | 31 (100.0%) |
| Total (Category) | 215 (51.6%) | 202 (48.4%) |
| Total (Overall) | 963 (54.6%) | 800 (45.4%) |
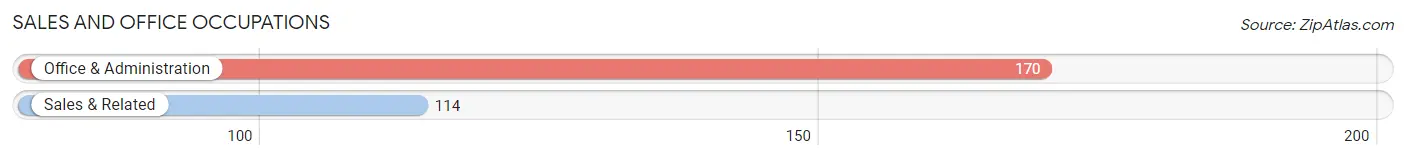
Sales and Office Occupations
The most common Sales and Office occupations in Slatington borough are Office & Administration (170 | 9.6%), and Sales & Related (114 | 6.5%).
Sales and Office Occupations by Sex
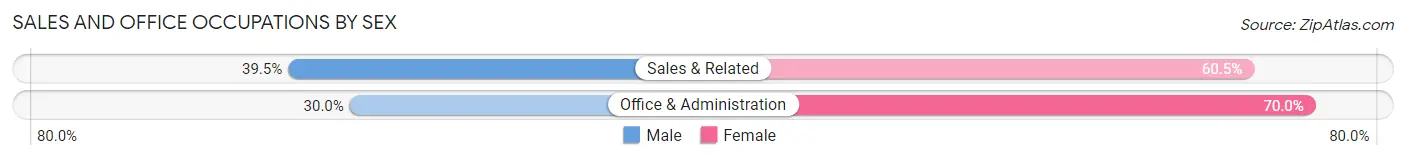
| Occupation | Male | Female |
| Sales & Related | 45 (39.5%) | 69 (60.5%) |
| Office & Administration | 51 (30.0%) | 119 (70.0%) |
| Total (Category) | 96 (33.8%) | 188 (66.2%) |
| Total (Overall) | 963 (54.6%) | 800 (45.4%) |
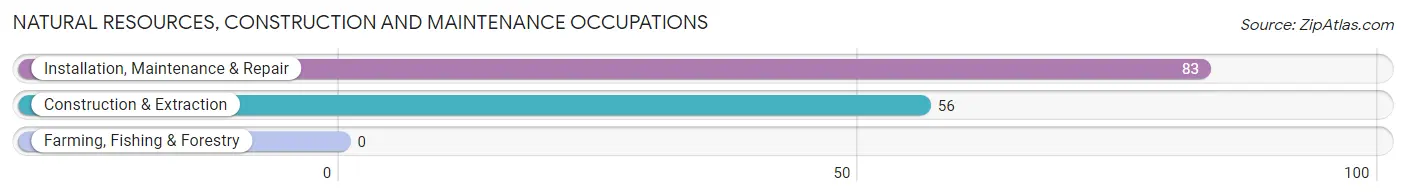
Natural Resources, Construction and Maintenance Occupations
The most common Natural Resources, Construction and Maintenance occupations in Slatington borough are Installation, Maintenance & Repair (83 | 4.7%), and Construction & Extraction (56 | 3.2%).
Natural Resources, Construction and Maintenance Occupations by Sex
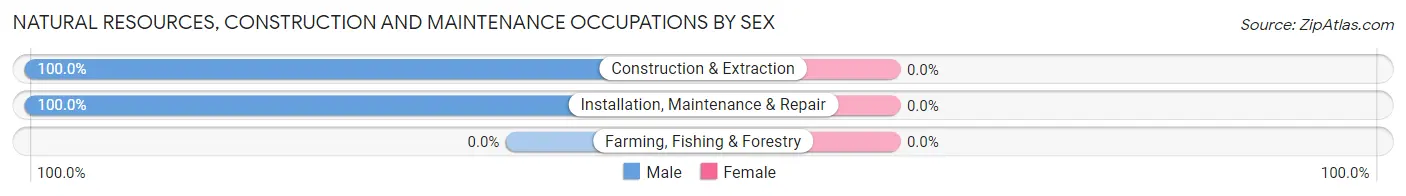
| Occupation | Male | Female |
| Farming, Fishing & Forestry | 0 (0.0%) | 0 (0.0%) |
| Construction & Extraction | 56 (100.0%) | 0 (0.0%) |
| Installation, Maintenance & Repair | 83 (100.0%) | 0 (0.0%) |
| Total (Category) | 139 (100.0%) | 0 (0.0%) |
| Total (Overall) | 963 (54.6%) | 800 (45.4%) |
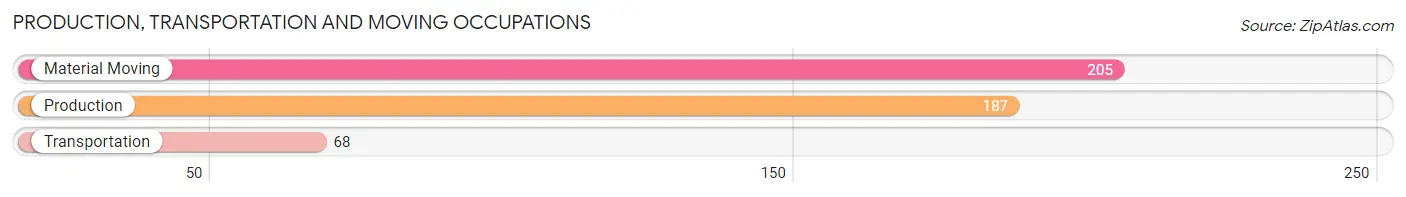
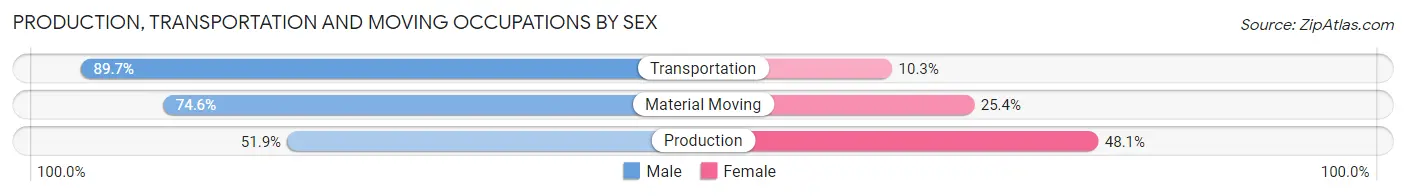
Production, Transportation and Moving Occupations
The most common Production, Transportation and Moving occupations in Slatington borough are Material Moving (205 | 11.6%), Production (187 | 10.6%), and Transportation (68 | 3.9%).
Production, Transportation and Moving Occupations by Sex
| Occupation | Male | Female |
| Production | 97 (51.9%) | 90 (48.1%) |
| Transportation | 61 (89.7%) | 7 (10.3%) |
| Material Moving | 153 (74.6%) | 52 (25.4%) |
| Total (Category) | 311 (67.6%) | 149 (32.4%) |
| Total (Overall) | 963 (54.6%) | 800 (45.4%) |
Employment Industries by Sex in Slatington borough
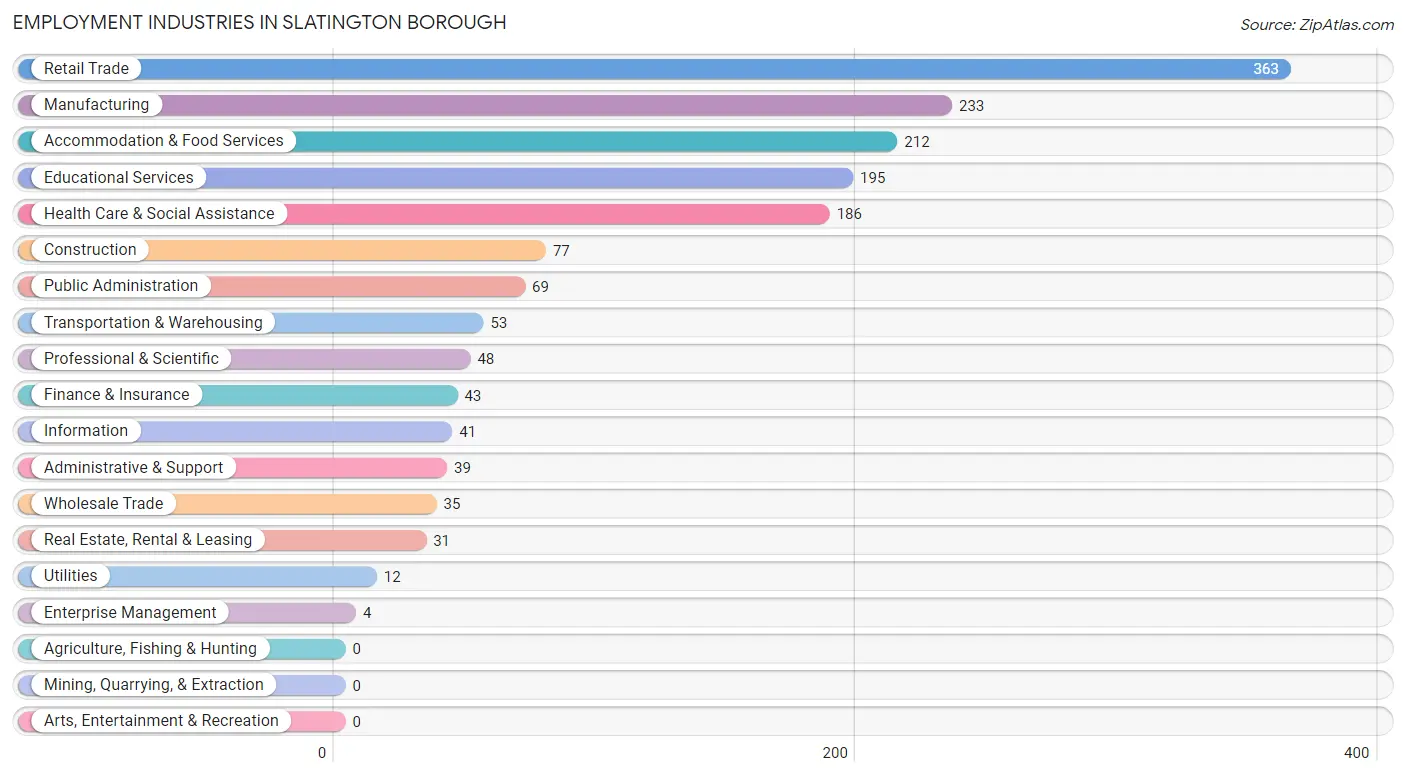
Employment Industries in Slatington borough
The major employment industries in Slatington borough include Retail Trade (363 | 20.6%), Manufacturing (233 | 13.2%), Accommodation & Food Services (212 | 12.0%), Educational Services (195 | 11.1%), and Health Care & Social Assistance (186 | 10.5%).
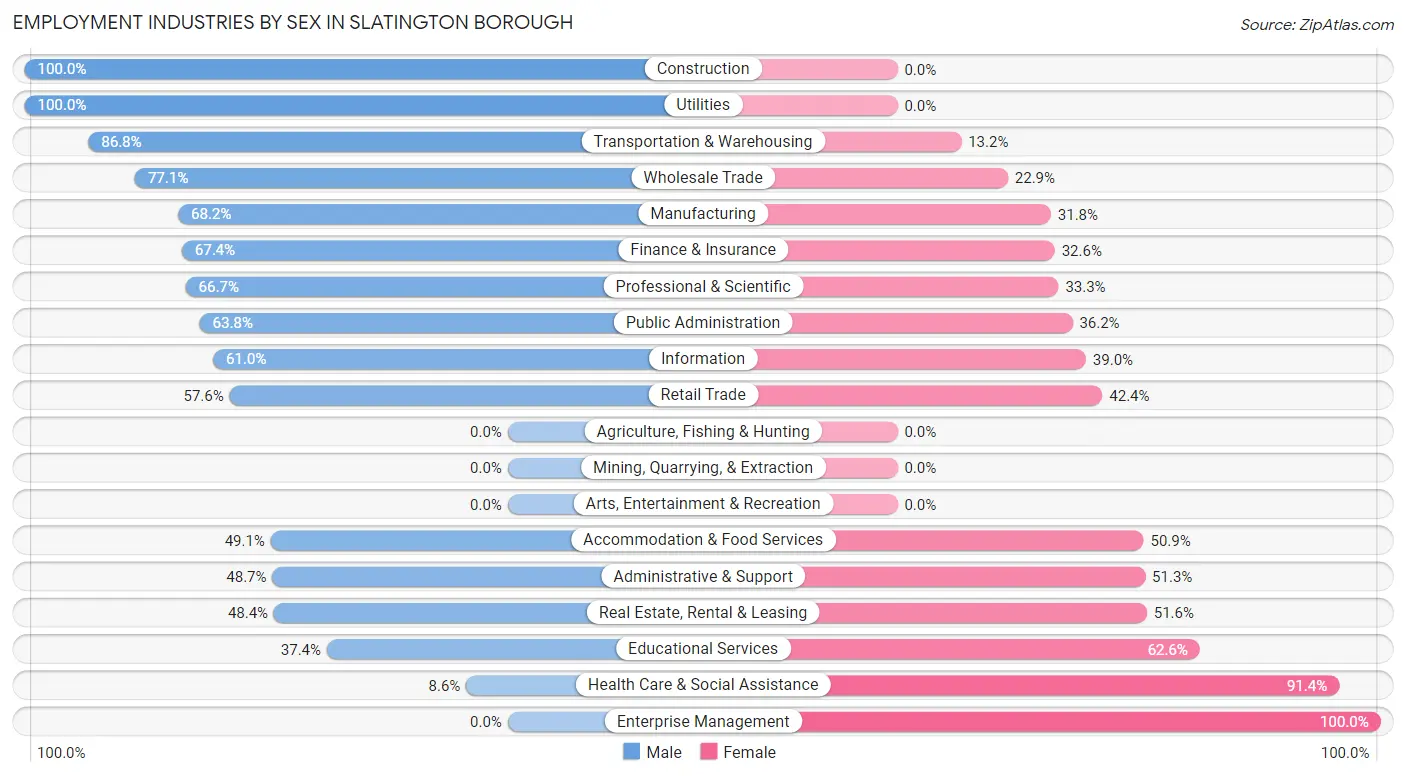
Employment Industries by Sex in Slatington borough
The Slatington borough industries that see more men than women are Construction (100.0%), Utilities (100.0%), and Transportation & Warehousing (86.8%), whereas the industries that tend to have a higher number of women are Enterprise Management (100.0%), Health Care & Social Assistance (91.4%), and Educational Services (62.6%).
| Industry | Male | Female |
| Agriculture, Fishing & Hunting | 0 (0.0%) | 0 (0.0%) |
| Mining, Quarrying, & Extraction | 0 (0.0%) | 0 (0.0%) |
| Construction | 77 (100.0%) | 0 (0.0%) |
| Manufacturing | 159 (68.2%) | 74 (31.8%) |
| Wholesale Trade | 27 (77.1%) | 8 (22.9%) |
| Retail Trade | 209 (57.6%) | 154 (42.4%) |
| Transportation & Warehousing | 46 (86.8%) | 7 (13.2%) |
| Utilities | 12 (100.0%) | 0 (0.0%) |
| Information | 25 (61.0%) | 16 (39.0%) |
| Finance & Insurance | 29 (67.4%) | 14 (32.6%) |
| Real Estate, Rental & Leasing | 15 (48.4%) | 16 (51.6%) |
| Professional & Scientific | 32 (66.7%) | 16 (33.3%) |
| Enterprise Management | 0 (0.0%) | 4 (100.0%) |
| Administrative & Support | 19 (48.7%) | 20 (51.3%) |
| Educational Services | 73 (37.4%) | 122 (62.6%) |
| Health Care & Social Assistance | 16 (8.6%) | 170 (91.4%) |
| Arts, Entertainment & Recreation | 0 (0.0%) | 0 (0.0%) |
| Accommodation & Food Services | 104 (49.1%) | 108 (50.9%) |
| Public Administration | 44 (63.8%) | 25 (36.2%) |
| Total | 963 (54.6%) | 800 (45.4%) |
Education in Slatington borough
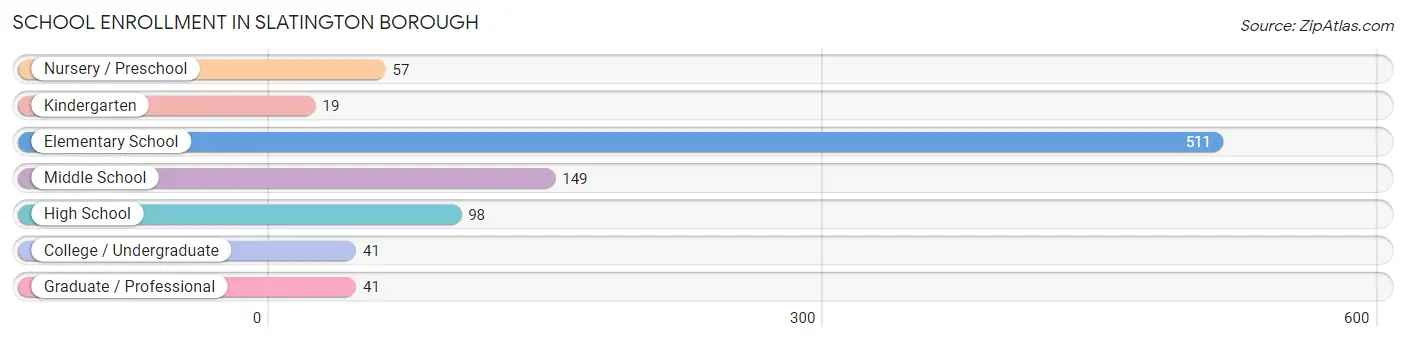
School Enrollment in Slatington borough
The most common levels of schooling among the 916 students in Slatington borough are elementary school (511 | 55.8%), middle school (149 | 16.3%), and high school (98 | 10.7%).
| School Level | # Students | % Students |
| Nursery / Preschool | 57 | 6.2% |
| Kindergarten | 19 | 2.1% |
| Elementary School | 511 | 55.8% |
| Middle School | 149 | 16.3% |
| High School | 98 | 10.7% |
| College / Undergraduate | 41 | 4.5% |
| Graduate / Professional | 41 | 4.5% |
| Total | 916 | 100.0% |
School Enrollment by Age by Funding Source in Slatington borough
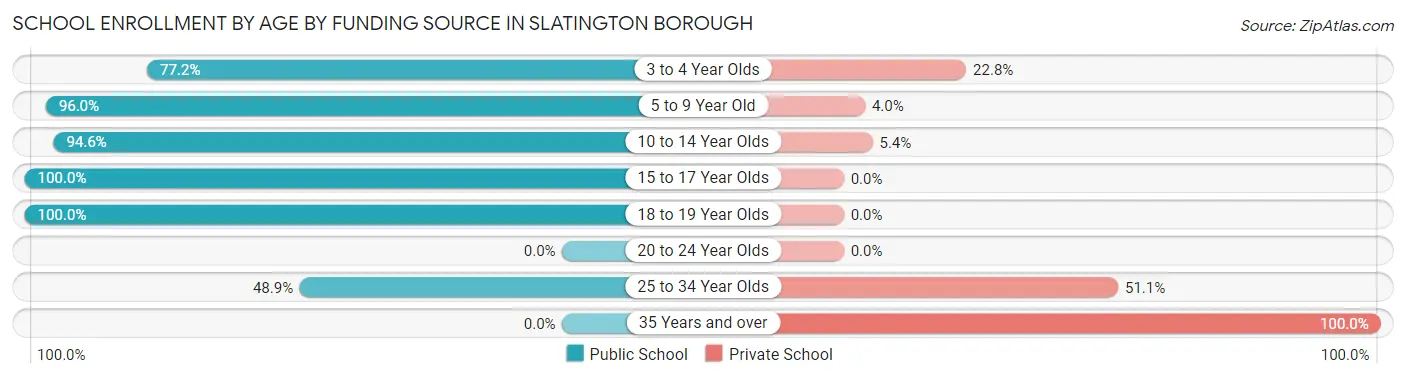
Out of a total of 916 students who are enrolled in schools in Slatington borough, 79 (8.6%) attend a private institution, while the remaining 837 (91.4%) are enrolled in public schools. The age group of 35 years and over has the highest likelihood of being enrolled in private schools, with 11 (100.0% in the age bracket) enrolled. Conversely, the age group of 15 to 17 year olds has the lowest likelihood of being enrolled in a private school, with 50 (100.0% in the age bracket) attending a public institution.
| Age Bracket | Public School | Private School |
| 3 to 4 Year Olds | 44 (77.2%) | 13 (22.8%) |
| 5 to 9 Year Old | 484 (96.0%) | 20 (4.0%) |
| 10 to 14 Year Olds | 211 (94.6%) | 12 (5.4%) |
| 15 to 17 Year Olds | 50 (100.0%) | 0 (0.0%) |
| 18 to 19 Year Olds | 26 (100.0%) | 0 (0.0%) |
| 20 to 24 Year Olds | 0 (0.0%) | 0 (0.0%) |
| 25 to 34 Year Olds | 22 (48.9%) | 23 (51.1%) |
| 35 Years and over | 0 (0.0%) | 11 (100.0%) |
| Total | 837 (91.4%) | 79 (8.6%) |
Educational Attainment by Field of Study in Slatington borough
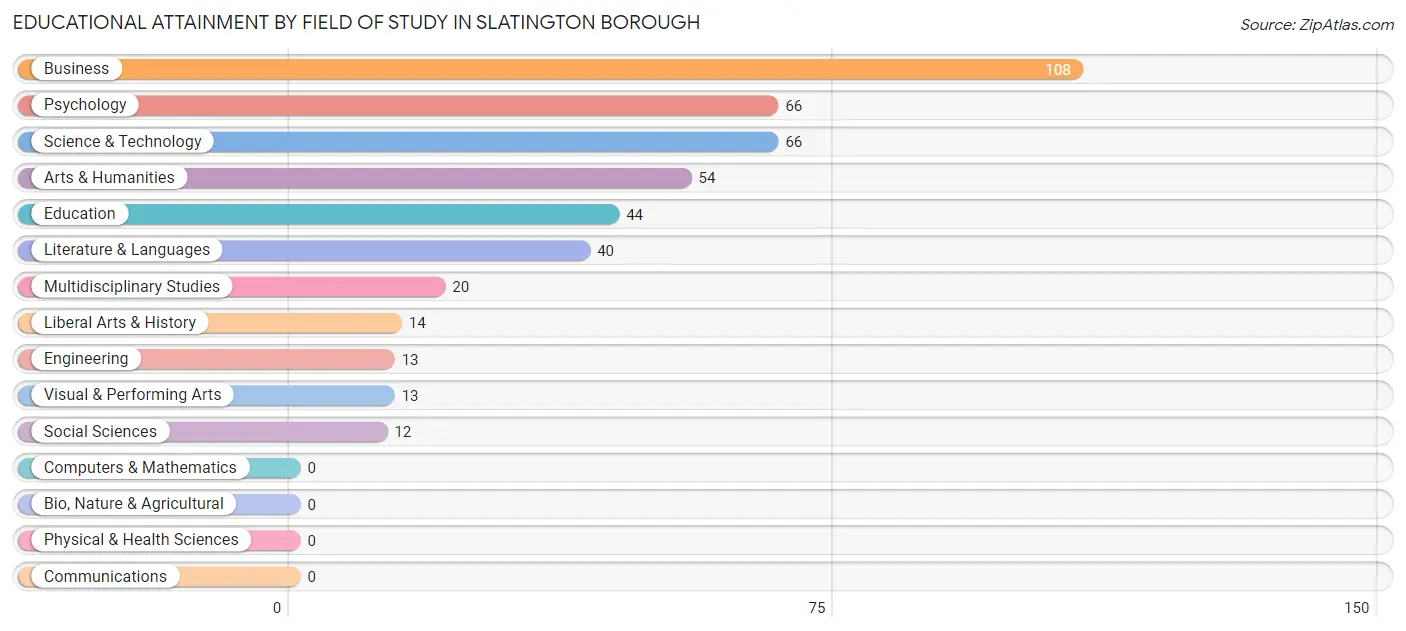
Business (108 | 24.0%), psychology (66 | 14.7%), science & technology (66 | 14.7%), arts & humanities (54 | 12.0%), and education (44 | 9.8%) are the most common fields of study among 450 individuals in Slatington borough who have obtained a bachelor's degree or higher.
| Field of Study | # Graduates | % Graduates |
| Computers & Mathematics | 0 | 0.0% |
| Bio, Nature & Agricultural | 0 | 0.0% |
| Physical & Health Sciences | 0 | 0.0% |
| Psychology | 66 | 14.7% |
| Social Sciences | 12 | 2.7% |
| Engineering | 13 | 2.9% |
| Multidisciplinary Studies | 20 | 4.4% |
| Science & Technology | 66 | 14.7% |
| Business | 108 | 24.0% |
| Education | 44 | 9.8% |
| Literature & Languages | 40 | 8.9% |
| Liberal Arts & History | 14 | 3.1% |
| Visual & Performing Arts | 13 | 2.9% |
| Communications | 0 | 0.0% |
| Arts & Humanities | 54 | 12.0% |
| Total | 450 | 100.0% |
Transportation & Commute in Slatington borough
Vehicle Availability by Sex in Slatington borough
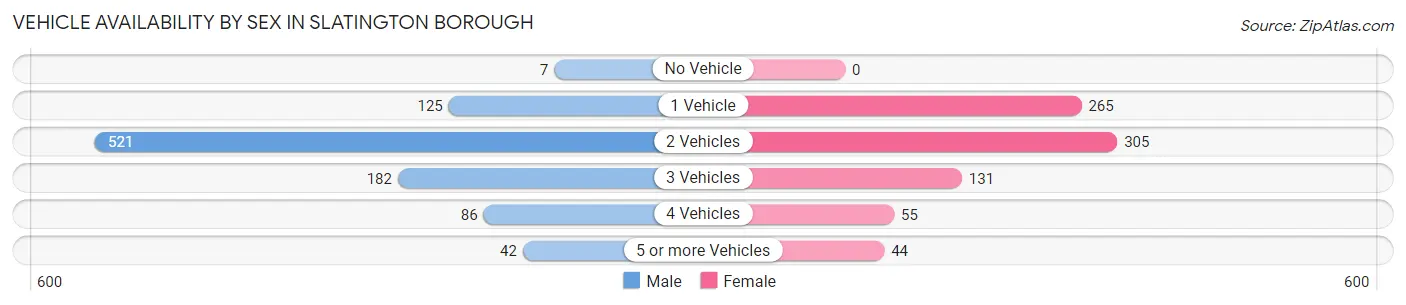
The most prevalent vehicle ownership categories in Slatington borough are males with 2 vehicles (521, accounting for 54.1%) and females with 2 vehicles (305, making up 65.1%).
| Vehicles Available | Male | Female |
| No Vehicle | 7 (0.7%) | 0 (0.0%) |
| 1 Vehicle | 125 (13.0%) | 265 (33.1%) |
| 2 Vehicles | 521 (54.1%) | 305 (38.1%) |
| 3 Vehicles | 182 (18.9%) | 131 (16.4%) |
| 4 Vehicles | 86 (8.9%) | 55 (6.9%) |
| 5 or more Vehicles | 42 (4.4%) | 44 (5.5%) |
| Total | 963 (100.0%) | 800 (100.0%) |
Commute Time in Slatington borough
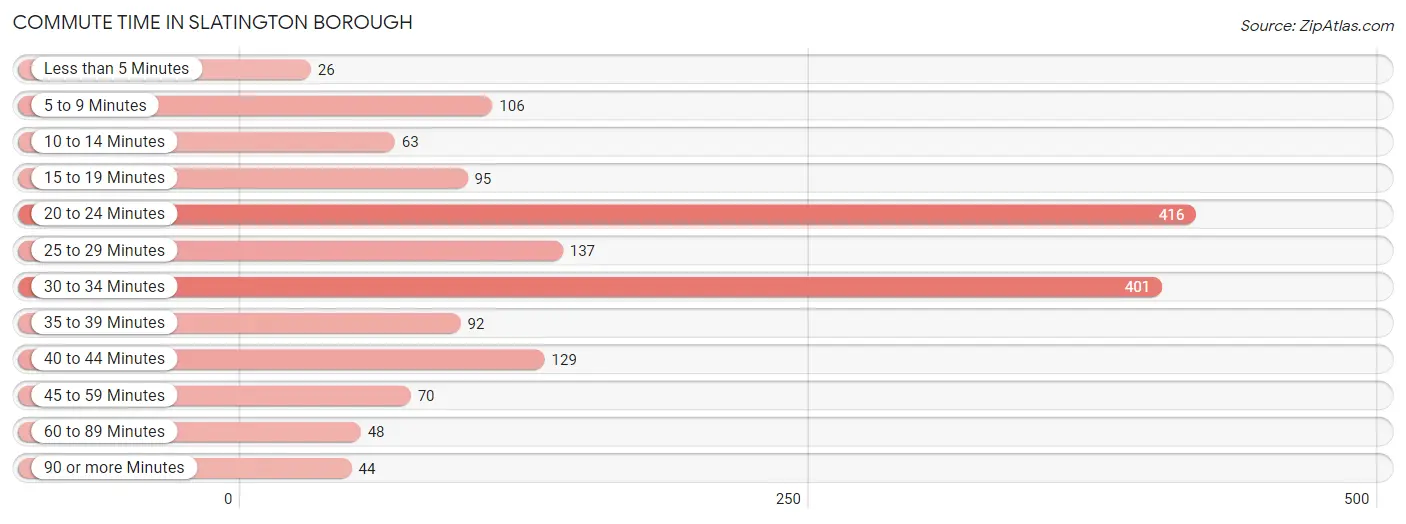
The most frequently occuring commute durations in Slatington borough are 20 to 24 minutes (416 commuters, 25.6%), 30 to 34 minutes (401 commuters, 24.6%), and 25 to 29 minutes (137 commuters, 8.4%).
| Commute Time | # Commuters | % Commuters |
| Less than 5 Minutes | 26 | 1.6% |
| 5 to 9 Minutes | 106 | 6.5% |
| 10 to 14 Minutes | 63 | 3.9% |
| 15 to 19 Minutes | 95 | 5.8% |
| 20 to 24 Minutes | 416 | 25.6% |
| 25 to 29 Minutes | 137 | 8.4% |
| 30 to 34 Minutes | 401 | 24.6% |
| 35 to 39 Minutes | 92 | 5.7% |
| 40 to 44 Minutes | 129 | 7.9% |
| 45 to 59 Minutes | 70 | 4.3% |
| 60 to 89 Minutes | 48 | 2.9% |
| 90 or more Minutes | 44 | 2.7% |
Commute Time by Sex in Slatington borough
The most common commute times in Slatington borough are 30 to 34 minutes (269 commuters, 30.3%) for males and 20 to 24 minutes (214 commuters, 29.0%) for females.
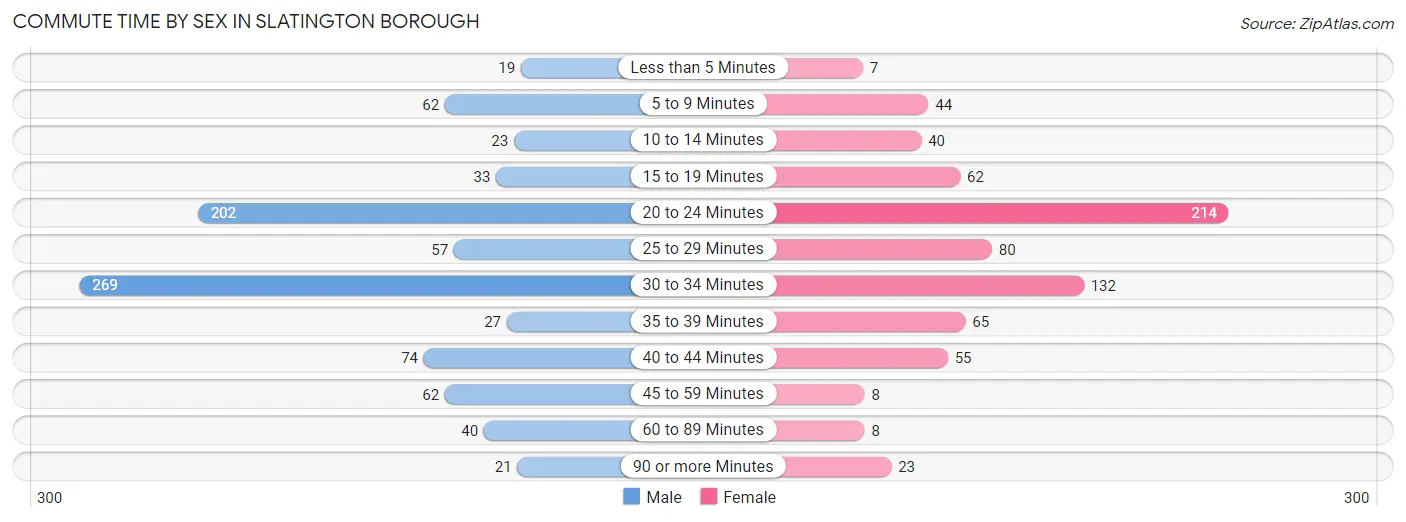
| Commute Time | Male | Female |
| Less than 5 Minutes | 19 (2.1%) | 7 (0.9%) |
| 5 to 9 Minutes | 62 (7.0%) | 44 (6.0%) |
| 10 to 14 Minutes | 23 (2.6%) | 40 (5.4%) |
| 15 to 19 Minutes | 33 (3.7%) | 62 (8.4%) |
| 20 to 24 Minutes | 202 (22.7%) | 214 (29.0%) |
| 25 to 29 Minutes | 57 (6.4%) | 80 (10.8%) |
| 30 to 34 Minutes | 269 (30.3%) | 132 (17.9%) |
| 35 to 39 Minutes | 27 (3.0%) | 65 (8.8%) |
| 40 to 44 Minutes | 74 (8.3%) | 55 (7.4%) |
| 45 to 59 Minutes | 62 (7.0%) | 8 (1.1%) |
| 60 to 89 Minutes | 40 (4.5%) | 8 (1.1%) |
| 90 or more Minutes | 21 (2.4%) | 23 (3.1%) |
Time of Departure to Work by Sex in Slatington borough
The most frequent times of departure to work in Slatington borough are 12:00 AM to 4:59 AM (140, 15.8%) for males and 8:00 AM to 8:29 AM (121, 16.4%) for females.
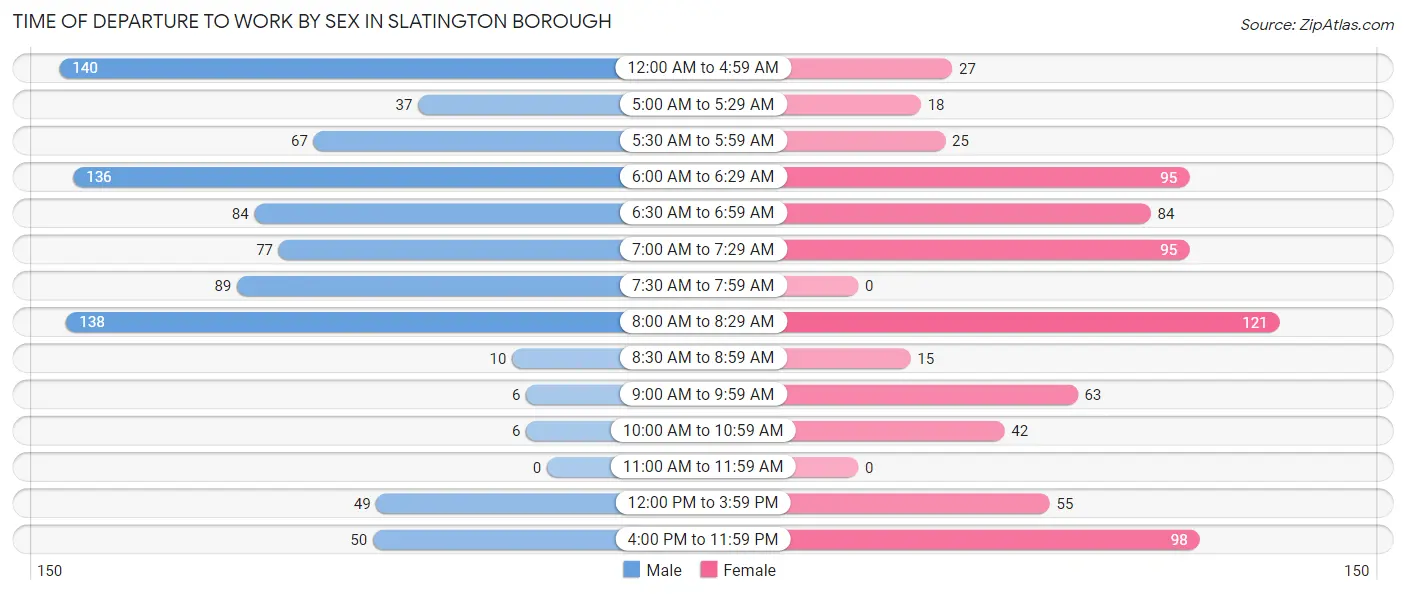
| Time of Departure | Male | Female |
| 12:00 AM to 4:59 AM | 140 (15.8%) | 27 (3.7%) |
| 5:00 AM to 5:29 AM | 37 (4.2%) | 18 (2.4%) |
| 5:30 AM to 5:59 AM | 67 (7.5%) | 25 (3.4%) |
| 6:00 AM to 6:29 AM | 136 (15.3%) | 95 (12.9%) |
| 6:30 AM to 6:59 AM | 84 (9.5%) | 84 (11.4%) |
| 7:00 AM to 7:29 AM | 77 (8.7%) | 95 (12.9%) |
| 7:30 AM to 7:59 AM | 89 (10.0%) | 0 (0.0%) |
| 8:00 AM to 8:29 AM | 138 (15.5%) | 121 (16.4%) |
| 8:30 AM to 8:59 AM | 10 (1.1%) | 15 (2.0%) |
| 9:00 AM to 9:59 AM | 6 (0.7%) | 63 (8.5%) |
| 10:00 AM to 10:59 AM | 6 (0.7%) | 42 (5.7%) |
| 11:00 AM to 11:59 AM | 0 (0.0%) | 0 (0.0%) |
| 12:00 PM to 3:59 PM | 49 (5.5%) | 55 (7.4%) |
| 4:00 PM to 11:59 PM | 50 (5.6%) | 98 (13.3%) |
| Total | 889 (100.0%) | 738 (100.0%) |
Housing Occupancy in Slatington borough
Occupancy by Ownership in Slatington borough
Of the total 1,681 dwellings in Slatington borough, owner-occupied units account for 1,021 (60.7%), while renter-occupied units make up 660 (39.3%).
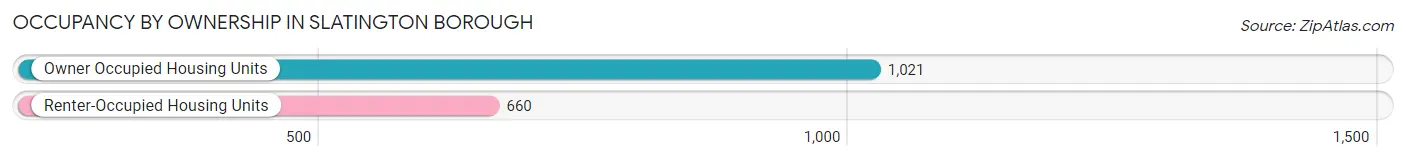
| Occupancy | # Housing Units | % Housing Units |
| Owner Occupied Housing Units | 1,021 | 60.7% |
| Renter-Occupied Housing Units | 660 | 39.3% |
| Total Occupied Housing Units | 1,681 | 100.0% |
Occupancy by Household Size in Slatington borough
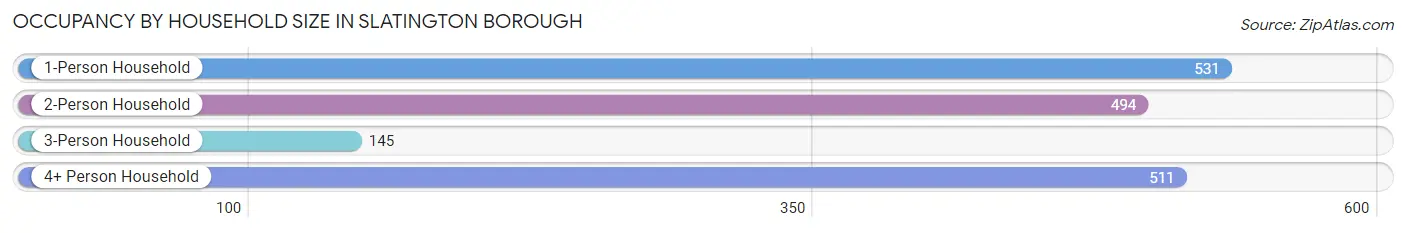
| Household Size | # Housing Units | % Housing Units |
| 1-Person Household | 531 | 31.6% |
| 2-Person Household | 494 | 29.4% |
| 3-Person Household | 145 | 8.6% |
| 4+ Person Household | 511 | 30.4% |
| Total Housing Units | 1,681 | 100.0% |
Occupancy by Ownership by Household Size in Slatington borough
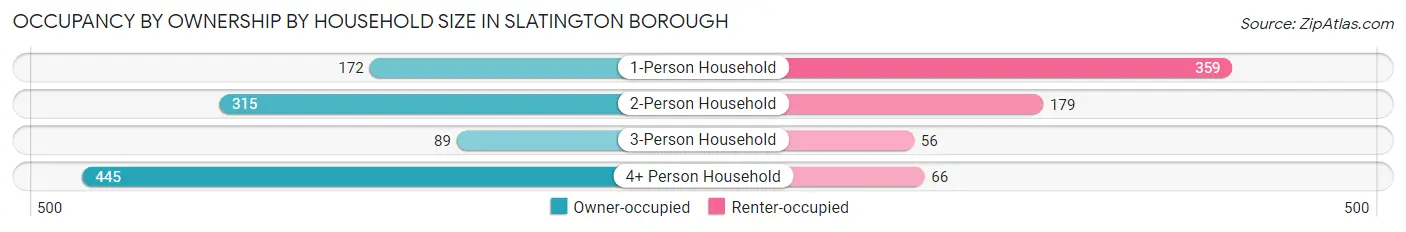
| Household Size | Owner-occupied | Renter-occupied |
| 1-Person Household | 172 (32.4%) | 359 (67.6%) |
| 2-Person Household | 315 (63.8%) | 179 (36.2%) |
| 3-Person Household | 89 (61.4%) | 56 (38.6%) |
| 4+ Person Household | 445 (87.1%) | 66 (12.9%) |
| Total Housing Units | 1,021 (60.7%) | 660 (39.3%) |
Occupancy by Educational Attainment in Slatington borough
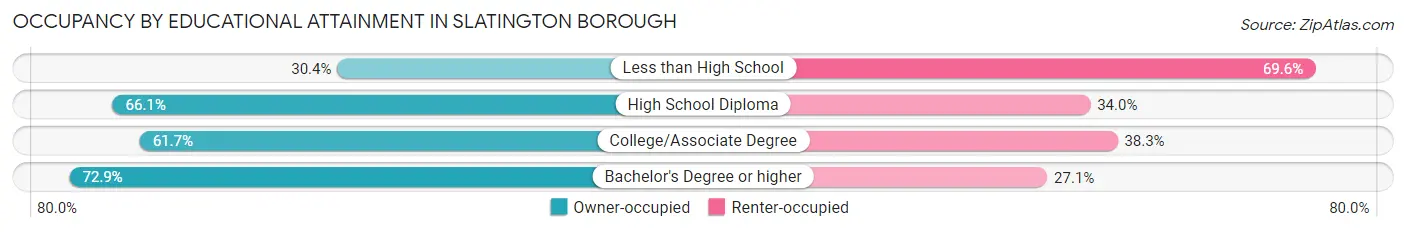
| Household Size | Owner-occupied | Renter-occupied |
| Less than High School | 69 (30.4%) | 158 (69.6%) |
| High School Diploma | 430 (66.0%) | 221 (34.0%) |
| College/Associate Degree | 350 (61.7%) | 217 (38.3%) |
| Bachelor's Degree or higher | 172 (72.9%) | 64 (27.1%) |
Occupancy by Age of Householder in Slatington borough
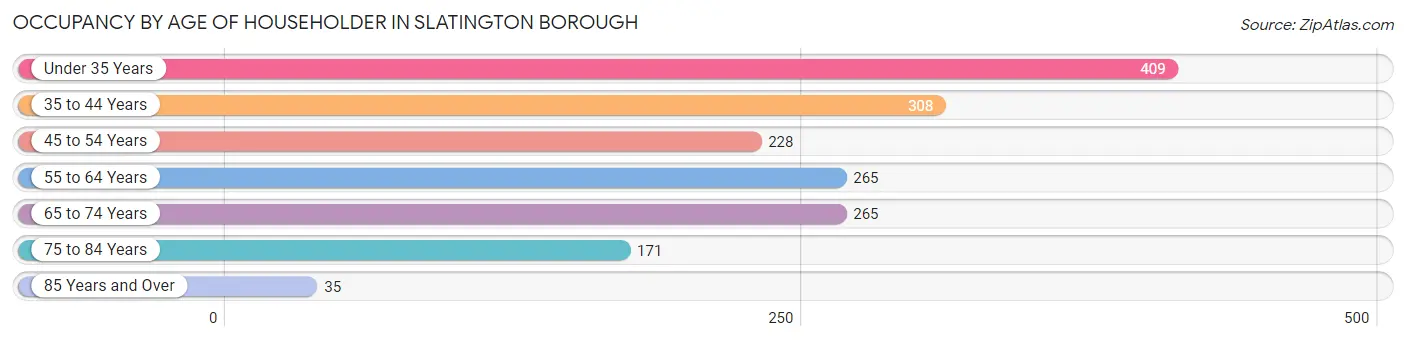
| Age Bracket | # Households | % Households |
| Under 35 Years | 409 | 24.3% |
| 35 to 44 Years | 308 | 18.3% |
| 45 to 54 Years | 228 | 13.6% |
| 55 to 64 Years | 265 | 15.8% |
| 65 to 74 Years | 265 | 15.8% |
| 75 to 84 Years | 171 | 10.2% |
| 85 Years and Over | 35 | 2.1% |
| Total | 1,681 | 100.0% |
Housing Finances in Slatington borough
Median Income by Occupancy in Slatington borough
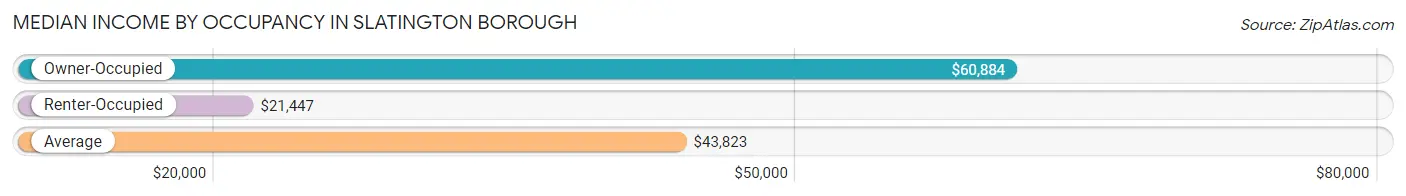
| Occupancy Type | # Households | Median Income |
| Owner-Occupied | 1,021 (60.7%) | $60,884 |
| Renter-Occupied | 660 (39.3%) | $21,447 |
| Average | 1,681 (100.0%) | $43,823 |
Occupancy by Householder Income Bracket in Slatington borough
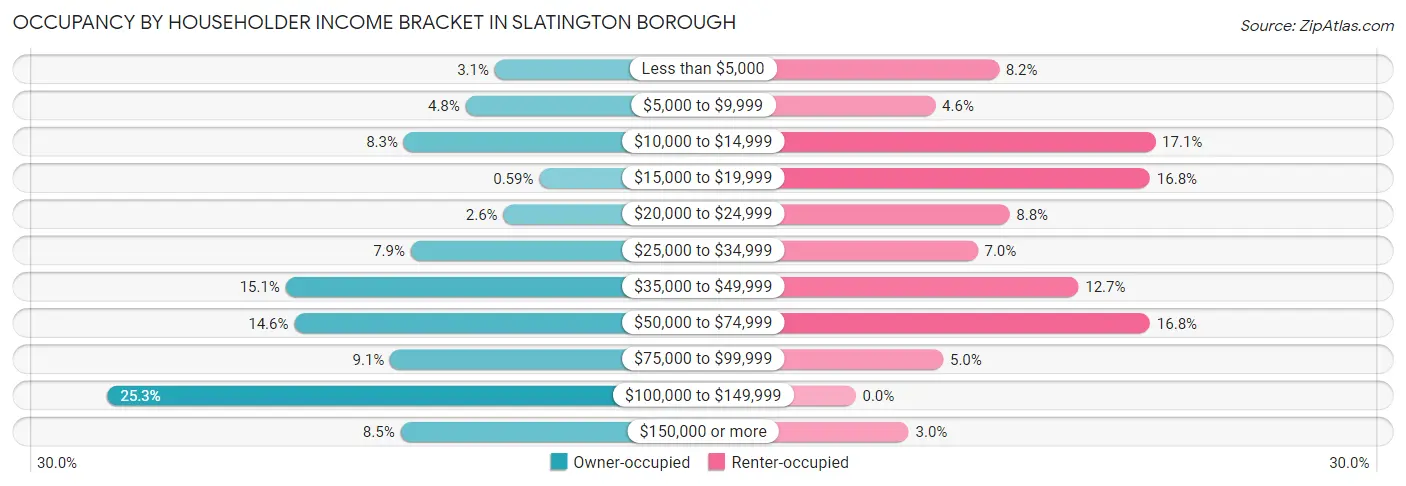
| Income Bracket | Owner-occupied | Renter-occupied |
| Less than $5,000 | 32 (3.1%) | 54 (8.2%) |
| $5,000 to $9,999 | 49 (4.8%) | 30 (4.5%) |
| $10,000 to $14,999 | 85 (8.3%) | 113 (17.1%) |
| $15,000 to $19,999 | 6 (0.6%) | 111 (16.8%) |
| $20,000 to $24,999 | 27 (2.6%) | 58 (8.8%) |
| $25,000 to $34,999 | 81 (7.9%) | 46 (7.0%) |
| $35,000 to $49,999 | 154 (15.1%) | 84 (12.7%) |
| $50,000 to $74,999 | 149 (14.6%) | 111 (16.8%) |
| $75,000 to $99,999 | 93 (9.1%) | 33 (5.0%) |
| $100,000 to $149,999 | 258 (25.3%) | 0 (0.0%) |
| $150,000 or more | 87 (8.5%) | 20 (3.0%) |
| Total | 1,021 (100.0%) | 660 (100.0%) |
Monthly Housing Cost Tiers in Slatington borough
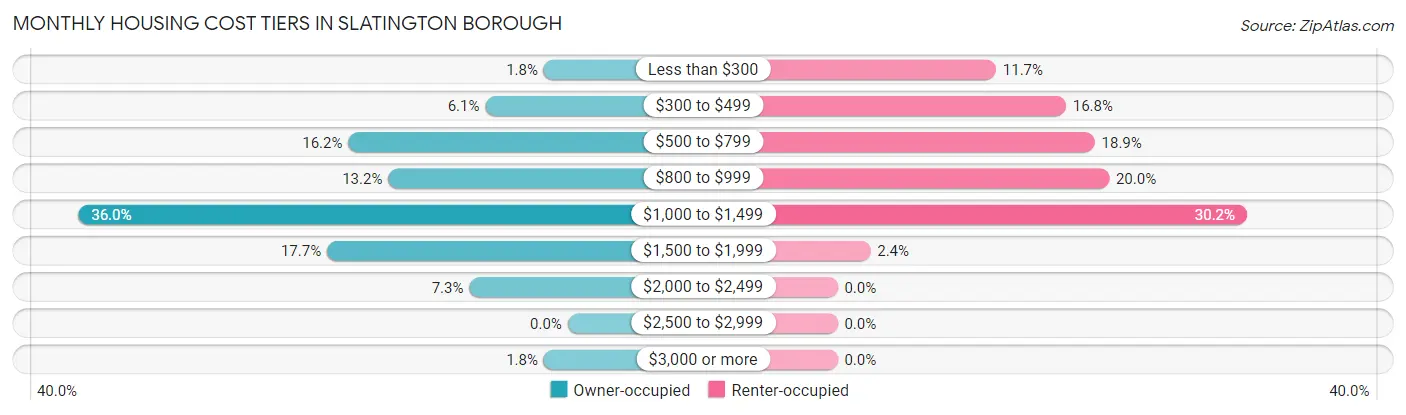
| Monthly Cost | Owner-occupied | Renter-occupied |
| Less than $300 | 18 (1.8%) | 77 (11.7%) |
| $300 to $499 | 62 (6.1%) | 111 (16.8%) |
| $500 to $799 | 165 (16.2%) | 125 (18.9%) |
| $800 to $999 | 135 (13.2%) | 132 (20.0%) |
| $1,000 to $1,499 | 368 (36.0%) | 199 (30.1%) |
| $1,500 to $1,999 | 181 (17.7%) | 16 (2.4%) |
| $2,000 to $2,499 | 74 (7.2%) | 0 (0.0%) |
| $2,500 to $2,999 | 0 (0.0%) | 0 (0.0%) |
| $3,000 or more | 18 (1.8%) | 0 (0.0%) |
| Total | 1,021 (100.0%) | 660 (100.0%) |
Physical Housing Characteristics in Slatington borough
Housing Structures in Slatington borough
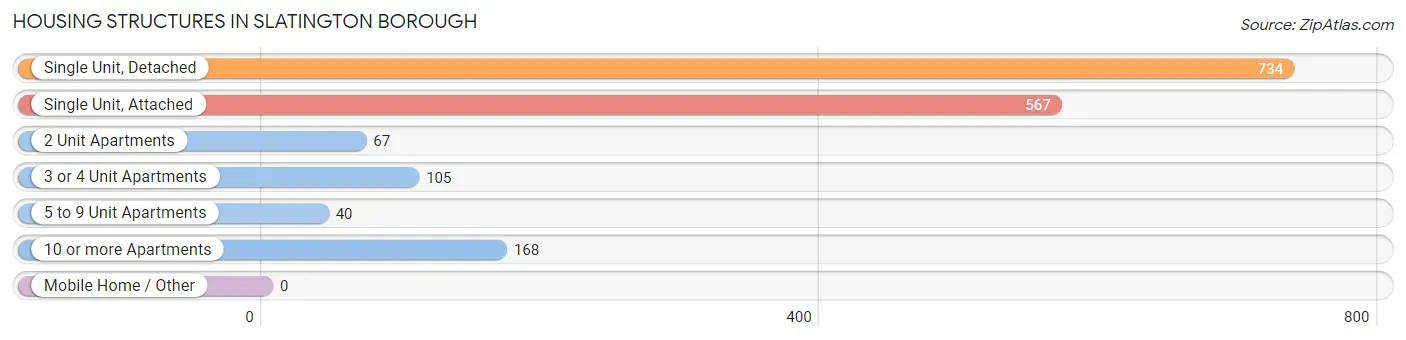
| Structure Type | # Housing Units | % Housing Units |
| Single Unit, Detached | 734 | 43.7% |
| Single Unit, Attached | 567 | 33.7% |
| 2 Unit Apartments | 67 | 4.0% |
| 3 or 4 Unit Apartments | 105 | 6.2% |
| 5 to 9 Unit Apartments | 40 | 2.4% |
| 10 or more Apartments | 168 | 10.0% |
| Mobile Home / Other | 0 | 0.0% |
| Total | 1,681 | 100.0% |
Housing Structures by Occupancy in Slatington borough
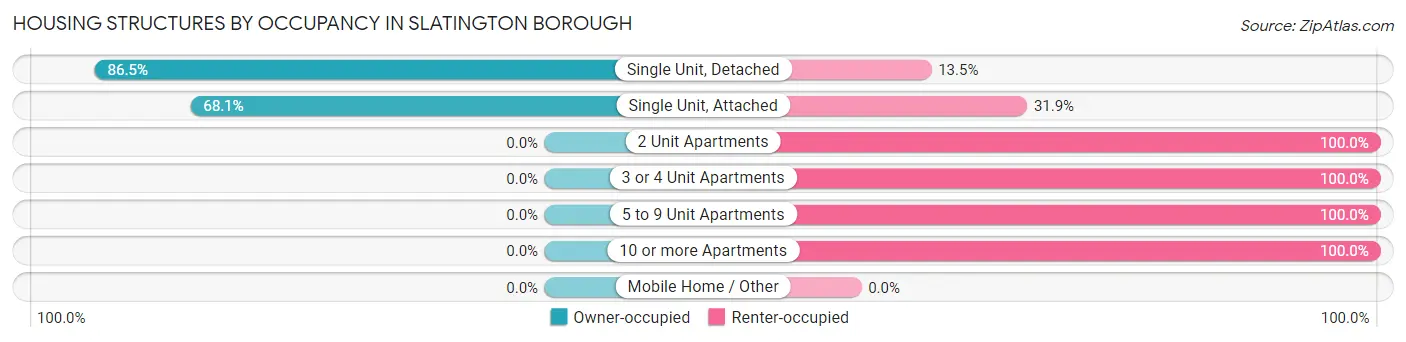
| Structure Type | Owner-occupied | Renter-occupied |
| Single Unit, Detached | 635 (86.5%) | 99 (13.5%) |
| Single Unit, Attached | 386 (68.1%) | 181 (31.9%) |
| 2 Unit Apartments | 0 (0.0%) | 67 (100.0%) |
| 3 or 4 Unit Apartments | 0 (0.0%) | 105 (100.0%) |
| 5 to 9 Unit Apartments | 0 (0.0%) | 40 (100.0%) |
| 10 or more Apartments | 0 (0.0%) | 168 (100.0%) |
| Mobile Home / Other | 0 (0.0%) | 0 (0.0%) |
| Total | 1,021 (60.7%) | 660 (39.3%) |
Housing Structures by Number of Rooms in Slatington borough
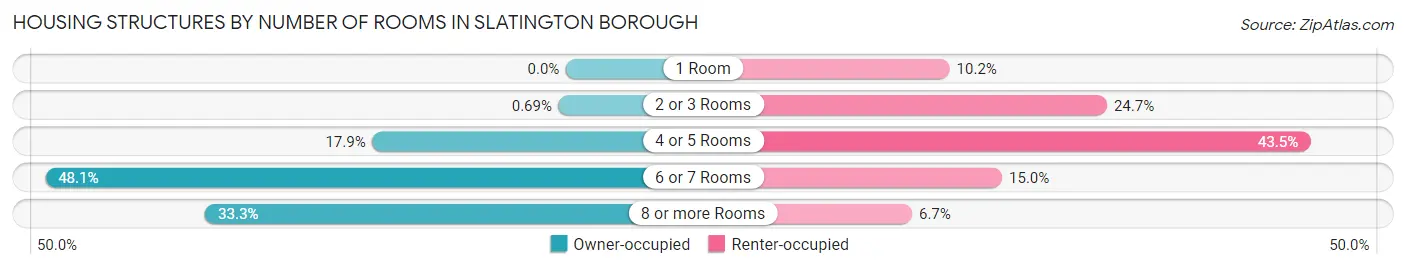
| Number of Rooms | Owner-occupied | Renter-occupied |
| 1 Room | 0 (0.0%) | 67 (10.2%) |
| 2 or 3 Rooms | 7 (0.7%) | 163 (24.7%) |
| 4 or 5 Rooms | 183 (17.9%) | 287 (43.5%) |
| 6 or 7 Rooms | 491 (48.1%) | 99 (15.0%) |
| 8 or more Rooms | 340 (33.3%) | 44 (6.7%) |
| Total | 1,021 (100.0%) | 660 (100.0%) |
Housing Structure by Heating Type in Slatington borough
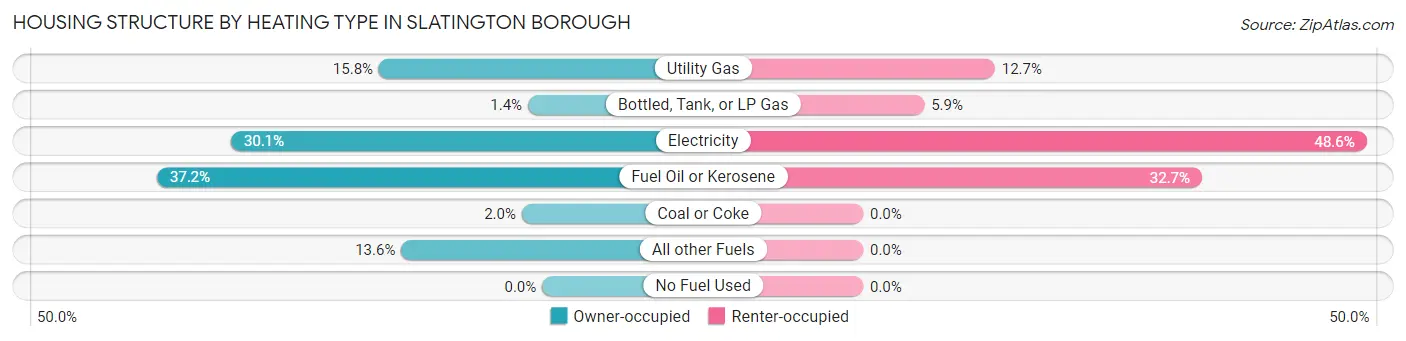
| Heating Type | Owner-occupied | Renter-occupied |
| Utility Gas | 161 (15.8%) | 84 (12.7%) |
| Bottled, Tank, or LP Gas | 14 (1.4%) | 39 (5.9%) |
| Electricity | 307 (30.1%) | 321 (48.6%) |
| Fuel Oil or Kerosene | 380 (37.2%) | 216 (32.7%) |
| Coal or Coke | 20 (2.0%) | 0 (0.0%) |
| All other Fuels | 139 (13.6%) | 0 (0.0%) |
| No Fuel Used | 0 (0.0%) | 0 (0.0%) |
| Total | 1,021 (100.0%) | 660 (100.0%) |
Household Vehicle Usage in Slatington borough
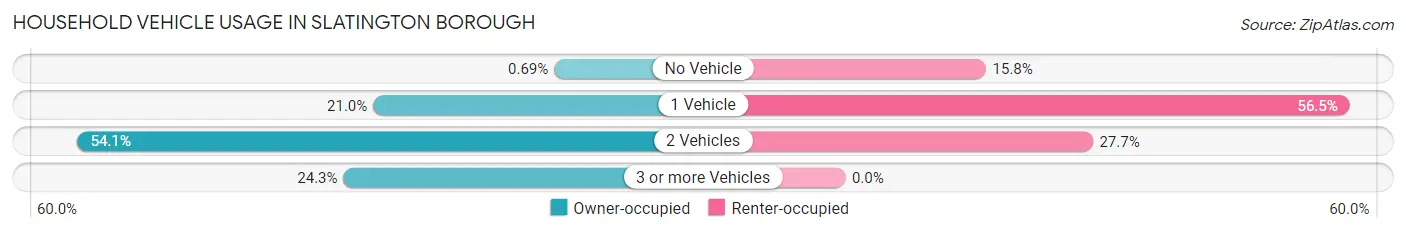
| Vehicles per Household | Owner-occupied | Renter-occupied |
| No Vehicle | 7 (0.7%) | 104 (15.8%) |
| 1 Vehicle | 214 (21.0%) | 373 (56.5%) |
| 2 Vehicles | 552 (54.1%) | 183 (27.7%) |
| 3 or more Vehicles | 248 (24.3%) | 0 (0.0%) |
| Total | 1,021 (100.0%) | 660 (100.0%) |
Real Estate & Mortgages in Slatington borough
Real Estate and Mortgage Overview in Slatington borough
| Characteristic | Without Mortgage | With Mortgage |
| Housing Units | 353 | 668 |
| Median Property Value | $192,700 | $146,100 |
| Median Household Income | $54,063 | $60 |
| Monthly Housing Costs | $738 | $18 |
| Real Estate Taxes | $3,750 | $11 |
Property Value by Mortgage Status in Slatington borough
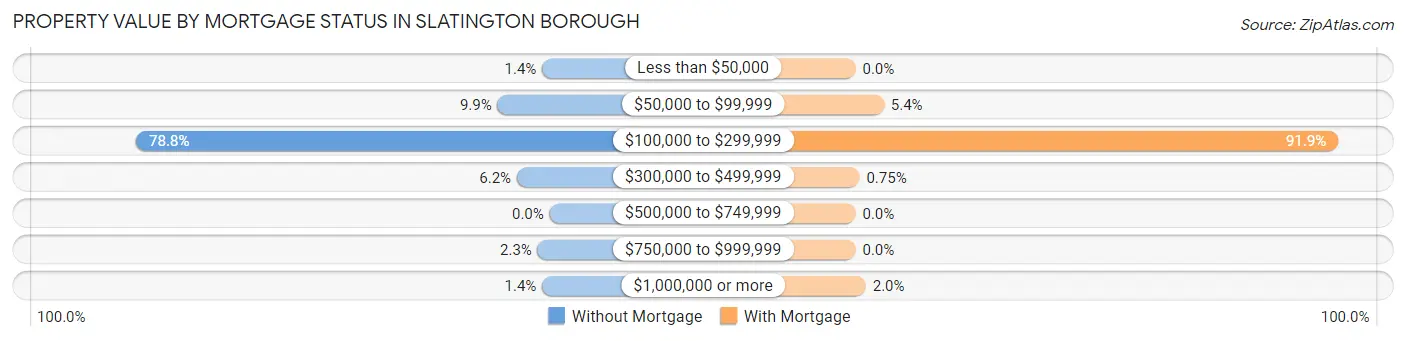
| Property Value | Without Mortgage | With Mortgage |
| Less than $50,000 | 5 (1.4%) | 0 (0.0%) |
| $50,000 to $99,999 | 35 (9.9%) | 36 (5.4%) |
| $100,000 to $299,999 | 278 (78.7%) | 614 (91.9%) |
| $300,000 to $499,999 | 22 (6.2%) | 5 (0.7%) |
| $500,000 to $749,999 | 0 (0.0%) | 0 (0.0%) |
| $750,000 to $999,999 | 8 (2.3%) | 0 (0.0%) |
| $1,000,000 or more | 5 (1.4%) | 13 (1.9%) |
| Total | 353 (100.0%) | 668 (100.0%) |
Household Income by Mortgage Status in Slatington borough
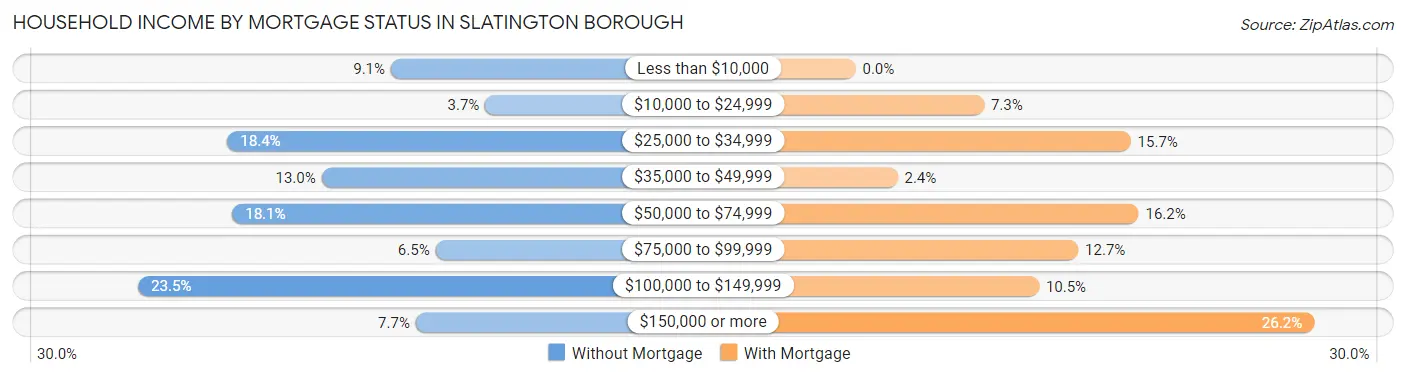
| Household Income | Without Mortgage | With Mortgage |
| Less than $10,000 | 32 (9.1%) | 0 (0.0%) |
| $10,000 to $24,999 | 13 (3.7%) | 49 (7.3%) |
| $25,000 to $34,999 | 65 (18.4%) | 105 (15.7%) |
| $35,000 to $49,999 | 46 (13.0%) | 16 (2.4%) |
| $50,000 to $74,999 | 64 (18.1%) | 108 (16.2%) |
| $75,000 to $99,999 | 23 (6.5%) | 85 (12.7%) |
| $100,000 to $149,999 | 83 (23.5%) | 70 (10.5%) |
| $150,000 or more | 27 (7.6%) | 175 (26.2%) |
| Total | 353 (100.0%) | 668 (100.0%) |
Property Value to Household Income Ratio in Slatington borough
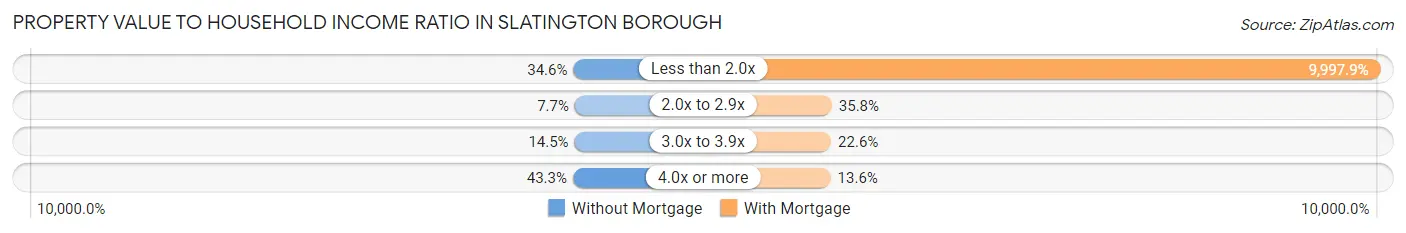
| Value-to-Income Ratio | Without Mortgage | With Mortgage |
| Less than 2.0x | 122 (34.6%) | 66,786 (9,997.9%) |
| 2.0x to 2.9x | 27 (7.6%) | 239 (35.8%) |
| 3.0x to 3.9x | 51 (14.4%) | 151 (22.6%) |
| 4.0x or more | 153 (43.3%) | 91 (13.6%) |
| Total | 353 (100.0%) | 668 (100.0%) |
Real Estate Taxes by Mortgage Status in Slatington borough
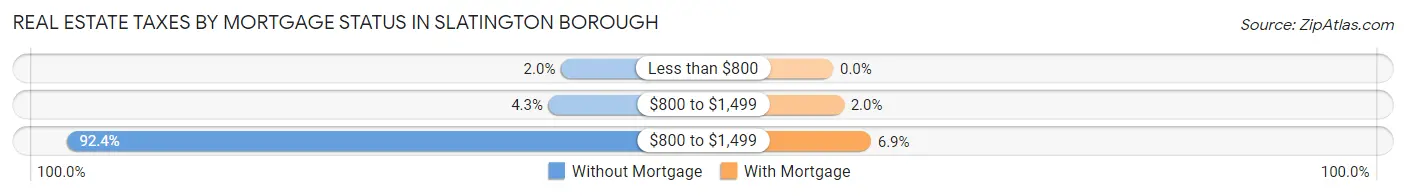
| Property Taxes | Without Mortgage | With Mortgage |
| Less than $800 | 7 (2.0%) | 0 (0.0%) |
| $800 to $1,499 | 15 (4.3%) | 13 (1.9%) |
| $800 to $1,499 | 326 (92.3%) | 46 (6.9%) |
| Total | 353 (100.0%) | 668 (100.0%) |
Health & Disability in Slatington borough
Health Insurance Coverage by Age in Slatington borough
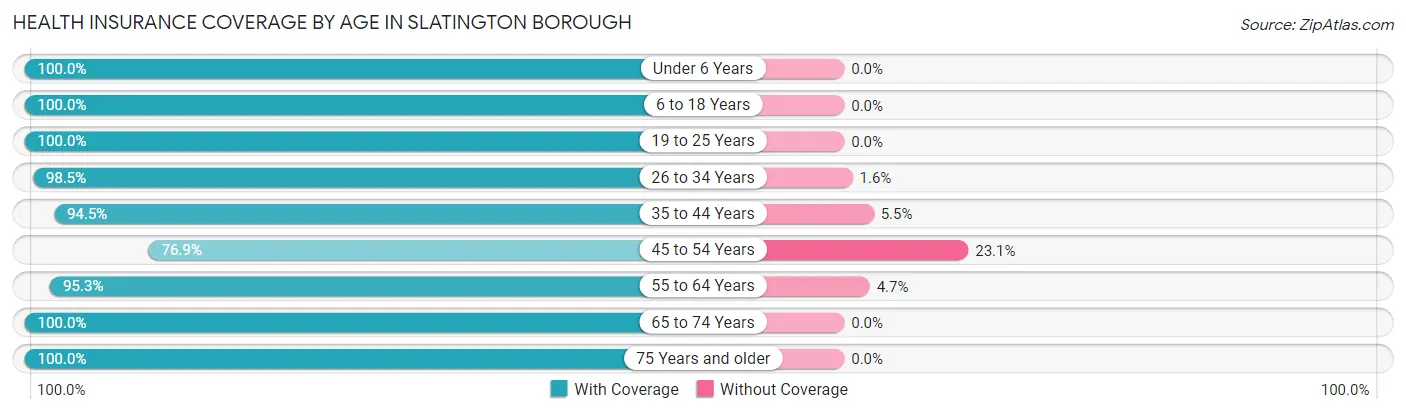
| Age Bracket | With Coverage | Without Coverage |
| Under 6 Years | 412 (100.0%) | 0 (0.0%) |
| 6 to 18 Years | 825 (100.0%) | 0 (0.0%) |
| 19 to 25 Years | 200 (100.0%) | 0 (0.0%) |
| 26 to 34 Years | 697 (98.5%) | 11 (1.5%) |
| 35 to 44 Years | 535 (94.5%) | 31 (5.5%) |
| 45 to 54 Years | 286 (76.9%) | 86 (23.1%) |
| 55 to 64 Years | 422 (95.3%) | 21 (4.7%) |
| 65 to 74 Years | 472 (100.0%) | 0 (0.0%) |
| 75 Years and older | 285 (100.0%) | 0 (0.0%) |
| Total | 4,134 (96.5%) | 149 (3.5%) |
Health Insurance Coverage by Citizenship Status in Slatington borough
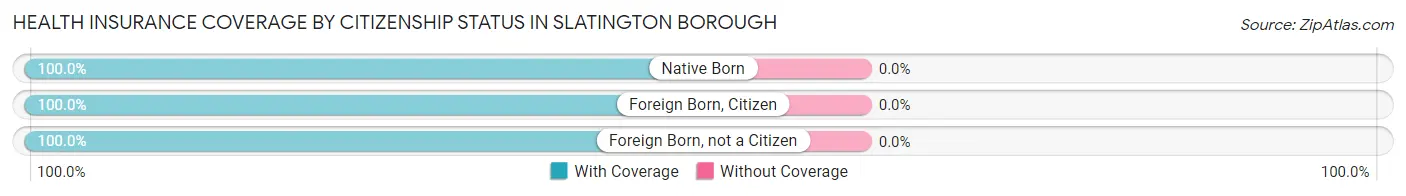
| Citizenship Status | With Coverage | Without Coverage |
| Native Born | 412 (100.0%) | 0 (0.0%) |
| Foreign Born, Citizen | 825 (100.0%) | 0 (0.0%) |
| Foreign Born, not a Citizen | 200 (100.0%) | 0 (0.0%) |
Health Insurance Coverage by Household Income in Slatington borough
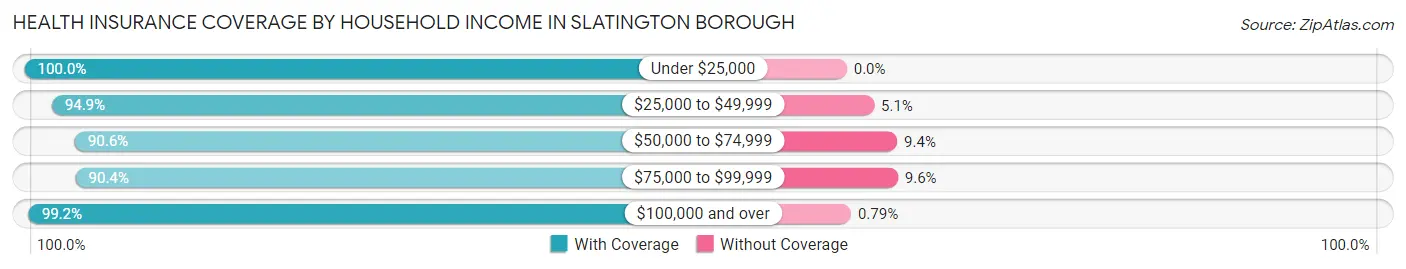
| Household Income | With Coverage | Without Coverage |
| Under $25,000 | 1,143 (100.0%) | 0 (0.0%) |
| $25,000 to $49,999 | 631 (94.9%) | 34 (5.1%) |
| $50,000 to $74,999 | 624 (90.6%) | 65 (9.4%) |
| $75,000 to $99,999 | 350 (90.4%) | 37 (9.6%) |
| $100,000 and over | 1,377 (99.2%) | 11 (0.8%) |
Public vs Private Health Insurance Coverage by Age in Slatington borough
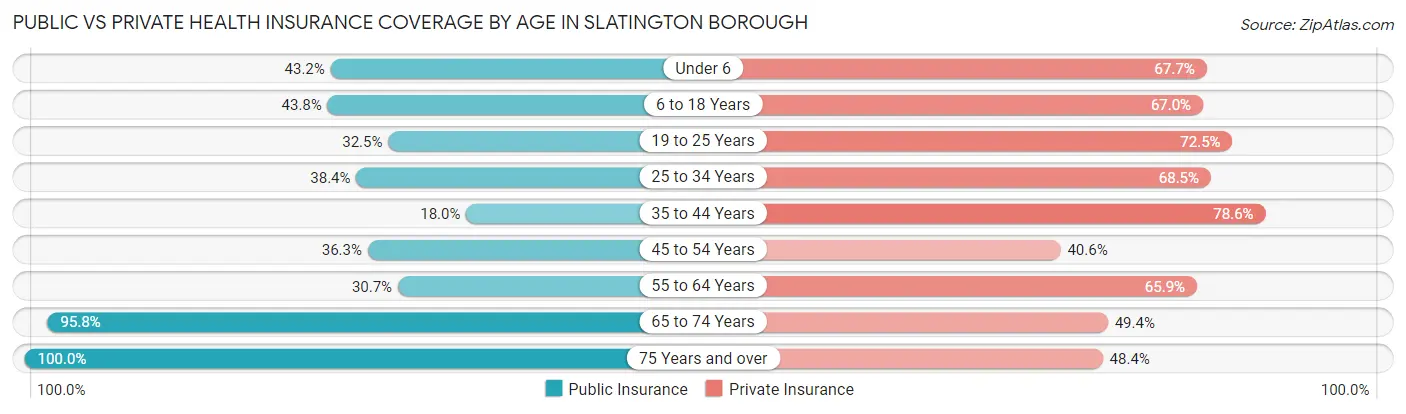
| Age Bracket | Public Insurance | Private Insurance |
| Under 6 | 178 (43.2%) | 279 (67.7%) |
| 6 to 18 Years | 361 (43.8%) | 553 (67.0%) |
| 19 to 25 Years | 65 (32.5%) | 145 (72.5%) |
| 25 to 34 Years | 272 (38.4%) | 485 (68.5%) |
| 35 to 44 Years | 102 (18.0%) | 445 (78.6%) |
| 45 to 54 Years | 135 (36.3%) | 151 (40.6%) |
| 55 to 64 Years | 136 (30.7%) | 292 (65.9%) |
| 65 to 74 Years | 452 (95.8%) | 233 (49.4%) |
| 75 Years and over | 285 (100.0%) | 138 (48.4%) |
| Total | 1,986 (46.4%) | 2,721 (63.5%) |
Disability Status by Sex by Age in Slatington borough
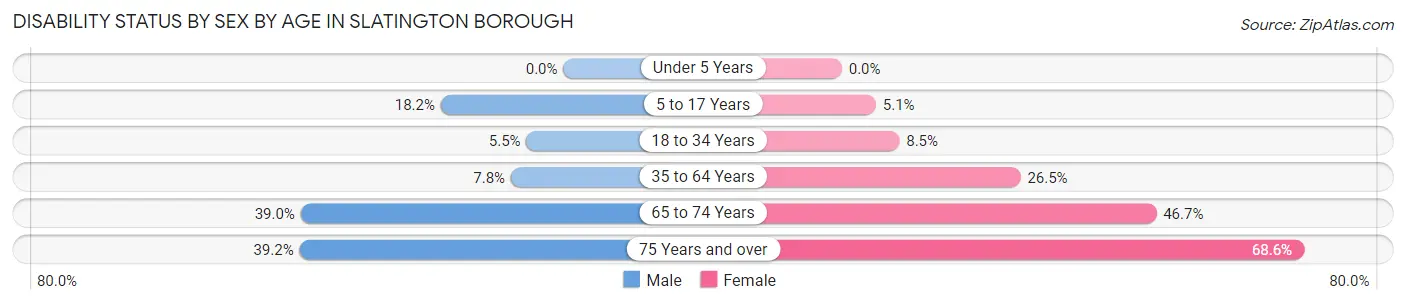
| Age Bracket | Male | Female |
| Under 5 Years | 0 (0.0%) | 0 (0.0%) |
| 5 to 17 Years | 85 (18.2%) | 17 (5.1%) |
| 18 to 34 Years | 24 (5.5%) | 42 (8.5%) |
| 35 to 64 Years | 53 (7.8%) | 186 (26.5%) |
| 65 to 74 Years | 78 (39.0%) | 127 (46.7%) |
| 75 Years and over | 38 (39.2%) | 129 (68.6%) |
Disability Class by Sex by Age in Slatington borough
Disability Class: Hearing Difficulty
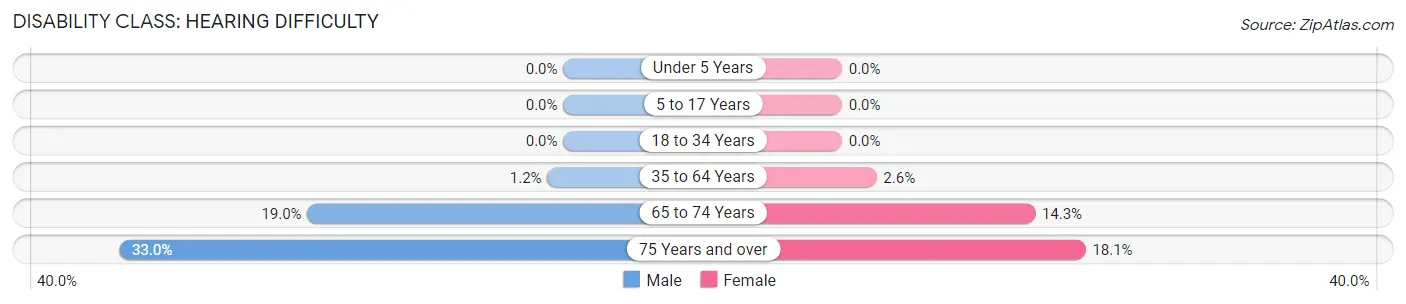
| Age Bracket | Male | Female |
| Under 5 Years | 0 (0.0%) | 0 (0.0%) |
| 5 to 17 Years | 0 (0.0%) | 0 (0.0%) |
| 18 to 34 Years | 0 (0.0%) | 0 (0.0%) |
| 35 to 64 Years | 8 (1.2%) | 18 (2.6%) |
| 65 to 74 Years | 38 (19.0%) | 39 (14.3%) |
| 75 Years and over | 32 (33.0%) | 34 (18.1%) |
Disability Class: Vision Difficulty
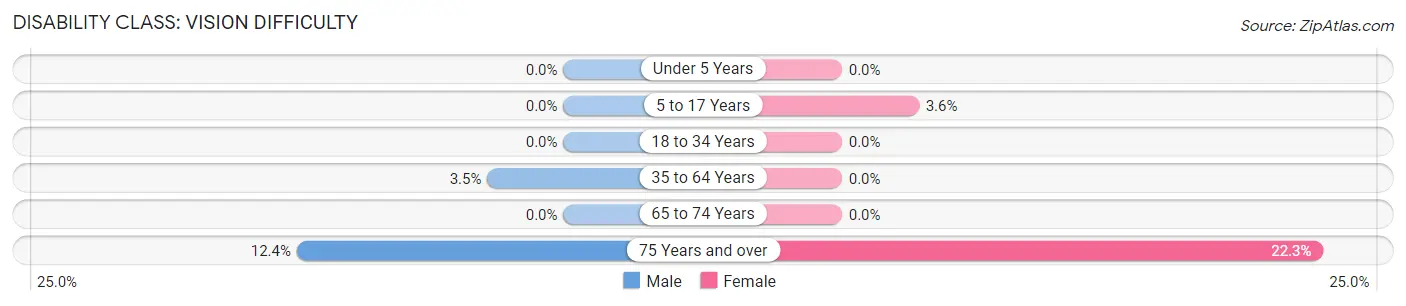
| Age Bracket | Male | Female |
| Under 5 Years | 0 (0.0%) | 0 (0.0%) |
| 5 to 17 Years | 0 (0.0%) | 12 (3.6%) |
| 18 to 34 Years | 0 (0.0%) | 0 (0.0%) |
| 35 to 64 Years | 24 (3.5%) | 0 (0.0%) |
| 65 to 74 Years | 0 (0.0%) | 0 (0.0%) |
| 75 Years and over | 12 (12.4%) | 42 (22.3%) |
Disability Class: Cognitive Difficulty
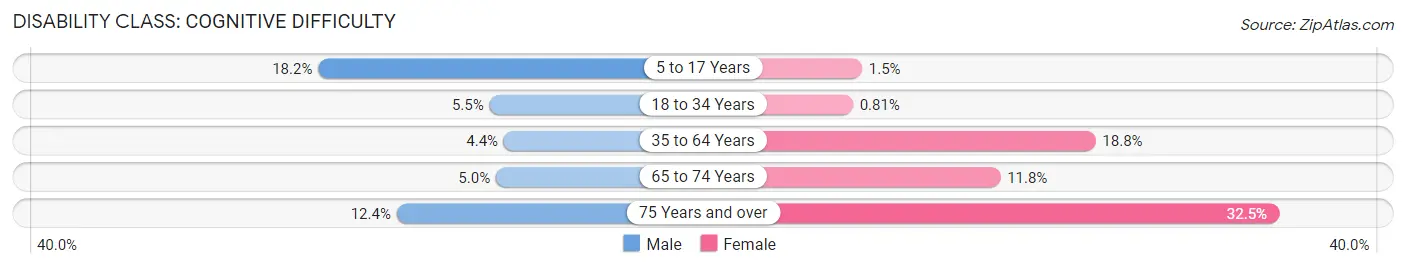
| Age Bracket | Male | Female |
| 5 to 17 Years | 85 (18.2%) | 5 (1.5%) |
| 18 to 34 Years | 24 (5.5%) | 4 (0.8%) |
| 35 to 64 Years | 30 (4.4%) | 132 (18.8%) |
| 65 to 74 Years | 10 (5.0%) | 32 (11.8%) |
| 75 Years and over | 12 (12.4%) | 61 (32.5%) |
Disability Class: Ambulatory Difficulty
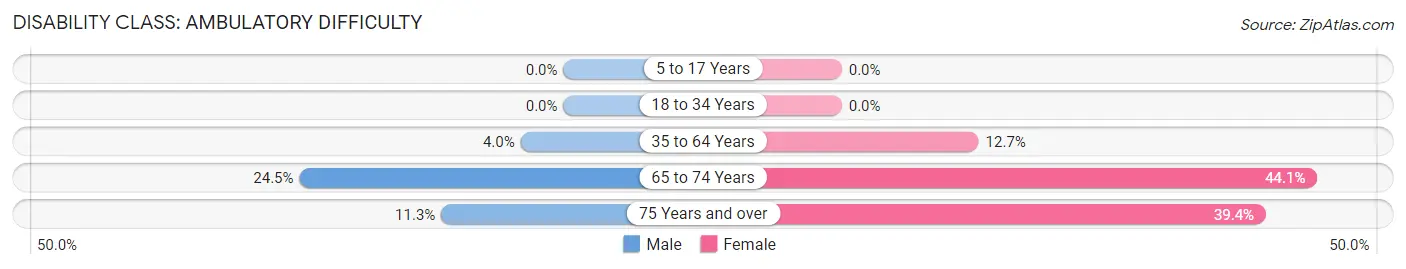
| Age Bracket | Male | Female |
| 5 to 17 Years | 0 (0.0%) | 0 (0.0%) |
| 18 to 34 Years | 0 (0.0%) | 0 (0.0%) |
| 35 to 64 Years | 27 (4.0%) | 89 (12.7%) |
| 65 to 74 Years | 49 (24.5%) | 120 (44.1%) |
| 75 Years and over | 11 (11.3%) | 74 (39.4%) |
Disability Class: Self-Care Difficulty
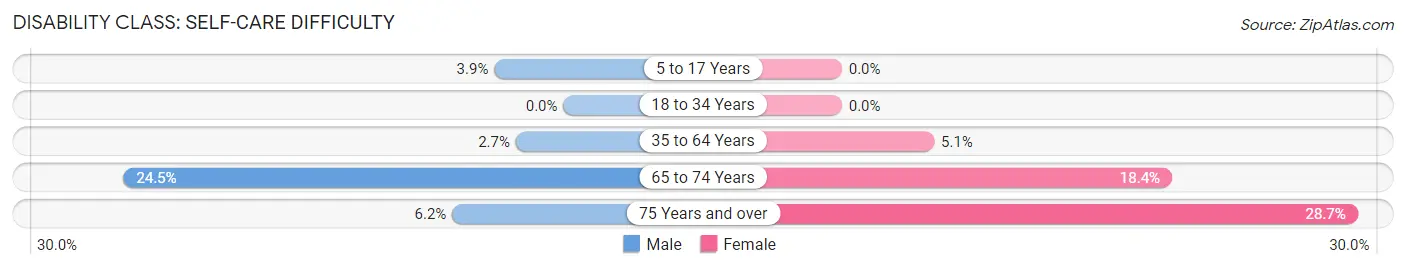
| Age Bracket | Male | Female |
| 5 to 17 Years | 18 (3.8%) | 0 (0.0%) |
| 18 to 34 Years | 0 (0.0%) | 0 (0.0%) |
| 35 to 64 Years | 18 (2.6%) | 36 (5.1%) |
| 65 to 74 Years | 49 (24.5%) | 50 (18.4%) |
| 75 Years and over | 6 (6.2%) | 54 (28.7%) |
Technology Access in Slatington borough
Computing Device Access in Slatington borough
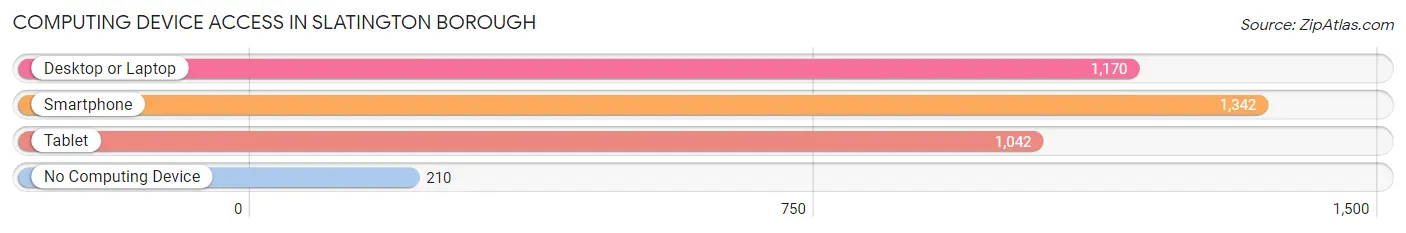
| Device Type | # Households | % Households |
| Desktop or Laptop | 1,170 | 69.6% |
| Smartphone | 1,342 | 79.8% |
| Tablet | 1,042 | 62.0% |
| No Computing Device | 210 | 12.5% |
| Total | 1,681 | 100.0% |
Internet Access in Slatington borough
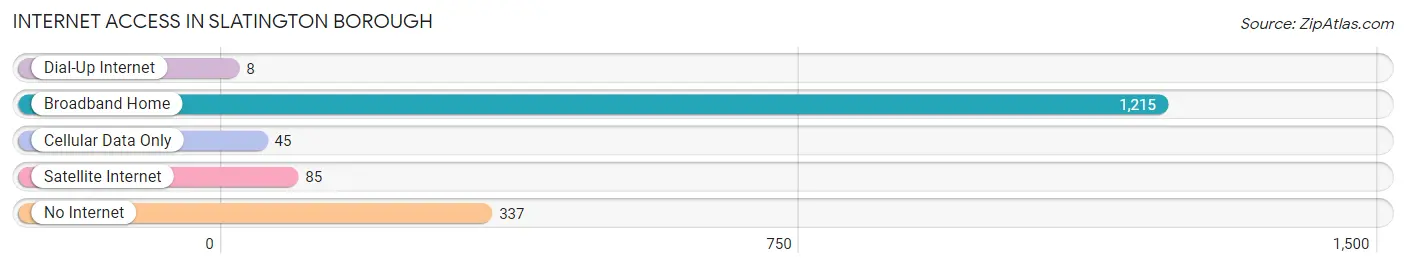
| Internet Type | # Households | % Households |
| Dial-Up Internet | 8 | 0.5% |
| Broadband Home | 1,215 | 72.3% |
| Cellular Data Only | 45 | 2.7% |
| Satellite Internet | 85 | 5.1% |
| No Internet | 337 | 20.1% |
| Total | 1,681 | 100.0% |
Slatington borough Summary
Slatington Borough is a small borough located in Lehigh County, Pennsylvania. It is situated in the Lehigh Valley region of the state, approximately 10 miles northwest of Allentown. The borough is home to a population of approximately 3,000 people, and is part of the larger Slatington-Washington Township area.
History
Slatington Borough was founded in 1864 by a group of local businessmen, who named the town after the slate industry that was prevalent in the area. The slate industry was a major source of employment for the town, and the town quickly grew to become a thriving community. The town was incorporated in 1876, and the first mayor was elected in 1877.
In the late 19th century, the town was home to a variety of industries, including a brickyard, a tannery, a brewery, and a number of other businesses. The town also had a number of churches, schools, and other civic organizations.
In the early 20th century, the slate industry began to decline, and the town began to suffer economically. The Great Depression of the 1930s hit the town particularly hard, and many of the businesses and industries closed. The town was able to recover somewhat in the post-war years, but the slate industry never fully recovered.
Geography
Slatington Borough is located in the Lehigh Valley region of Pennsylvania. It is situated in the western part of Lehigh County, approximately 10 miles northwest of Allentown. The borough is bordered by Washington Township to the north, North Whitehall Township to the east, and Heidelberg Township to the south.
The borough is situated in a hilly area, with the highest point being the summit of Slatington Mountain, which is located in the northern part of the borough. The borough is drained by the Lehigh River, which flows through the town.
Economy
The economy of Slatington Borough is largely based on the service sector. The town is home to a number of small businesses, including restaurants, retail stores, and professional services. The town also has a number of manufacturing businesses, including a plastics factory and a metal fabrication plant.
The town is also home to a number of agricultural businesses, including dairy farms, fruit orchards, and vegetable farms. The town is also home to a number of tourist attractions, including the Slatington Historical Society Museum and the Slatington Railroad Museum.
Demographics
As of the 2010 census, the population of Slatington Borough was 3,039. The racial makeup of the borough was 94.3% White, 1.3% African American, 0.3% Native American, 0.7% Asian, 0.1% Pacific Islander, 1.2% from other races, and 2.3% from two or more races. Hispanic or Latino of any race were 3.7% of the population.
The median household income in Slatington Borough was $45,938, and the median family income was $54,917. The per capita income for the borough was $20,945. About 8.3% of families and 10.2% of the population were below the poverty line, including 14.2% of those under age 18 and 6.2% of those age 65 or over.
Common Questions
What is Per Capita Income in Slatington borough?
Per Capita income in Slatington borough is $24,064.
What is the Median Family Income in Slatington borough?
Median Family Income in Slatington borough is $53,958.
What is the Median Household income in Slatington borough?
Median Household Income in Slatington borough is $43,823.
What is Income or Wage Gap in Slatington borough?
Income or Wage Gap in Slatington borough is 36.1%.
Women in Slatington borough earn 63.9 cents for every dollar earned by a man.
What is Inequality or Gini Index in Slatington borough?
Inequality or Gini Index in Slatington borough is 0.47.
What is the Total Population of Slatington borough?
Total Population of Slatington borough is 4,283.
What is the Total Male Population of Slatington borough?
Total Male Population of Slatington borough is 2,180.
What is the Total Female Population of Slatington borough?
Total Female Population of Slatington borough is 2,103.
What is the Ratio of Males per 100 Females in Slatington borough?
There are 103.66 Males per 100 Females in Slatington borough.
What is the Ratio of Females per 100 Males in Slatington borough?
There are 96.47 Females per 100 Males in Slatington borough.
What is the Median Population Age in Slatington borough?
Median Population Age in Slatington borough is 34.7 Years.
What is the Average Family Size in Slatington borough
Average Family Size in Slatington borough is 3.3 People.
What is the Average Household Size in Slatington borough
Average Household Size in Slatington borough is 2.5 People.
How Large is the Labor Force in Slatington borough?
There are 1,851 People in the Labor Forcein in Slatington borough.
What is the Percentage of People in the Labor Force in Slatington borough?
59.8% of People are in the Labor Force in Slatington borough.
What is the Unemployment Rate in Slatington borough?
Unemployment Rate in Slatington borough is 4.8%.