Sinking Spring borough, PA Map & Demographics
Sinking Spring borough Overview
$41,286
PER CAPITA INCOME
$94,236
AVG FAMILY INCOME
$80,565
AVG HOUSEHOLD INCOME
50.8%
WAGE / INCOME GAP [ % ]
49.2¢/ $1
WAGE / INCOME GAP [ $ ]
0.45
INEQUALITY / GINI INDEX
4,261
TOTAL POPULATION
1,966
MALE POPULATION
2,295
FEMALE POPULATION
85.66
MALES / 100 FEMALES
116.73
FEMALES / 100 MALES
39.5
MEDIAN AGE
3.3
AVG FAMILY SIZE
2.6
AVG HOUSEHOLD SIZE
2,552
LABOR FORCE [ PEOPLE ]
74.4%
PERCENT IN LABOR FORCE
2.6%
UNEMPLOYMENT RATE
Income in Sinking Spring borough
Income Overview in Sinking Spring borough
Per Capita Income in Sinking Spring borough is $41,286, while median incomes of families and households are $94,236 and $80,565 respectively.
| Characteristic | Number | Measure |
| Per Capita Income | 4,261 | $41,286 |
| Median Family Income | 1,037 | $94,236 |
| Mean Family Income | 1,037 | $122,237 |
| Median Household Income | 1,643 | $80,565 |
| Mean Household Income | 1,643 | $103,571 |
| Income Deficit | 1,037 | $0 |
| Wage / Income Gap (%) | 4,261 | 50.76% |
| Wage / Income Gap ($) | 4,261 | 49.24¢ per $1 |
| Gini / Inequality Index | 4,261 | 0.45 |
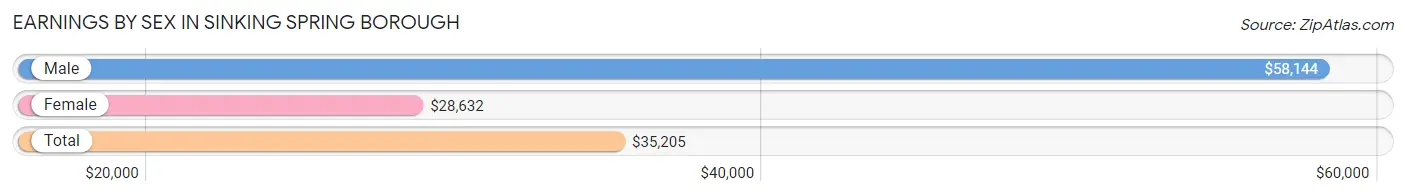
Earnings by Sex in Sinking Spring borough
Average Earnings in Sinking Spring borough are $35,205, $58,144 for men and $28,632 for women, a difference of 50.8%.
| Sex | Number | Average Earnings |
| Male | 1,223 (46.7%) | $58,144 |
| Female | 1,397 (53.3%) | $28,632 |
| Total | 2,620 (100.0%) | $35,205 |
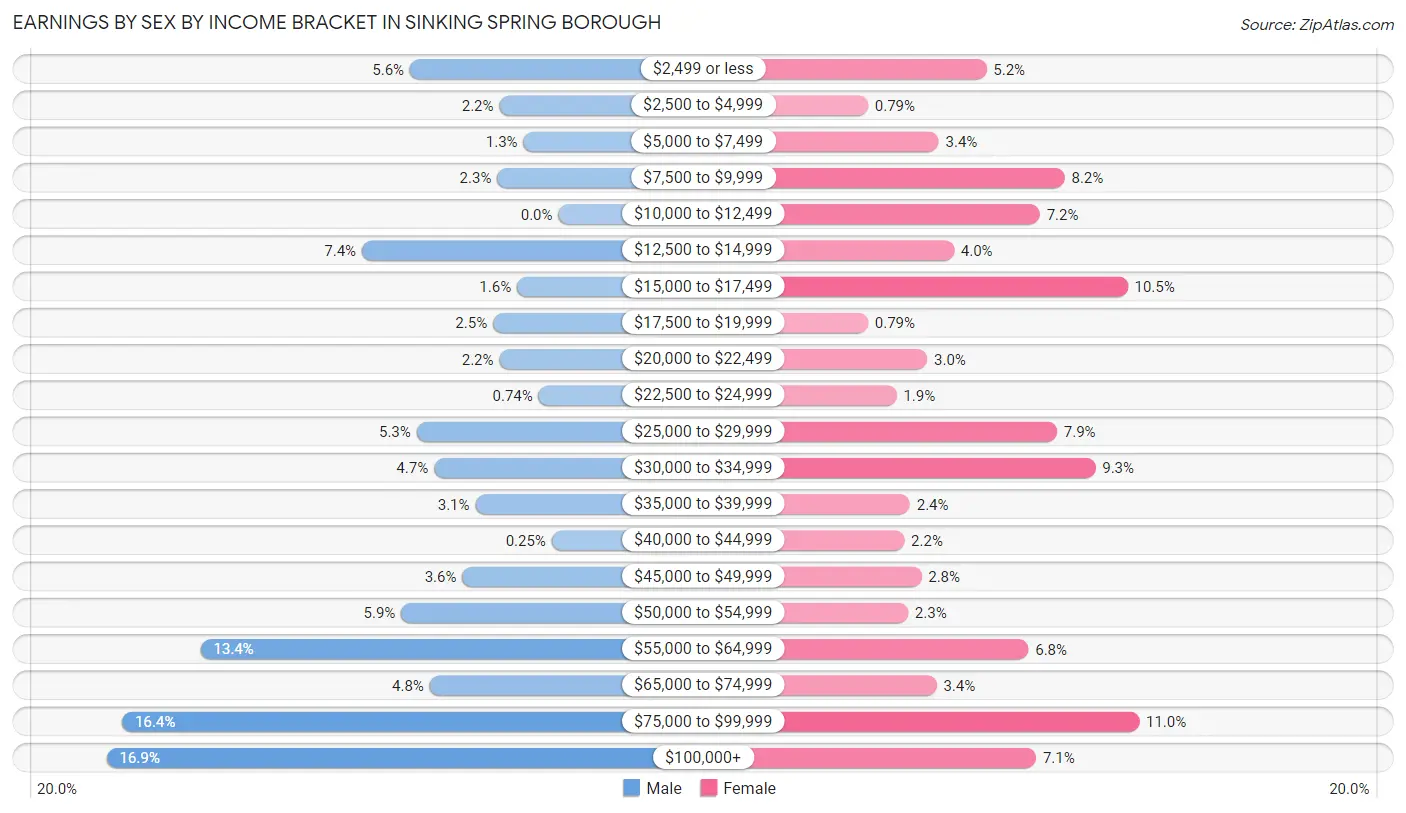
Earnings by Sex by Income Bracket in Sinking Spring borough
The most common earnings brackets in Sinking Spring borough are $100,000+ for men (207 | 16.9%) and $75,000 to $99,999 for women (153 | 11.0%).
| Income | Male | Female |
| $2,499 or less | 68 (5.6%) | 73 (5.2%) |
| $2,500 to $4,999 | 27 (2.2%) | 11 (0.8%) |
| $5,000 to $7,499 | 16 (1.3%) | 48 (3.4%) |
| $7,500 to $9,999 | 28 (2.3%) | 114 (8.2%) |
| $10,000 to $12,499 | 0 (0.0%) | 101 (7.2%) |
| $12,500 to $14,999 | 90 (7.4%) | 56 (4.0%) |
| $15,000 to $17,499 | 19 (1.5%) | 147 (10.5%) |
| $17,500 to $19,999 | 30 (2.5%) | 11 (0.8%) |
| $20,000 to $22,499 | 27 (2.2%) | 42 (3.0%) |
| $22,500 to $24,999 | 9 (0.7%) | 26 (1.9%) |
| $25,000 to $29,999 | 65 (5.3%) | 110 (7.9%) |
| $30,000 to $34,999 | 57 (4.7%) | 130 (9.3%) |
| $35,000 to $39,999 | 38 (3.1%) | 33 (2.4%) |
| $40,000 to $44,999 | 3 (0.3%) | 30 (2.1%) |
| $45,000 to $49,999 | 44 (3.6%) | 39 (2.8%) |
| $50,000 to $54,999 | 72 (5.9%) | 32 (2.3%) |
| $55,000 to $64,999 | 164 (13.4%) | 95 (6.8%) |
| $65,000 to $74,999 | 59 (4.8%) | 47 (3.4%) |
| $75,000 to $99,999 | 200 (16.4%) | 153 (11.0%) |
| $100,000+ | 207 (16.9%) | 99 (7.1%) |
| Total | 1,223 (100.0%) | 1,397 (100.0%) |
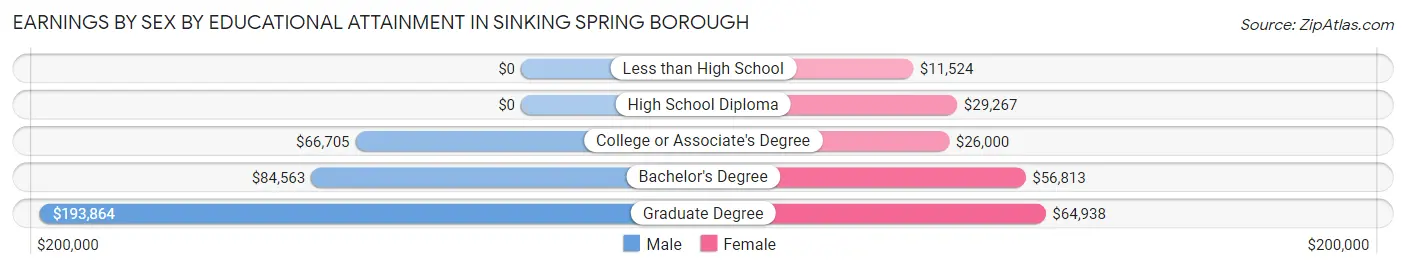
Earnings by Sex by Educational Attainment in Sinking Spring borough
Average earnings in Sinking Spring borough are $62,254 for men and $29,780 for women, a difference of 52.2%. Men with an educational attainment of graduate degree enjoy the highest average annual earnings of $193,864, while those with college or associate's degree education earn the least with $66,705. Women with an educational attainment of graduate degree earn the most with the average annual earnings of $64,938, while those with less than high school education have the smallest earnings of $11,524.
| Educational Attainment | Male Income | Female Income |
| Less than High School | - | - |
| High School Diploma | - | - |
| College or Associate's Degree | $66,705 | $26,000 |
| Bachelor's Degree | $84,563 | $56,813 |
| Graduate Degree | $193,864 | $64,938 |
| Total | $62,254 | $29,780 |
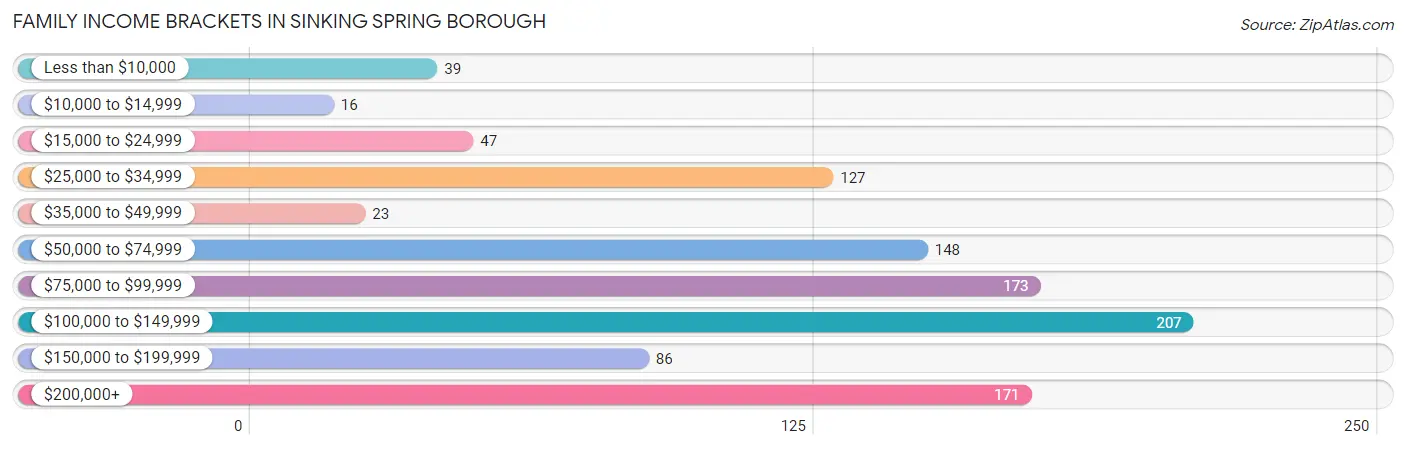
Family Income in Sinking Spring borough
Family Income Brackets in Sinking Spring borough
According to the Sinking Spring borough family income data, there are 207 families falling into the $100,000 to $149,999 income range, which is the most common income bracket and makes up 20.0% of all families. Conversely, the $10,000 to $14,999 income bracket is the least frequent group with only 16 families (1.5%) belonging to this category.
| Income Bracket | # Families | % Families |
| Less than $10,000 | 39 | 3.8% |
| $10,000 to $14,999 | 16 | 1.5% |
| $15,000 to $24,999 | 47 | 4.5% |
| $25,000 to $34,999 | 127 | 12.2% |
| $35,000 to $49,999 | 23 | 2.2% |
| $50,000 to $74,999 | 148 | 14.3% |
| $75,000 to $99,999 | 173 | 16.7% |
| $100,000 to $149,999 | 207 | 20.0% |
| $150,000 to $199,999 | 86 | 8.3% |
| $200,000+ | 171 | 16.5% |
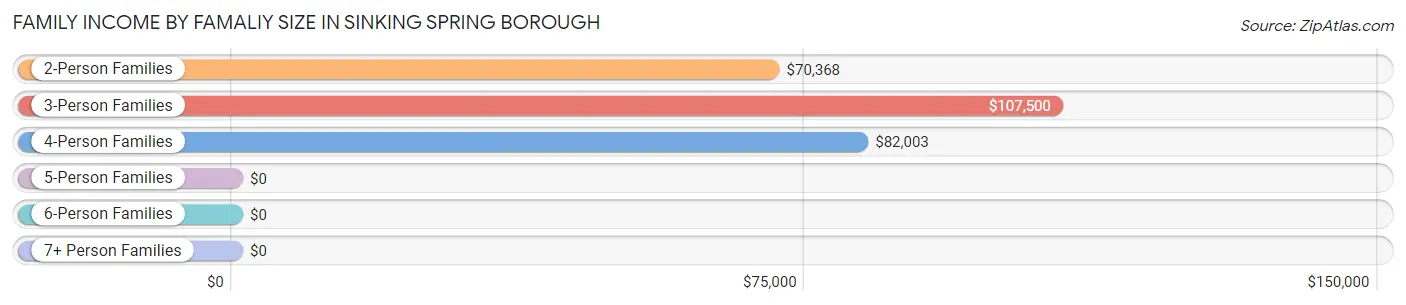
Family Income by Famaliy Size in Sinking Spring borough
3-person families (244 | 23.5%) account for the highest median family income in Sinking Spring borough with $107,500 per family, while 3-person families (244 | 23.5%) have the highest median income of $35,833 per family member.
| Income Bracket | # Families | Median Income |
| 2-Person Families | 415 (40.0%) | $70,368 |
| 3-Person Families | 244 (23.5%) | $107,500 |
| 4-Person Families | 265 (25.6%) | $82,003 |
| 5-Person Families | 87 (8.4%) | $0 |
| 6-Person Families | 0 (0.0%) | $0 |
| 7+ Person Families | 26 (2.5%) | $0 |
| Total | 1,037 (100.0%) | $94,236 |
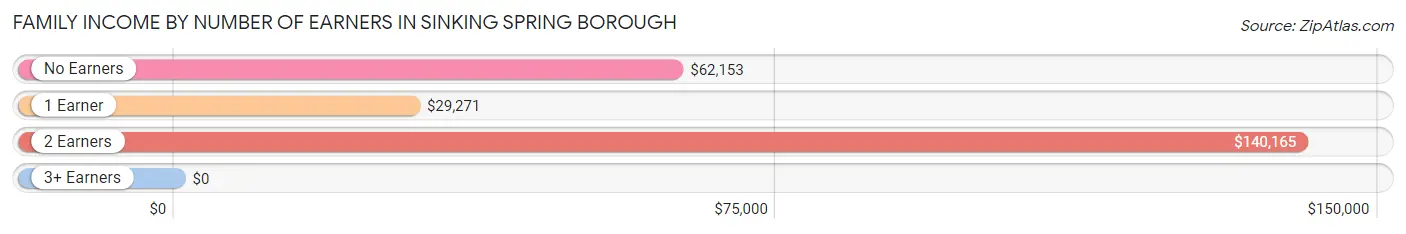
Family Income by Number of Earners in Sinking Spring borough
| Number of Earners | # Families | Median Income |
| No Earners | 77 (7.4%) | $62,153 |
| 1 Earner | 310 (29.9%) | $29,271 |
| 2 Earners | 429 (41.4%) | $140,165 |
| 3+ Earners | 221 (21.3%) | $0 |
| Total | 1,037 (100.0%) | $94,236 |
Household Income in Sinking Spring borough
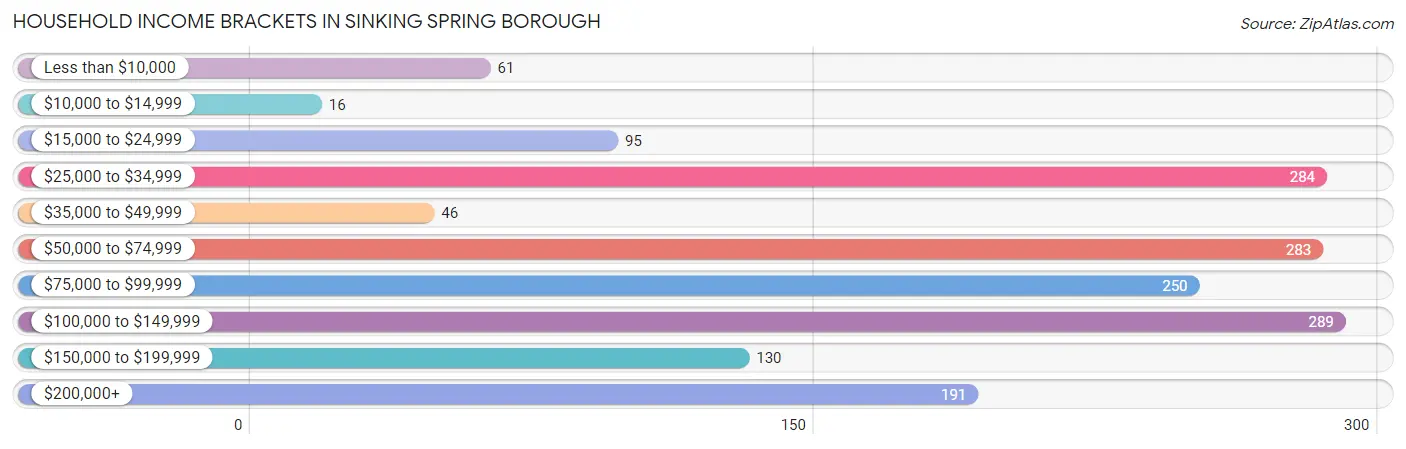
Household Income Brackets in Sinking Spring borough
With 289 households falling in the category, the $100,000 to $149,999 income range is the most frequent in Sinking Spring borough, accounting for 17.6% of all households. In contrast, only 16 households (1.0%) fall into the $10,000 to $14,999 income bracket, making it the least populous group.
| Income Bracket | # Households | % Households |
| Less than $10,000 | 61 | 3.7% |
| $10,000 to $14,999 | 16 | 1.0% |
| $15,000 to $24,999 | 95 | 5.8% |
| $25,000 to $34,999 | 284 | 17.3% |
| $35,000 to $49,999 | 46 | 2.8% |
| $50,000 to $74,999 | 283 | 17.2% |
| $75,000 to $99,999 | 250 | 15.2% |
| $100,000 to $149,999 | 289 | 17.6% |
| $150,000 to $199,999 | 130 | 7.9% |
| $200,000+ | 191 | 11.6% |
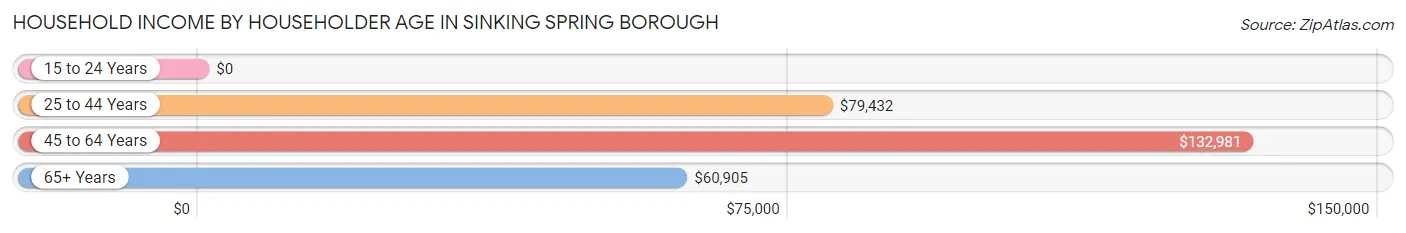
Household Income by Householder Age in Sinking Spring borough
The median household income in Sinking Spring borough is $80,565, with the highest median household income of $132,981 found in the 45 to 64 years age bracket for the primary householder. A total of 657 households (40.0%) fall into this category. Meanwhile, the 15 to 24 years age bracket for the primary householder has the lowest median household income of $0, with 42 households (2.6%) in this group.
| Income Bracket | # Households | Median Income |
| 15 to 24 Years | 42 (2.6%) | $0 |
| 25 to 44 Years | 527 (32.1%) | $79,432 |
| 45 to 64 Years | 657 (40.0%) | $132,981 |
| 65+ Years | 417 (25.4%) | $60,905 |
| Total | 1,643 (100.0%) | $80,565 |
Poverty in Sinking Spring borough
Income Below Poverty by Sex and Age in Sinking Spring borough
With 5.5% poverty level for males and 12.0% for females among the residents of Sinking Spring borough, under 5 year old males and under 5 year old females are the most vulnerable to poverty, with 36 males (22.5%) and 30 females (36.6%) in their respective age groups living below the poverty level.
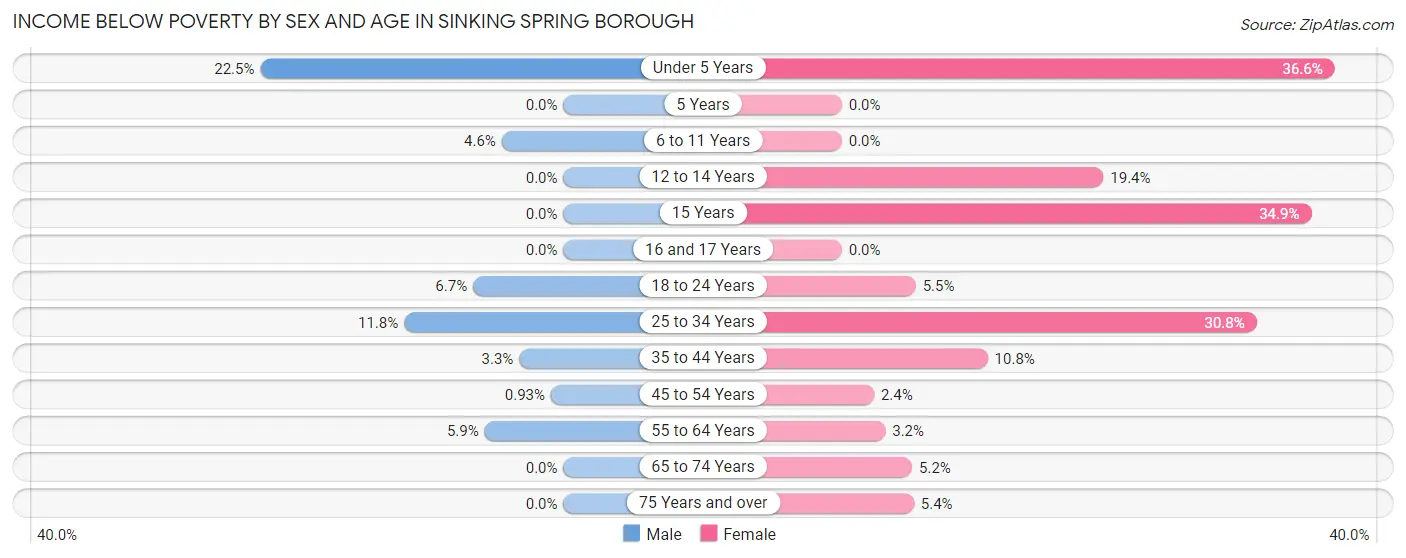
| Age Bracket | Male | Female |
| Under 5 Years | 36 (22.5%) | 30 (36.6%) |
| 5 Years | 0 (0.0%) | 0 (0.0%) |
| 6 to 11 Years | 7 (4.6%) | 0 (0.0%) |
| 12 to 14 Years | 0 (0.0%) | 27 (19.4%) |
| 15 Years | 0 (0.0%) | 23 (34.8%) |
| 16 and 17 Years | 0 (0.0%) | 0 (0.0%) |
| 18 to 24 Years | 11 (6.7%) | 9 (5.5%) |
| 25 to 34 Years | 33 (11.8%) | 117 (30.8%) |
| 35 to 44 Years | 8 (3.3%) | 30 (10.8%) |
| 45 to 54 Years | 3 (0.9%) | 10 (2.4%) |
| 55 to 64 Years | 11 (5.9%) | 7 (3.2%) |
| 65 to 74 Years | 0 (0.0%) | 12 (5.2%) |
| 75 Years and over | 0 (0.0%) | 10 (5.3%) |
| Total | 109 (5.5%) | 275 (12.0%) |
Income Above Poverty by Sex and Age in Sinking Spring borough
According to the poverty statistics in Sinking Spring borough, males aged 5 years and females aged 6 to 11 years are the age groups that are most secure financially, with 100.0% of males and 100.0% of females in these age groups living above the poverty line.
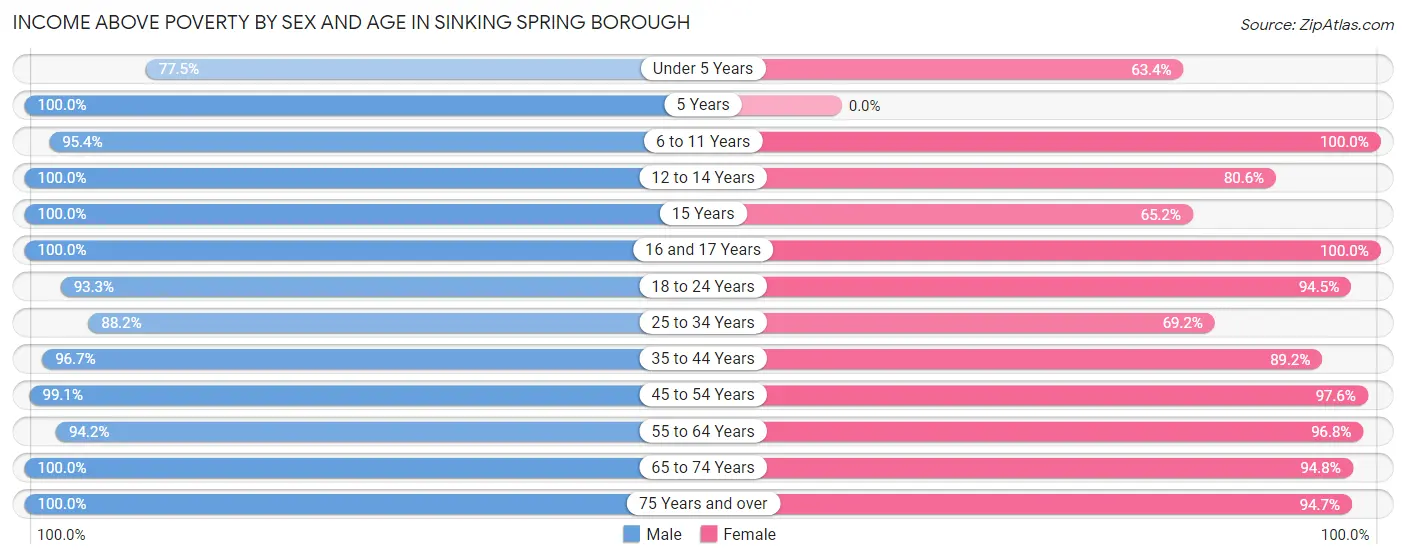
| Age Bracket | Male | Female |
| Under 5 Years | 124 (77.5%) | 52 (63.4%) |
| 5 Years | 35 (100.0%) | 0 (0.0%) |
| 6 to 11 Years | 146 (95.4%) | 77 (100.0%) |
| 12 to 14 Years | 63 (100.0%) | 112 (80.6%) |
| 15 Years | 56 (100.0%) | 43 (65.1%) |
| 16 and 17 Years | 28 (100.0%) | 58 (100.0%) |
| 18 to 24 Years | 153 (93.3%) | 155 (94.5%) |
| 25 to 34 Years | 246 (88.2%) | 263 (69.2%) |
| 35 to 44 Years | 236 (96.7%) | 247 (89.2%) |
| 45 to 54 Years | 319 (99.1%) | 408 (97.6%) |
| 55 to 64 Years | 177 (94.2%) | 210 (96.8%) |
| 65 to 74 Years | 181 (100.0%) | 218 (94.8%) |
| 75 Years and over | 93 (100.0%) | 177 (94.7%) |
| Total | 1,857 (94.5%) | 2,020 (88.0%) |
Income Below Poverty Among Married-Couple Families in Sinking Spring borough
The poverty statistics for married-couple families in Sinking Spring borough show that 6.6% or 50 of the total 759 families live below the poverty line. Families with 1 or 2 children have the highest poverty rate of 10.1%, comprising of 39 families. On the other hand, families with 3 or 4 children have the lowest poverty rate of 0.0%, which includes 0 families.
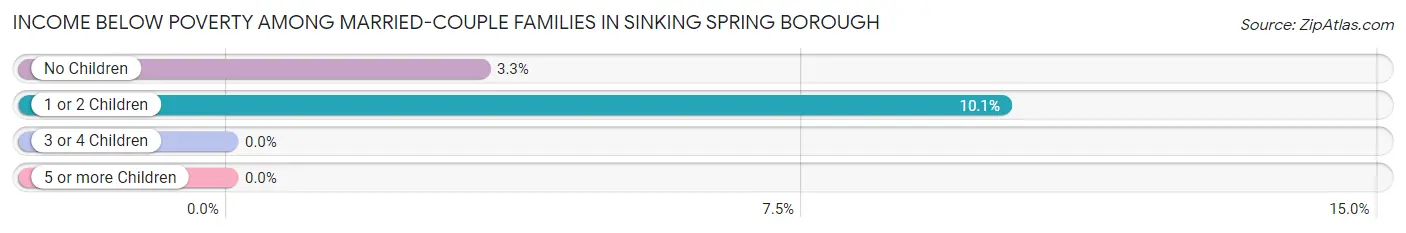
| Children | Above Poverty | Below Poverty |
| No Children | 323 (96.7%) | 11 (3.3%) |
| 1 or 2 Children | 347 (89.9%) | 39 (10.1%) |
| 3 or 4 Children | 39 (100.0%) | 0 (0.0%) |
| 5 or more Children | 0 (0.0%) | 0 (0.0%) |
| Total | 709 (93.4%) | 50 (6.6%) |
Income Below Poverty Among Single-Parent Households in Sinking Spring borough
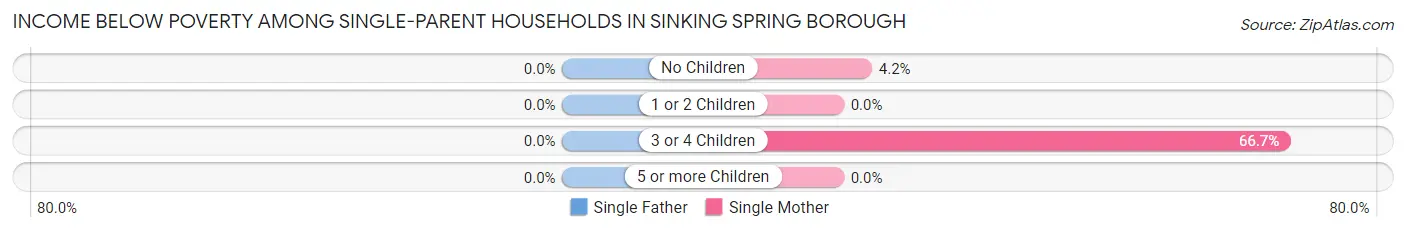
| Children | Single Father | Single Mother |
| No Children | 0 (0.0%) | 5 (4.2%) |
| 1 or 2 Children | 0 (0.0%) | 0 (0.0%) |
| 3 or 4 Children | 0 (0.0%) | 20 (66.7%) |
| 5 or more Children | 0 (0.0%) | 0 (0.0%) |
| Total | 0 (0.0%) | 25 (10.4%) |
Income Below Poverty Among Married-Couple vs Single-Parent Households in Sinking Spring borough
The poverty data for Sinking Spring borough shows that 50 of the married-couple family households (6.6%) and 25 of the single-parent households (9.0%) are living below the poverty level. Within the married-couple family households, those with 1 or 2 children have the highest poverty rate, with 39 households (10.1%) falling below the poverty line. Among the single-parent households, those with 3 or 4 children have the highest poverty rate, with 20 household (66.7%) living below poverty.
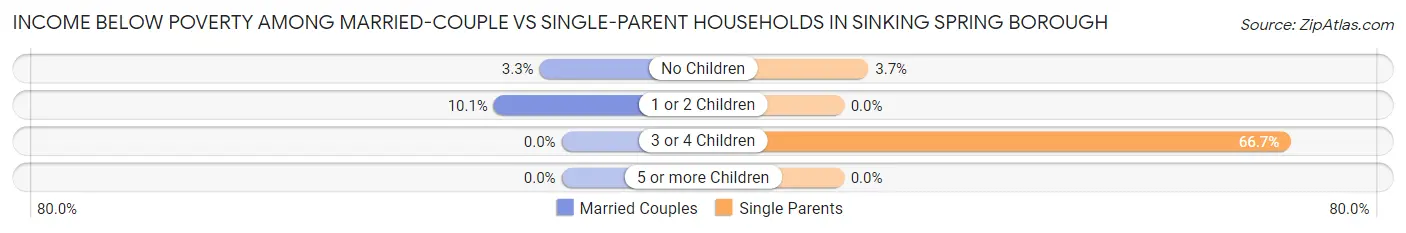
| Children | Married-Couple Families | Single-Parent Households |
| No Children | 11 (3.3%) | 5 (3.7%) |
| 1 or 2 Children | 39 (10.1%) | 0 (0.0%) |
| 3 or 4 Children | 0 (0.0%) | 20 (66.7%) |
| 5 or more Children | 0 (0.0%) | 0 (0.0%) |
| Total | 50 (6.6%) | 25 (9.0%) |
Race in Sinking Spring borough
The most populous races in Sinking Spring borough are White / Caucasian (3,396 | 79.7%), Hispanic or Latino (674 | 15.8%), and Asian (347 | 8.1%).
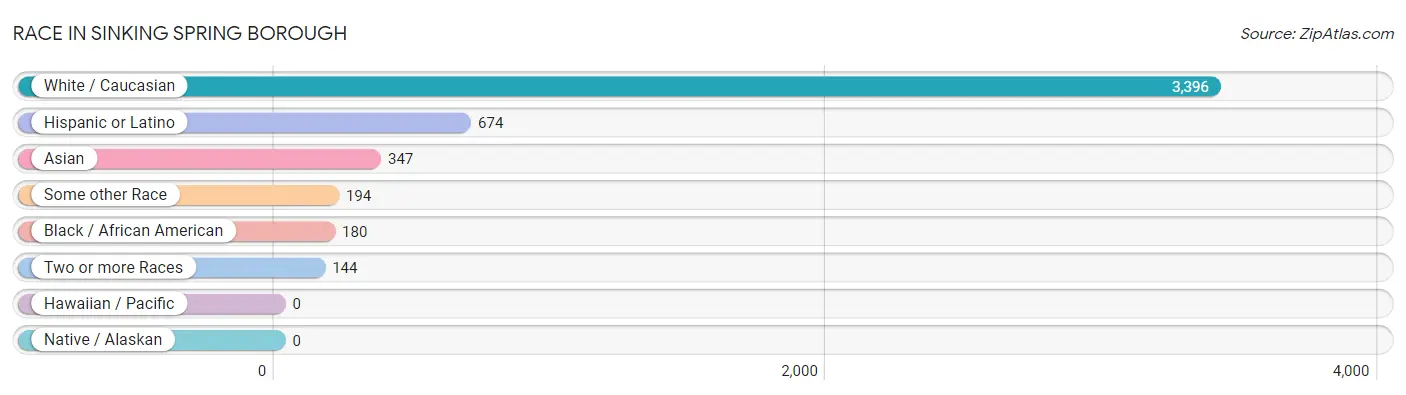
| Race | # Population | % Population |
| Asian | 347 | 8.1% |
| Black / African American | 180 | 4.2% |
| Hawaiian / Pacific | 0 | 0.0% |
| Hispanic or Latino | 674 | 15.8% |
| Native / Alaskan | 0 | 0.0% |
| White / Caucasian | 3,396 | 79.7% |
| Two or more Races | 144 | 3.4% |
| Some other Race | 194 | 4.5% |
| Total | 4,261 | 100.0% |
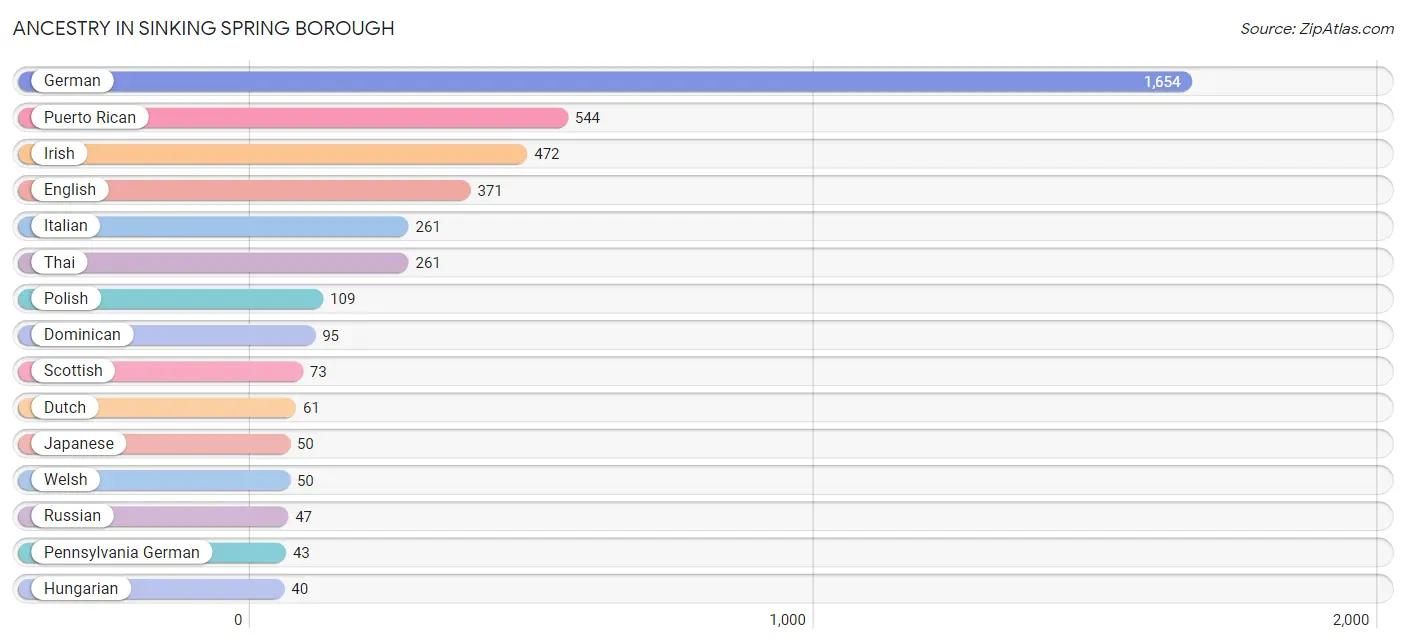
Ancestry in Sinking Spring borough
The most populous ancestries reported in Sinking Spring borough are German (1,654 | 38.8%), Puerto Rican (544 | 12.8%), Irish (472 | 11.1%), English (371 | 8.7%), and Italian (261 | 6.1%), together accounting for 77.5% of all Sinking Spring borough residents.
| Ancestry | # Population | % Population |
| American | 39 | 0.9% |
| Belgian | 39 | 0.9% |
| Canadian | 10 | 0.2% |
| Czech | 16 | 0.4% |
| Dominican | 95 | 2.2% |
| Dutch | 61 | 1.4% |
| Eastern European | 11 | 0.3% |
| English | 371 | 8.7% |
| French | 39 | 0.9% |
| French Canadian | 10 | 0.2% |
| German | 1,654 | 38.8% |
| Greek | 11 | 0.3% |
| Hungarian | 40 | 0.9% |
| Irish | 472 | 11.1% |
| Italian | 261 | 6.1% |
| Japanese | 50 | 1.2% |
| Korean | 36 | 0.8% |
| Macedonian | 11 | 0.3% |
| Mexican | 9 | 0.2% |
| Pennsylvania German | 43 | 1.0% |
| Polish | 109 | 2.6% |
| Portuguese | 14 | 0.3% |
| Puerto Rican | 544 | 12.8% |
| Romanian | 10 | 0.2% |
| Russian | 47 | 1.1% |
| Scotch-Irish | 23 | 0.5% |
| Scottish | 73 | 1.7% |
| Slovak | 18 | 0.4% |
| Spaniard | 26 | 0.6% |
| Swedish | 33 | 0.8% |
| Swiss | 11 | 0.3% |
| Thai | 261 | 6.1% |
| Trinidadian and Tobagonian | 10 | 0.2% |
| Ukrainian | 26 | 0.6% |
| Welsh | 50 | 1.2% |
| Yugoslavian | 11 | 0.3% | View All 36 Rows |
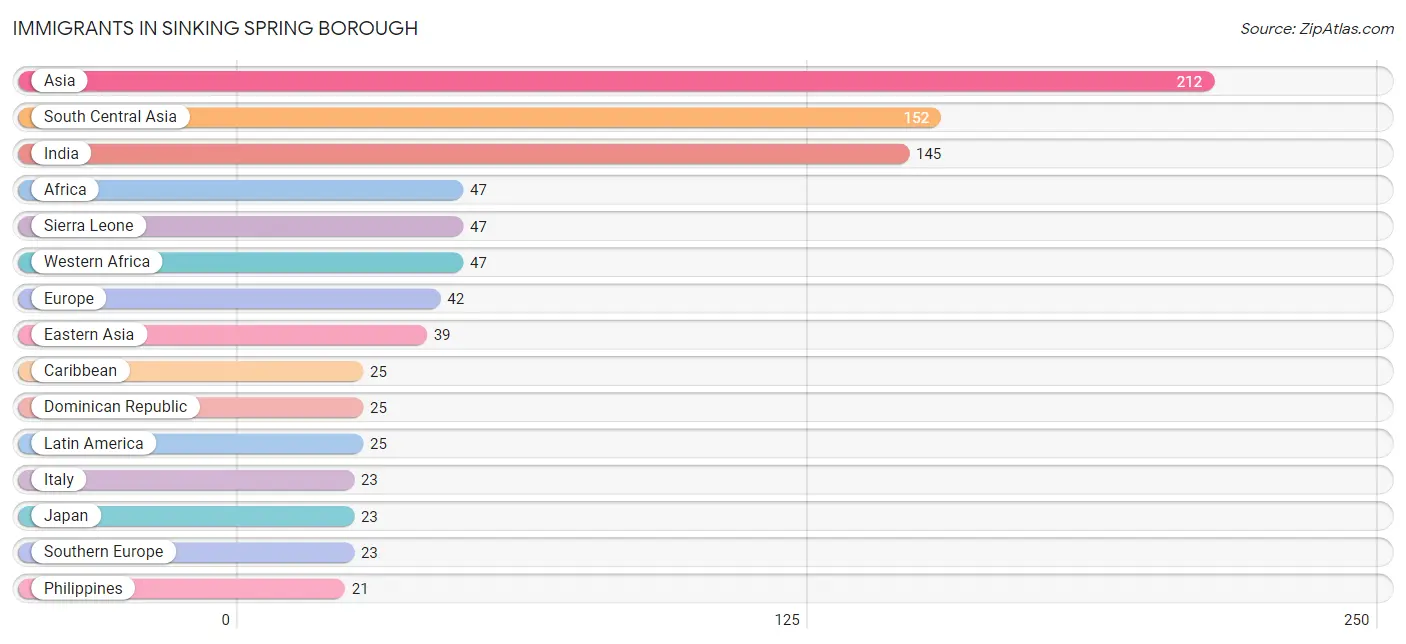
Immigrants in Sinking Spring borough
The most numerous immigrant groups reported in Sinking Spring borough came from Asia (212 | 5.0%), South Central Asia (152 | 3.6%), India (145 | 3.4%), Africa (47 | 1.1%), and Sierra Leone (47 | 1.1%), together accounting for 14.2% of all Sinking Spring borough residents.
| Immigration Origin | # Population | % Population |
| Africa | 47 | 1.1% |
| Asia | 212 | 5.0% |
| Caribbean | 25 | 0.6% |
| Dominican Republic | 25 | 0.6% |
| Eastern Asia | 39 | 0.9% |
| Eastern Europe | 11 | 0.3% |
| Europe | 42 | 1.0% |
| India | 145 | 3.4% |
| Italy | 23 | 0.5% |
| Japan | 23 | 0.5% |
| Korea | 16 | 0.4% |
| Latin America | 25 | 0.6% |
| Northern Europe | 8 | 0.2% |
| Pakistan | 7 | 0.2% |
| Philippines | 21 | 0.5% |
| Poland | 11 | 0.3% |
| Scotland | 8 | 0.2% |
| Sierra Leone | 47 | 1.1% |
| South Central Asia | 152 | 3.6% |
| South Eastern Asia | 21 | 0.5% |
| Southern Europe | 23 | 0.5% |
| Western Africa | 47 | 1.1% | View All 22 Rows |
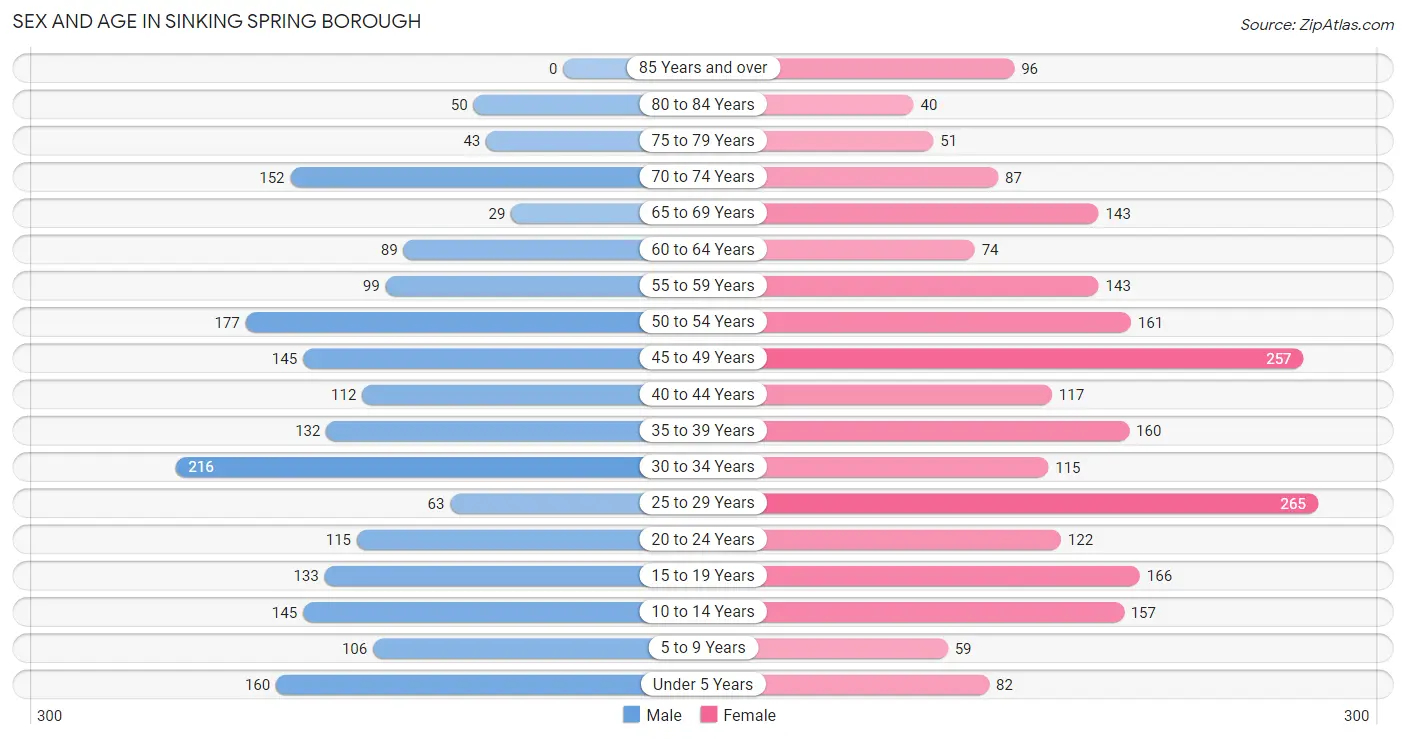
Sex and Age in Sinking Spring borough
Sex and Age in Sinking Spring borough
The most populous age groups in Sinking Spring borough are 30 to 34 Years (216 | 11.0%) for men and 25 to 29 Years (265 | 11.6%) for women.
| Age Bracket | Male | Female |
| Under 5 Years | 160 (8.1%) | 82 (3.6%) |
| 5 to 9 Years | 106 (5.4%) | 59 (2.6%) |
| 10 to 14 Years | 145 (7.4%) | 157 (6.8%) |
| 15 to 19 Years | 133 (6.8%) | 166 (7.2%) |
| 20 to 24 Years | 115 (5.9%) | 122 (5.3%) |
| 25 to 29 Years | 63 (3.2%) | 265 (11.6%) |
| 30 to 34 Years | 216 (11.0%) | 115 (5.0%) |
| 35 to 39 Years | 132 (6.7%) | 160 (7.0%) |
| 40 to 44 Years | 112 (5.7%) | 117 (5.1%) |
| 45 to 49 Years | 145 (7.4%) | 257 (11.2%) |
| 50 to 54 Years | 177 (9.0%) | 161 (7.0%) |
| 55 to 59 Years | 99 (5.0%) | 143 (6.2%) |
| 60 to 64 Years | 89 (4.5%) | 74 (3.2%) |
| 65 to 69 Years | 29 (1.5%) | 143 (6.2%) |
| 70 to 74 Years | 152 (7.7%) | 87 (3.8%) |
| 75 to 79 Years | 43 (2.2%) | 51 (2.2%) |
| 80 to 84 Years | 50 (2.5%) | 40 (1.7%) |
| 85 Years and over | 0 (0.0%) | 96 (4.2%) |
| Total | 1,966 (100.0%) | 2,295 (100.0%) |
Families and Households in Sinking Spring borough
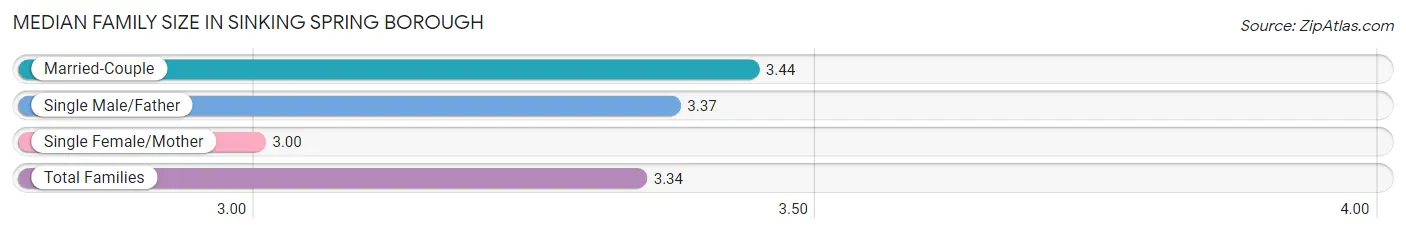
Median Family Size in Sinking Spring borough
The median family size in Sinking Spring borough is 3.34 persons per family, with married-couple families (759 | 73.2%) accounting for the largest median family size of 3.44 persons per family. On the other hand, single female/mother families (240 | 23.1%) represent the smallest median family size with 3.00 persons per family.
| Family Type | # Families | Family Size |
| Married-Couple | 759 (73.2%) | 3.44 |
| Single Male/Father | 38 (3.7%) | 3.37 |
| Single Female/Mother | 240 (23.1%) | 3.00 |
| Total Families | 1,037 (100.0%) | 3.34 |
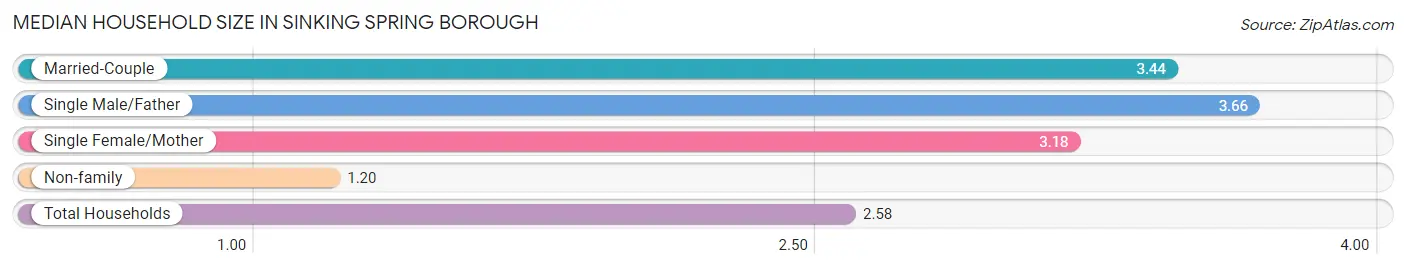
Median Household Size in Sinking Spring borough
The median household size in Sinking Spring borough is 2.58 persons per household, with single male/father households (38 | 2.3%) accounting for the largest median household size of 3.66 persons per household. non-family households (606 | 36.9%) represent the smallest median household size with 1.20 persons per household.
| Household Type | # Households | Household Size |
| Married-Couple | 759 (46.2%) | 3.44 |
| Single Male/Father | 38 (2.3%) | 3.66 |
| Single Female/Mother | 240 (14.6%) | 3.18 |
| Non-family | 606 (36.9%) | 1.20 |
| Total Households | 1,643 (100.0%) | 2.58 |
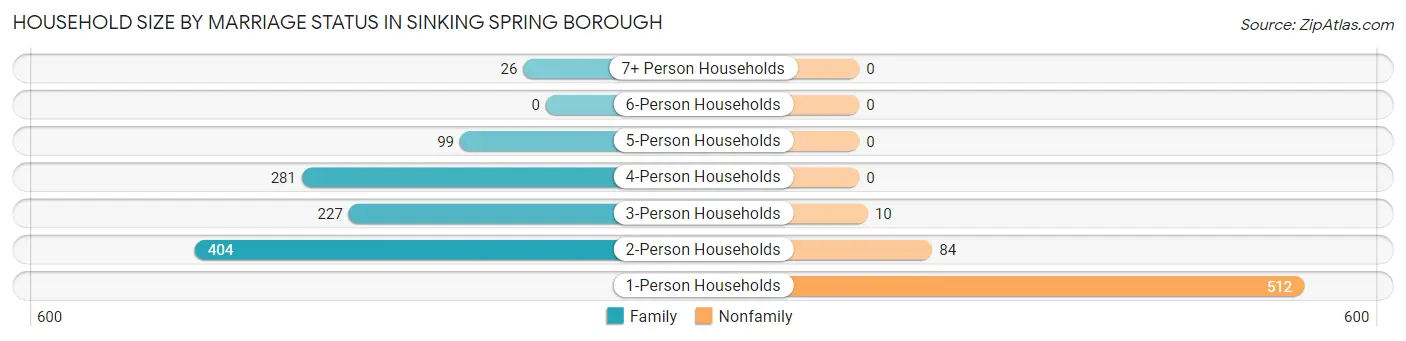
Household Size by Marriage Status in Sinking Spring borough
Out of a total of 1,643 households in Sinking Spring borough, 1,037 (63.1%) are family households, while 606 (36.9%) are nonfamily households. The most numerous type of family households are 2-person households, comprising 404, and the most common type of nonfamily households are 1-person households, comprising 512.
| Household Size | Family Households | Nonfamily Households |
| 1-Person Households | - | 512 (31.2%) |
| 2-Person Households | 404 (24.6%) | 84 (5.1%) |
| 3-Person Households | 227 (13.8%) | 10 (0.6%) |
| 4-Person Households | 281 (17.1%) | 0 (0.0%) |
| 5-Person Households | 99 (6.0%) | 0 (0.0%) |
| 6-Person Households | 0 (0.0%) | 0 (0.0%) |
| 7+ Person Households | 26 (1.6%) | 0 (0.0%) |
| Total | 1,037 (63.1%) | 606 (36.9%) |
Female Fertility in Sinking Spring borough
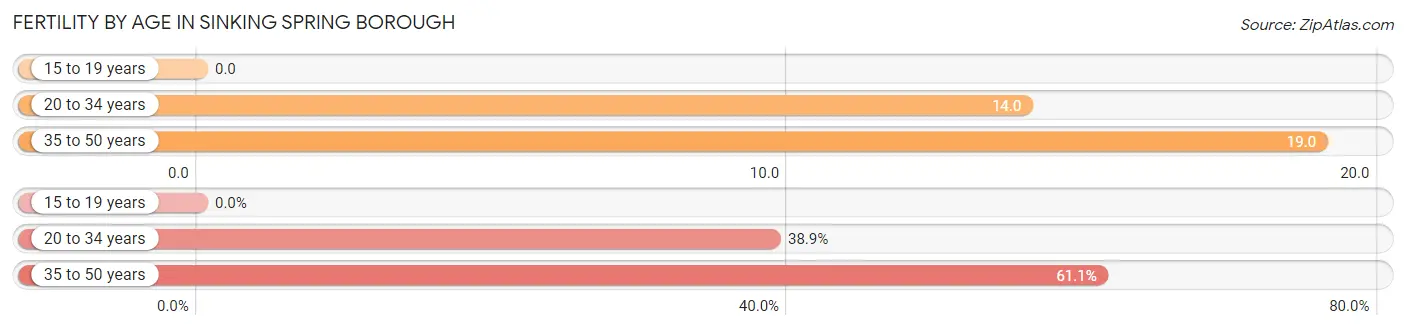
Fertility by Age in Sinking Spring borough
Average fertility rate in Sinking Spring borough is 15.0 births per 1,000 women. Women in the age bracket of 35 to 50 years have the highest fertility rate with 19.0 births per 1,000 women. Women in the age bracket of 35 to 50 years acount for 61.1% of all women with births.
| Age Bracket | Women with Births | Births / 1,000 Women |
| 15 to 19 years | 0 (0.0%) | 0.0 |
| 20 to 34 years | 7 (38.9%) | 14.0 |
| 35 to 50 years | 11 (61.1%) | 19.0 |
| Total | 18 (100.0%) | 15.0 |
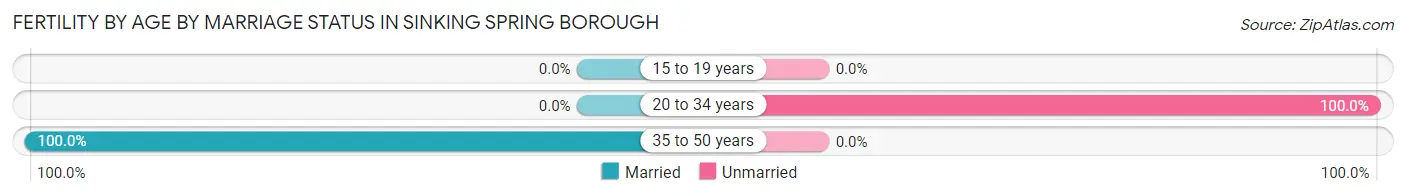
Fertility by Age by Marriage Status in Sinking Spring borough
61.1% of women with births (18) in Sinking Spring borough are married. The highest percentage of unmarried women with births falls into 20 to 34 years age bracket with 100.0% of them unmarried at the time of birth, while the lowest percentage of unmarried women with births belong to 35 to 50 years age bracket with 0.0% of them unmarried.
| Age Bracket | Married | Unmarried |
| 15 to 19 years | 0 (0.0%) | 0 (0.0%) |
| 20 to 34 years | 0 (0.0%) | 7 (100.0%) |
| 35 to 50 years | 11 (100.0%) | 0 (0.0%) |
| Total | 11 (61.1%) | 7 (38.9%) |
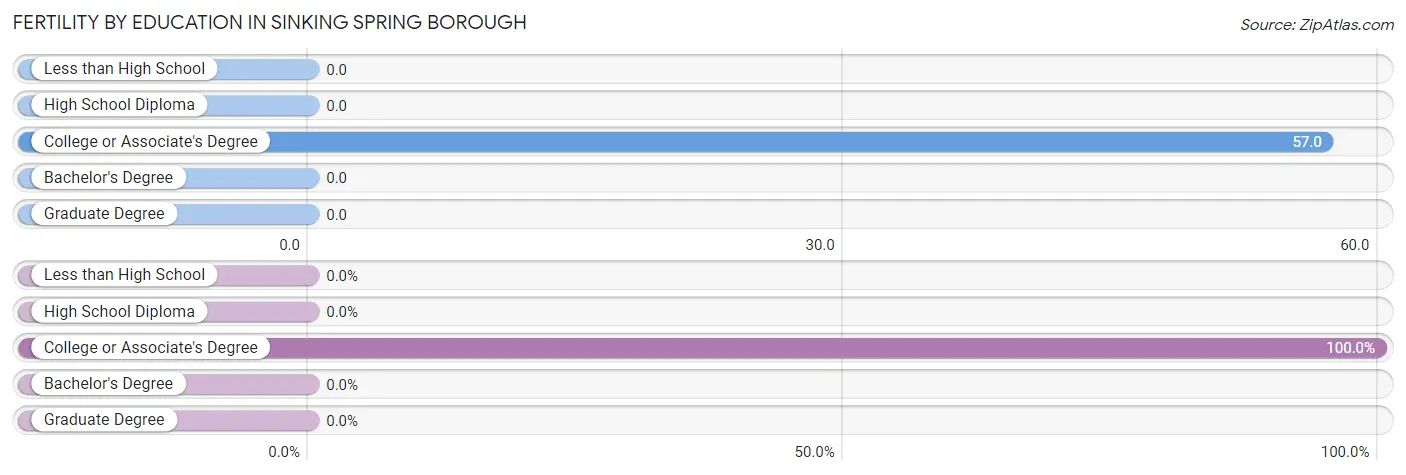
Fertility by Education in Sinking Spring borough
| Educational Attainment | Women with Births | Births / 1,000 Women |
| Less than High School | 0 (0.0%) | 0.0 |
| High School Diploma | 0 (0.0%) | 0.0 |
| College or Associate's Degree | 18 (100.0%) | 57.0 |
| Bachelor's Degree | 0 (0.0%) | 0.0 |
| Graduate Degree | 0 (0.0%) | 0.0 |
| Total | 18 (100.0%) | 15.0 |
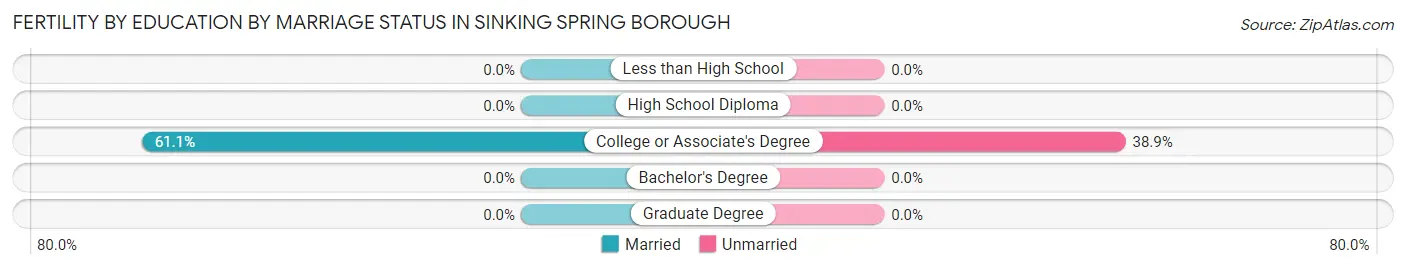
Fertility by Education by Marriage Status in Sinking Spring borough
38.9% of women with births in Sinking Spring borough are unmarried. Women with the educational attainment of college or associate's degree are most likely to be married with 61.1% of them married at childbirth, while women with the educational attainment of college or associate's degree are least likely to be married with 38.9% of them unmarried at childbirth.
| Educational Attainment | Married | Unmarried |
| Less than High School | 0 (0.0%) | 0 (0.0%) |
| High School Diploma | 0 (0.0%) | 0 (0.0%) |
| College or Associate's Degree | 11 (61.1%) | 7 (38.9%) |
| Bachelor's Degree | 0 (0.0%) | 0 (0.0%) |
| Graduate Degree | 0 (0.0%) | 0 (0.0%) |
| Total | 11 (61.1%) | 7 (38.9%) |
Employment Characteristics in Sinking Spring borough
Employment by Class of Employer in Sinking Spring borough
Among the 2,433 employed individuals in Sinking Spring borough, private company employees (1,817 | 74.7%), not-for-profit organizations (171 | 7.0%), and self-employed (incorporated) (147 | 6.0%) make up the most common classes of employment.
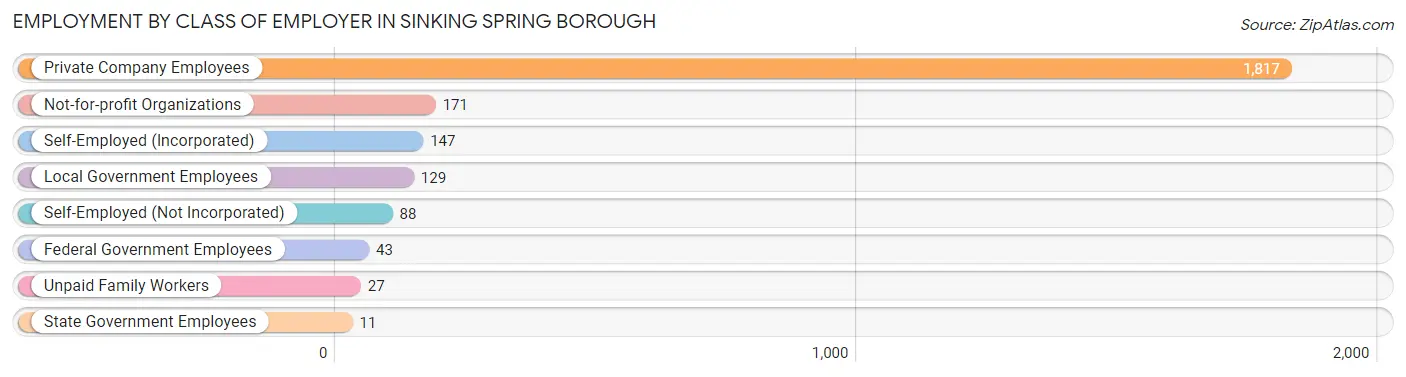
| Employer Class | # Employees | % Employees |
| Private Company Employees | 1,817 | 74.7% |
| Self-Employed (Incorporated) | 147 | 6.0% |
| Self-Employed (Not Incorporated) | 88 | 3.6% |
| Not-for-profit Organizations | 171 | 7.0% |
| Local Government Employees | 129 | 5.3% |
| State Government Employees | 11 | 0.4% |
| Federal Government Employees | 43 | 1.8% |
| Unpaid Family Workers | 27 | 1.1% |
| Total | 2,433 | 100.0% |
Employment Status by Age in Sinking Spring borough
According to the labor force statistics for Sinking Spring borough, out of the total population over 16 years of age (3,430), 74.4% or 2,552 individuals are in the labor force, with 2.6% or 66 of them unemployed. The age group with the highest labor force participation rate is 25 to 29 years, with 100.0% or 328 individuals in the labor force. Within the labor force, the 25 to 29 years age range has the highest percentage of unemployed individuals, with 12.5% or 41 of them being unemployed.
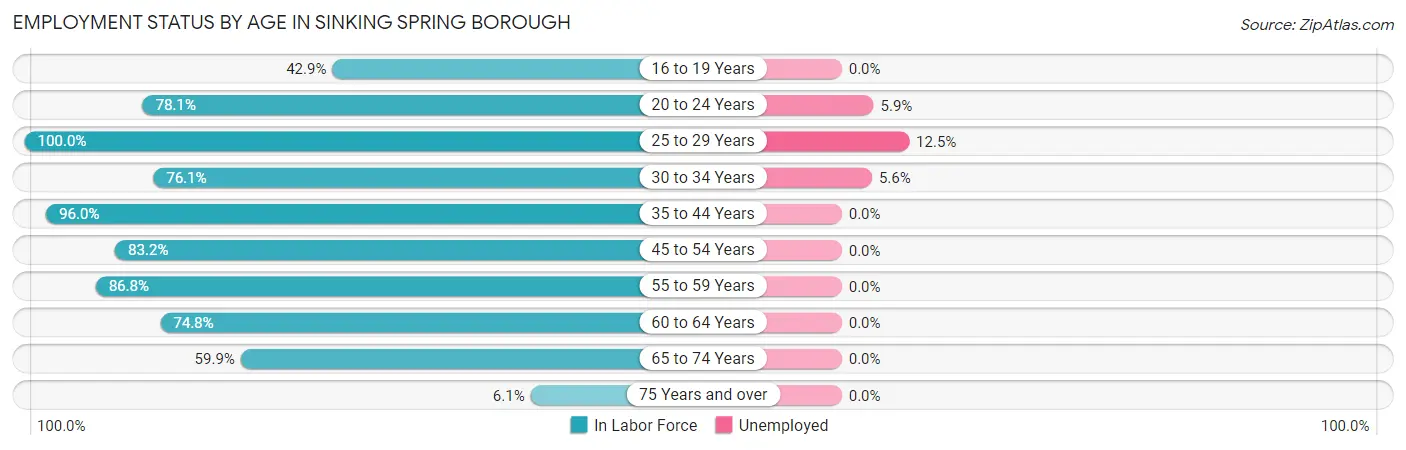
| Age Bracket | In Labor Force | Unemployed |
| 16 to 19 Years | 76 (42.9%) | 0 (0.0%) |
| 20 to 24 Years | 185 (78.1%) | 11 (5.9%) |
| 25 to 29 Years | 328 (100.0%) | 41 (12.5%) |
| 30 to 34 Years | 252 (76.1%) | 14 (5.6%) |
| 35 to 44 Years | 500 (96.0%) | 0 (0.0%) |
| 45 to 54 Years | 616 (83.2%) | 0 (0.0%) |
| 55 to 59 Years | 210 (86.8%) | 0 (0.0%) |
| 60 to 64 Years | 122 (74.8%) | 0 (0.0%) |
| 65 to 74 Years | 246 (59.9%) | 0 (0.0%) |
| 75 Years and over | 17 (6.1%) | 0 (0.0%) |
| Total | 2,552 (74.4%) | 66 (2.6%) |
Employment Status by Educational Attainment in Sinking Spring borough
According to labor force statistics for Sinking Spring borough, 87.2% of individuals (2,027) out of the total population between 25 and 64 years of age (2,325) are in the labor force, with 2.7% or 55 of them being unemployed. The group with the highest labor force participation rate are those with the educational attainment of college / associate degree, with 90.0% or 659 individuals in the labor force. Within the labor force, individuals with bachelor's degree or higher education have the highest percentage of unemployment, with 4.0% or 29 of them being unemployed.
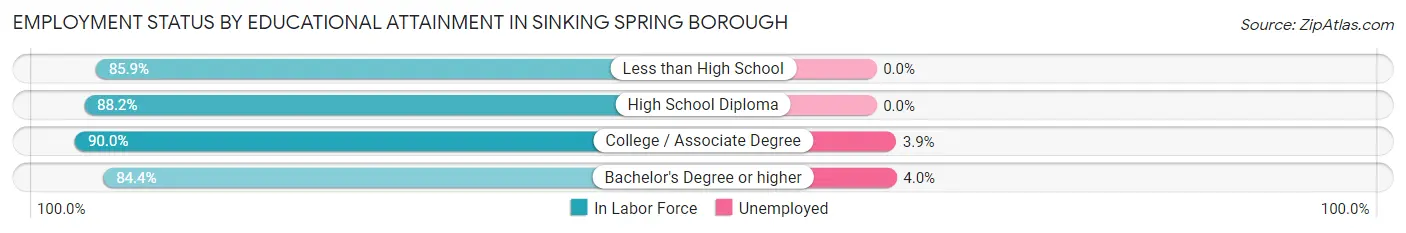
| Educational Attainment | In Labor Force | Unemployed |
| Less than High School | 146 (85.9%) | 0 (0.0%) |
| High School Diploma | 502 (88.2%) | 0 (0.0%) |
| College / Associate Degree | 659 (90.0%) | 29 (3.9%) |
| Bachelor's Degree or higher | 721 (84.4%) | 34 (4.0%) |
| Total | 2,027 (87.2%) | 63 (2.7%) |
Employment Occupations by Sex in Sinking Spring borough
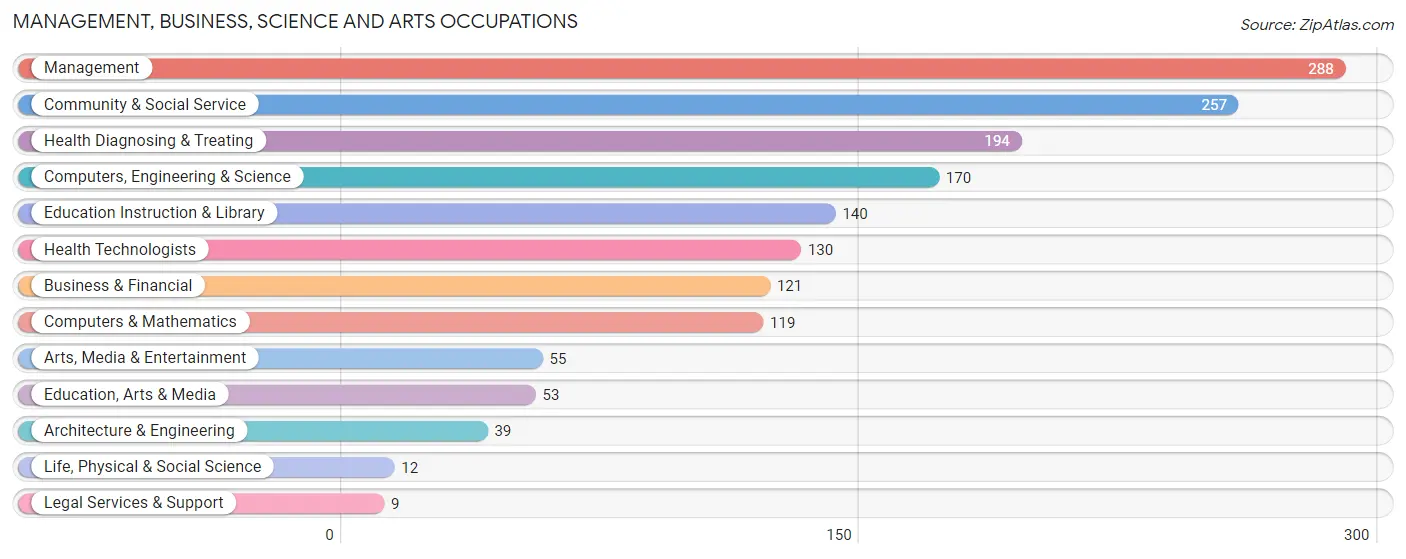
Management, Business, Science and Arts Occupations
The most common Management, Business, Science and Arts occupations in Sinking Spring borough are Management (288 | 11.6%), Community & Social Service (257 | 10.3%), Health Diagnosing & Treating (194 | 7.8%), Computers, Engineering & Science (170 | 6.8%), and Education Instruction & Library (140 | 5.6%).
Management, Business, Science and Arts Occupations by Sex
Within the Management, Business, Science and Arts occupations in Sinking Spring borough, the most male-oriented occupations are Legal Services & Support (100.0%), Computers & Mathematics (67.2%), and Health Technologists (60.8%), while the most female-oriented occupations are Life, Physical & Social Science (100.0%), Education Instruction & Library (100.0%), and Community & Social Service (77.8%).
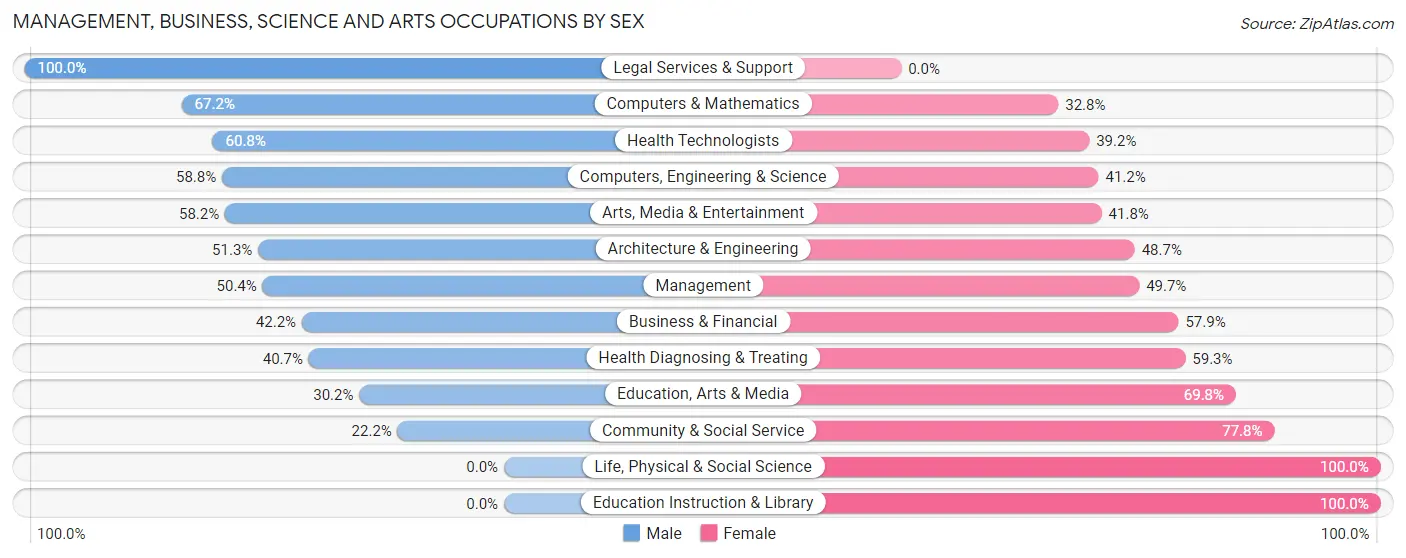
| Occupation | Male | Female |
| Management | 145 (50.3%) | 143 (49.6%) |
| Business & Financial | 51 (42.1%) | 70 (57.9%) |
| Computers, Engineering & Science | 100 (58.8%) | 70 (41.2%) |
| Computers & Mathematics | 80 (67.2%) | 39 (32.8%) |
| Architecture & Engineering | 20 (51.3%) | 19 (48.7%) |
| Life, Physical & Social Science | 0 (0.0%) | 12 (100.0%) |
| Community & Social Service | 57 (22.2%) | 200 (77.8%) |
| Education, Arts & Media | 16 (30.2%) | 37 (69.8%) |
| Legal Services & Support | 9 (100.0%) | 0 (0.0%) |
| Education Instruction & Library | 0 (0.0%) | 140 (100.0%) |
| Arts, Media & Entertainment | 32 (58.2%) | 23 (41.8%) |
| Health Diagnosing & Treating | 79 (40.7%) | 115 (59.3%) |
| Health Technologists | 79 (60.8%) | 51 (39.2%) |
| Total (Category) | 432 (41.9%) | 598 (58.1%) |
| Total (Overall) | 1,159 (46.6%) | 1,327 (53.4%) |
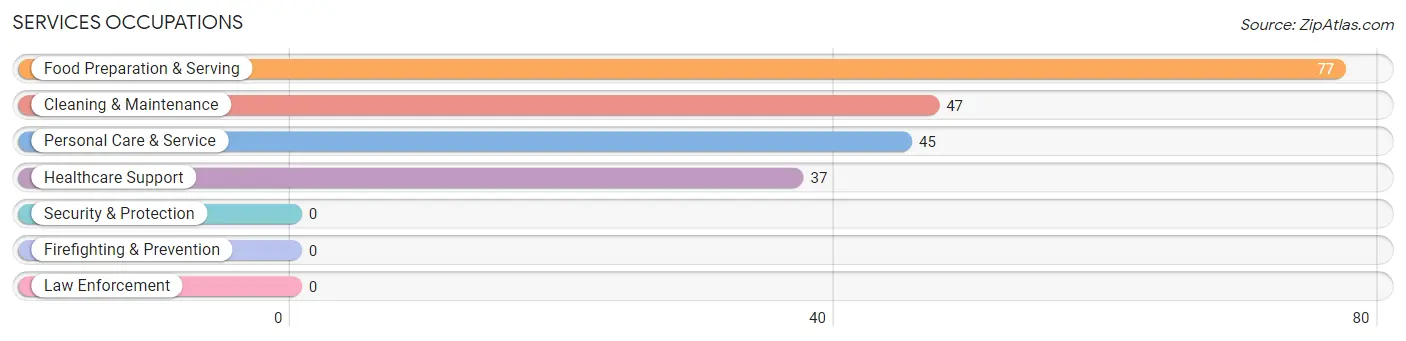
Services Occupations
The most common Services occupations in Sinking Spring borough are Food Preparation & Serving (77 | 3.1%), Cleaning & Maintenance (47 | 1.9%), Personal Care & Service (45 | 1.8%), and Healthcare Support (37 | 1.5%).
Services Occupations by Sex
Within the Services occupations in Sinking Spring borough, the most male-oriented occupations are Cleaning & Maintenance (80.8%), Personal Care & Service (40.0%), and Food Preparation & Serving (19.5%), while the most female-oriented occupations are Healthcare Support (100.0%), Food Preparation & Serving (80.5%), and Personal Care & Service (60.0%).
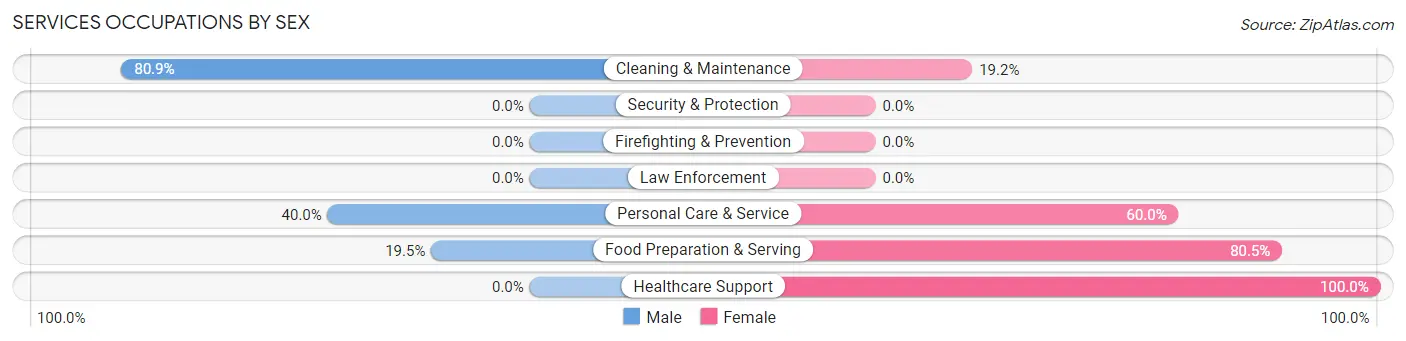
| Occupation | Male | Female |
| Healthcare Support | 0 (0.0%) | 37 (100.0%) |
| Security & Protection | 0 (0.0%) | 0 (0.0%) |
| Firefighting & Prevention | 0 (0.0%) | 0 (0.0%) |
| Law Enforcement | 0 (0.0%) | 0 (0.0%) |
| Food Preparation & Serving | 15 (19.5%) | 62 (80.5%) |
| Cleaning & Maintenance | 38 (80.8%) | 9 (19.2%) |
| Personal Care & Service | 18 (40.0%) | 27 (60.0%) |
| Total (Category) | 71 (34.5%) | 135 (65.5%) |
| Total (Overall) | 1,159 (46.6%) | 1,327 (53.4%) |
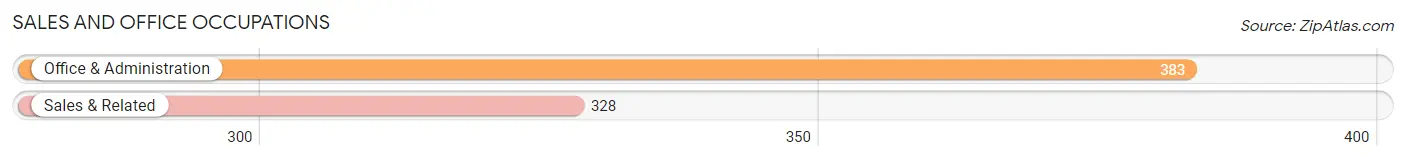
Sales and Office Occupations
The most common Sales and Office occupations in Sinking Spring borough are Office & Administration (383 | 15.4%), and Sales & Related (328 | 13.2%).
Sales and Office Occupations by Sex
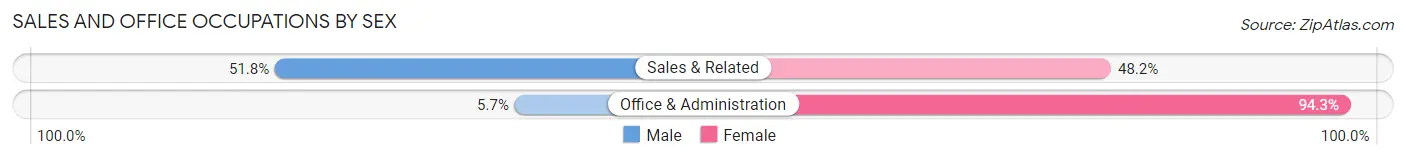
| Occupation | Male | Female |
| Sales & Related | 170 (51.8%) | 158 (48.2%) |
| Office & Administration | 22 (5.7%) | 361 (94.3%) |
| Total (Category) | 192 (27.0%) | 519 (73.0%) |
| Total (Overall) | 1,159 (46.6%) | 1,327 (53.4%) |
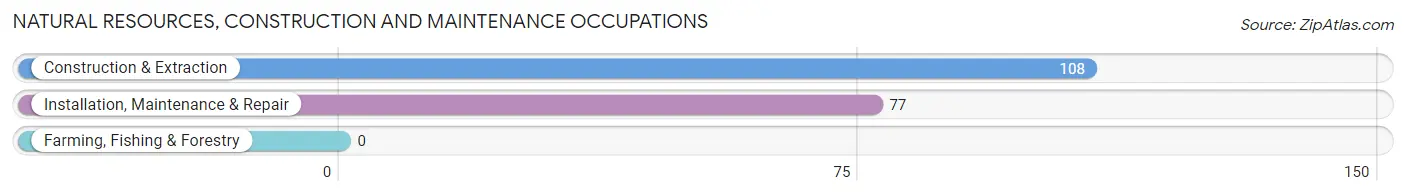
Natural Resources, Construction and Maintenance Occupations
The most common Natural Resources, Construction and Maintenance occupations in Sinking Spring borough are Construction & Extraction (108 | 4.3%), and Installation, Maintenance & Repair (77 | 3.1%).
Natural Resources, Construction and Maintenance Occupations by Sex
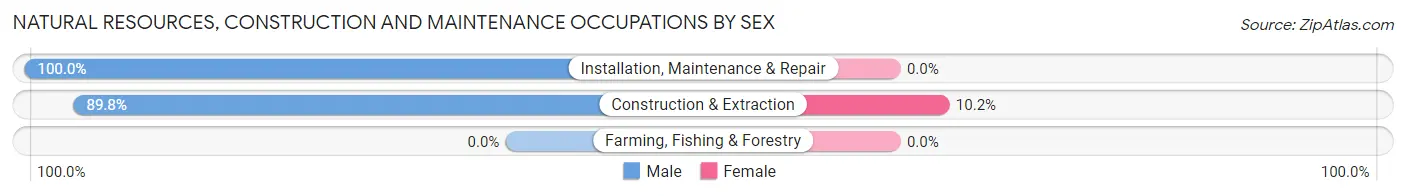
| Occupation | Male | Female |
| Farming, Fishing & Forestry | 0 (0.0%) | 0 (0.0%) |
| Construction & Extraction | 97 (89.8%) | 11 (10.2%) |
| Installation, Maintenance & Repair | 77 (100.0%) | 0 (0.0%) |
| Total (Category) | 174 (94.1%) | 11 (5.9%) |
| Total (Overall) | 1,159 (46.6%) | 1,327 (53.4%) |
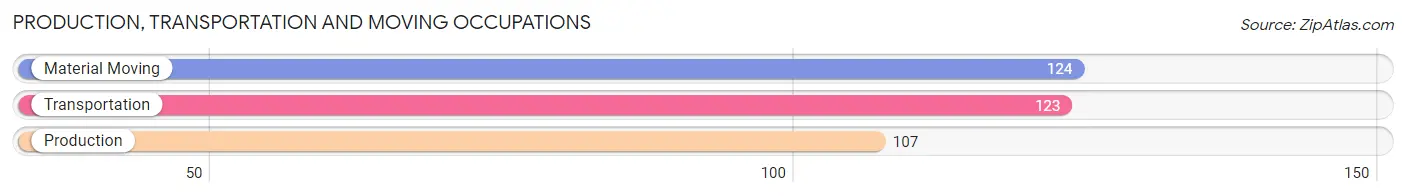
Production, Transportation and Moving Occupations
The most common Production, Transportation and Moving occupations in Sinking Spring borough are Material Moving (124 | 5.0%), Transportation (123 | 5.0%), and Production (107 | 4.3%).
Production, Transportation and Moving Occupations by Sex
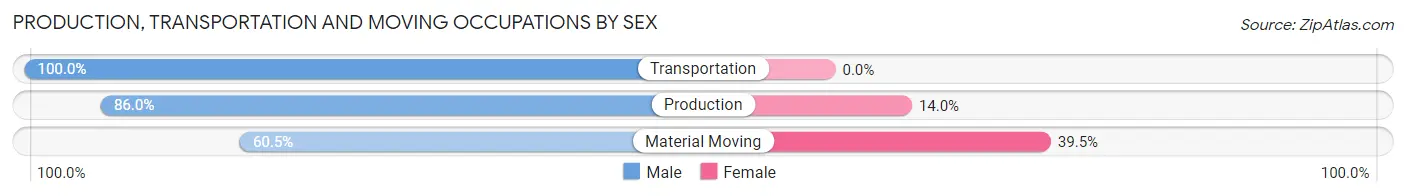
| Occupation | Male | Female |
| Production | 92 (86.0%) | 15 (14.0%) |
| Transportation | 123 (100.0%) | 0 (0.0%) |
| Material Moving | 75 (60.5%) | 49 (39.5%) |
| Total (Category) | 290 (81.9%) | 64 (18.1%) |
| Total (Overall) | 1,159 (46.6%) | 1,327 (53.4%) |
Employment Industries by Sex in Sinking Spring borough
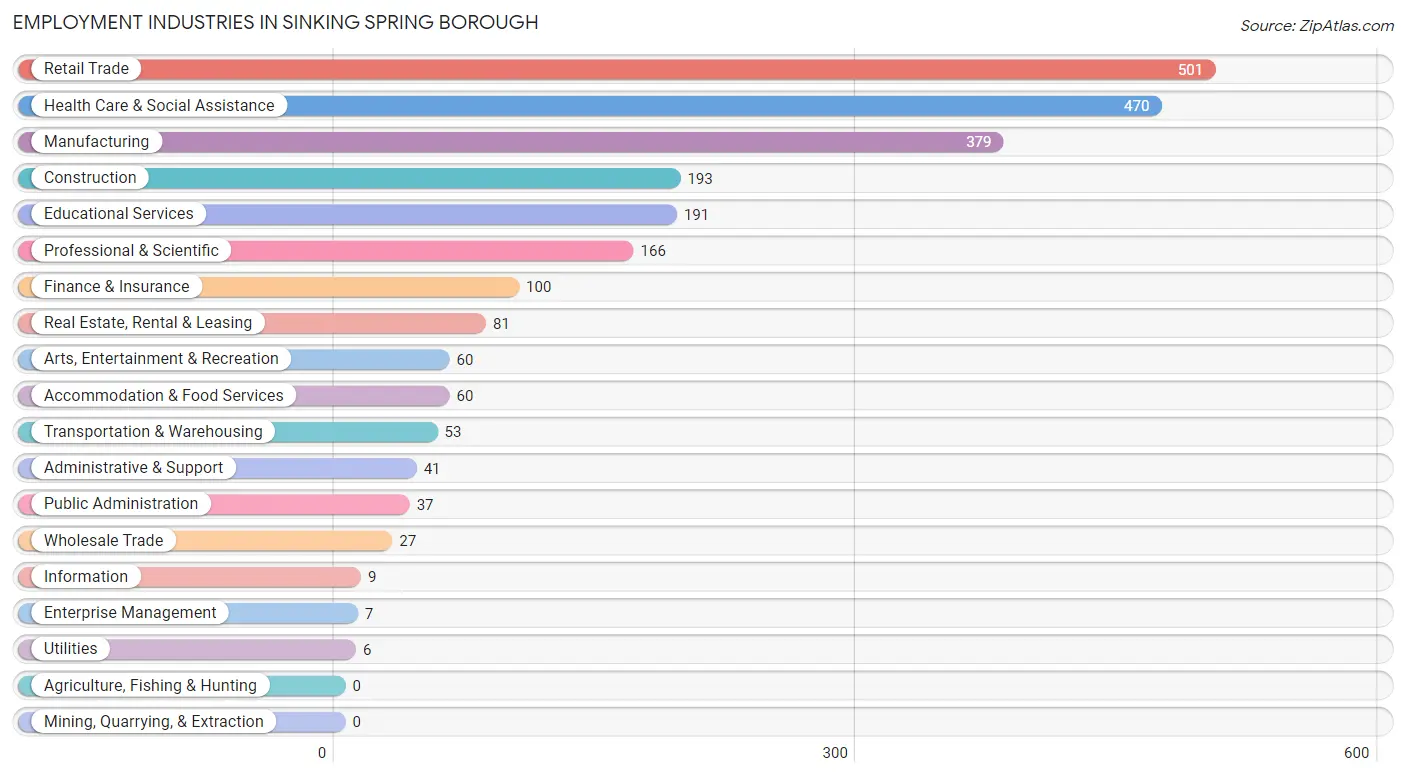
Employment Industries in Sinking Spring borough
The major employment industries in Sinking Spring borough include Retail Trade (501 | 20.2%), Health Care & Social Assistance (470 | 18.9%), Manufacturing (379 | 15.2%), Construction (193 | 7.8%), and Educational Services (191 | 7.7%).
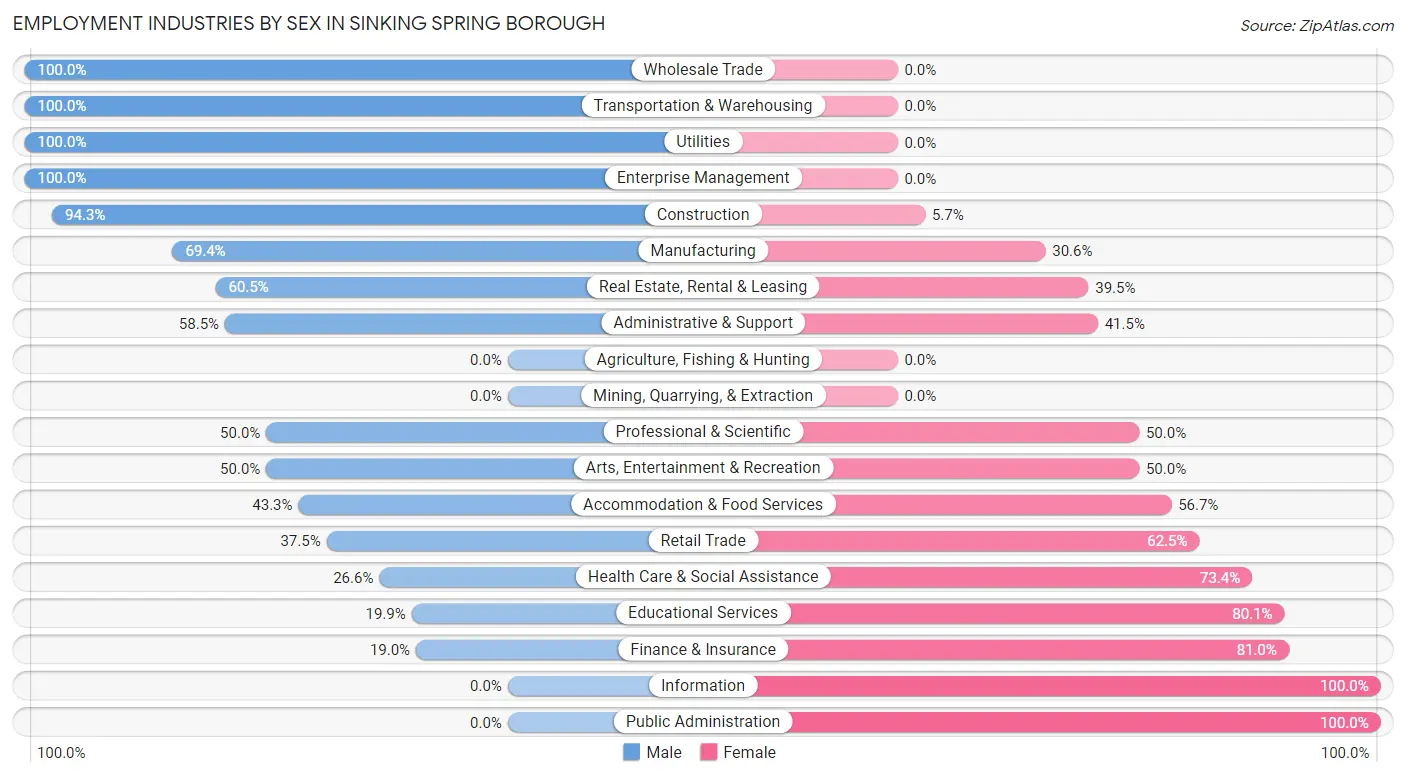
Employment Industries by Sex in Sinking Spring borough
The Sinking Spring borough industries that see more men than women are Wholesale Trade (100.0%), Transportation & Warehousing (100.0%), and Utilities (100.0%), whereas the industries that tend to have a higher number of women are Information (100.0%), Public Administration (100.0%), and Finance & Insurance (81.0%).
| Industry | Male | Female |
| Agriculture, Fishing & Hunting | 0 (0.0%) | 0 (0.0%) |
| Mining, Quarrying, & Extraction | 0 (0.0%) | 0 (0.0%) |
| Construction | 182 (94.3%) | 11 (5.7%) |
| Manufacturing | 263 (69.4%) | 116 (30.6%) |
| Wholesale Trade | 27 (100.0%) | 0 (0.0%) |
| Retail Trade | 188 (37.5%) | 313 (62.5%) |
| Transportation & Warehousing | 53 (100.0%) | 0 (0.0%) |
| Utilities | 6 (100.0%) | 0 (0.0%) |
| Information | 0 (0.0%) | 9 (100.0%) |
| Finance & Insurance | 19 (19.0%) | 81 (81.0%) |
| Real Estate, Rental & Leasing | 49 (60.5%) | 32 (39.5%) |
| Professional & Scientific | 83 (50.0%) | 83 (50.0%) |
| Enterprise Management | 7 (100.0%) | 0 (0.0%) |
| Administrative & Support | 24 (58.5%) | 17 (41.5%) |
| Educational Services | 38 (19.9%) | 153 (80.1%) |
| Health Care & Social Assistance | 125 (26.6%) | 345 (73.4%) |
| Arts, Entertainment & Recreation | 30 (50.0%) | 30 (50.0%) |
| Accommodation & Food Services | 26 (43.3%) | 34 (56.7%) |
| Public Administration | 0 (0.0%) | 37 (100.0%) |
| Total | 1,159 (46.6%) | 1,327 (53.4%) |
Education in Sinking Spring borough
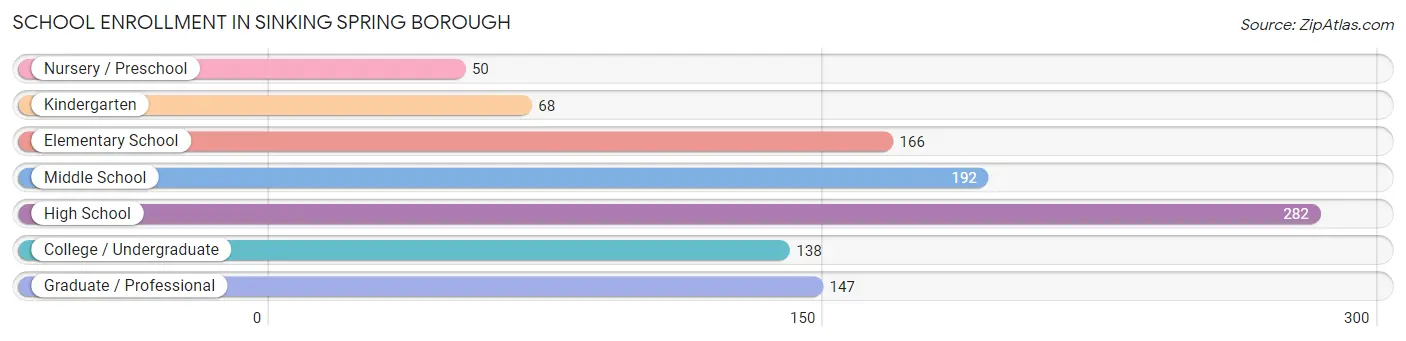
School Enrollment in Sinking Spring borough
The most common levels of schooling among the 1,043 students in Sinking Spring borough are high school (282 | 27.0%), middle school (192 | 18.4%), and elementary school (166 | 15.9%).
| School Level | # Students | % Students |
| Nursery / Preschool | 50 | 4.8% |
| Kindergarten | 68 | 6.5% |
| Elementary School | 166 | 15.9% |
| Middle School | 192 | 18.4% |
| High School | 282 | 27.0% |
| College / Undergraduate | 138 | 13.2% |
| Graduate / Professional | 147 | 14.1% |
| Total | 1,043 | 100.0% |
School Enrollment by Age by Funding Source in Sinking Spring borough
Out of a total of 1,043 students who are enrolled in schools in Sinking Spring borough, 165 (15.8%) attend a private institution, while the remaining 878 (84.2%) are enrolled in public schools. The age group of 35 years and over has the highest likelihood of being enrolled in private schools, with 95 (78.5% in the age bracket) enrolled. Conversely, the age group of 25 to 34 year olds has the lowest likelihood of being enrolled in a private school, with 47 (100.0% in the age bracket) attending a public institution.
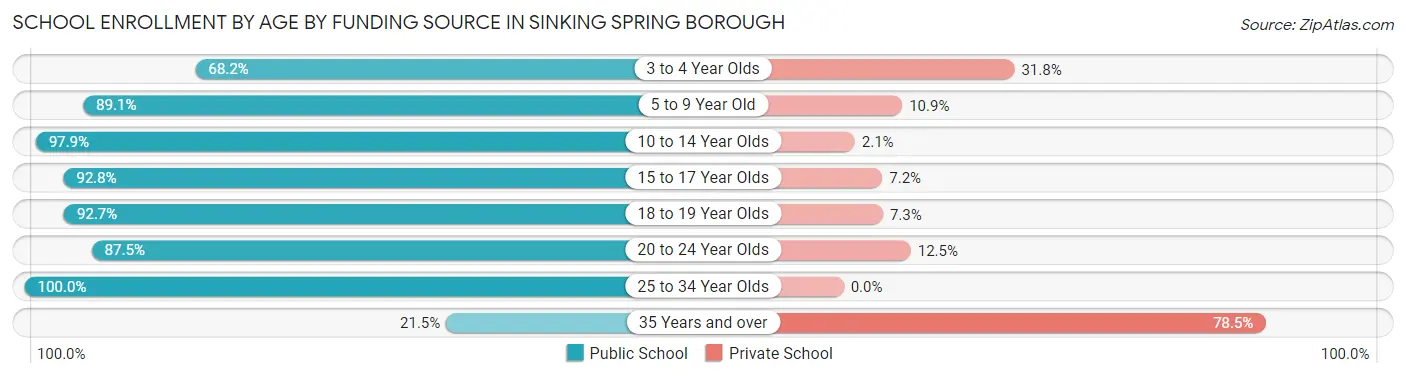
| Age Bracket | Public School | Private School |
| 3 to 4 Year Olds | 30 (68.2%) | 14 (31.8%) |
| 5 to 9 Year Old | 147 (89.1%) | 18 (10.9%) |
| 10 to 14 Year Olds | 282 (97.9%) | 6 (2.1%) |
| 15 to 17 Year Olds | 193 (92.8%) | 15 (7.2%) |
| 18 to 19 Year Olds | 76 (92.7%) | 6 (7.3%) |
| 20 to 24 Year Olds | 77 (87.5%) | 11 (12.5%) |
| 25 to 34 Year Olds | 47 (100.0%) | 0 (0.0%) |
| 35 Years and over | 26 (21.5%) | 95 (78.5%) |
| Total | 878 (84.2%) | 165 (15.8%) |
Educational Attainment by Field of Study in Sinking Spring borough
Business (232 | 22.7%), education (140 | 13.7%), science & technology (131 | 12.8%), psychology (112 | 11.0%), and bio, nature & agricultural (88 | 8.6%) are the most common fields of study among 1,023 individuals in Sinking Spring borough who have obtained a bachelor's degree or higher.
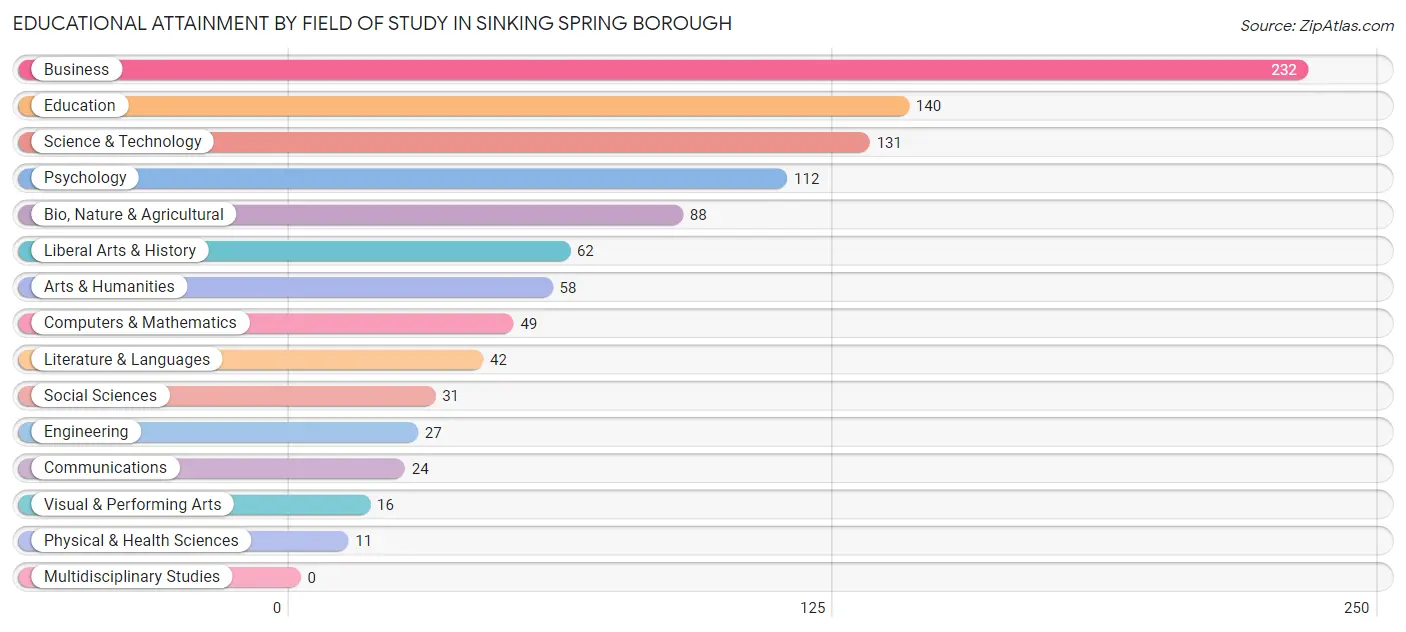
| Field of Study | # Graduates | % Graduates |
| Computers & Mathematics | 49 | 4.8% |
| Bio, Nature & Agricultural | 88 | 8.6% |
| Physical & Health Sciences | 11 | 1.1% |
| Psychology | 112 | 11.0% |
| Social Sciences | 31 | 3.0% |
| Engineering | 27 | 2.6% |
| Multidisciplinary Studies | 0 | 0.0% |
| Science & Technology | 131 | 12.8% |
| Business | 232 | 22.7% |
| Education | 140 | 13.7% |
| Literature & Languages | 42 | 4.1% |
| Liberal Arts & History | 62 | 6.1% |
| Visual & Performing Arts | 16 | 1.6% |
| Communications | 24 | 2.4% |
| Arts & Humanities | 58 | 5.7% |
| Total | 1,023 | 100.0% |
Transportation & Commute in Sinking Spring borough
Vehicle Availability by Sex in Sinking Spring borough
The most prevalent vehicle ownership categories in Sinking Spring borough are males with 2 vehicles (516, accounting for 45.7%) and females with 2 vehicles (403, making up 39.6%).
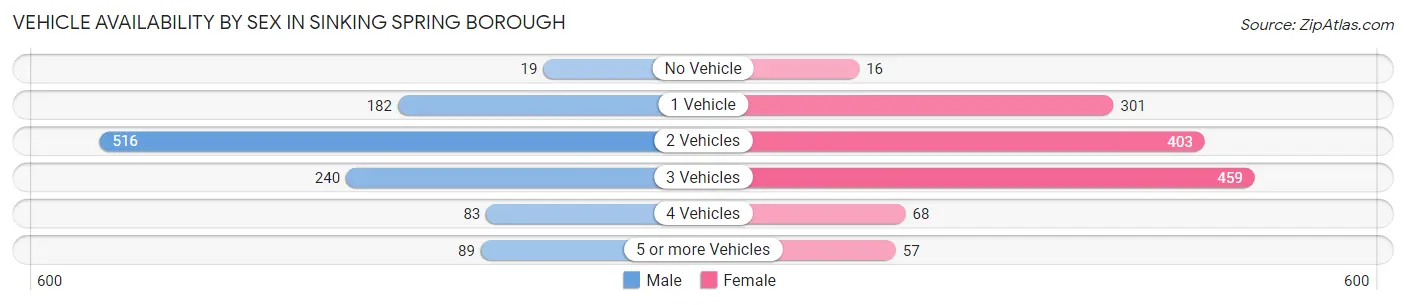
| Vehicles Available | Male | Female |
| No Vehicle | 19 (1.7%) | 16 (1.2%) |
| 1 Vehicle | 182 (16.1%) | 301 (23.1%) |
| 2 Vehicles | 516 (45.7%) | 403 (30.9%) |
| 3 Vehicles | 240 (21.3%) | 459 (35.2%) |
| 4 Vehicles | 83 (7.3%) | 68 (5.2%) |
| 5 or more Vehicles | 89 (7.9%) | 57 (4.4%) |
| Total | 1,129 (100.0%) | 1,304 (100.0%) |
Commute Time in Sinking Spring borough
The most frequently occuring commute durations in Sinking Spring borough are 15 to 19 minutes (487 commuters, 22.5%), 30 to 34 minutes (370 commuters, 17.1%), and 10 to 14 minutes (364 commuters, 16.8%).
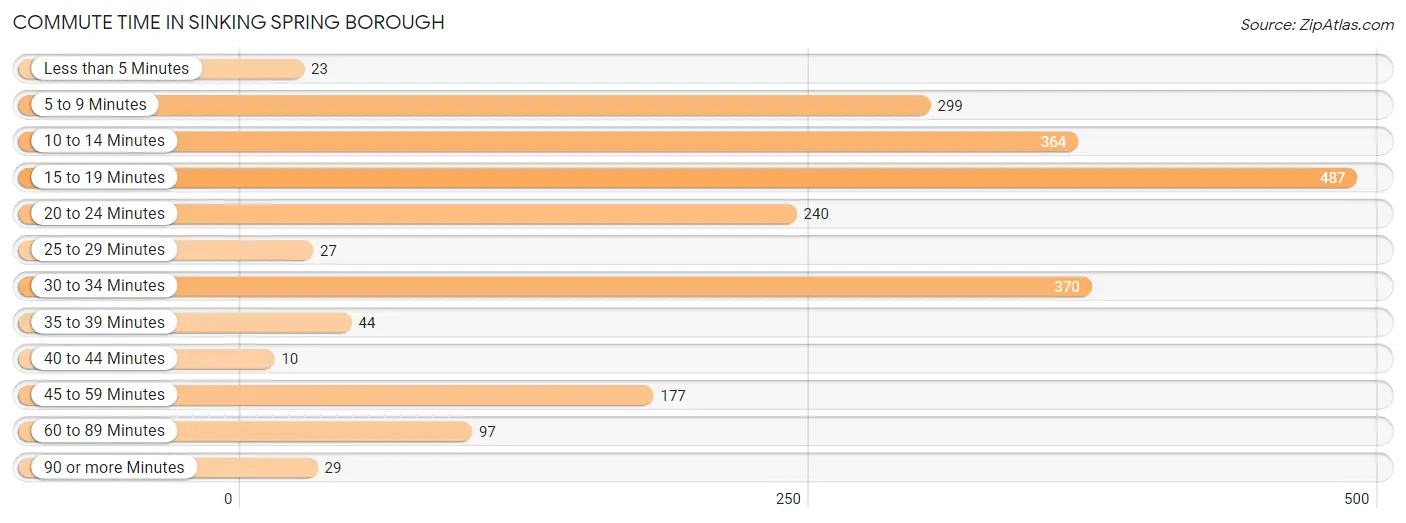
| Commute Time | # Commuters | % Commuters |
| Less than 5 Minutes | 23 | 1.1% |
| 5 to 9 Minutes | 299 | 13.8% |
| 10 to 14 Minutes | 364 | 16.8% |
| 15 to 19 Minutes | 487 | 22.5% |
| 20 to 24 Minutes | 240 | 11.1% |
| 25 to 29 Minutes | 27 | 1.3% |
| 30 to 34 Minutes | 370 | 17.1% |
| 35 to 39 Minutes | 44 | 2.0% |
| 40 to 44 Minutes | 10 | 0.5% |
| 45 to 59 Minutes | 177 | 8.2% |
| 60 to 89 Minutes | 97 | 4.5% |
| 90 or more Minutes | 29 | 1.3% |
Commute Time by Sex in Sinking Spring borough
The most common commute times in Sinking Spring borough are 30 to 34 minutes (268 commuters, 26.0%) for males and 15 to 19 minutes (358 commuters, 31.5%) for females.
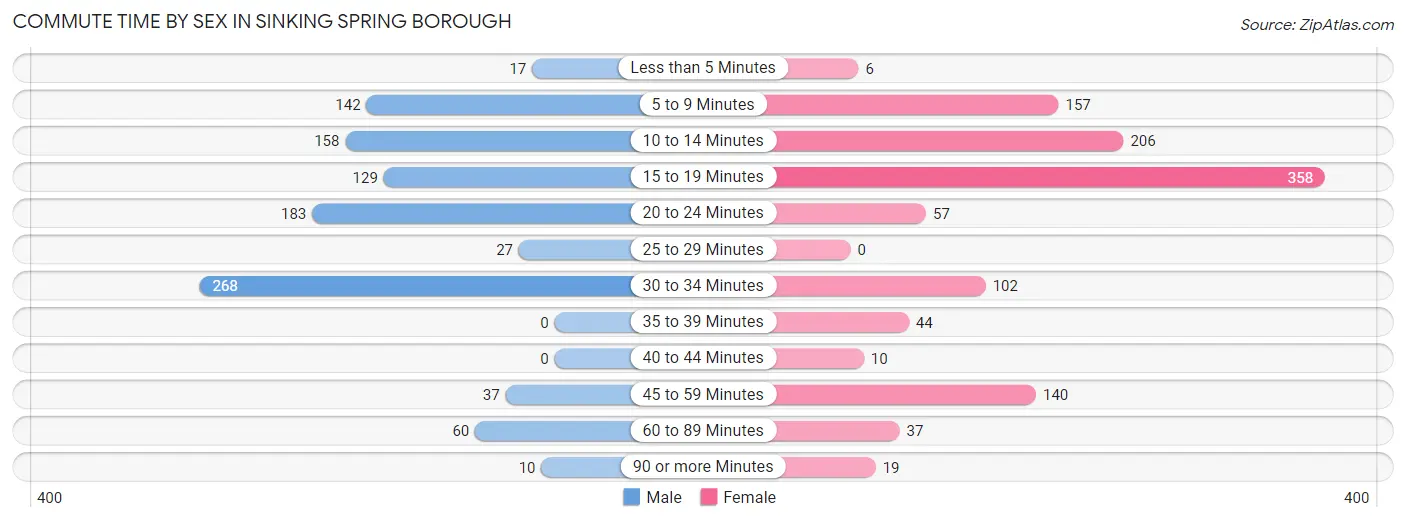
| Commute Time | Male | Female |
| Less than 5 Minutes | 17 (1.7%) | 6 (0.5%) |
| 5 to 9 Minutes | 142 (13.8%) | 157 (13.8%) |
| 10 to 14 Minutes | 158 (15.3%) | 206 (18.1%) |
| 15 to 19 Minutes | 129 (12.5%) | 358 (31.5%) |
| 20 to 24 Minutes | 183 (17.7%) | 57 (5.0%) |
| 25 to 29 Minutes | 27 (2.6%) | 0 (0.0%) |
| 30 to 34 Minutes | 268 (26.0%) | 102 (9.0%) |
| 35 to 39 Minutes | 0 (0.0%) | 44 (3.9%) |
| 40 to 44 Minutes | 0 (0.0%) | 10 (0.9%) |
| 45 to 59 Minutes | 37 (3.6%) | 140 (12.3%) |
| 60 to 89 Minutes | 60 (5.8%) | 37 (3.3%) |
| 90 or more Minutes | 10 (1.0%) | 19 (1.7%) |
Time of Departure to Work by Sex in Sinking Spring borough
The most frequent times of departure to work in Sinking Spring borough are 7:00 AM to 7:29 AM (163, 15.8%) for males and 6:30 AM to 6:59 AM (183, 16.1%) for females.
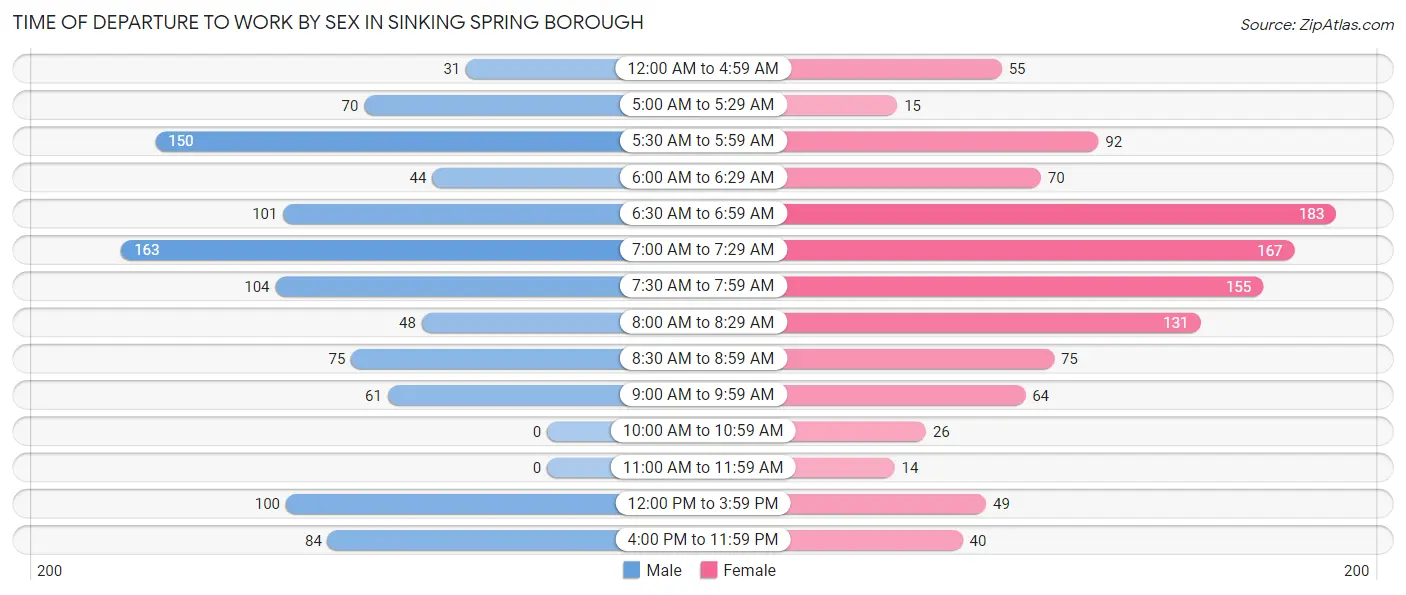
| Time of Departure | Male | Female |
| 12:00 AM to 4:59 AM | 31 (3.0%) | 55 (4.8%) |
| 5:00 AM to 5:29 AM | 70 (6.8%) | 15 (1.3%) |
| 5:30 AM to 5:59 AM | 150 (14.5%) | 92 (8.1%) |
| 6:00 AM to 6:29 AM | 44 (4.3%) | 70 (6.2%) |
| 6:30 AM to 6:59 AM | 101 (9.8%) | 183 (16.1%) |
| 7:00 AM to 7:29 AM | 163 (15.8%) | 167 (14.7%) |
| 7:30 AM to 7:59 AM | 104 (10.1%) | 155 (13.6%) |
| 8:00 AM to 8:29 AM | 48 (4.7%) | 131 (11.5%) |
| 8:30 AM to 8:59 AM | 75 (7.3%) | 75 (6.6%) |
| 9:00 AM to 9:59 AM | 61 (5.9%) | 64 (5.6%) |
| 10:00 AM to 10:59 AM | 0 (0.0%) | 26 (2.3%) |
| 11:00 AM to 11:59 AM | 0 (0.0%) | 14 (1.2%) |
| 12:00 PM to 3:59 PM | 100 (9.7%) | 49 (4.3%) |
| 4:00 PM to 11:59 PM | 84 (8.2%) | 40 (3.5%) |
| Total | 1,031 (100.0%) | 1,136 (100.0%) |
Housing Occupancy in Sinking Spring borough
Occupancy by Ownership in Sinking Spring borough
Of the total 1,643 dwellings in Sinking Spring borough, owner-occupied units account for 969 (59.0%), while renter-occupied units make up 674 (41.0%).
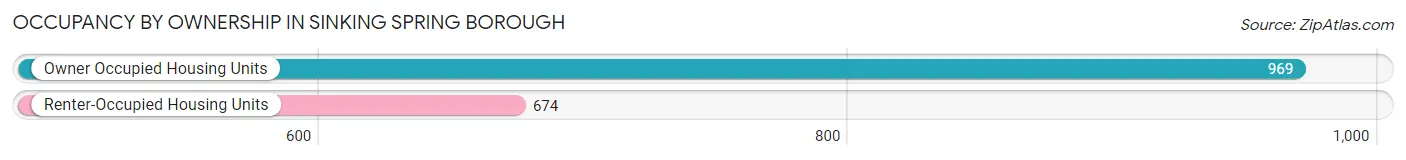
| Occupancy | # Housing Units | % Housing Units |
| Owner Occupied Housing Units | 969 | 59.0% |
| Renter-Occupied Housing Units | 674 | 41.0% |
| Total Occupied Housing Units | 1,643 | 100.0% |
Occupancy by Household Size in Sinking Spring borough
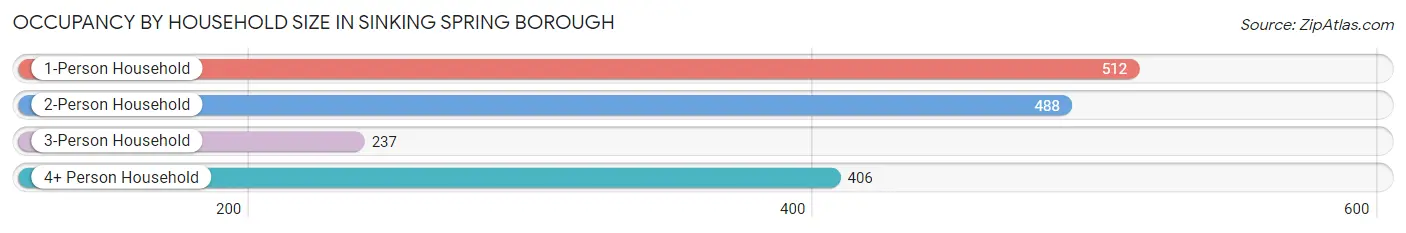
| Household Size | # Housing Units | % Housing Units |
| 1-Person Household | 512 | 31.2% |
| 2-Person Household | 488 | 29.7% |
| 3-Person Household | 237 | 14.4% |
| 4+ Person Household | 406 | 24.7% |
| Total Housing Units | 1,643 | 100.0% |
Occupancy by Ownership by Household Size in Sinking Spring borough
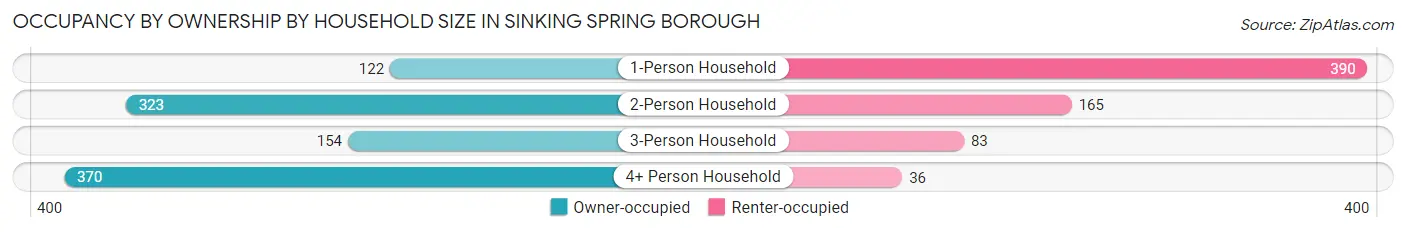
| Household Size | Owner-occupied | Renter-occupied |
| 1-Person Household | 122 (23.8%) | 390 (76.2%) |
| 2-Person Household | 323 (66.2%) | 165 (33.8%) |
| 3-Person Household | 154 (65.0%) | 83 (35.0%) |
| 4+ Person Household | 370 (91.1%) | 36 (8.9%) |
| Total Housing Units | 969 (59.0%) | 674 (41.0%) |
Occupancy by Educational Attainment in Sinking Spring borough
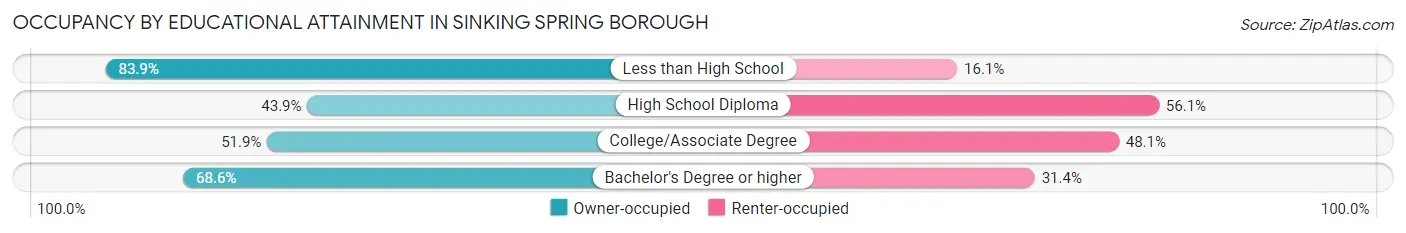
| Household Size | Owner-occupied | Renter-occupied |
| Less than High School | 162 (83.9%) | 31 (16.1%) |
| High School Diploma | 185 (43.9%) | 236 (56.1%) |
| College/Associate Degree | 260 (51.9%) | 241 (48.1%) |
| Bachelor's Degree or higher | 362 (68.6%) | 166 (31.4%) |
Occupancy by Age of Householder in Sinking Spring borough
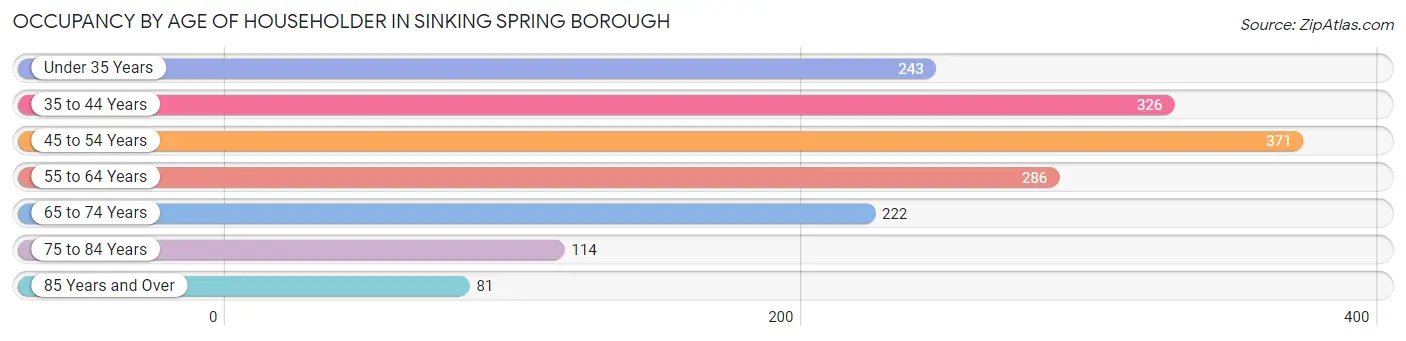
| Age Bracket | # Households | % Households |
| Under 35 Years | 243 | 14.8% |
| 35 to 44 Years | 326 | 19.8% |
| 45 to 54 Years | 371 | 22.6% |
| 55 to 64 Years | 286 | 17.4% |
| 65 to 74 Years | 222 | 13.5% |
| 75 to 84 Years | 114 | 6.9% |
| 85 Years and Over | 81 | 4.9% |
| Total | 1,643 | 100.0% |
Housing Finances in Sinking Spring borough
Median Income by Occupancy in Sinking Spring borough
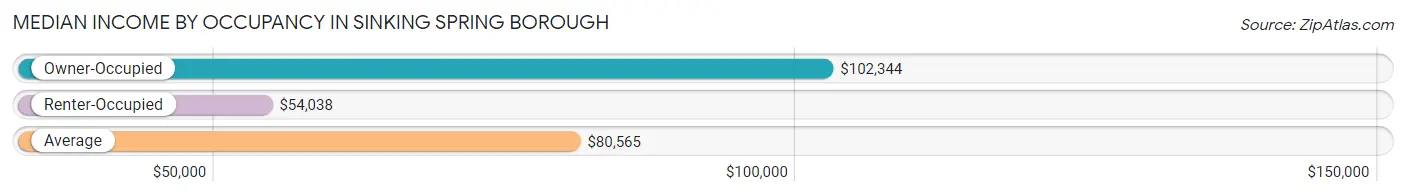
| Occupancy Type | # Households | Median Income |
| Owner-Occupied | 969 (59.0%) | $102,344 |
| Renter-Occupied | 674 (41.0%) | $54,038 |
| Average | 1,643 (100.0%) | $80,565 |
Occupancy by Householder Income Bracket in Sinking Spring borough
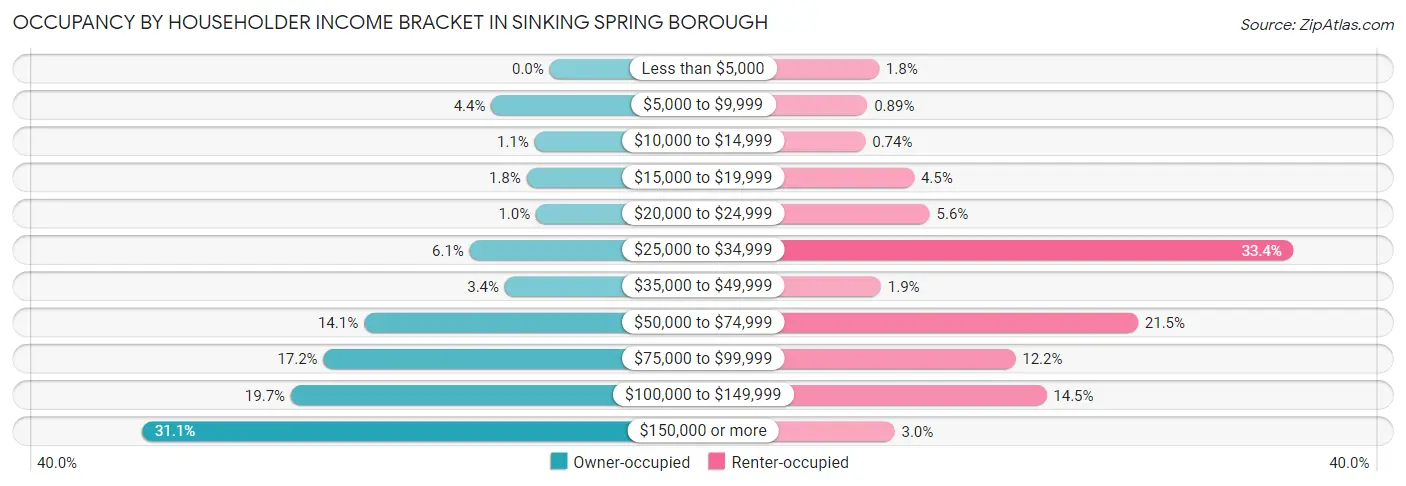
| Income Bracket | Owner-occupied | Renter-occupied |
| Less than $5,000 | 0 (0.0%) | 12 (1.8%) |
| $5,000 to $9,999 | 43 (4.4%) | 6 (0.9%) |
| $10,000 to $14,999 | 11 (1.1%) | 5 (0.7%) |
| $15,000 to $19,999 | 17 (1.8%) | 30 (4.4%) |
| $20,000 to $24,999 | 10 (1.0%) | 38 (5.6%) |
| $25,000 to $34,999 | 59 (6.1%) | 225 (33.4%) |
| $35,000 to $49,999 | 33 (3.4%) | 13 (1.9%) |
| $50,000 to $74,999 | 137 (14.1%) | 145 (21.5%) |
| $75,000 to $99,999 | 167 (17.2%) | 82 (12.2%) |
| $100,000 to $149,999 | 191 (19.7%) | 98 (14.5%) |
| $150,000 or more | 301 (31.1%) | 20 (3.0%) |
| Total | 969 (100.0%) | 674 (100.0%) |
Monthly Housing Cost Tiers in Sinking Spring borough
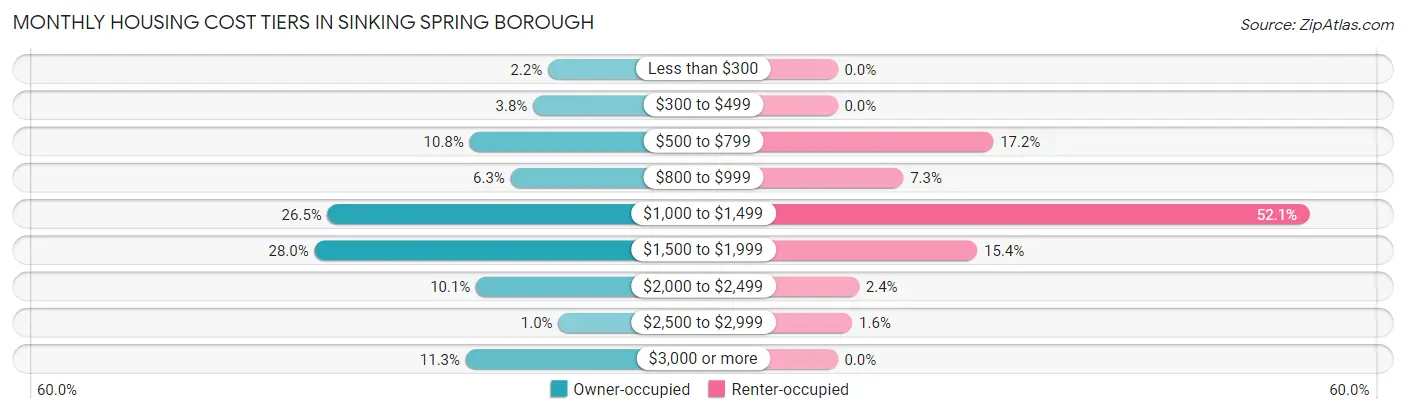
| Monthly Cost | Owner-occupied | Renter-occupied |
| Less than $300 | 21 (2.2%) | 0 (0.0%) |
| $300 to $499 | 37 (3.8%) | 0 (0.0%) |
| $500 to $799 | 105 (10.8%) | 116 (17.2%) |
| $800 to $999 | 61 (6.3%) | 49 (7.3%) |
| $1,000 to $1,499 | 257 (26.5%) | 351 (52.1%) |
| $1,500 to $1,999 | 271 (28.0%) | 104 (15.4%) |
| $2,000 to $2,499 | 98 (10.1%) | 16 (2.4%) |
| $2,500 to $2,999 | 10 (1.0%) | 11 (1.6%) |
| $3,000 or more | 109 (11.3%) | 0 (0.0%) |
| Total | 969 (100.0%) | 674 (100.0%) |
Physical Housing Characteristics in Sinking Spring borough
Housing Structures in Sinking Spring borough
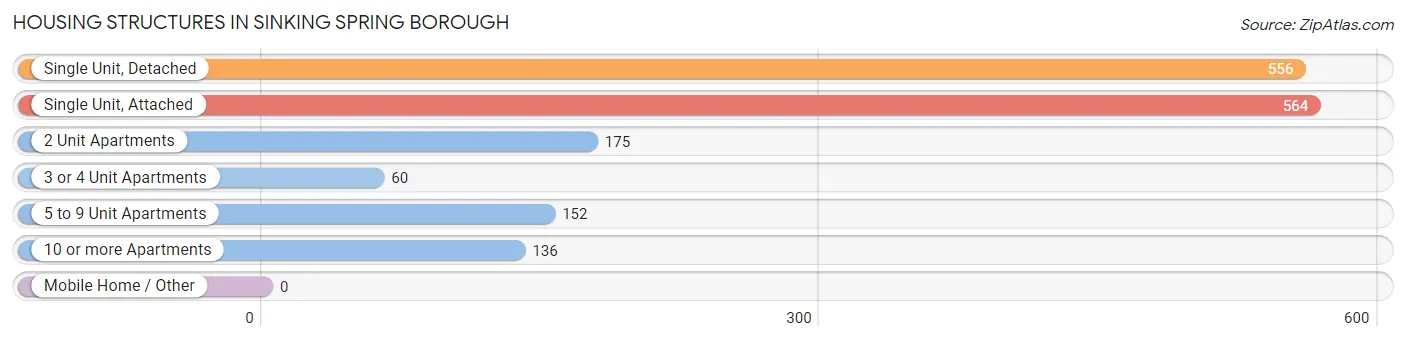
| Structure Type | # Housing Units | % Housing Units |
| Single Unit, Detached | 556 | 33.8% |
| Single Unit, Attached | 564 | 34.3% |
| 2 Unit Apartments | 175 | 10.6% |
| 3 or 4 Unit Apartments | 60 | 3.6% |
| 5 to 9 Unit Apartments | 152 | 9.2% |
| 10 or more Apartments | 136 | 8.3% |
| Mobile Home / Other | 0 | 0.0% |
| Total | 1,643 | 100.0% |
Housing Structures by Occupancy in Sinking Spring borough
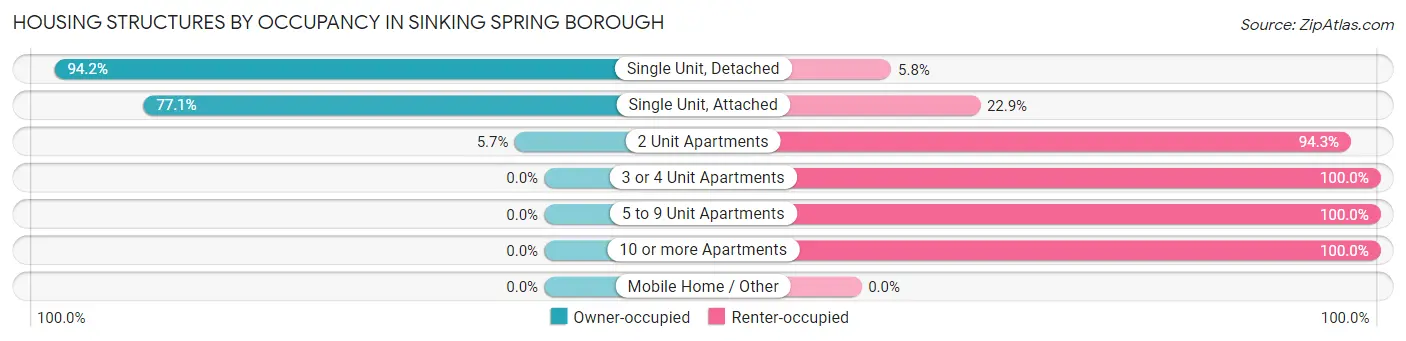
| Structure Type | Owner-occupied | Renter-occupied |
| Single Unit, Detached | 524 (94.2%) | 32 (5.8%) |
| Single Unit, Attached | 435 (77.1%) | 129 (22.9%) |
| 2 Unit Apartments | 10 (5.7%) | 165 (94.3%) |
| 3 or 4 Unit Apartments | 0 (0.0%) | 60 (100.0%) |
| 5 to 9 Unit Apartments | 0 (0.0%) | 152 (100.0%) |
| 10 or more Apartments | 0 (0.0%) | 136 (100.0%) |
| Mobile Home / Other | 0 (0.0%) | 0 (0.0%) |
| Total | 969 (59.0%) | 674 (41.0%) |
Housing Structures by Number of Rooms in Sinking Spring borough
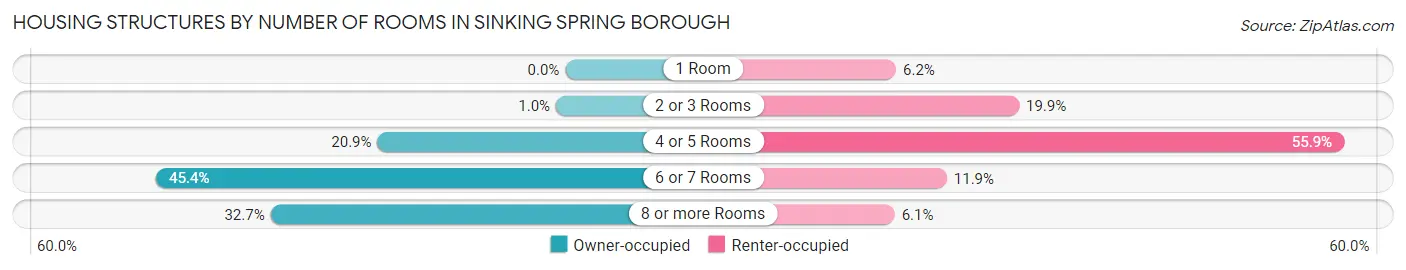
| Number of Rooms | Owner-occupied | Renter-occupied |
| 1 Room | 0 (0.0%) | 42 (6.2%) |
| 2 or 3 Rooms | 10 (1.0%) | 134 (19.9%) |
| 4 or 5 Rooms | 202 (20.8%) | 377 (55.9%) |
| 6 or 7 Rooms | 440 (45.4%) | 80 (11.9%) |
| 8 or more Rooms | 317 (32.7%) | 41 (6.1%) |
| Total | 969 (100.0%) | 674 (100.0%) |
Housing Structure by Heating Type in Sinking Spring borough
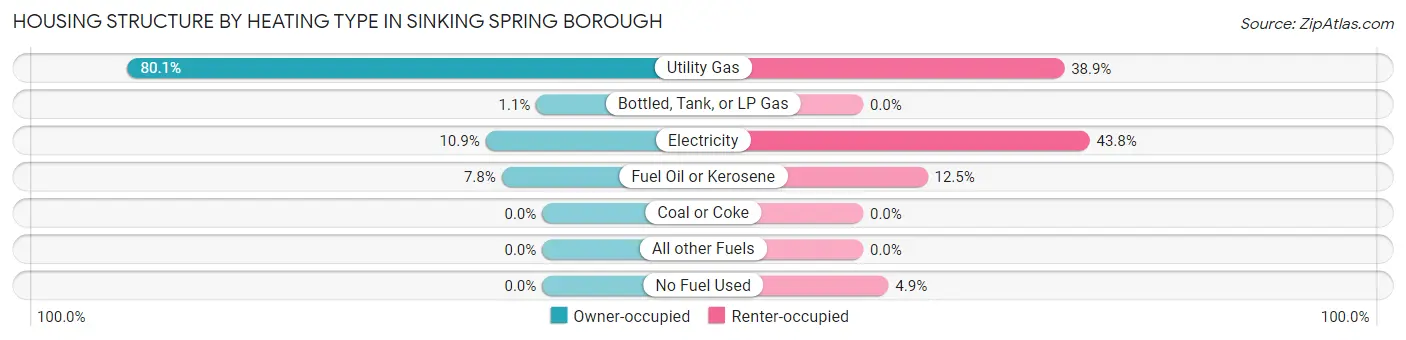
| Heating Type | Owner-occupied | Renter-occupied |
| Utility Gas | 776 (80.1%) | 262 (38.9%) |
| Bottled, Tank, or LP Gas | 11 (1.1%) | 0 (0.0%) |
| Electricity | 106 (10.9%) | 295 (43.8%) |
| Fuel Oil or Kerosene | 76 (7.8%) | 84 (12.5%) |
| Coal or Coke | 0 (0.0%) | 0 (0.0%) |
| All other Fuels | 0 (0.0%) | 0 (0.0%) |
| No Fuel Used | 0 (0.0%) | 33 (4.9%) |
| Total | 969 (100.0%) | 674 (100.0%) |
Household Vehicle Usage in Sinking Spring borough
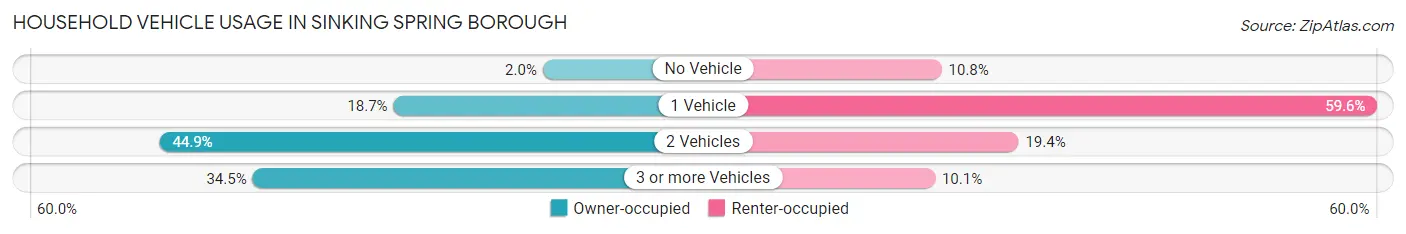
| Vehicles per Household | Owner-occupied | Renter-occupied |
| No Vehicle | 19 (2.0%) | 73 (10.8%) |
| 1 Vehicle | 181 (18.7%) | 402 (59.6%) |
| 2 Vehicles | 435 (44.9%) | 131 (19.4%) |
| 3 or more Vehicles | 334 (34.5%) | 68 (10.1%) |
| Total | 969 (100.0%) | 674 (100.0%) |
Real Estate & Mortgages in Sinking Spring borough
Real Estate and Mortgage Overview in Sinking Spring borough
| Characteristic | Without Mortgage | With Mortgage |
| Housing Units | 240 | 729 |
| Median Property Value | $235,900 | $267,600 |
| Median Household Income | $70,882 | $260 |
| Monthly Housing Costs | $622 | $109 |
| Real Estate Taxes | $3,700 | $0 |
Property Value by Mortgage Status in Sinking Spring borough
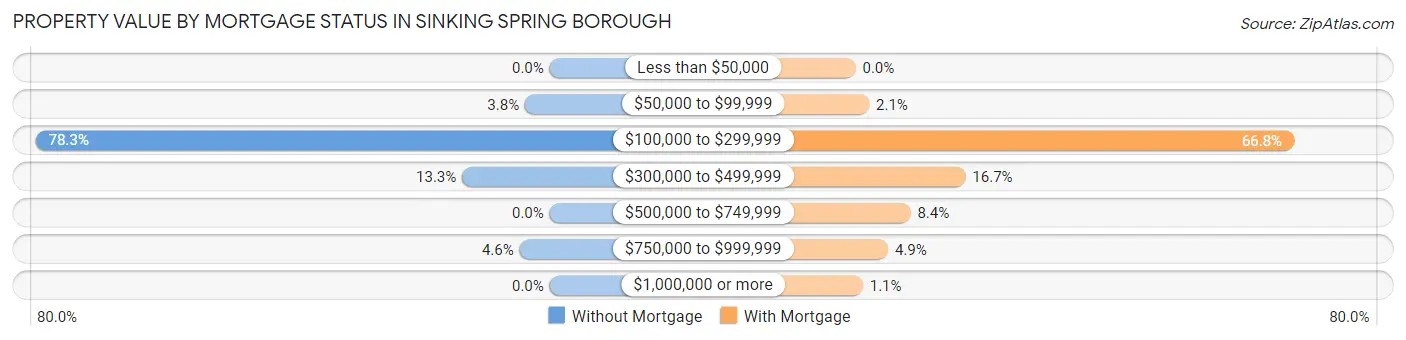
| Property Value | Without Mortgage | With Mortgage |
| Less than $50,000 | 0 (0.0%) | 0 (0.0%) |
| $50,000 to $99,999 | 9 (3.7%) | 15 (2.1%) |
| $100,000 to $299,999 | 188 (78.3%) | 487 (66.8%) |
| $300,000 to $499,999 | 32 (13.3%) | 122 (16.7%) |
| $500,000 to $749,999 | 0 (0.0%) | 61 (8.4%) |
| $750,000 to $999,999 | 11 (4.6%) | 36 (4.9%) |
| $1,000,000 or more | 0 (0.0%) | 8 (1.1%) |
| Total | 240 (100.0%) | 729 (100.0%) |
Household Income by Mortgage Status in Sinking Spring borough
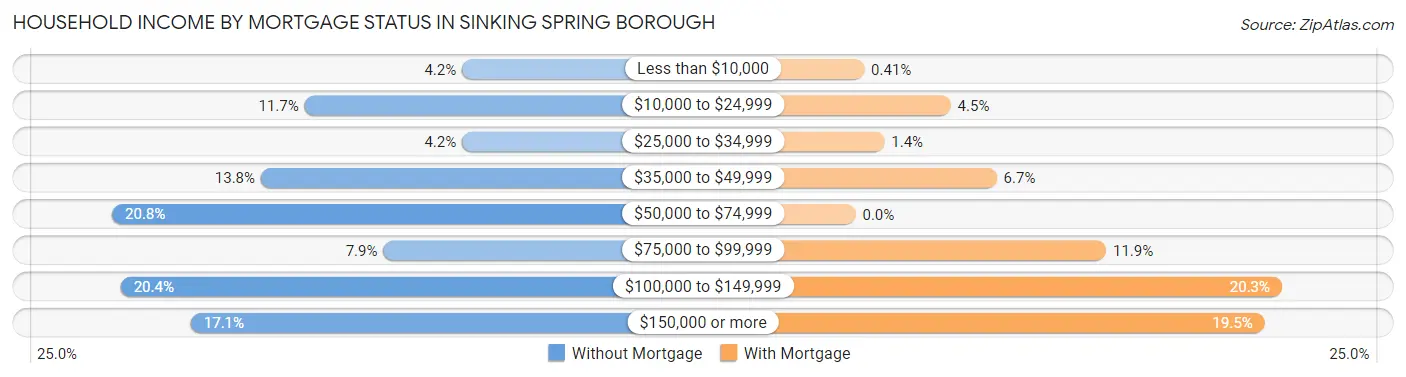
| Household Income | Without Mortgage | With Mortgage |
| Less than $10,000 | 10 (4.2%) | 3 (0.4%) |
| $10,000 to $24,999 | 28 (11.7%) | 33 (4.5%) |
| $25,000 to $34,999 | 10 (4.2%) | 10 (1.4%) |
| $35,000 to $49,999 | 33 (13.8%) | 49 (6.7%) |
| $50,000 to $74,999 | 50 (20.8%) | 0 (0.0%) |
| $75,000 to $99,999 | 19 (7.9%) | 87 (11.9%) |
| $100,000 to $149,999 | 49 (20.4%) | 148 (20.3%) |
| $150,000 or more | 41 (17.1%) | 142 (19.5%) |
| Total | 240 (100.0%) | 729 (100.0%) |
Property Value to Household Income Ratio in Sinking Spring borough
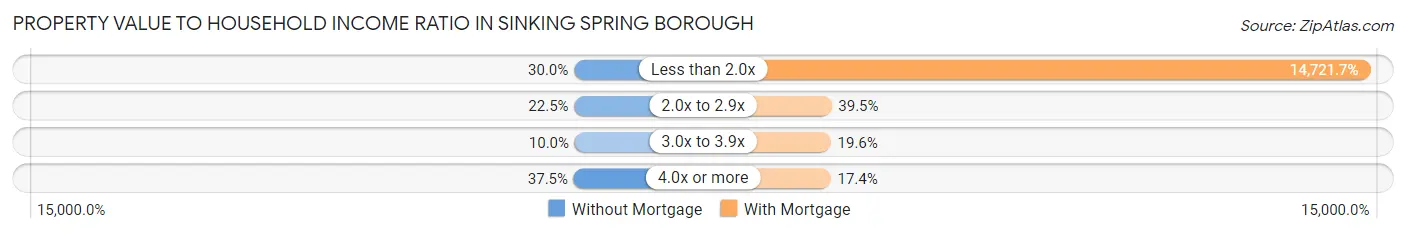
| Value-to-Income Ratio | Without Mortgage | With Mortgage |
| Less than 2.0x | 72 (30.0%) | 107,321 (14,721.7%) |
| 2.0x to 2.9x | 54 (22.5%) | 288 (39.5%) |
| 3.0x to 3.9x | 24 (10.0%) | 143 (19.6%) |
| 4.0x or more | 90 (37.5%) | 127 (17.4%) |
| Total | 240 (100.0%) | 729 (100.0%) |
Real Estate Taxes by Mortgage Status in Sinking Spring borough
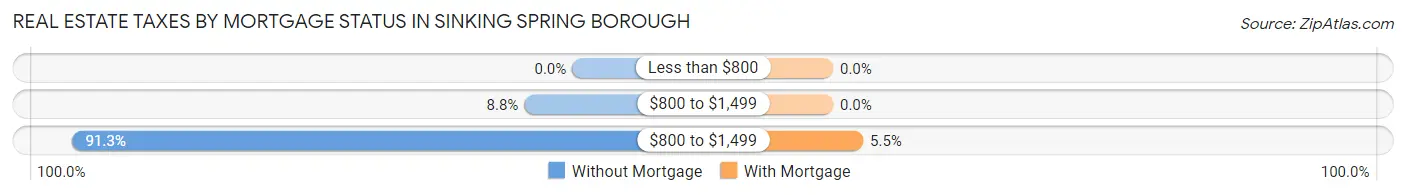
| Property Taxes | Without Mortgage | With Mortgage |
| Less than $800 | 0 (0.0%) | 0 (0.0%) |
| $800 to $1,499 | 21 (8.7%) | 0 (0.0%) |
| $800 to $1,499 | 219 (91.2%) | 40 (5.5%) |
| Total | 240 (100.0%) | 729 (100.0%) |
Health & Disability in Sinking Spring borough
Health Insurance Coverage by Age in Sinking Spring borough
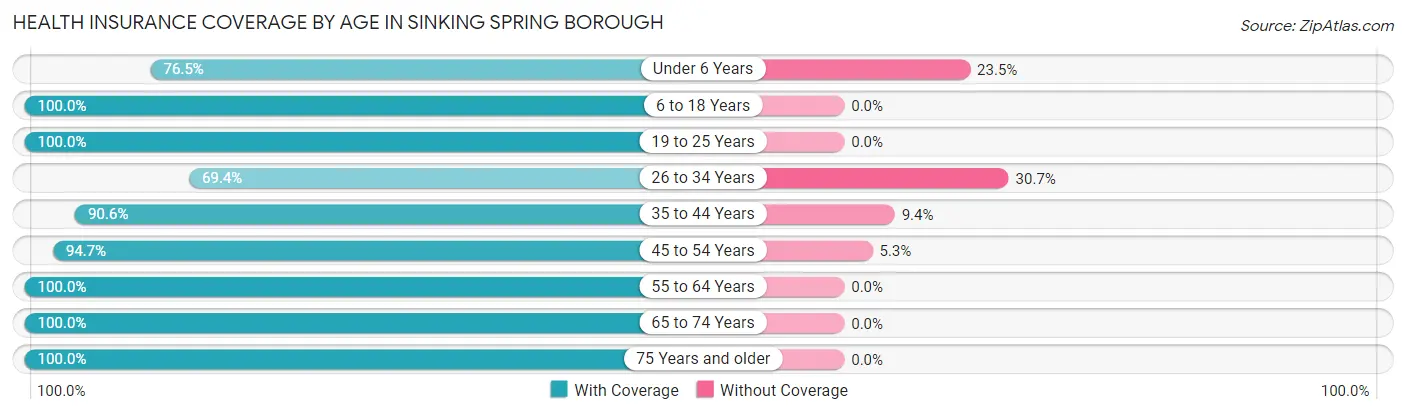
| Age Bracket | With Coverage | Without Coverage |
| Under 6 Years | 212 (76.5%) | 65 (23.5%) |
| 6 to 18 Years | 710 (100.0%) | 0 (0.0%) |
| 19 to 25 Years | 320 (100.0%) | 0 (0.0%) |
| 26 to 34 Years | 414 (69.4%) | 183 (30.6%) |
| 35 to 44 Years | 472 (90.6%) | 49 (9.4%) |
| 45 to 54 Years | 701 (94.7%) | 39 (5.3%) |
| 55 to 64 Years | 405 (100.0%) | 0 (0.0%) |
| 65 to 74 Years | 411 (100.0%) | 0 (0.0%) |
| 75 Years and older | 280 (100.0%) | 0 (0.0%) |
| Total | 3,925 (92.1%) | 336 (7.9%) |
Health Insurance Coverage by Citizenship Status in Sinking Spring borough
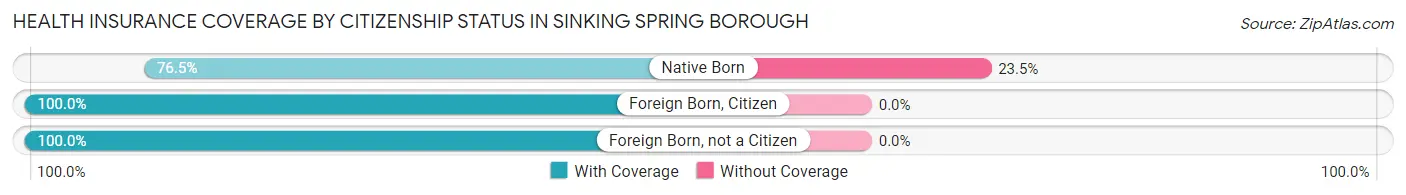
| Citizenship Status | With Coverage | Without Coverage |
| Native Born | 212 (76.5%) | 65 (23.5%) |
| Foreign Born, Citizen | 710 (100.0%) | 0 (0.0%) |
| Foreign Born, not a Citizen | 320 (100.0%) | 0 (0.0%) |
Health Insurance Coverage by Household Income in Sinking Spring borough
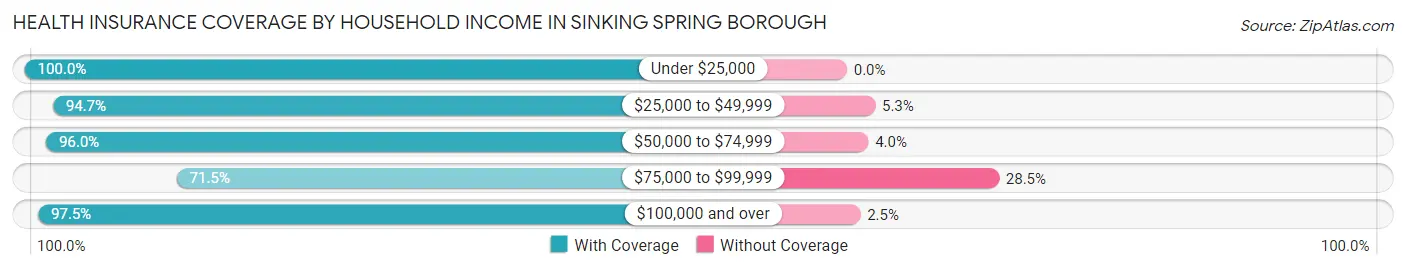
| Household Income | With Coverage | Without Coverage |
| Under $25,000 | 426 (100.0%) | 0 (0.0%) |
| $25,000 to $49,999 | 501 (94.7%) | 28 (5.3%) |
| $50,000 to $74,999 | 598 (96.0%) | 25 (4.0%) |
| $75,000 to $99,999 | 595 (71.5%) | 237 (28.5%) |
| $100,000 and over | 1,789 (97.5%) | 46 (2.5%) |
Public vs Private Health Insurance Coverage by Age in Sinking Spring borough
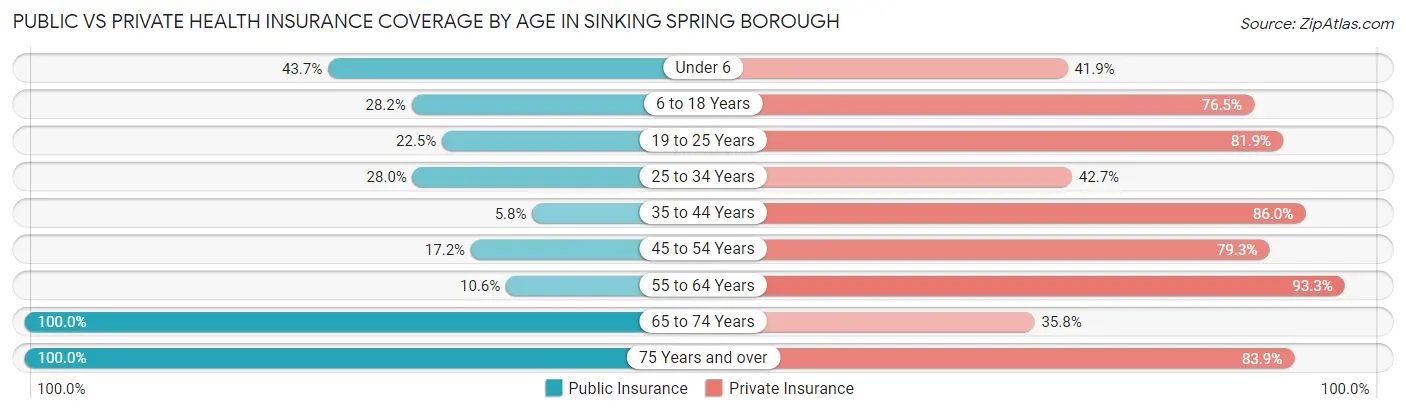
| Age Bracket | Public Insurance | Private Insurance |
| Under 6 | 121 (43.7%) | 116 (41.9%) |
| 6 to 18 Years | 200 (28.2%) | 543 (76.5%) |
| 19 to 25 Years | 72 (22.5%) | 262 (81.9%) |
| 25 to 34 Years | 167 (28.0%) | 255 (42.7%) |
| 35 to 44 Years | 30 (5.8%) | 448 (86.0%) |
| 45 to 54 Years | 127 (17.2%) | 587 (79.3%) |
| 55 to 64 Years | 43 (10.6%) | 378 (93.3%) |
| 65 to 74 Years | 411 (100.0%) | 147 (35.8%) |
| 75 Years and over | 280 (100.0%) | 235 (83.9%) |
| Total | 1,451 (34.1%) | 2,971 (69.7%) |
Disability Status by Sex by Age in Sinking Spring borough
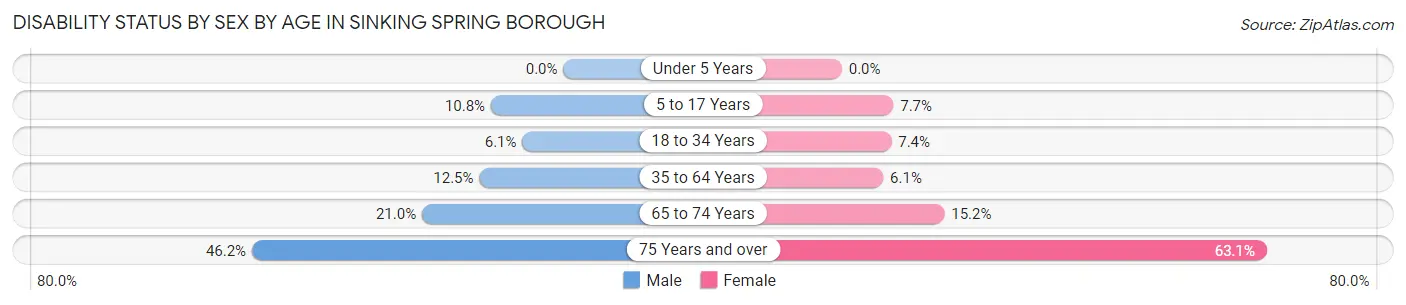
| Age Bracket | Male | Female |
| Under 5 Years | 0 (0.0%) | 0 (0.0%) |
| 5 to 17 Years | 36 (10.7%) | 26 (7.6%) |
| 18 to 34 Years | 27 (6.1%) | 40 (7.3%) |
| 35 to 64 Years | 94 (12.5%) | 56 (6.1%) |
| 65 to 74 Years | 38 (21.0%) | 35 (15.2%) |
| 75 Years and over | 43 (46.2%) | 118 (63.1%) |
Disability Class by Sex by Age in Sinking Spring borough
Disability Class: Hearing Difficulty
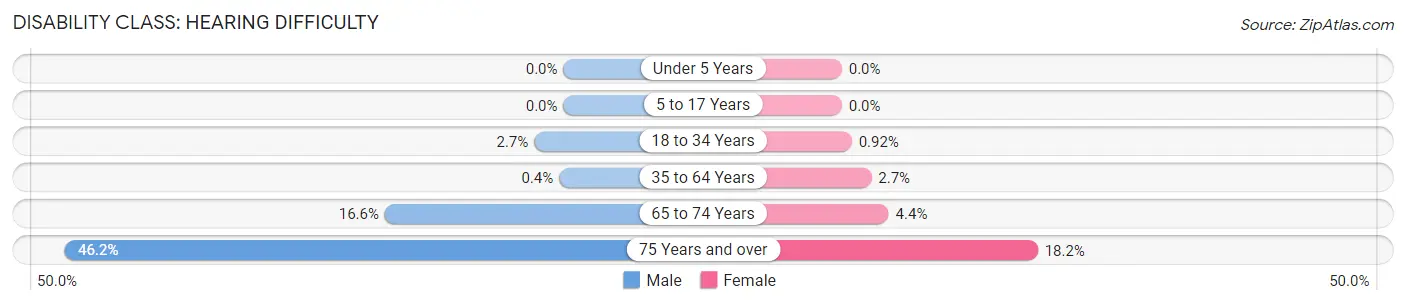
| Age Bracket | Male | Female |
| Under 5 Years | 0 (0.0%) | 0 (0.0%) |
| 5 to 17 Years | 0 (0.0%) | 0 (0.0%) |
| 18 to 34 Years | 12 (2.7%) | 5 (0.9%) |
| 35 to 64 Years | 3 (0.4%) | 25 (2.7%) |
| 65 to 74 Years | 30 (16.6%) | 10 (4.3%) |
| 75 Years and over | 43 (46.2%) | 34 (18.2%) |
Disability Class: Vision Difficulty
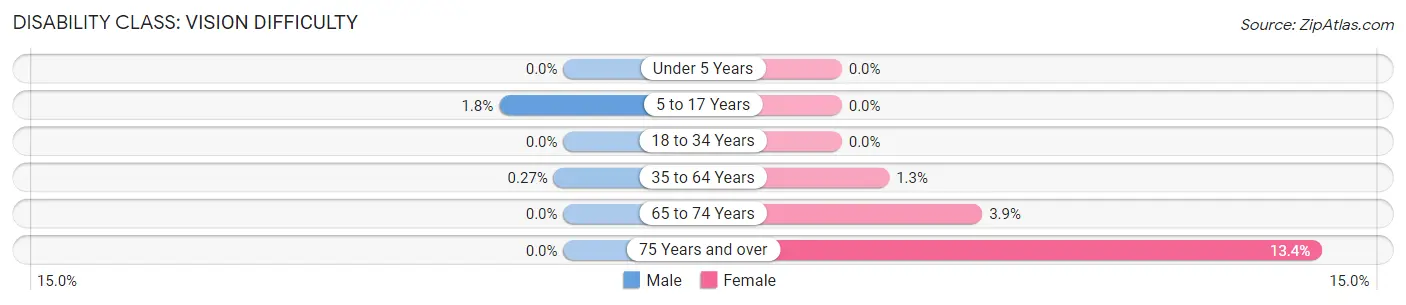
| Age Bracket | Male | Female |
| Under 5 Years | 0 (0.0%) | 0 (0.0%) |
| 5 to 17 Years | 6 (1.8%) | 0 (0.0%) |
| 18 to 34 Years | 0 (0.0%) | 0 (0.0%) |
| 35 to 64 Years | 2 (0.3%) | 12 (1.3%) |
| 65 to 74 Years | 0 (0.0%) | 9 (3.9%) |
| 75 Years and over | 0 (0.0%) | 25 (13.4%) |
Disability Class: Cognitive Difficulty
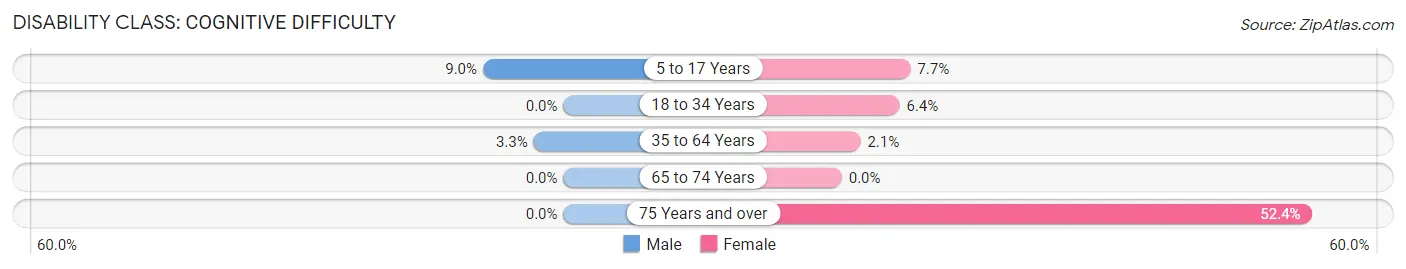
| Age Bracket | Male | Female |
| 5 to 17 Years | 30 (9.0%) | 26 (7.6%) |
| 18 to 34 Years | 0 (0.0%) | 35 (6.4%) |
| 35 to 64 Years | 25 (3.3%) | 19 (2.1%) |
| 65 to 74 Years | 0 (0.0%) | 0 (0.0%) |
| 75 Years and over | 0 (0.0%) | 98 (52.4%) |
Disability Class: Ambulatory Difficulty
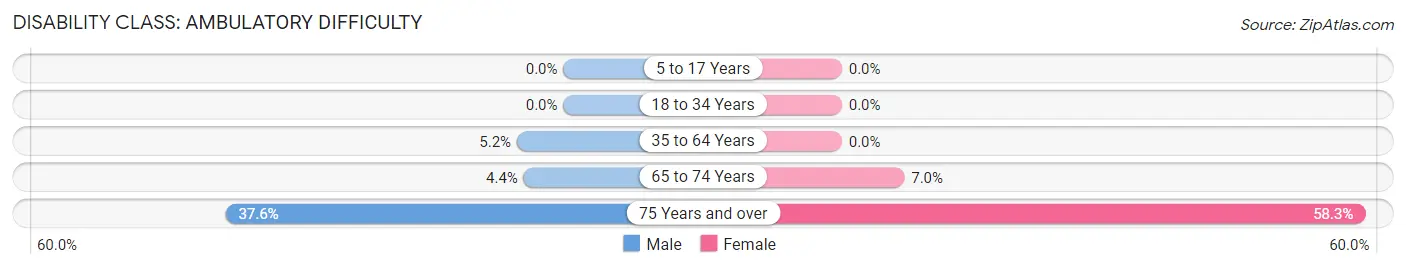
| Age Bracket | Male | Female |
| 5 to 17 Years | 0 (0.0%) | 0 (0.0%) |
| 18 to 34 Years | 0 (0.0%) | 0 (0.0%) |
| 35 to 64 Years | 39 (5.2%) | 0 (0.0%) |
| 65 to 74 Years | 8 (4.4%) | 16 (7.0%) |
| 75 Years and over | 35 (37.6%) | 109 (58.3%) |
Disability Class: Self-Care Difficulty
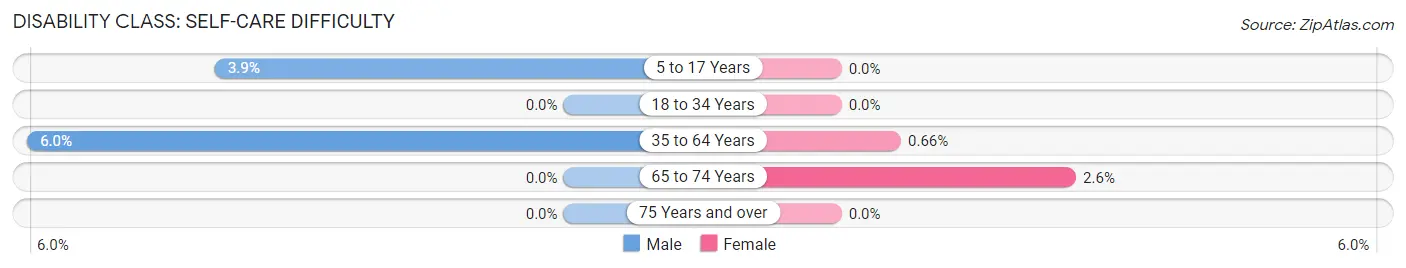
| Age Bracket | Male | Female |
| 5 to 17 Years | 13 (3.9%) | 0 (0.0%) |
| 18 to 34 Years | 0 (0.0%) | 0 (0.0%) |
| 35 to 64 Years | 45 (6.0%) | 6 (0.7%) |
| 65 to 74 Years | 0 (0.0%) | 6 (2.6%) |
| 75 Years and over | 0 (0.0%) | 0 (0.0%) |
Technology Access in Sinking Spring borough
Computing Device Access in Sinking Spring borough
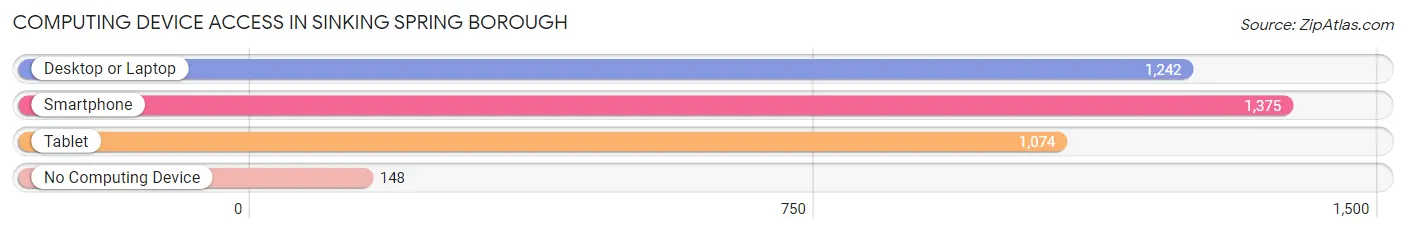
| Device Type | # Households | % Households |
| Desktop or Laptop | 1,242 | 75.6% |
| Smartphone | 1,375 | 83.7% |
| Tablet | 1,074 | 65.4% |
| No Computing Device | 148 | 9.0% |
| Total | 1,643 | 100.0% |
Internet Access in Sinking Spring borough
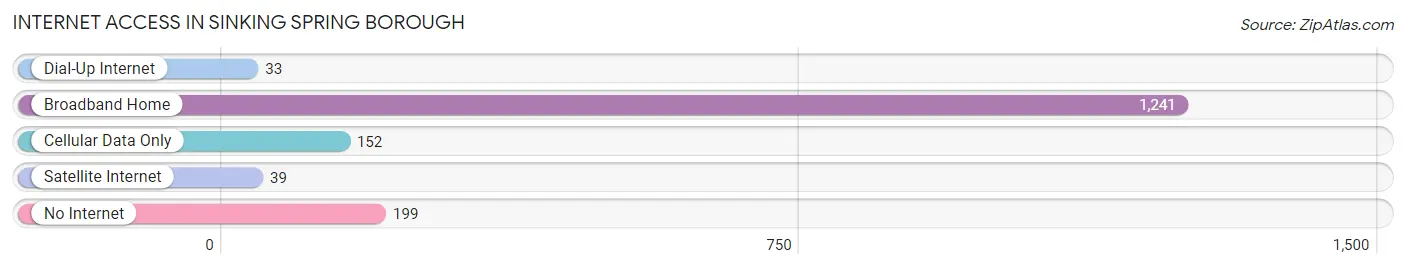
| Internet Type | # Households | % Households |
| Dial-Up Internet | 33 | 2.0% |
| Broadband Home | 1,241 | 75.5% |
| Cellular Data Only | 152 | 9.2% |
| Satellite Internet | 39 | 2.4% |
| No Internet | 199 | 12.1% |
| Total | 1,643 | 100.0% |
Sinking Spring borough Summary
Sinking Spring Borough is a small borough located in Berks County, Pennsylvania. It is situated in the southeastern part of the county, approximately 8 miles northwest of Reading. The borough is bordered by Spring Township to the north, Wyomissing Borough to the east, and Cumru Township to the south and west. As of the 2010 census, the population of Sinking Spring was 4,008.
History
Sinking Spring was first settled in 1732 by a group of German immigrants led by Johannes Schreiber. The area was originally known as Schreiberstown, and the settlement was located near the intersection of what is now Penn Avenue and Lancaster Avenue. The settlement was later renamed Sinking Spring, after a nearby spring that was said to “sink” into the ground.
In 1845, Sinking Spring was incorporated as a borough. The borough was originally part of Spring Township, but was separated in 1846. The borough was named after the nearby Sinking Spring, which was a popular destination for travelers and settlers.
Geography
Sinking Spring is located at 40°20'45"N 75°59'45"W (40.3458, -75.9958). According to the United States Census Bureau, the borough has a total area of 1.2 square miles, all of which is land.
The borough is located in the southeastern part of Berks County, approximately 8 miles northwest of Reading. It is bordered by Spring Township to the north, Wyomissing Borough to the east, and Cumru Township to the south and west.
Economy
The economy of Sinking Spring is largely based on retail and services. The borough is home to several small businesses, including restaurants, convenience stores, and auto repair shops. The borough is also home to a number of large employers, including the Reading Hospital and Medical Center, the Reading School District, and the Reading Eagle newspaper.
Demographics
As of the 2010 census, there were 4,008 people, 1,619 households, and 1,072 families residing in the borough. The population density was 3,323.3 people per square mile. There were 1,717 housing units at an average density of 1,427.5 per square mile. The racial makeup of the borough was 92.2% White, 3.2% African American, 0.2% Native American, 1.3% Asian, 0.1% Pacific Islander, 1.2% from other races, and 1.9% from two or more races. Hispanic or Latino of any race were 4.2% of the population.
There were 1,619 households, out of which 28.2% had children under the age of 18 living with them, 48.2% were married couples living together, 11.7% had a female householder with no husband present, and 35.2% were non-families. 29.7% of all households were made up of individuals, and 11.7% had someone living alone who was 65 years of age or older. The average household size was 2.45 and the average family size was 3.04.
In the borough, the population was spread out, with 22.7% under the age of 18, 7.2% from 18 to 24, 28.7% from 25 to 44, 24.3% from 45 to 64, and 17.1% who were 65 years of age or older. The median age was 39 years. For every 100 females, there were 92.2 males. For every 100 females age 18 and over, there were 88.3 males.
The median income for a household in the borough was $45,938, and the median income for a family was $54,938. Males had a median income of $37,917 versus $27,917 for females. The per capita income for the borough was $21,938. About 4.2% of families and 5.7% of the population were below the poverty line, including 6.2% of those under age 18 and 5.2% of those age 65 or over.
Common Questions
What is Per Capita Income in Sinking Spring borough?
Per Capita income in Sinking Spring borough is $41,286.
What is the Median Family Income in Sinking Spring borough?
Median Family Income in Sinking Spring borough is $94,236.
What is the Median Household income in Sinking Spring borough?
Median Household Income in Sinking Spring borough is $80,565.
What is Income or Wage Gap in Sinking Spring borough?
Income or Wage Gap in Sinking Spring borough is 50.8%.
Women in Sinking Spring borough earn 49.2 cents for every dollar earned by a man.
What is Inequality or Gini Index in Sinking Spring borough?
Inequality or Gini Index in Sinking Spring borough is 0.45.
What is the Total Population of Sinking Spring borough?
Total Population of Sinking Spring borough is 4,261.
What is the Total Male Population of Sinking Spring borough?
Total Male Population of Sinking Spring borough is 1,966.
What is the Total Female Population of Sinking Spring borough?
Total Female Population of Sinking Spring borough is 2,295.
What is the Ratio of Males per 100 Females in Sinking Spring borough?
There are 85.66 Males per 100 Females in Sinking Spring borough.
What is the Ratio of Females per 100 Males in Sinking Spring borough?
There are 116.73 Females per 100 Males in Sinking Spring borough.
What is the Median Population Age in Sinking Spring borough?
Median Population Age in Sinking Spring borough is 39.5 Years.
What is the Average Family Size in Sinking Spring borough
Average Family Size in Sinking Spring borough is 3.3 People.
What is the Average Household Size in Sinking Spring borough
Average Household Size in Sinking Spring borough is 2.6 People.
How Large is the Labor Force in Sinking Spring borough?
There are 2,552 People in the Labor Forcein in Sinking Spring borough.
What is the Percentage of People in the Labor Force in Sinking Spring borough?
74.4% of People are in the Labor Force in Sinking Spring borough.
What is the Unemployment Rate in Sinking Spring borough?
Unemployment Rate in Sinking Spring borough is 2.6%.