Sheffield, PA Map & Demographics
Sheffield Map
Sheffield Overview
$25,063
PER CAPITA INCOME
$63,152
AVG FAMILY INCOME
$54,458
AVG HOUSEHOLD INCOME
0.30
INEQUALITY / GINI INDEX
757
TOTAL POPULATION
397
MALE POPULATION
360
FEMALE POPULATION
110.28
MALES / 100 FEMALES
90.68
FEMALES / 100 MALES
43.4
MEDIAN AGE
3.0
AVG FAMILY SIZE
2.4
AVG HOUSEHOLD SIZE
338
LABOR FORCE [ PEOPLE ]
54.4%
PERCENT IN LABOR FORCE
Sheffield Zip Codes
Sheffield Area Codes
Income in Sheffield
Income Overview in Sheffield
Per Capita Income in Sheffield is $25,063, while median incomes of families and households are $63,152 and $54,458 respectively.
| Characteristic | Number | Measure |
| Per Capita Income | 757 | $25,063 |
| Median Family Income | 204 | $63,152 |
| Mean Family Income | 204 | $64,456 |
| Median Household Income | 313 | $54,458 |
| Mean Household Income | 313 | $60,068 |
| Income Deficit | 204 | $0 |
| Wage / Income Gap (%) | 757 | 0.00% |
| Wage / Income Gap ($) | 757 | 100.00¢ per $1 |
| Gini / Inequality Index | 757 | 0.30 |
Earnings by Sex in Sheffield
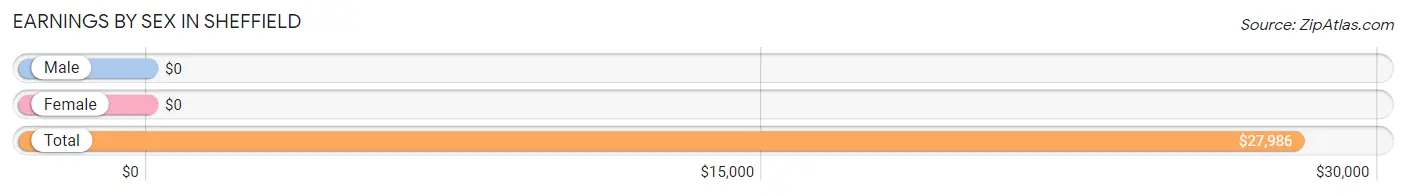
| Sex | Number | Average Earnings |
| Male | 194 (52.6%) | $0 |
| Female | 175 (47.4%) | $0 |
| Total | 369 (100.0%) | $27,986 |
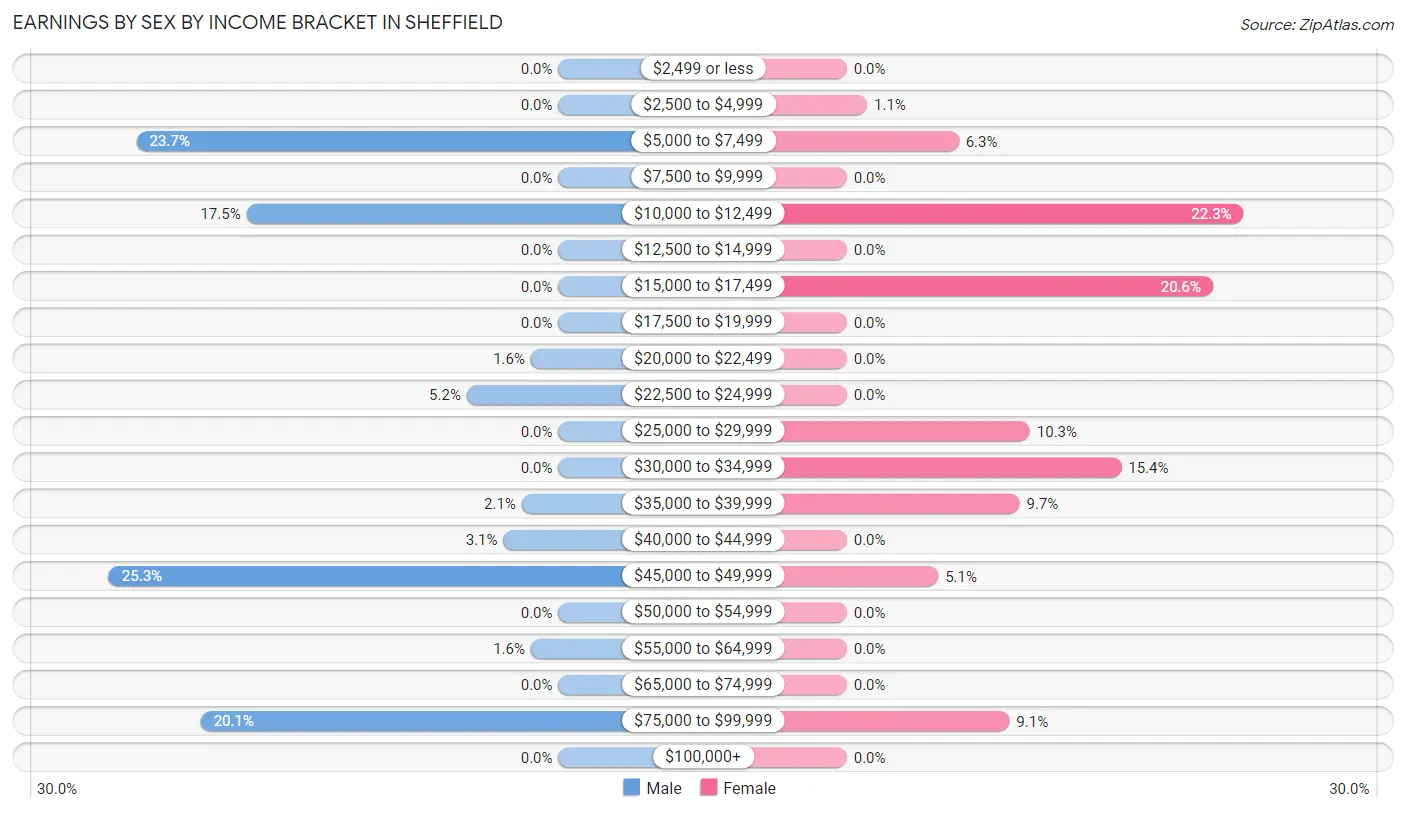
Earnings by Sex by Income Bracket in Sheffield
The most common earnings brackets in Sheffield are $45,000 to $49,999 for men (49 | 25.3%) and $10,000 to $12,499 for women (39 | 22.3%).
| Income | Male | Female |
| $2,499 or less | 0 (0.0%) | 0 (0.0%) |
| $2,500 to $4,999 | 0 (0.0%) | 2 (1.1%) |
| $5,000 to $7,499 | 46 (23.7%) | 11 (6.3%) |
| $7,500 to $9,999 | 0 (0.0%) | 0 (0.0%) |
| $10,000 to $12,499 | 34 (17.5%) | 39 (22.3%) |
| $12,500 to $14,999 | 0 (0.0%) | 0 (0.0%) |
| $15,000 to $17,499 | 0 (0.0%) | 36 (20.6%) |
| $17,500 to $19,999 | 0 (0.0%) | 0 (0.0%) |
| $20,000 to $22,499 | 3 (1.5%) | 0 (0.0%) |
| $22,500 to $24,999 | 10 (5.1%) | 0 (0.0%) |
| $25,000 to $29,999 | 0 (0.0%) | 18 (10.3%) |
| $30,000 to $34,999 | 0 (0.0%) | 27 (15.4%) |
| $35,000 to $39,999 | 4 (2.1%) | 17 (9.7%) |
| $40,000 to $44,999 | 6 (3.1%) | 0 (0.0%) |
| $45,000 to $49,999 | 49 (25.3%) | 9 (5.1%) |
| $50,000 to $54,999 | 0 (0.0%) | 0 (0.0%) |
| $55,000 to $64,999 | 3 (1.5%) | 0 (0.0%) |
| $65,000 to $74,999 | 0 (0.0%) | 0 (0.0%) |
| $75,000 to $99,999 | 39 (20.1%) | 16 (9.1%) |
| $100,000+ | 0 (0.0%) | 0 (0.0%) |
| Total | 194 (100.0%) | 175 (100.0%) |
Earnings by Sex by Educational Attainment in Sheffield
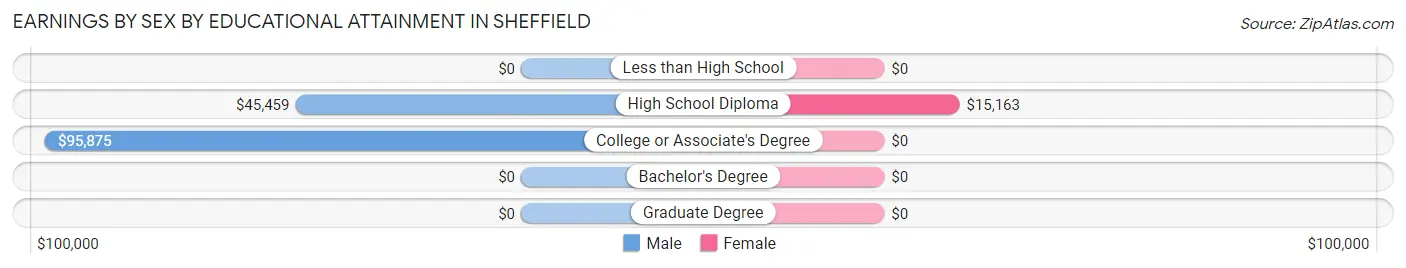
| Educational Attainment | Male Income | Female Income |
| Less than High School | - | - |
| High School Diploma | $45,459 | $15,163 |
| College or Associate's Degree | $95,875 | $0 |
| Bachelor's Degree | - | - |
| Graduate Degree | - | - |
| Total | $45,867 | $0 |
Family Income in Sheffield
Family Income Brackets in Sheffield
According to the Sheffield family income data, there are 63 families falling into the $75,000 to $99,999 income range, which is the most common income bracket and makes up 30.9% of all families.
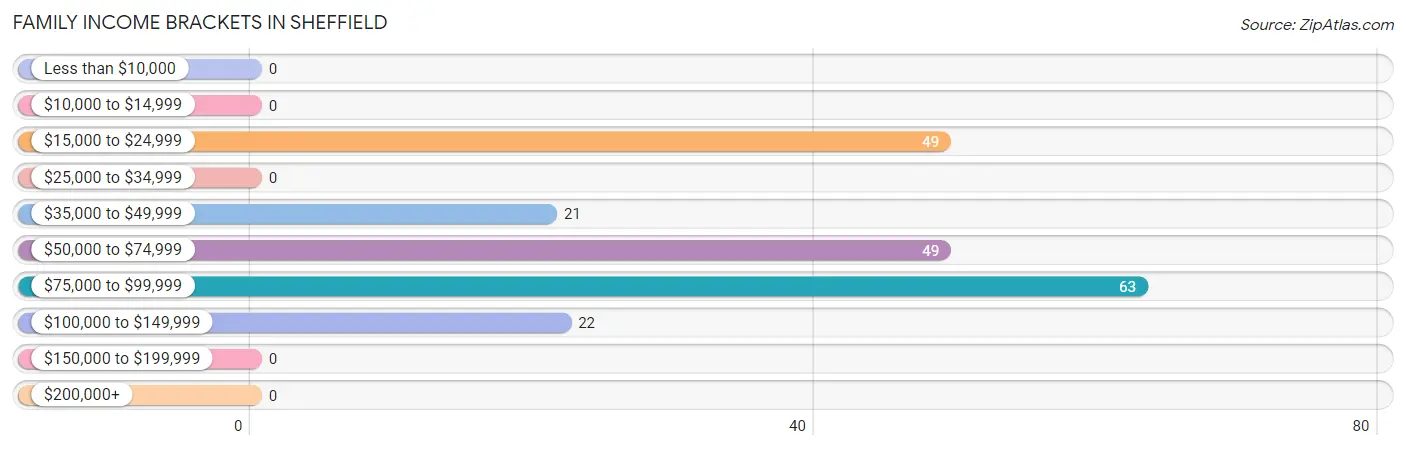
| Income Bracket | # Families | % Families |
| Less than $10,000 | 0 | 0.0% |
| $10,000 to $14,999 | 0 | 0.0% |
| $15,000 to $24,999 | 49 | 24.0% |
| $25,000 to $34,999 | 0 | 0.0% |
| $35,000 to $49,999 | 21 | 10.3% |
| $50,000 to $74,999 | 49 | 24.0% |
| $75,000 to $99,999 | 63 | 30.9% |
| $100,000 to $149,999 | 22 | 10.8% |
| $150,000 to $199,999 | 0 | 0.0% |
| $200,000+ | 0 | 0.0% |
Family Income by Famaliy Size in Sheffield
3-person families (77 | 37.8%) account for the highest median family income in Sheffield with $95,284 per family, while 3-person families (77 | 37.8%) have the highest median income of $31,761 per family member.
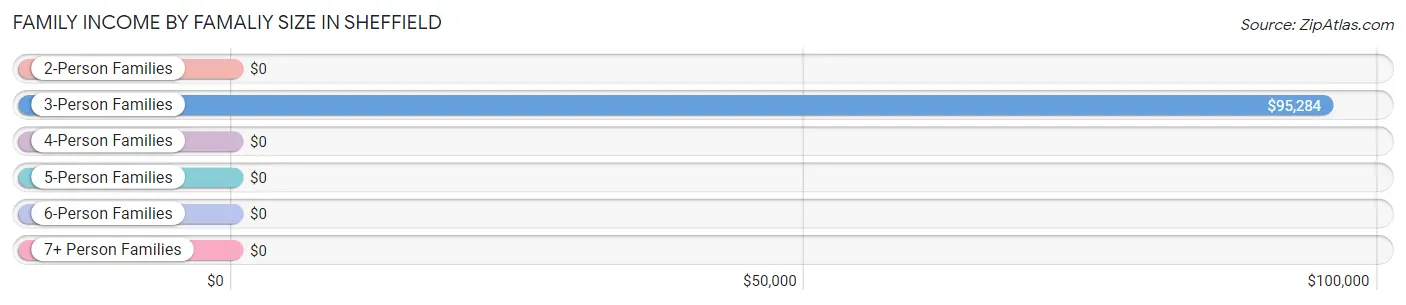
| Income Bracket | # Families | Median Income |
| 2-Person Families | 98 (48.0%) | $0 |
| 3-Person Families | 77 (37.8%) | $95,284 |
| 4-Person Families | 23 (11.3%) | $0 |
| 5-Person Families | 6 (2.9%) | $0 |
| 6-Person Families | 0 (0.0%) | $0 |
| 7+ Person Families | 0 (0.0%) | $0 |
| Total | 204 (100.0%) | $63,152 |
Family Income by Number of Earners in Sheffield
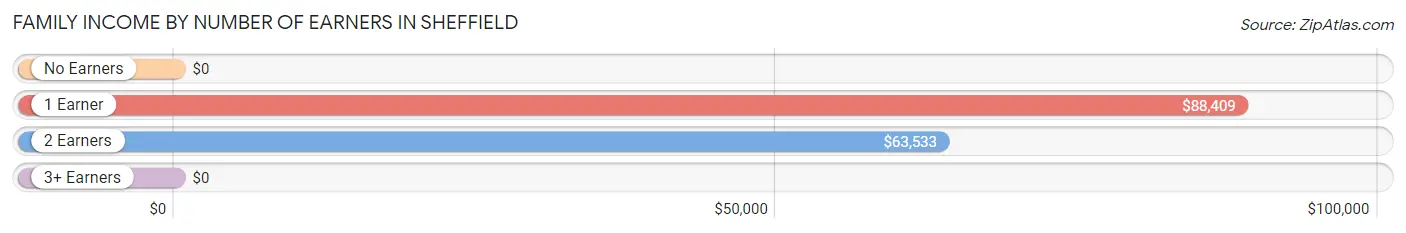
| Number of Earners | # Families | Median Income |
| No Earners | 21 (10.3%) | $0 |
| 1 Earner | 96 (47.1%) | $88,409 |
| 2 Earners | 87 (42.6%) | $63,533 |
| 3+ Earners | 0 (0.0%) | $0 |
| Total | 204 (100.0%) | $63,152 |
Household Income in Sheffield
Household Income Brackets in Sheffield
With 87 households falling in the category, the $75,000 to $99,999 income range is the most frequent in Sheffield, accounting for 27.8% of all households.
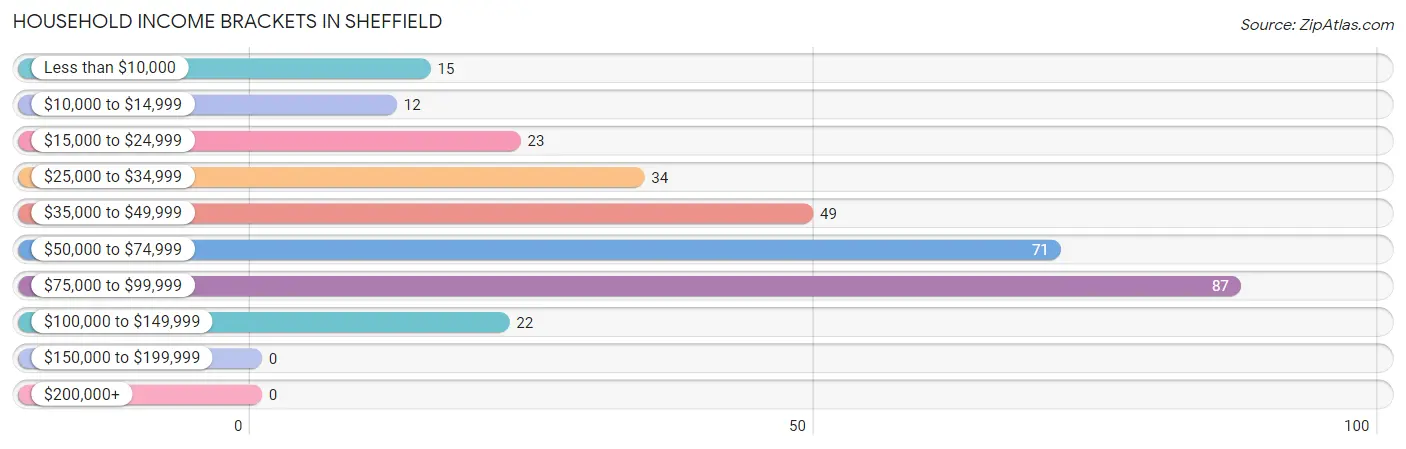
| Income Bracket | # Households | % Households |
| Less than $10,000 | 15 | 4.8% |
| $10,000 to $14,999 | 12 | 3.8% |
| $15,000 to $24,999 | 23 | 7.3% |
| $25,000 to $34,999 | 34 | 10.9% |
| $35,000 to $49,999 | 49 | 15.7% |
| $50,000 to $74,999 | 71 | 22.7% |
| $75,000 to $99,999 | 87 | 27.8% |
| $100,000 to $149,999 | 22 | 7.0% |
| $150,000 to $199,999 | 0 | 0.0% |
| $200,000+ | 0 | 0.0% |
Household Income by Householder Age in Sheffield
The median household income in Sheffield is $54,458, with the highest median household income of $81,705 found in the 45 to 64 years age bracket for the primary householder. A total of 121 households (38.7%) fall into this category.
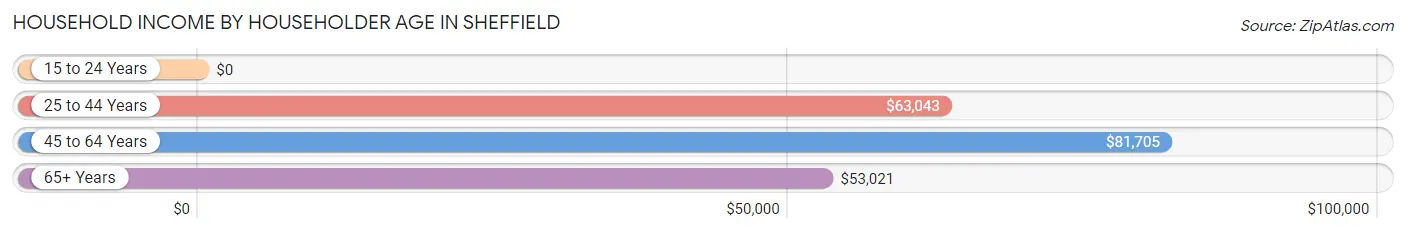
| Income Bracket | # Households | Median Income |
| 15 to 24 Years | 0 (0.0%) | $0 |
| 25 to 44 Years | 90 (28.7%) | $63,043 |
| 45 to 64 Years | 121 (38.7%) | $81,705 |
| 65+ Years | 102 (32.6%) | $53,021 |
| Total | 313 (100.0%) | $54,458 |
Poverty in Sheffield
Income Below Poverty by Sex and Age in Sheffield
With 27.5% poverty level for males and 11.9% for females among the residents of Sheffield, 18 to 24 year old males and 35 to 44 year old females are the most vulnerable to poverty, with 46 males (100.0%) and 31 females (100.0%) in their respective age groups living below the poverty level.
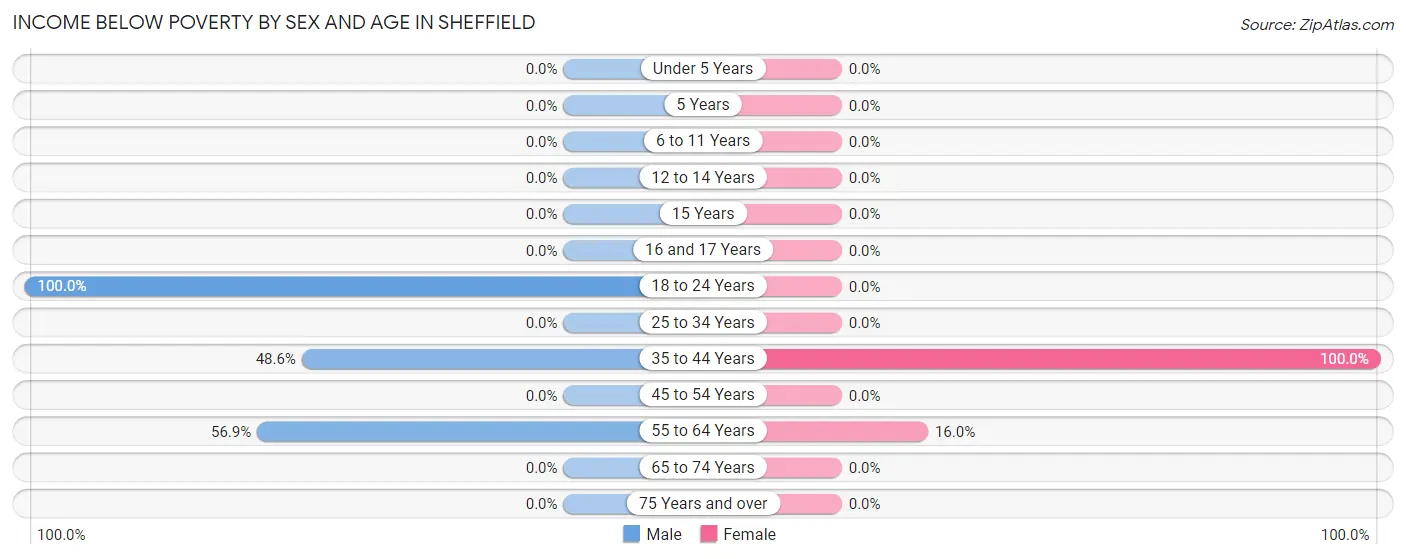
| Age Bracket | Male | Female |
| Under 5 Years | 0 (0.0%) | 0 (0.0%) |
| 5 Years | 0 (0.0%) | 0 (0.0%) |
| 6 to 11 Years | 0 (0.0%) | 0 (0.0%) |
| 12 to 14 Years | 0 (0.0%) | 0 (0.0%) |
| 15 Years | 0 (0.0%) | 0 (0.0%) |
| 16 and 17 Years | 0 (0.0%) | 0 (0.0%) |
| 18 to 24 Years | 46 (100.0%) | 0 (0.0%) |
| 25 to 34 Years | 0 (0.0%) | 0 (0.0%) |
| 35 to 44 Years | 34 (48.6%) | 31 (100.0%) |
| 45 to 54 Years | 0 (0.0%) | 0 (0.0%) |
| 55 to 64 Years | 29 (56.9%) | 12 (16.0%) |
| 65 to 74 Years | 0 (0.0%) | 0 (0.0%) |
| 75 Years and over | 0 (0.0%) | 0 (0.0%) |
| Total | 109 (27.5%) | 43 (11.9%) |
Income Above Poverty by Sex and Age in Sheffield
According to the poverty statistics in Sheffield, males aged 6 to 11 years and females aged under 5 years are the age groups that are most secure financially, with 100.0% of males and 100.0% of females in these age groups living above the poverty line.
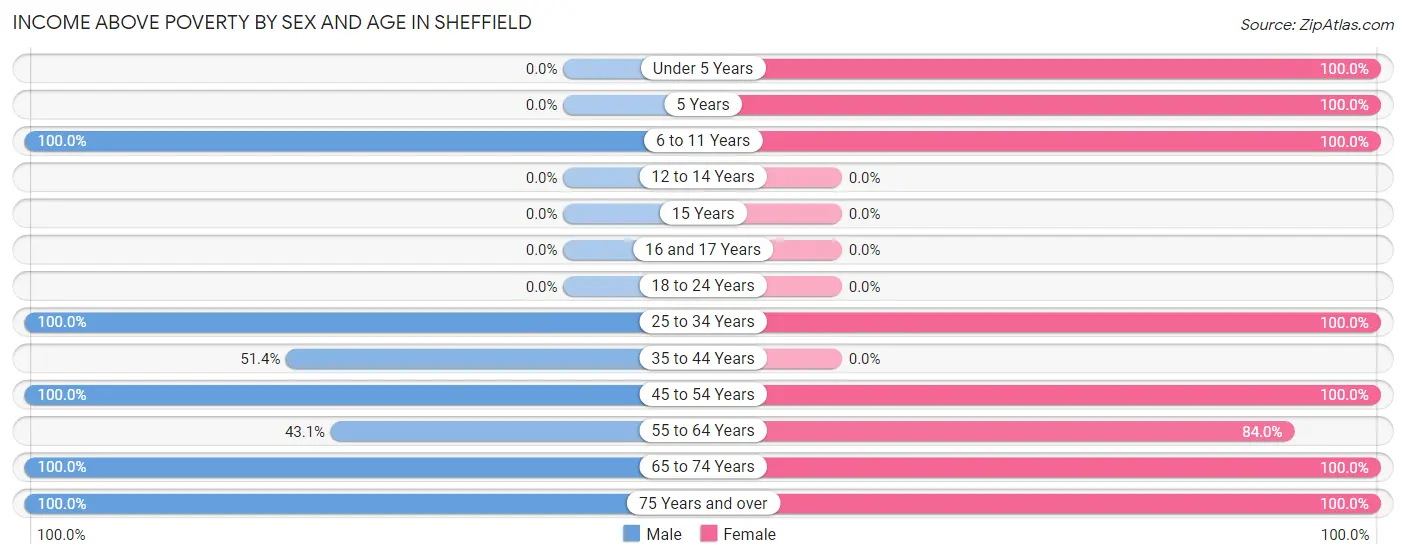
| Age Bracket | Male | Female |
| Under 5 Years | 0 (0.0%) | 28 (100.0%) |
| 5 Years | 0 (0.0%) | 7 (100.0%) |
| 6 to 11 Years | 75 (100.0%) | 26 (100.0%) |
| 12 to 14 Years | 0 (0.0%) | 0 (0.0%) |
| 15 Years | 0 (0.0%) | 0 (0.0%) |
| 16 and 17 Years | 0 (0.0%) | 0 (0.0%) |
| 18 to 24 Years | 0 (0.0%) | 0 (0.0%) |
| 25 to 34 Years | 70 (100.0%) | 56 (100.0%) |
| 35 to 44 Years | 36 (51.4%) | 0 (0.0%) |
| 45 to 54 Years | 4 (100.0%) | 22 (100.0%) |
| 55 to 64 Years | 22 (43.1%) | 63 (84.0%) |
| 65 to 74 Years | 45 (100.0%) | 62 (100.0%) |
| 75 Years and over | 36 (100.0%) | 53 (100.0%) |
| Total | 288 (72.5%) | 317 (88.1%) |
Income Below Poverty Among Married-Couple Families in Sheffield
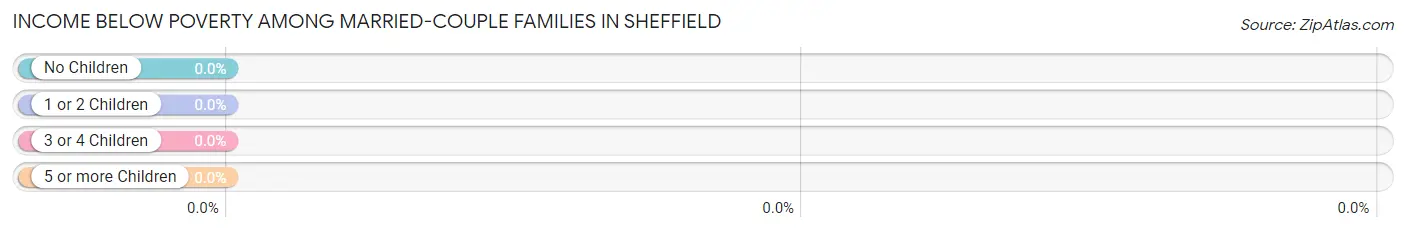
| Children | Above Poverty | Below Poverty |
| No Children | 79 (100.0%) | 0 (0.0%) |
| 1 or 2 Children | 78 (100.0%) | 0 (0.0%) |
| 3 or 4 Children | 0 (0.0%) | 0 (0.0%) |
| 5 or more Children | 0 (0.0%) | 0 (0.0%) |
| Total | 157 (100.0%) | 0 (0.0%) |
Income Below Poverty Among Single-Parent Households in Sheffield
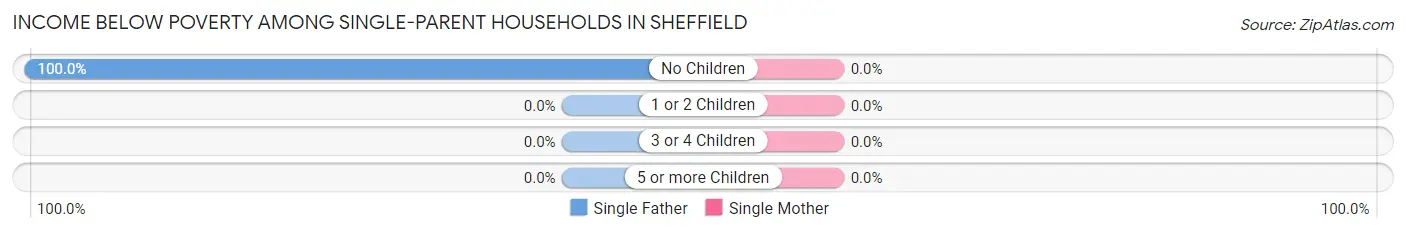
| Children | Single Father | Single Mother |
| No Children | 34 (100.0%) | 0 (0.0%) |
| 1 or 2 Children | 0 (0.0%) | 0 (0.0%) |
| 3 or 4 Children | 0 (0.0%) | 0 (0.0%) |
| 5 or more Children | 0 (0.0%) | 0 (0.0%) |
| Total | 34 (100.0%) | 0 (0.0%) |
Income Below Poverty Among Married-Couple vs Single-Parent Households in Sheffield
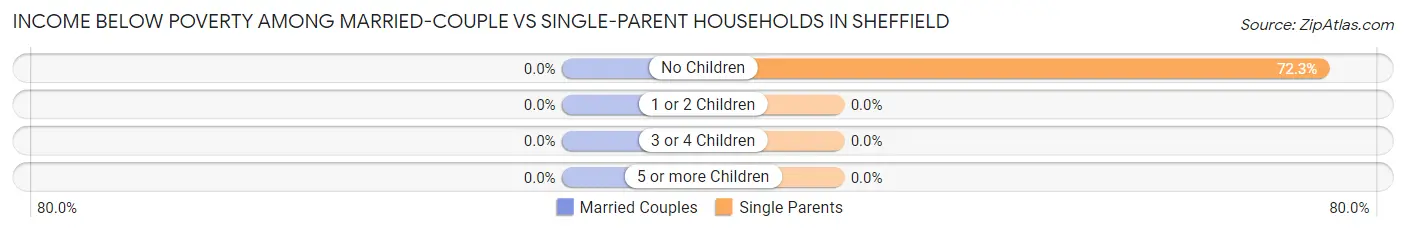
| Children | Married-Couple Families | Single-Parent Households |
| No Children | 0 (0.0%) | 34 (72.3%) |
| 1 or 2 Children | 0 (0.0%) | 0 (0.0%) |
| 3 or 4 Children | 0 (0.0%) | 0 (0.0%) |
| 5 or more Children | 0 (0.0%) | 0 (0.0%) |
| Total | 0 (0.0%) | 34 (72.3%) |
Race in Sheffield
The most populous races in Sheffield are White / Caucasian (730 | 96.4%), Black / African American (15 | 2.0%), and Some other Race (9 | 1.2%).
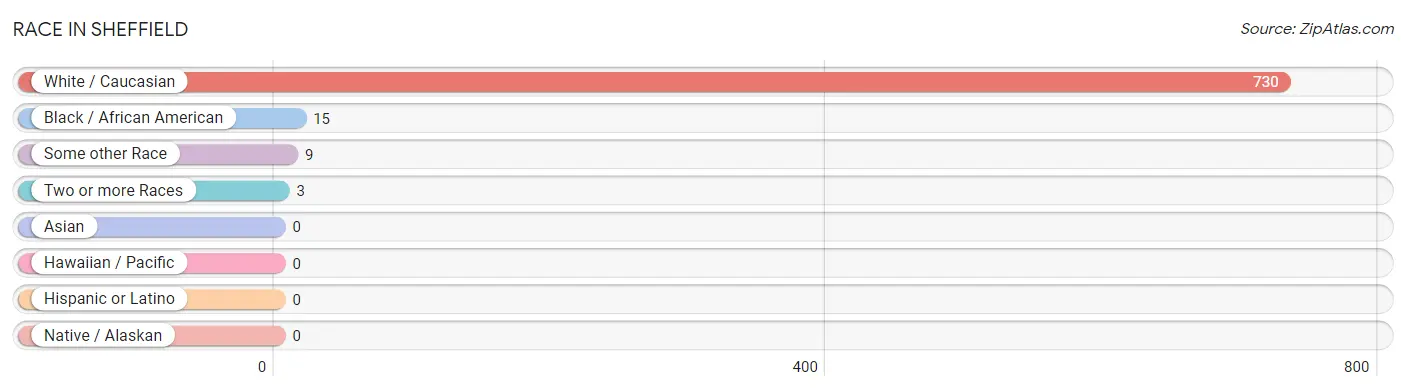
| Race | # Population | % Population |
| Asian | 0 | 0.0% |
| Black / African American | 15 | 2.0% |
| Hawaiian / Pacific | 0 | 0.0% |
| Hispanic or Latino | 0 | 0.0% |
| Native / Alaskan | 0 | 0.0% |
| White / Caucasian | 730 | 96.4% |
| Two or more Races | 3 | 0.4% |
| Some other Race | 9 | 1.2% |
| Total | 757 | 100.0% |
Ancestry in Sheffield
The most populous ancestries reported in Sheffield are American (184 | 24.3%), German (182 | 24.0%), Irish (48 | 6.3%), Italian (46 | 6.1%), and Swedish (46 | 6.1%), together accounting for 66.8% of all Sheffield residents.
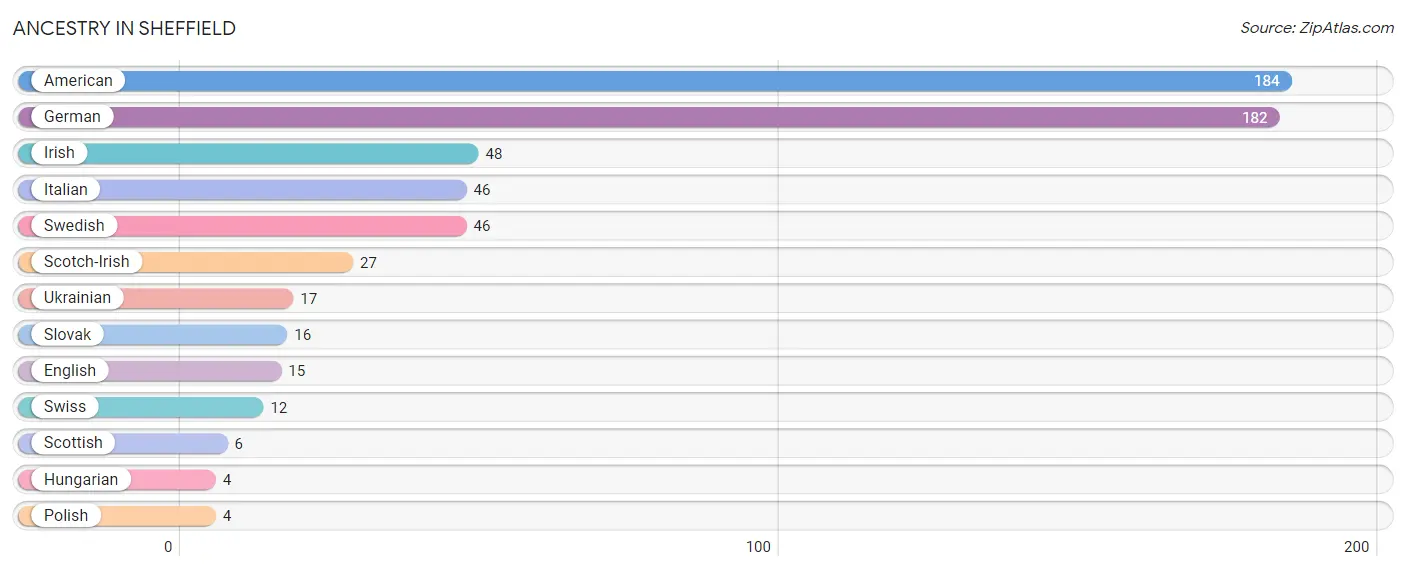
| Ancestry | # Population | % Population |
| American | 184 | 24.3% |
| English | 15 | 2.0% |
| German | 182 | 24.0% |
| Hungarian | 4 | 0.5% |
| Irish | 48 | 6.3% |
| Italian | 46 | 6.1% |
| Polish | 4 | 0.5% |
| Scotch-Irish | 27 | 3.6% |
| Scottish | 6 | 0.8% |
| Slovak | 16 | 2.1% |
| Swedish | 46 | 6.1% |
| Swiss | 12 | 1.6% |
| Ukrainian | 17 | 2.2% | View All 13 Rows |
Immigrants in Sheffield

| Immigration Origin | # Population | % Population | View All 0 Rows |
Sex and Age in Sheffield
Sex and Age in Sheffield
The most populous age groups in Sheffield are 5 to 9 Years (75 | 18.9%) for men and 30 to 34 Years (56 | 15.6%) for women.
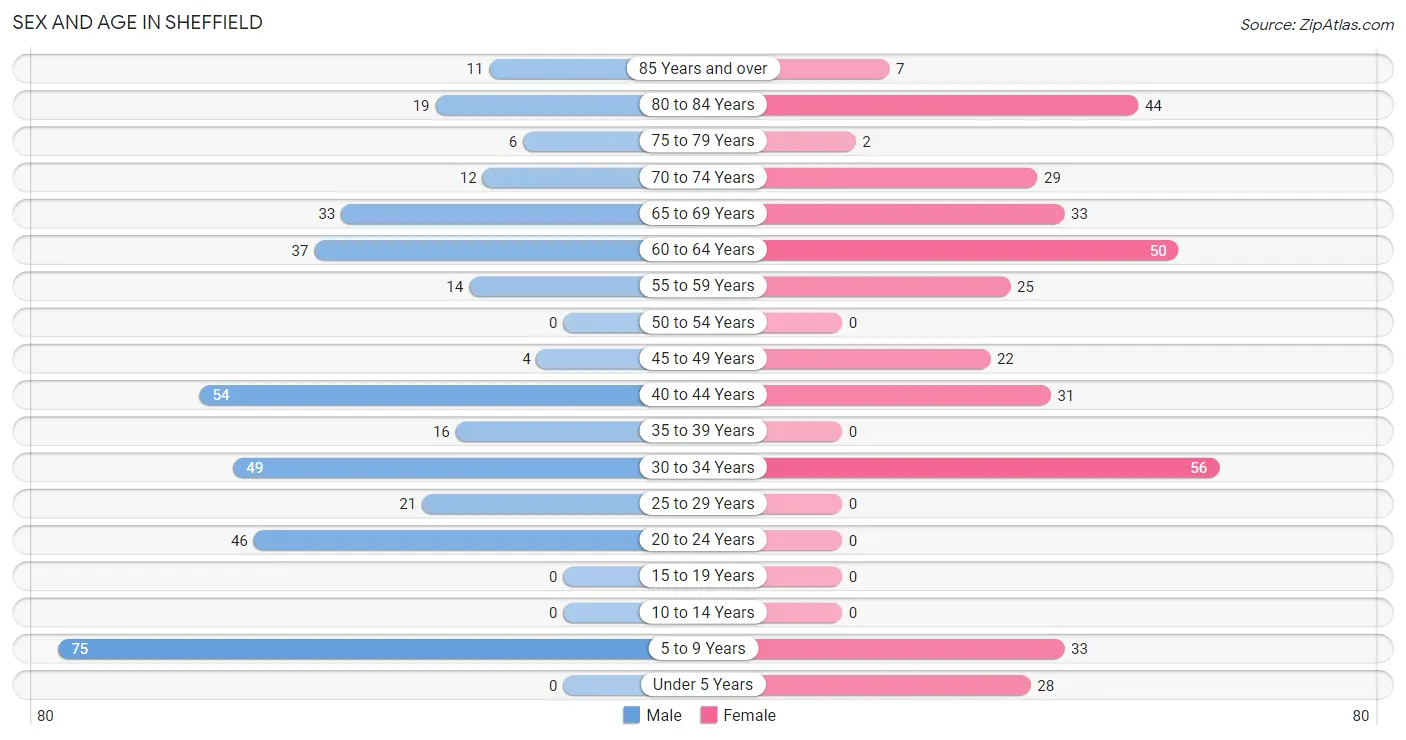
| Age Bracket | Male | Female |
| Under 5 Years | 0 (0.0%) | 28 (7.8%) |
| 5 to 9 Years | 75 (18.9%) | 33 (9.2%) |
| 10 to 14 Years | 0 (0.0%) | 0 (0.0%) |
| 15 to 19 Years | 0 (0.0%) | 0 (0.0%) |
| 20 to 24 Years | 46 (11.6%) | 0 (0.0%) |
| 25 to 29 Years | 21 (5.3%) | 0 (0.0%) |
| 30 to 34 Years | 49 (12.3%) | 56 (15.6%) |
| 35 to 39 Years | 16 (4.0%) | 0 (0.0%) |
| 40 to 44 Years | 54 (13.6%) | 31 (8.6%) |
| 45 to 49 Years | 4 (1.0%) | 22 (6.1%) |
| 50 to 54 Years | 0 (0.0%) | 0 (0.0%) |
| 55 to 59 Years | 14 (3.5%) | 25 (6.9%) |
| 60 to 64 Years | 37 (9.3%) | 50 (13.9%) |
| 65 to 69 Years | 33 (8.3%) | 33 (9.2%) |
| 70 to 74 Years | 12 (3.0%) | 29 (8.1%) |
| 75 to 79 Years | 6 (1.5%) | 2 (0.6%) |
| 80 to 84 Years | 19 (4.8%) | 44 (12.2%) |
| 85 Years and over | 11 (2.8%) | 7 (1.9%) |
| Total | 397 (100.0%) | 360 (100.0%) |
Families and Households in Sheffield
Median Family Size in Sheffield
The median family size in Sheffield is 2.96 persons per family, with married-couple families (157 | 77.0%) accounting for the largest median family size of 3.11 persons per family. On the other hand, single male/father families (34 | 16.7%) represent the smallest median family size with 2.35 persons per family.
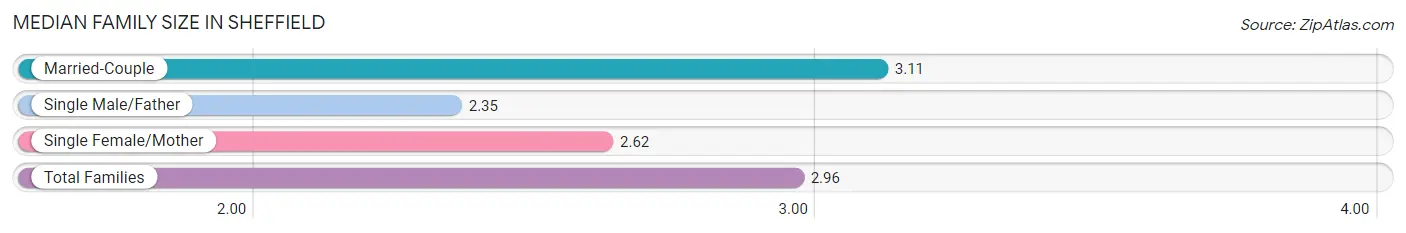
| Family Type | # Families | Family Size |
| Married-Couple | 157 (77.0%) | 3.11 |
| Single Male/Father | 34 (16.7%) | 2.35 |
| Single Female/Mother | 13 (6.4%) | 2.62 |
| Total Families | 204 (100.0%) | 2.96 |
Median Household Size in Sheffield
The median household size in Sheffield is 2.42 persons per household, with single male/father households (34 | 10.9%) accounting for the largest median household size of 3.26 persons per household. non-family households (109 | 34.8%) represent the smallest median household size with 1.13 persons per household.
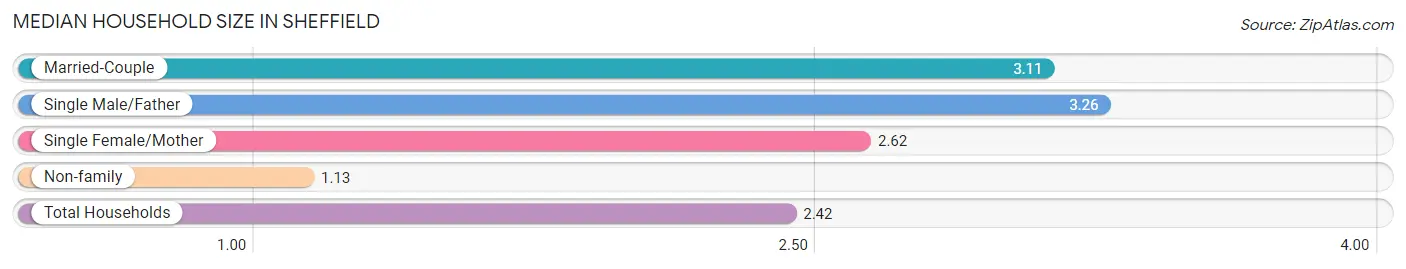
| Household Type | # Households | Household Size |
| Married-Couple | 157 (50.2%) | 3.11 |
| Single Male/Father | 34 (10.9%) | 3.26 |
| Single Female/Mother | 13 (4.2%) | 2.62 |
| Non-family | 109 (34.8%) | 1.13 |
| Total Households | 313 (100.0%) | 2.42 |
Household Size by Marriage Status in Sheffield
Out of a total of 313 households in Sheffield, 204 (65.2%) are family households, while 109 (34.8%) are nonfamily households. The most numerous type of family households are 3-person households, comprising 111, and the most common type of nonfamily households are 1-person households, comprising 97.
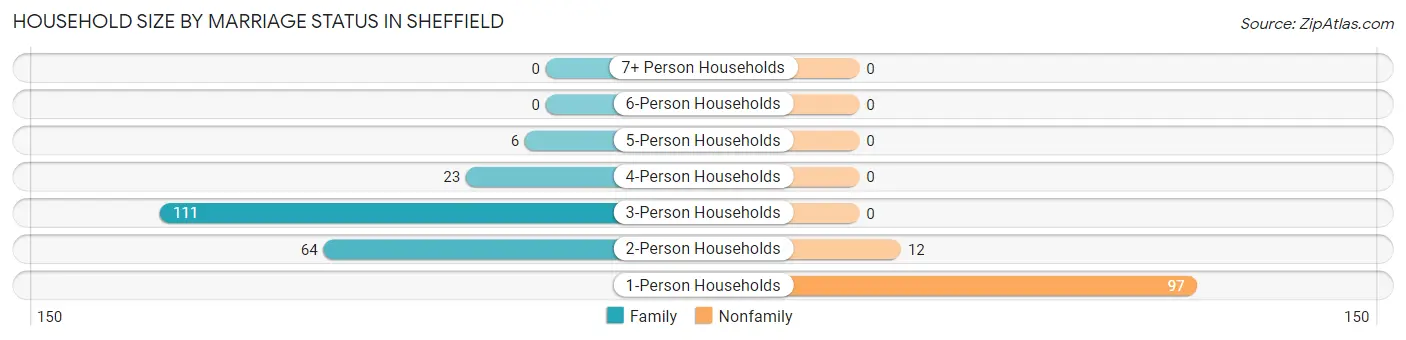
| Household Size | Family Households | Nonfamily Households |
| 1-Person Households | - | 97 (31.0%) |
| 2-Person Households | 64 (20.4%) | 12 (3.8%) |
| 3-Person Households | 111 (35.5%) | 0 (0.0%) |
| 4-Person Households | 23 (7.3%) | 0 (0.0%) |
| 5-Person Households | 6 (1.9%) | 0 (0.0%) |
| 6-Person Households | 0 (0.0%) | 0 (0.0%) |
| 7+ Person Households | 0 (0.0%) | 0 (0.0%) |
| Total | 204 (65.2%) | 109 (34.8%) |
Female Fertility in Sheffield
Fertility by Age in Sheffield
Average fertility rate in Sheffield is 284.0 births per 1,000 women. Women in the age bracket of 35 to 50 years have the highest fertility rate with 585.0 births per 1,000 women. Women in the age bracket of 35 to 50 years acount for 100.0% of all women with births.
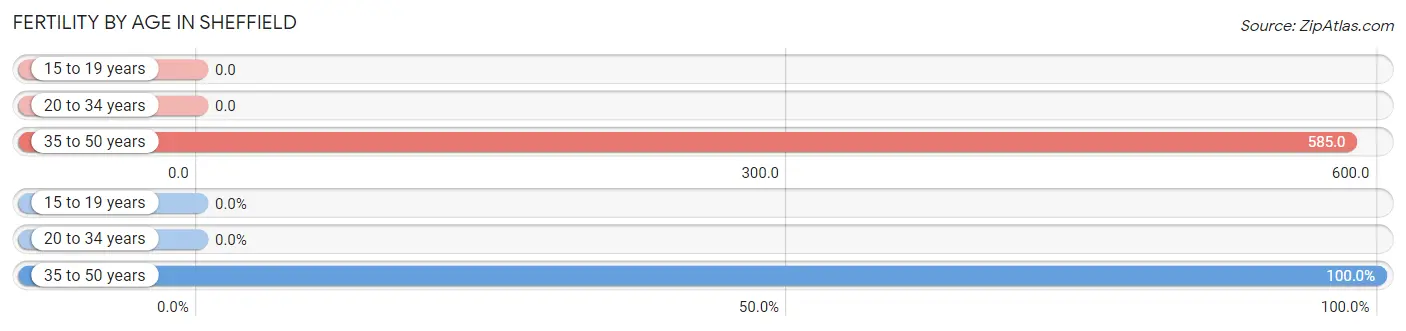
| Age Bracket | Women with Births | Births / 1,000 Women |
| 15 to 19 years | 0 (0.0%) | 0.0 |
| 20 to 34 years | 0 (0.0%) | 0.0 |
| 35 to 50 years | 31 (100.0%) | 585.0 |
| Total | 31 (100.0%) | 284.0 |
Fertility by Age by Marriage Status in Sheffield
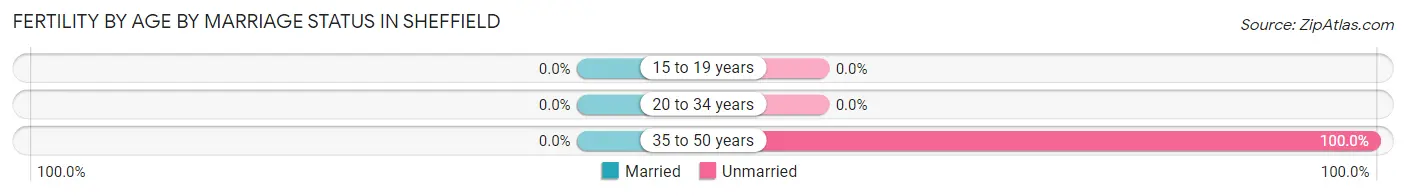
| Age Bracket | Married | Unmarried |
| 15 to 19 years | 0 (0.0%) | 0 (0.0%) |
| 20 to 34 years | 0 (0.0%) | 0 (0.0%) |
| 35 to 50 years | 0 (0.0%) | 31 (100.0%) |
| Total | 0 (0.0%) | 31 (100.0%) |
Fertility by Education in Sheffield
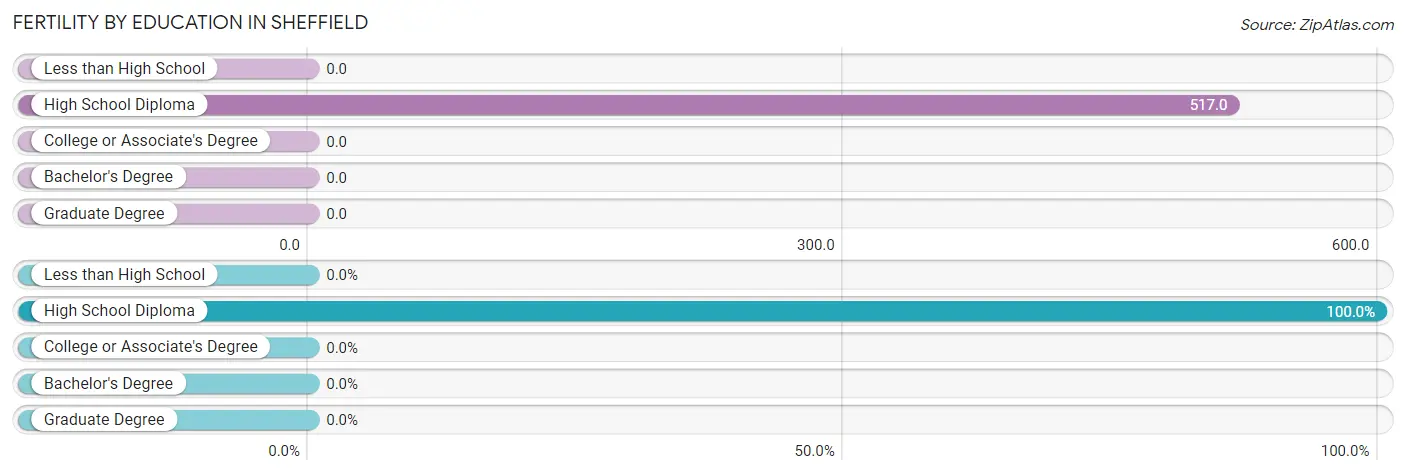
| Educational Attainment | Women with Births | Births / 1,000 Women |
| Less than High School | 0 (0.0%) | 0.0 |
| High School Diploma | 31 (100.0%) | 517.0 |
| College or Associate's Degree | 0 (0.0%) | 0.0 |
| Bachelor's Degree | 0 (0.0%) | 0.0 |
| Graduate Degree | 0 (0.0%) | 0.0 |
| Total | 31 (100.0%) | 284.0 |
Fertility by Education by Marriage Status in Sheffield
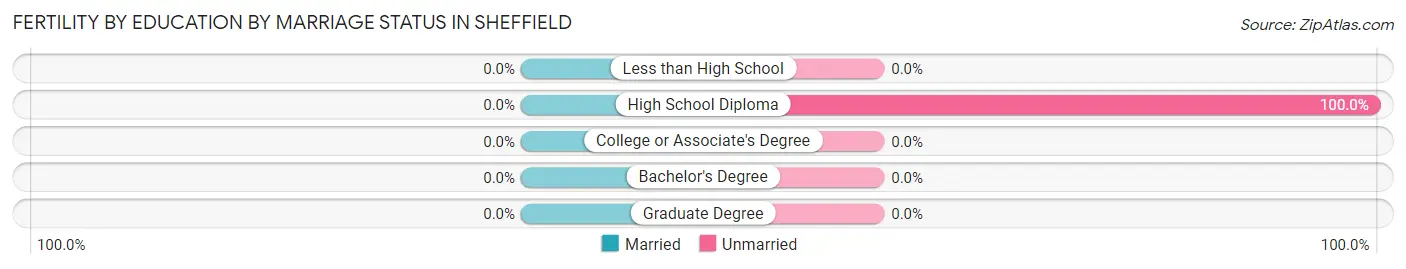
| Educational Attainment | Married | Unmarried |
| Less than High School | 0 (0.0%) | 0 (0.0%) |
| High School Diploma | 0 (0.0%) | 31 (100.0%) |
| College or Associate's Degree | 0 (0.0%) | 0 (0.0%) |
| Bachelor's Degree | 0 (0.0%) | 0 (0.0%) |
| Graduate Degree | 0 (0.0%) | 0 (0.0%) |
| Total | 0 (0.0%) | 31 (100.0%) |
Employment Characteristics in Sheffield
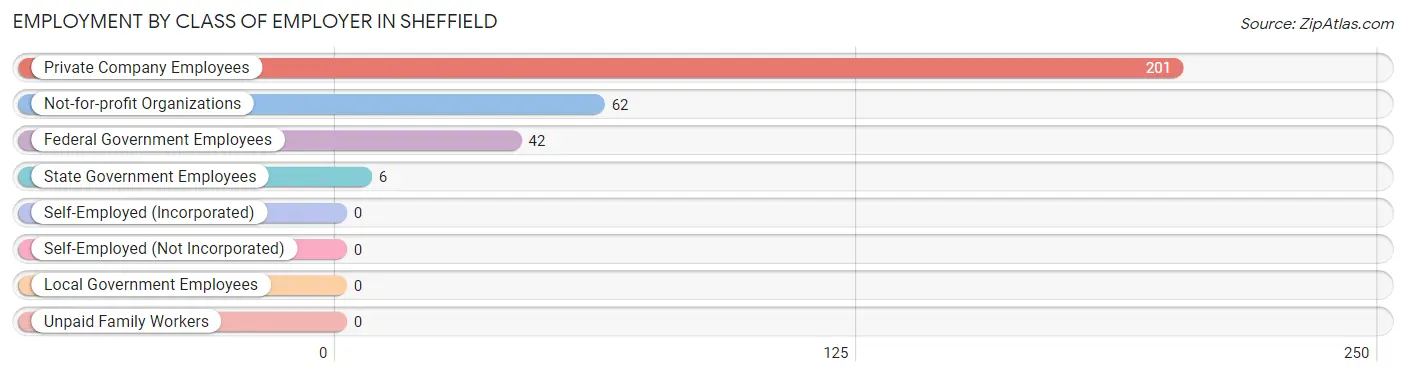
Employment by Class of Employer in Sheffield
Among the 311 employed individuals in Sheffield, private company employees (201 | 64.6%), not-for-profit organizations (62 | 19.9%), and federal government employees (42 | 13.5%) make up the most common classes of employment.
| Employer Class | # Employees | % Employees |
| Private Company Employees | 201 | 64.6% |
| Self-Employed (Incorporated) | 0 | 0.0% |
| Self-Employed (Not Incorporated) | 0 | 0.0% |
| Not-for-profit Organizations | 62 | 19.9% |
| Local Government Employees | 0 | 0.0% |
| State Government Employees | 6 | 1.9% |
| Federal Government Employees | 42 | 13.5% |
| Unpaid Family Workers | 0 | 0.0% |
| Total | 311 | 100.0% |
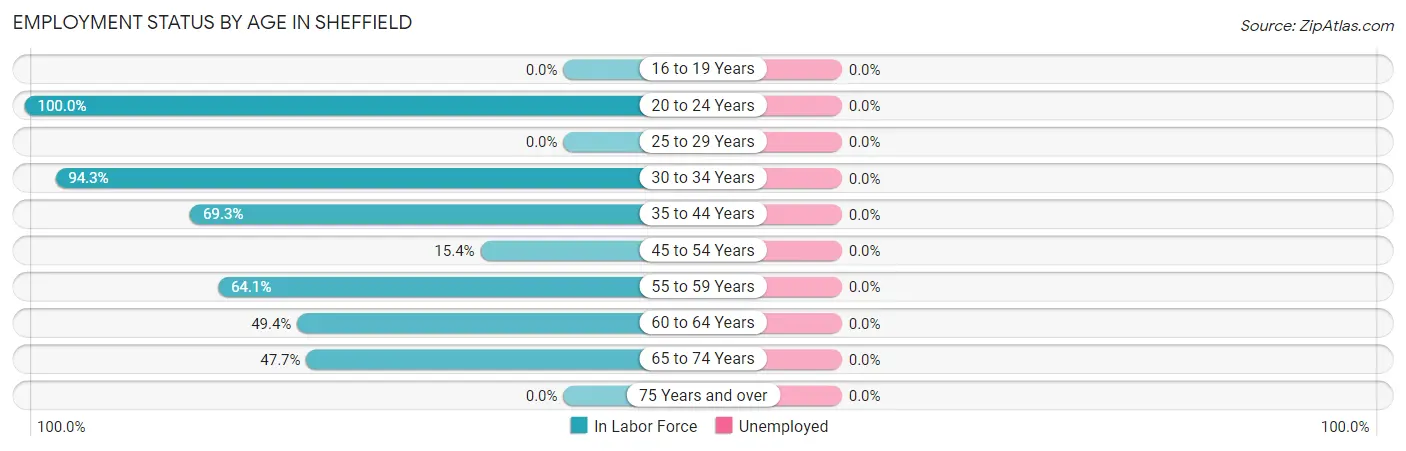
Employment Status by Age in Sheffield
| Age Bracket | In Labor Force | Unemployed |
| 16 to 19 Years | 0 (0.0%) | 0 (0.0%) |
| 20 to 24 Years | 46 (100.0%) | 0 (0.0%) |
| 25 to 29 Years | 0 (0.0%) | 0 (0.0%) |
| 30 to 34 Years | 99 (94.3%) | 0 (0.0%) |
| 35 to 44 Years | 70 (69.3%) | 0 (0.0%) |
| 45 to 54 Years | 4 (15.4%) | 0 (0.0%) |
| 55 to 59 Years | 25 (64.1%) | 0 (0.0%) |
| 60 to 64 Years | 43 (49.4%) | 0 (0.0%) |
| 65 to 74 Years | 51 (47.7%) | 0 (0.0%) |
| 75 Years and over | 0 (0.0%) | 0 (0.0%) |
| Total | 338 (54.4%) | 0 (0.0%) |
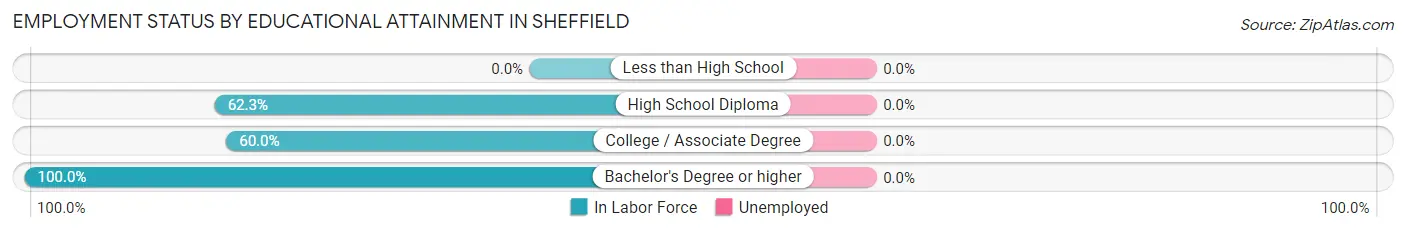
Employment Status by Educational Attainment in Sheffield
| Educational Attainment | In Labor Force | Unemployed |
| Less than High School | 0 (0.0%) | 0 (0.0%) |
| High School Diploma | 165 (62.3%) | 0 (0.0%) |
| College / Associate Degree | 36 (60.0%) | 0 (0.0%) |
| Bachelor's Degree or higher | 40 (100.0%) | 0 (0.0%) |
| Total | 241 (63.6%) | 0 (0.0%) |
Employment Occupations by Sex in Sheffield
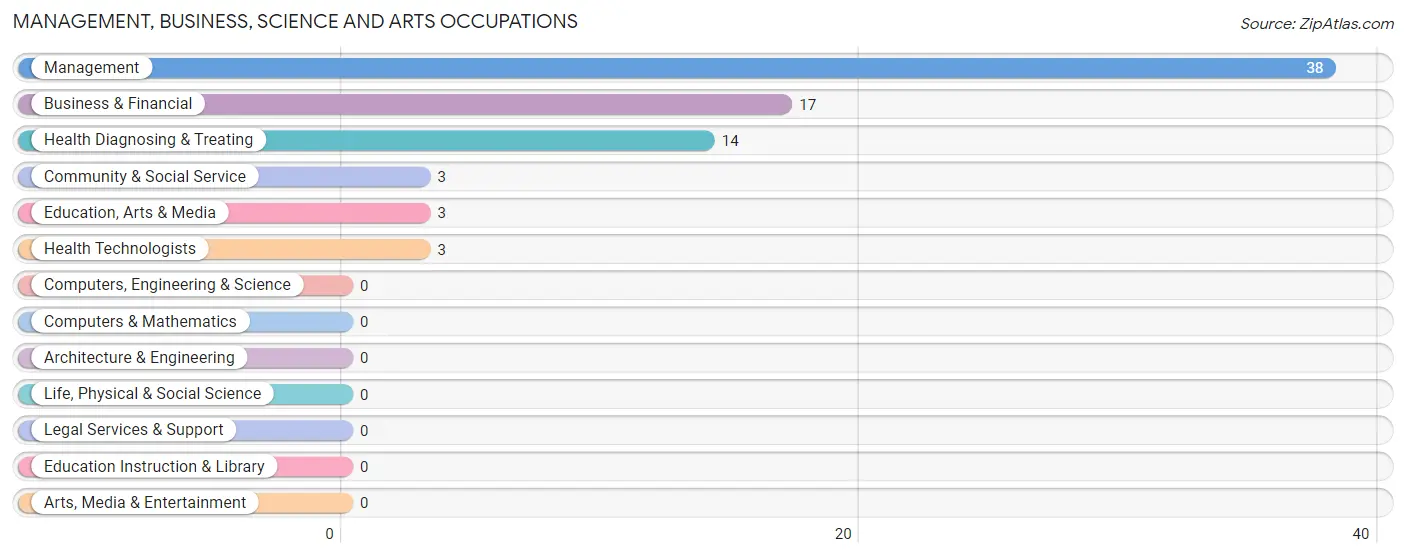
Management, Business, Science and Arts Occupations
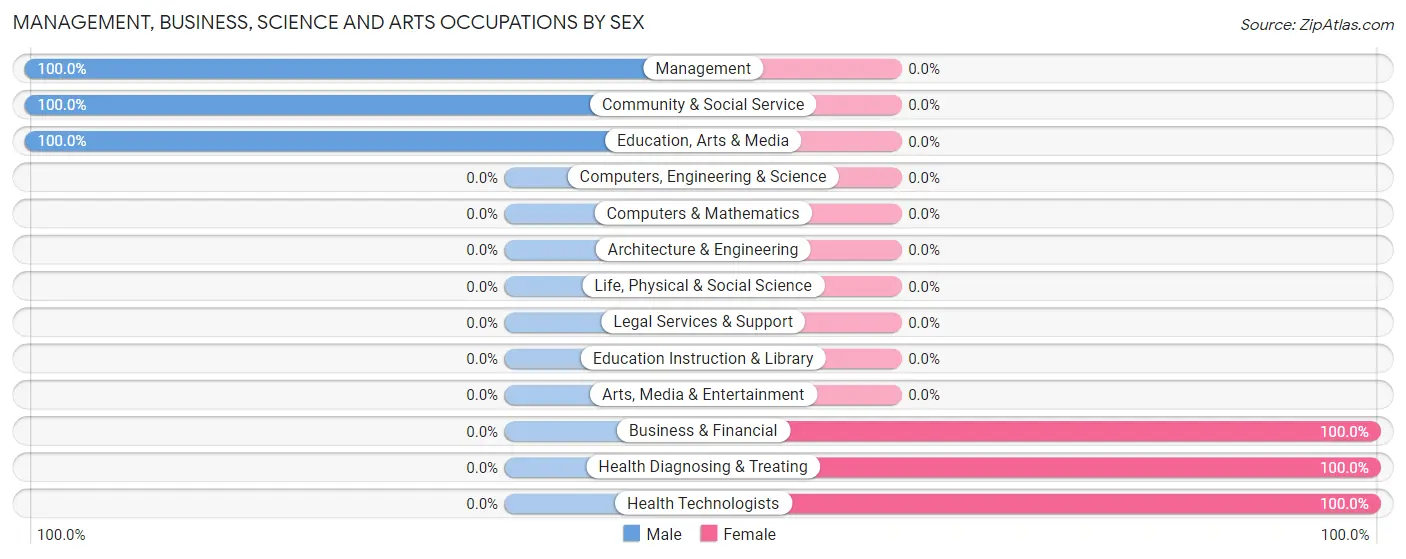
The most common Management, Business, Science and Arts occupations in Sheffield are Management (38 | 11.2%), Business & Financial (17 | 5.0%), Health Diagnosing & Treating (14 | 4.1%), Community & Social Service (3 | 0.9%), and Education, Arts & Media (3 | 0.9%).
Management, Business, Science and Arts Occupations by Sex
Within the Management, Business, Science and Arts occupations in Sheffield, the most male-oriented occupations are Management (100.0%), Community & Social Service (100.0%), and Education, Arts & Media (100.0%), while the most female-oriented occupations are Business & Financial (100.0%), Health Diagnosing & Treating (100.0%), and Health Technologists (100.0%).
| Occupation | Male | Female |
| Management | 38 (100.0%) | 0 (0.0%) |
| Business & Financial | 0 (0.0%) | 17 (100.0%) |
| Computers, Engineering & Science | 0 (0.0%) | 0 (0.0%) |
| Computers & Mathematics | 0 (0.0%) | 0 (0.0%) |
| Architecture & Engineering | 0 (0.0%) | 0 (0.0%) |
| Life, Physical & Social Science | 0 (0.0%) | 0 (0.0%) |
| Community & Social Service | 3 (100.0%) | 0 (0.0%) |
| Education, Arts & Media | 3 (100.0%) | 0 (0.0%) |
| Legal Services & Support | 0 (0.0%) | 0 (0.0%) |
| Education Instruction & Library | 0 (0.0%) | 0 (0.0%) |
| Arts, Media & Entertainment | 0 (0.0%) | 0 (0.0%) |
| Health Diagnosing & Treating | 0 (0.0%) | 14 (100.0%) |
| Health Technologists | 0 (0.0%) | 3 (100.0%) |
| Total (Category) | 41 (56.9%) | 31 (43.1%) |
| Total (Overall) | 194 (57.4%) | 144 (42.6%) |
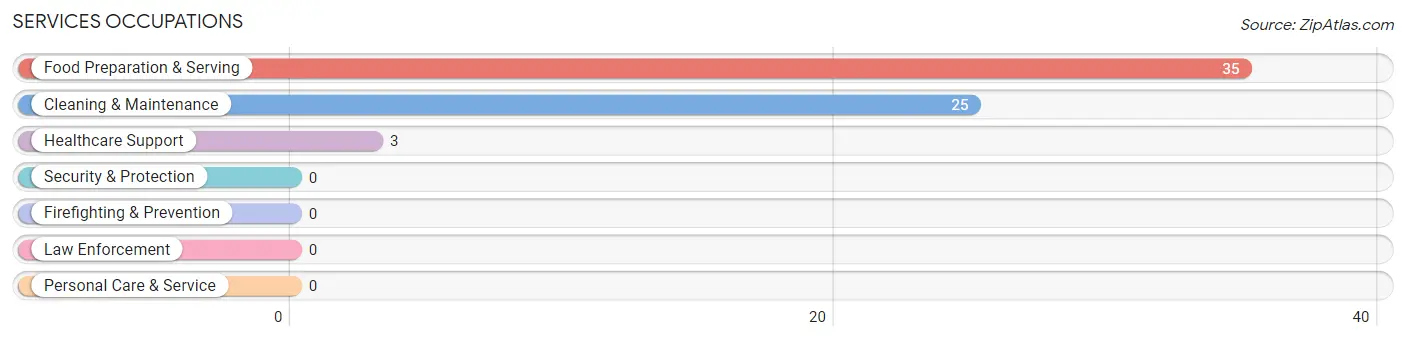
Services Occupations
The most common Services occupations in Sheffield are Food Preparation & Serving (35 | 10.4%), Cleaning & Maintenance (25 | 7.4%), and Healthcare Support (3 | 0.9%).
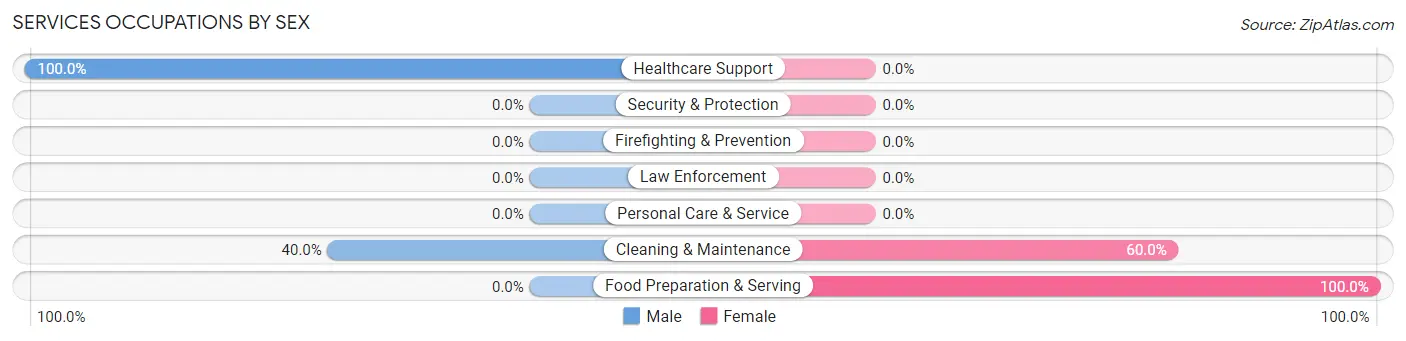
Services Occupations by Sex
Within the Services occupations in Sheffield, the most male-oriented occupations are Healthcare Support (100.0%), and Cleaning & Maintenance (40.0%), while the most female-oriented occupations are Food Preparation & Serving (100.0%), and Cleaning & Maintenance (60.0%).
| Occupation | Male | Female |
| Healthcare Support | 3 (100.0%) | 0 (0.0%) |
| Security & Protection | 0 (0.0%) | 0 (0.0%) |
| Firefighting & Prevention | 0 (0.0%) | 0 (0.0%) |
| Law Enforcement | 0 (0.0%) | 0 (0.0%) |
| Food Preparation & Serving | 0 (0.0%) | 35 (100.0%) |
| Cleaning & Maintenance | 10 (40.0%) | 15 (60.0%) |
| Personal Care & Service | 0 (0.0%) | 0 (0.0%) |
| Total (Category) | 13 (20.6%) | 50 (79.4%) |
| Total (Overall) | 194 (57.4%) | 144 (42.6%) |
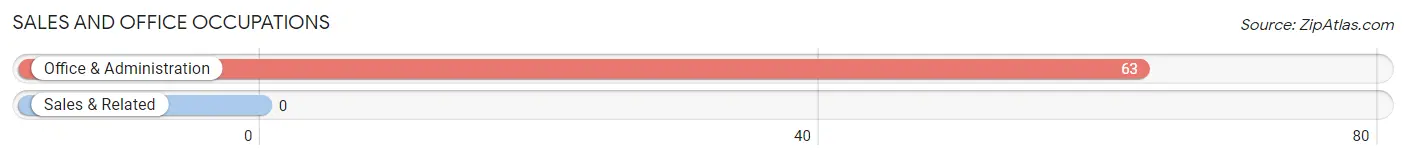
Sales and Office Occupations
The most common Sales and Office occupations in Sheffield are , and Office & Administration (63 | 18.6%).
Sales and Office Occupations by Sex
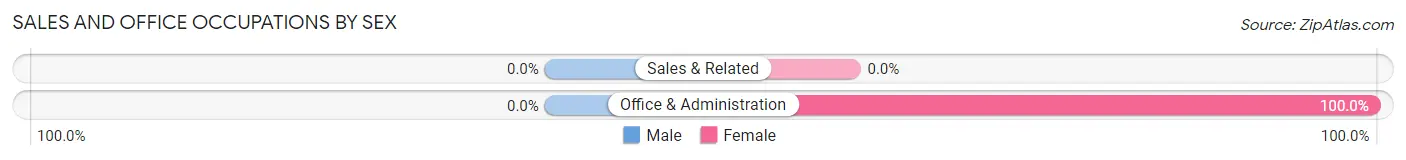
| Occupation | Male | Female |
| Sales & Related | 0 (0.0%) | 0 (0.0%) |
| Office & Administration | 0 (0.0%) | 63 (100.0%) |
| Total (Category) | 0 (0.0%) | 63 (100.0%) |
| Total (Overall) | 194 (57.4%) | 144 (42.6%) |
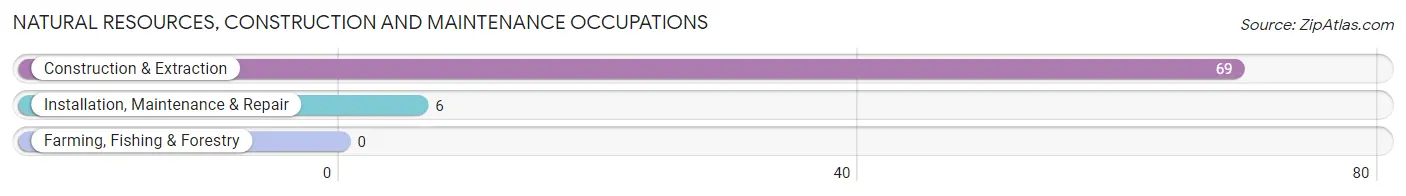
Natural Resources, Construction and Maintenance Occupations
The most common Natural Resources, Construction and Maintenance occupations in Sheffield are Construction & Extraction (69 | 20.4%), and Installation, Maintenance & Repair (6 | 1.8%).
Natural Resources, Construction and Maintenance Occupations by Sex
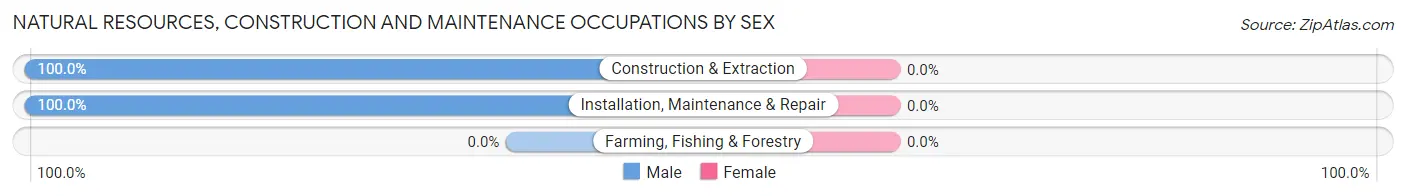
| Occupation | Male | Female |
| Farming, Fishing & Forestry | 0 (0.0%) | 0 (0.0%) |
| Construction & Extraction | 69 (100.0%) | 0 (0.0%) |
| Installation, Maintenance & Repair | 6 (100.0%) | 0 (0.0%) |
| Total (Category) | 75 (100.0%) | 0 (0.0%) |
| Total (Overall) | 194 (57.4%) | 144 (42.6%) |
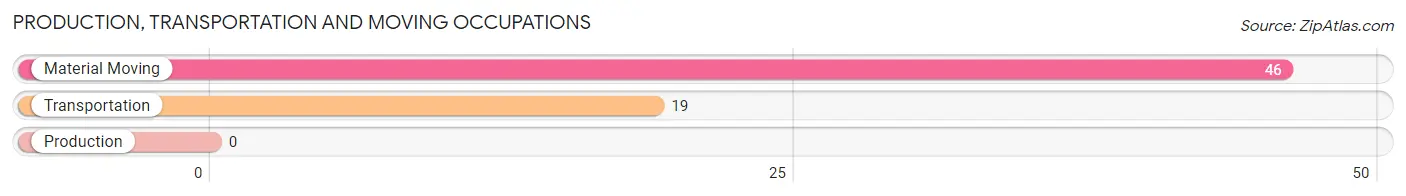
Production, Transportation and Moving Occupations
The most common Production, Transportation and Moving occupations in Sheffield are Material Moving (46 | 13.6%), and Transportation (19 | 5.6%).
Production, Transportation and Moving Occupations by Sex
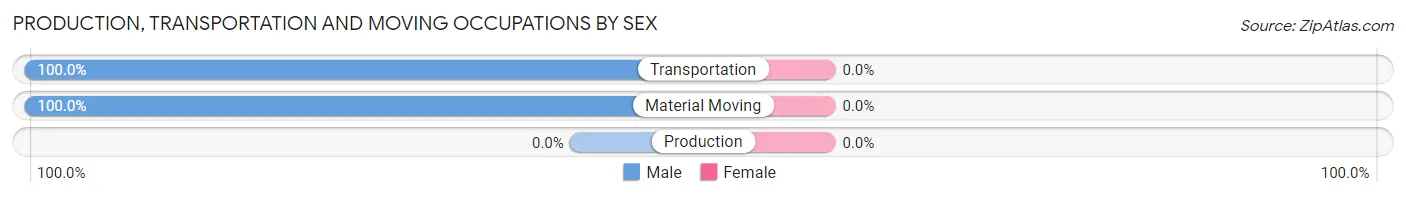
| Occupation | Male | Female |
| Production | 0 (0.0%) | 0 (0.0%) |
| Transportation | 19 (100.0%) | 0 (0.0%) |
| Material Moving | 46 (100.0%) | 0 (0.0%) |
| Total (Category) | 65 (100.0%) | 0 (0.0%) |
| Total (Overall) | 194 (57.4%) | 144 (42.6%) |
Employment Industries by Sex in Sheffield
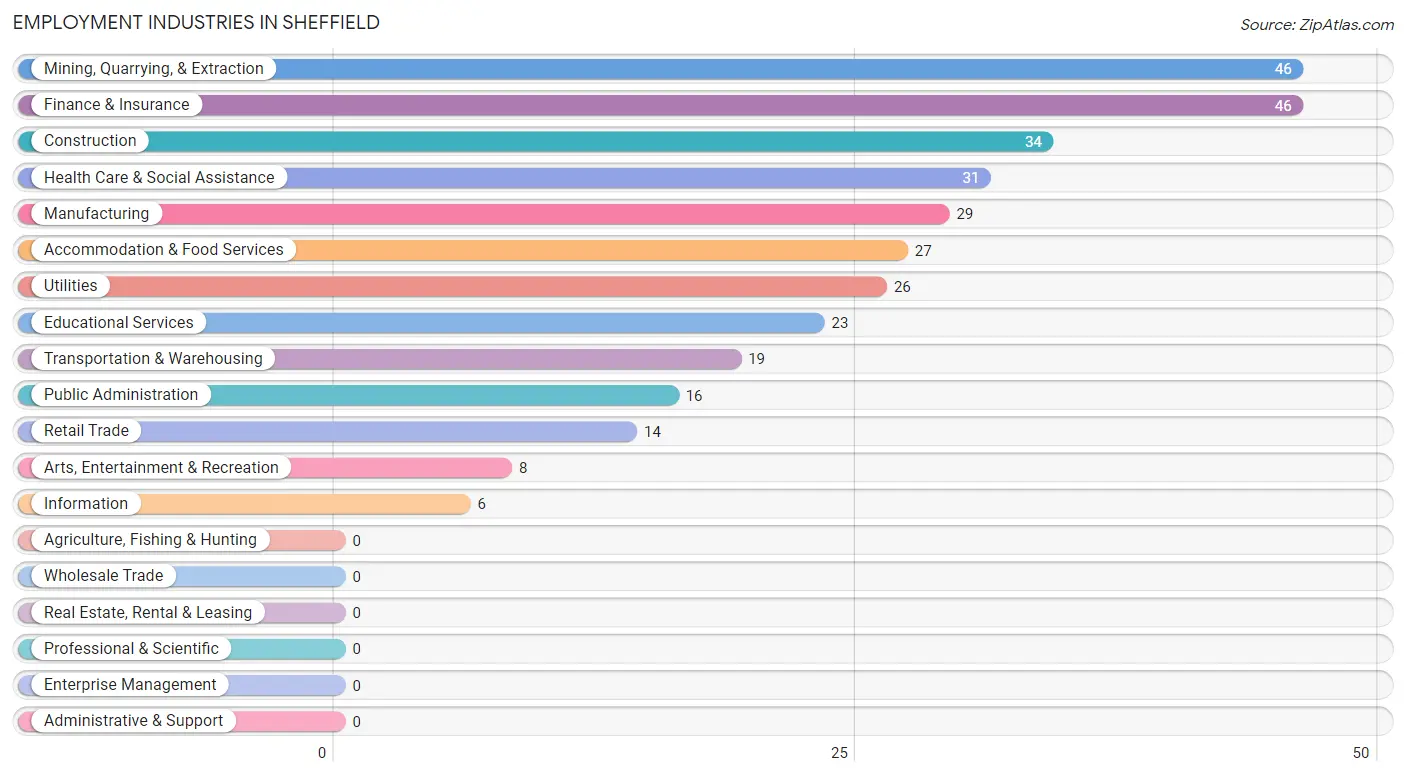
Employment Industries in Sheffield
The major employment industries in Sheffield include Mining, Quarrying, & Extraction (46 | 13.6%), Finance & Insurance (46 | 13.6%), Construction (34 | 10.1%), Health Care & Social Assistance (31 | 9.2%), and Manufacturing (29 | 8.6%).
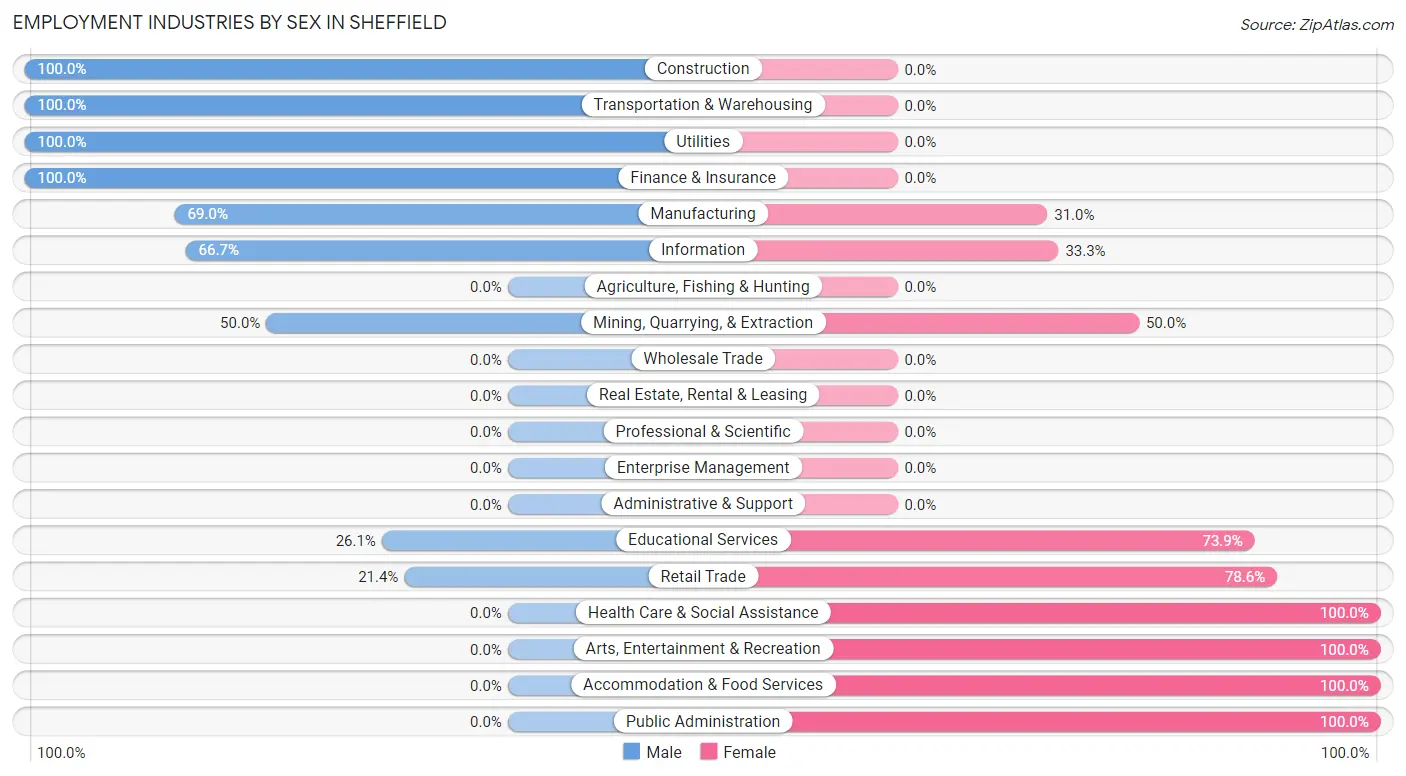
Employment Industries by Sex in Sheffield
The Sheffield industries that see more men than women are Construction (100.0%), Transportation & Warehousing (100.0%), and Utilities (100.0%), whereas the industries that tend to have a higher number of women are Health Care & Social Assistance (100.0%), Arts, Entertainment & Recreation (100.0%), and Accommodation & Food Services (100.0%).
| Industry | Male | Female |
| Agriculture, Fishing & Hunting | 0 (0.0%) | 0 (0.0%) |
| Mining, Quarrying, & Extraction | 23 (50.0%) | 23 (50.0%) |
| Construction | 34 (100.0%) | 0 (0.0%) |
| Manufacturing | 20 (69.0%) | 9 (31.0%) |
| Wholesale Trade | 0 (0.0%) | 0 (0.0%) |
| Retail Trade | 3 (21.4%) | 11 (78.6%) |
| Transportation & Warehousing | 19 (100.0%) | 0 (0.0%) |
| Utilities | 26 (100.0%) | 0 (0.0%) |
| Information | 4 (66.7%) | 2 (33.3%) |
| Finance & Insurance | 46 (100.0%) | 0 (0.0%) |
| Real Estate, Rental & Leasing | 0 (0.0%) | 0 (0.0%) |
| Professional & Scientific | 0 (0.0%) | 0 (0.0%) |
| Enterprise Management | 0 (0.0%) | 0 (0.0%) |
| Administrative & Support | 0 (0.0%) | 0 (0.0%) |
| Educational Services | 6 (26.1%) | 17 (73.9%) |
| Health Care & Social Assistance | 0 (0.0%) | 31 (100.0%) |
| Arts, Entertainment & Recreation | 0 (0.0%) | 8 (100.0%) |
| Accommodation & Food Services | 0 (0.0%) | 27 (100.0%) |
| Public Administration | 0 (0.0%) | 16 (100.0%) |
| Total | 194 (57.4%) | 144 (42.6%) |
Education in Sheffield
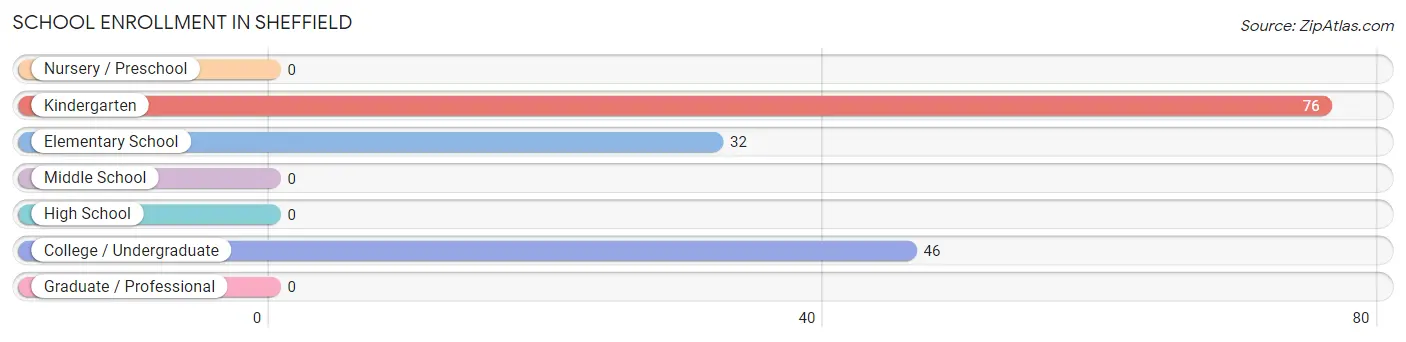
School Enrollment in Sheffield
The most common levels of schooling among the 154 students in Sheffield are kindergarten (76 | 49.3%), college / undergraduate (46 | 29.9%), and elementary school (32 | 20.8%).
| School Level | # Students | % Students |
| Nursery / Preschool | 0 | 0.0% |
| Kindergarten | 76 | 49.3% |
| Elementary School | 32 | 20.8% |
| Middle School | 0 | 0.0% |
| High School | 0 | 0.0% |
| College / Undergraduate | 46 | 29.9% |
| Graduate / Professional | 0 | 0.0% |
| Total | 154 | 100.0% |
School Enrollment by Age by Funding Source in Sheffield
Out of a total of 154 students who are enrolled in schools in Sheffield, 7 (4.5%) attend a private institution, while the remaining 147 (95.5%) are enrolled in public schools. The age group of 5 to 9 year old has the highest likelihood of being enrolled in private schools, with 7 (6.5% in the age bracket) enrolled. Conversely, the age group of 20 to 24 year olds has the lowest likelihood of being enrolled in a private school, with 46 (100.0% in the age bracket) attending a public institution.
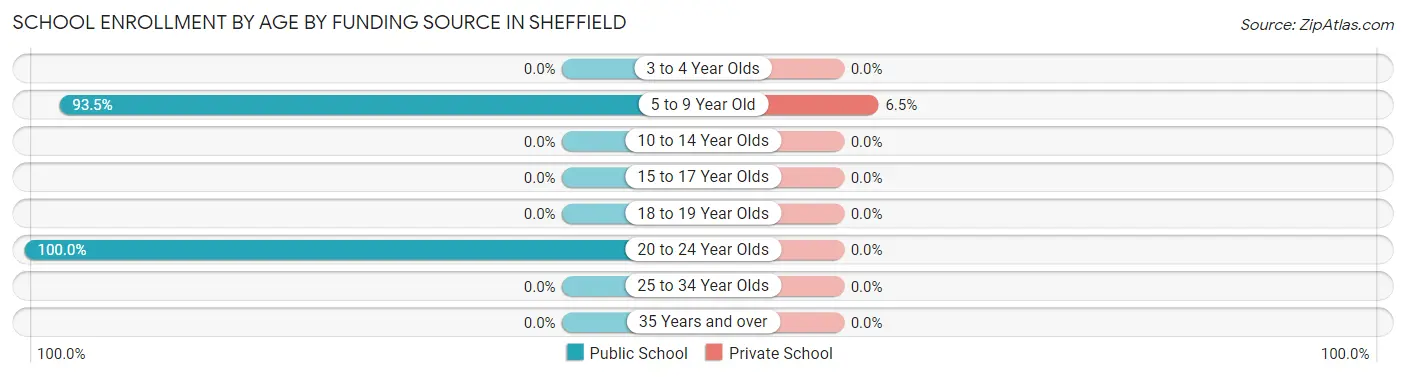
| Age Bracket | Public School | Private School |
| 3 to 4 Year Olds | 0 (0.0%) | 0 (0.0%) |
| 5 to 9 Year Old | 101 (93.5%) | 7 (6.5%) |
| 10 to 14 Year Olds | 0 (0.0%) | 0 (0.0%) |
| 15 to 17 Year Olds | 0 (0.0%) | 0 (0.0%) |
| 18 to 19 Year Olds | 0 (0.0%) | 0 (0.0%) |
| 20 to 24 Year Olds | 46 (100.0%) | 0 (0.0%) |
| 25 to 34 Year Olds | 0 (0.0%) | 0 (0.0%) |
| 35 Years and over | 0 (0.0%) | 0 (0.0%) |
| Total | 147 (95.5%) | 7 (4.5%) |
Educational Attainment by Field of Study in Sheffield
Business (40 | 61.5%), education (12 | 18.5%), science & technology (9 | 13.9%), and communications (4 | 6.1%) are the most common fields of study among 65 individuals in Sheffield who have obtained a bachelor's degree or higher.
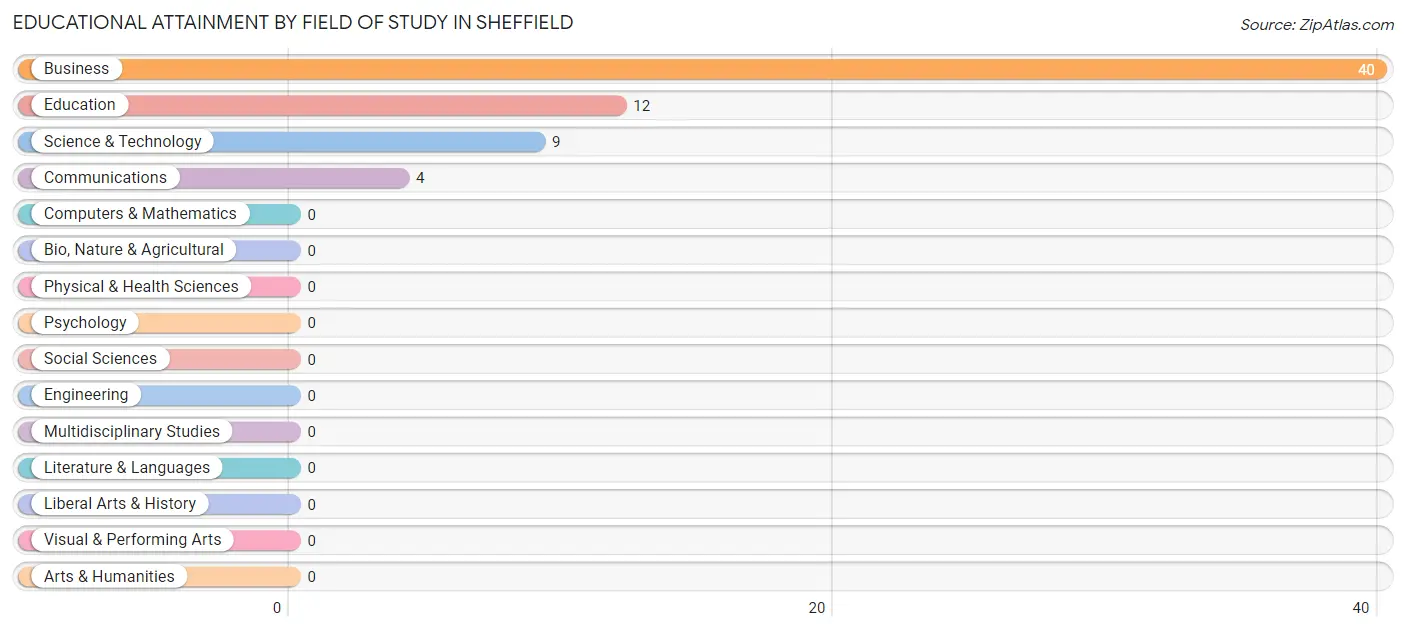
| Field of Study | # Graduates | % Graduates |
| Computers & Mathematics | 0 | 0.0% |
| Bio, Nature & Agricultural | 0 | 0.0% |
| Physical & Health Sciences | 0 | 0.0% |
| Psychology | 0 | 0.0% |
| Social Sciences | 0 | 0.0% |
| Engineering | 0 | 0.0% |
| Multidisciplinary Studies | 0 | 0.0% |
| Science & Technology | 9 | 13.9% |
| Business | 40 | 61.5% |
| Education | 12 | 18.5% |
| Literature & Languages | 0 | 0.0% |
| Liberal Arts & History | 0 | 0.0% |
| Visual & Performing Arts | 0 | 0.0% |
| Communications | 4 | 6.1% |
| Arts & Humanities | 0 | 0.0% |
| Total | 65 | 100.0% |
Transportation & Commute in Sheffield
Vehicle Availability by Sex in Sheffield
The most prevalent vehicle ownership categories in Sheffield are males with 2 vehicles (81, accounting for 41.7%) and females with 2 vehicles (56, making up 69.2%).
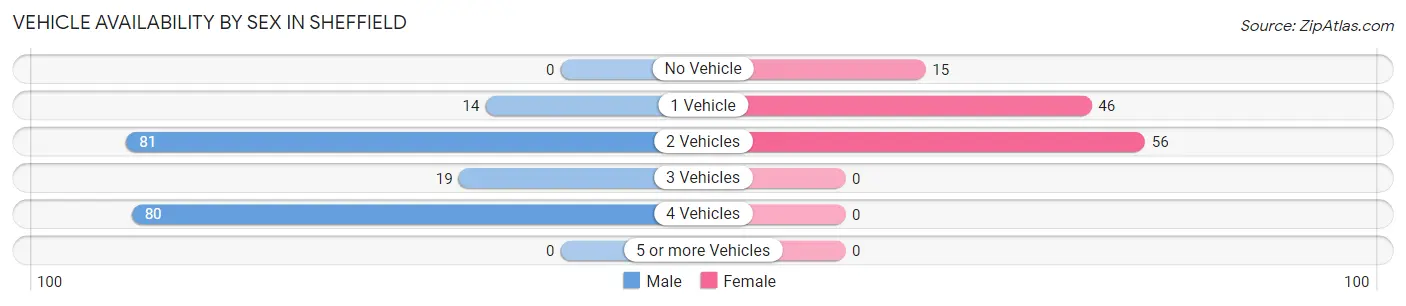
| Vehicles Available | Male | Female |
| No Vehicle | 0 (0.0%) | 15 (12.8%) |
| 1 Vehicle | 14 (7.2%) | 46 (39.3%) |
| 2 Vehicles | 81 (41.7%) | 56 (47.9%) |
| 3 Vehicles | 19 (9.8%) | 0 (0.0%) |
| 4 Vehicles | 80 (41.2%) | 0 (0.0%) |
| 5 or more Vehicles | 0 (0.0%) | 0 (0.0%) |
| Total | 194 (100.0%) | 117 (100.0%) |
Commute Time in Sheffield
The most frequently occuring commute durations in Sheffield are 20 to 24 minutes (88 commuters, 32.5%), 30 to 34 minutes (62 commuters, 22.9%), and less than 5 minutes (45 commuters, 16.6%).
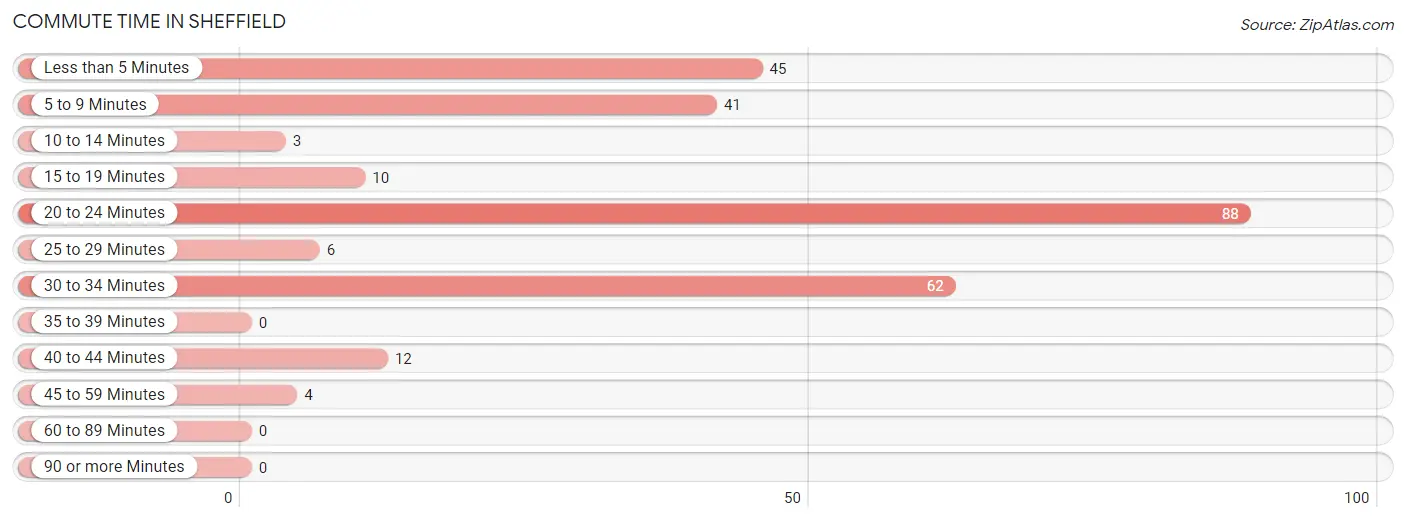
| Commute Time | # Commuters | % Commuters |
| Less than 5 Minutes | 45 | 16.6% |
| 5 to 9 Minutes | 41 | 15.1% |
| 10 to 14 Minutes | 3 | 1.1% |
| 15 to 19 Minutes | 10 | 3.7% |
| 20 to 24 Minutes | 88 | 32.5% |
| 25 to 29 Minutes | 6 | 2.2% |
| 30 to 34 Minutes | 62 | 22.9% |
| 35 to 39 Minutes | 0 | 0.0% |
| 40 to 44 Minutes | 12 | 4.4% |
| 45 to 59 Minutes | 4 | 1.5% |
| 60 to 89 Minutes | 0 | 0.0% |
| 90 or more Minutes | 0 | 0.0% |
Commute Time by Sex in Sheffield
The most common commute times in Sheffield are 20 to 24 minutes (73 commuters, 37.6%) for males and less than 5 minutes (22 commuters, 28.6%) for females.
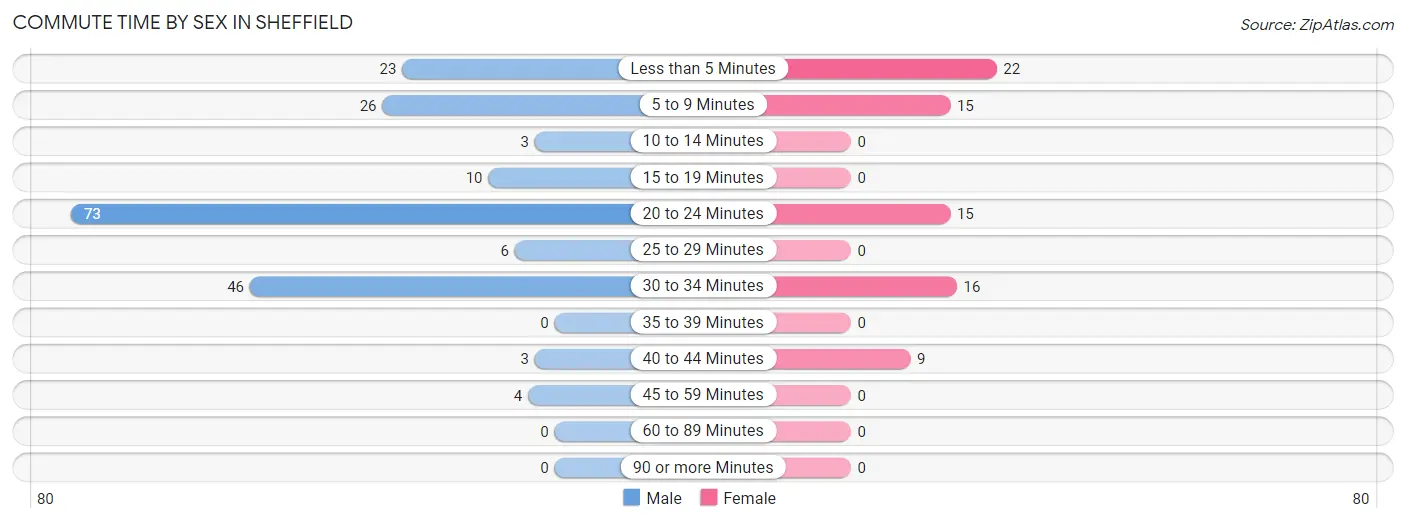
| Commute Time | Male | Female |
| Less than 5 Minutes | 23 (11.9%) | 22 (28.6%) |
| 5 to 9 Minutes | 26 (13.4%) | 15 (19.5%) |
| 10 to 14 Minutes | 3 (1.5%) | 0 (0.0%) |
| 15 to 19 Minutes | 10 (5.1%) | 0 (0.0%) |
| 20 to 24 Minutes | 73 (37.6%) | 15 (19.5%) |
| 25 to 29 Minutes | 6 (3.1%) | 0 (0.0%) |
| 30 to 34 Minutes | 46 (23.7%) | 16 (20.8%) |
| 35 to 39 Minutes | 0 (0.0%) | 0 (0.0%) |
| 40 to 44 Minutes | 3 (1.5%) | 9 (11.7%) |
| 45 to 59 Minutes | 4 (2.1%) | 0 (0.0%) |
| 60 to 89 Minutes | 0 (0.0%) | 0 (0.0%) |
| 90 or more Minutes | 0 (0.0%) | 0 (0.0%) |
Time of Departure to Work by Sex in Sheffield
The most frequent times of departure to work in Sheffield are 8:00 AM to 8:29 AM (50, 25.8%) for males and 7:30 AM to 7:59 AM (32, 41.6%) for females.
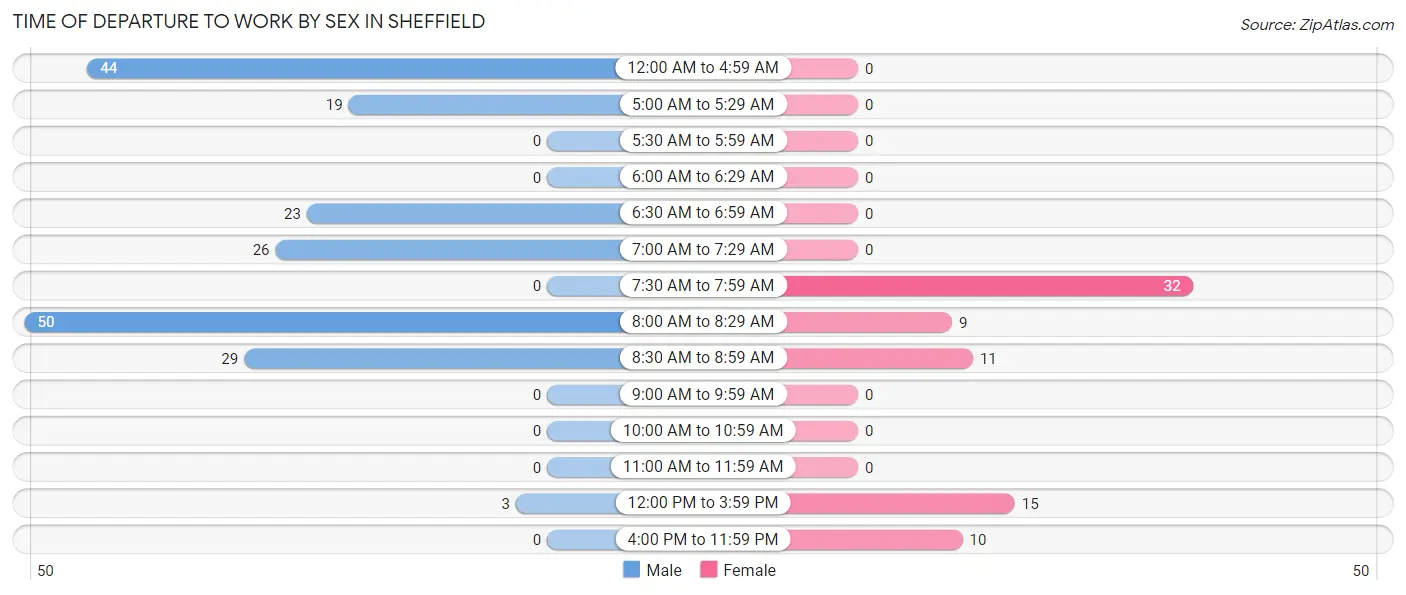
| Time of Departure | Male | Female |
| 12:00 AM to 4:59 AM | 44 (22.7%) | 0 (0.0%) |
| 5:00 AM to 5:29 AM | 19 (9.8%) | 0 (0.0%) |
| 5:30 AM to 5:59 AM | 0 (0.0%) | 0 (0.0%) |
| 6:00 AM to 6:29 AM | 0 (0.0%) | 0 (0.0%) |
| 6:30 AM to 6:59 AM | 23 (11.9%) | 0 (0.0%) |
| 7:00 AM to 7:29 AM | 26 (13.4%) | 0 (0.0%) |
| 7:30 AM to 7:59 AM | 0 (0.0%) | 32 (41.6%) |
| 8:00 AM to 8:29 AM | 50 (25.8%) | 9 (11.7%) |
| 8:30 AM to 8:59 AM | 29 (14.9%) | 11 (14.3%) |
| 9:00 AM to 9:59 AM | 0 (0.0%) | 0 (0.0%) |
| 10:00 AM to 10:59 AM | 0 (0.0%) | 0 (0.0%) |
| 11:00 AM to 11:59 AM | 0 (0.0%) | 0 (0.0%) |
| 12:00 PM to 3:59 PM | 3 (1.5%) | 15 (19.5%) |
| 4:00 PM to 11:59 PM | 0 (0.0%) | 10 (13.0%) |
| Total | 194 (100.0%) | 77 (100.0%) |
Housing Occupancy in Sheffield
Occupancy by Ownership in Sheffield
Of the total 313 dwellings in Sheffield, owner-occupied units account for 244 (78.0%), while renter-occupied units make up 69 (22.0%).
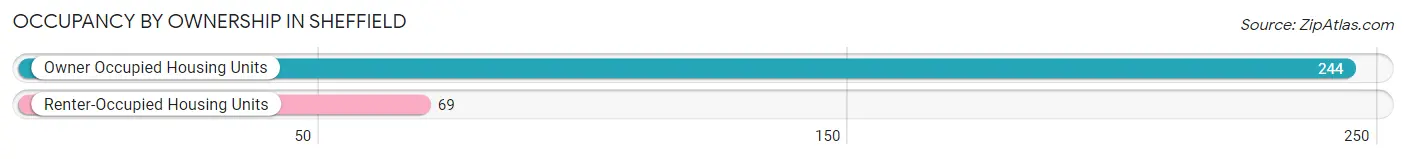
| Occupancy | # Housing Units | % Housing Units |
| Owner Occupied Housing Units | 244 | 78.0% |
| Renter-Occupied Housing Units | 69 | 22.0% |
| Total Occupied Housing Units | 313 | 100.0% |
Occupancy by Household Size in Sheffield
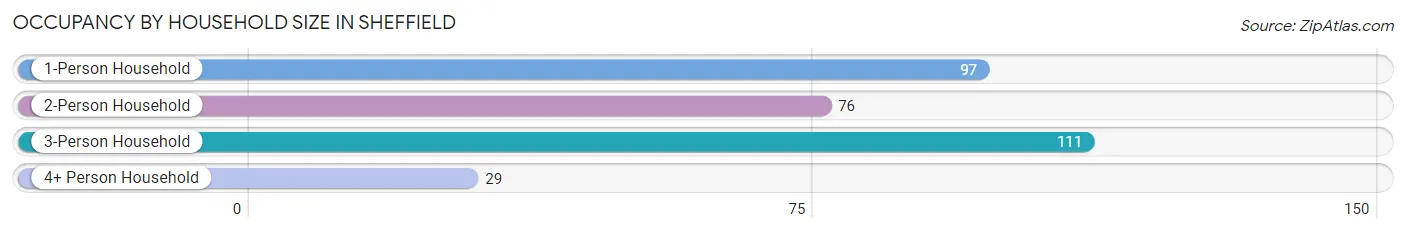
| Household Size | # Housing Units | % Housing Units |
| 1-Person Household | 97 | 31.0% |
| 2-Person Household | 76 | 24.3% |
| 3-Person Household | 111 | 35.5% |
| 4+ Person Household | 29 | 9.3% |
| Total Housing Units | 313 | 100.0% |
Occupancy by Ownership by Household Size in Sheffield
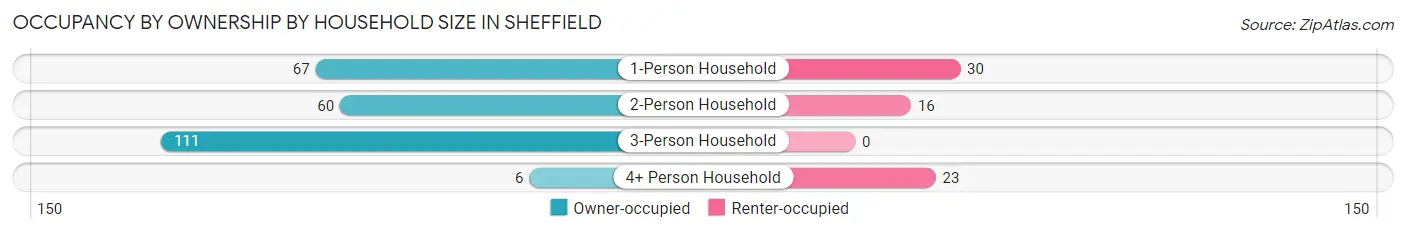
| Household Size | Owner-occupied | Renter-occupied |
| 1-Person Household | 67 (69.1%) | 30 (30.9%) |
| 2-Person Household | 60 (78.9%) | 16 (21.0%) |
| 3-Person Household | 111 (100.0%) | 0 (0.0%) |
| 4+ Person Household | 6 (20.7%) | 23 (79.3%) |
| Total Housing Units | 244 (78.0%) | 69 (22.0%) |
Occupancy by Educational Attainment in Sheffield
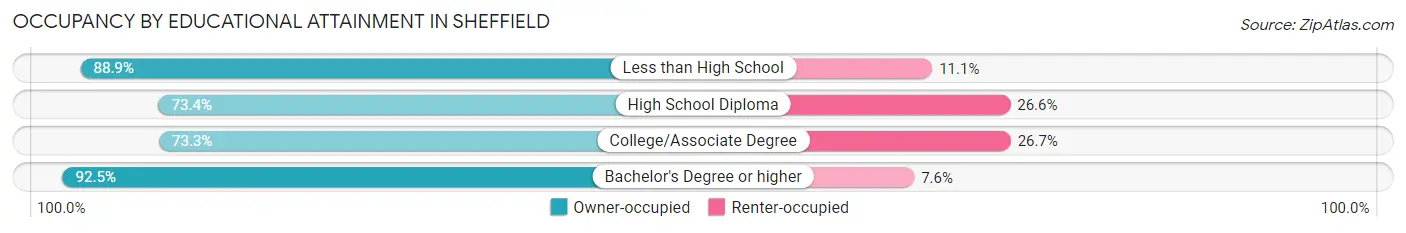
| Household Size | Owner-occupied | Renter-occupied |
| Less than High School | 24 (88.9%) | 3 (11.1%) |
| High School Diploma | 127 (73.4%) | 46 (26.6%) |
| College/Associate Degree | 44 (73.3%) | 16 (26.7%) |
| Bachelor's Degree or higher | 49 (92.4%) | 4 (7.5%) |
Occupancy by Age of Householder in Sheffield
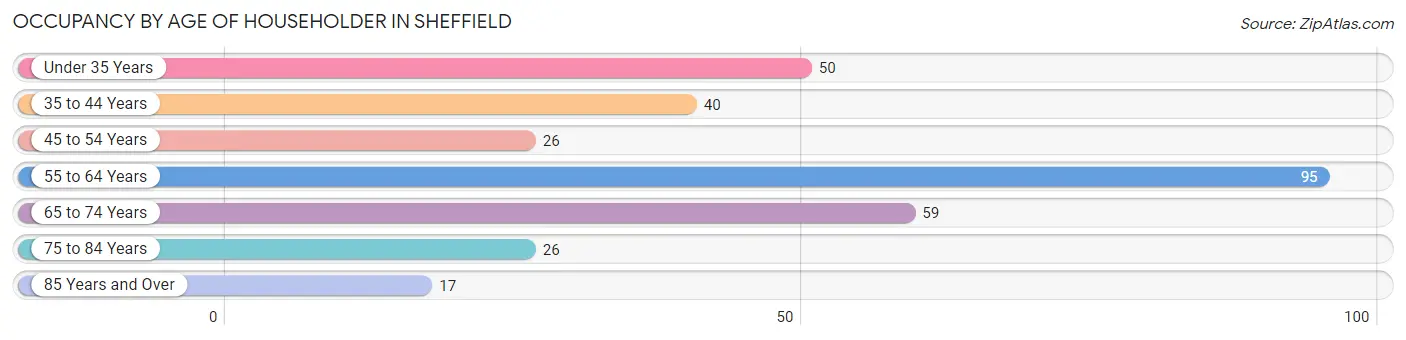
| Age Bracket | # Households | % Households |
| Under 35 Years | 50 | 16.0% |
| 35 to 44 Years | 40 | 12.8% |
| 45 to 54 Years | 26 | 8.3% |
| 55 to 64 Years | 95 | 30.3% |
| 65 to 74 Years | 59 | 18.9% |
| 75 to 84 Years | 26 | 8.3% |
| 85 Years and Over | 17 | 5.4% |
| Total | 313 | 100.0% |
Housing Finances in Sheffield
Median Income by Occupancy in Sheffield
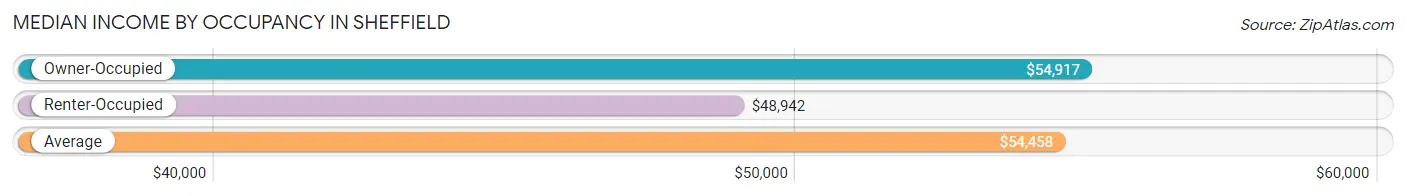
| Occupancy Type | # Households | Median Income |
| Owner-Occupied | 244 (78.0%) | $54,917 |
| Renter-Occupied | 69 (22.0%) | $48,942 |
| Average | 313 (100.0%) | $54,458 |
Occupancy by Householder Income Bracket in Sheffield
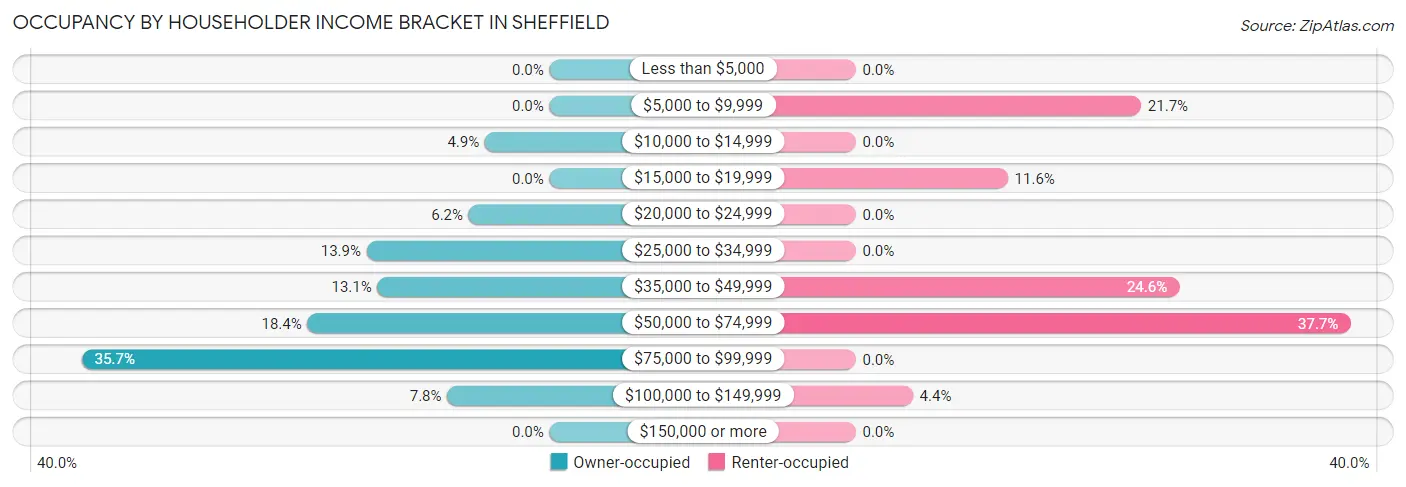
| Income Bracket | Owner-occupied | Renter-occupied |
| Less than $5,000 | 0 (0.0%) | 0 (0.0%) |
| $5,000 to $9,999 | 0 (0.0%) | 15 (21.7%) |
| $10,000 to $14,999 | 12 (4.9%) | 0 (0.0%) |
| $15,000 to $19,999 | 0 (0.0%) | 8 (11.6%) |
| $20,000 to $24,999 | 15 (6.1%) | 0 (0.0%) |
| $25,000 to $34,999 | 34 (13.9%) | 0 (0.0%) |
| $35,000 to $49,999 | 32 (13.1%) | 17 (24.6%) |
| $50,000 to $74,999 | 45 (18.4%) | 26 (37.7%) |
| $75,000 to $99,999 | 87 (35.7%) | 0 (0.0%) |
| $100,000 to $149,999 | 19 (7.8%) | 3 (4.3%) |
| $150,000 or more | 0 (0.0%) | 0 (0.0%) |
| Total | 244 (100.0%) | 69 (100.0%) |
Monthly Housing Cost Tiers in Sheffield
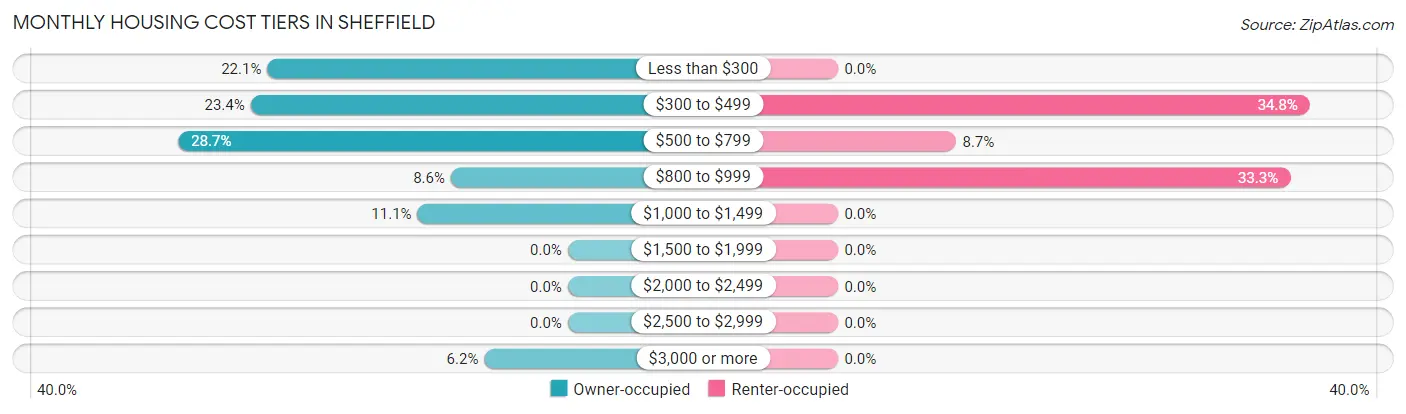
| Monthly Cost | Owner-occupied | Renter-occupied |
| Less than $300 | 54 (22.1%) | 0 (0.0%) |
| $300 to $499 | 57 (23.4%) | 24 (34.8%) |
| $500 to $799 | 70 (28.7%) | 6 (8.7%) |
| $800 to $999 | 21 (8.6%) | 23 (33.3%) |
| $1,000 to $1,499 | 27 (11.1%) | 0 (0.0%) |
| $1,500 to $1,999 | 0 (0.0%) | 0 (0.0%) |
| $2,000 to $2,499 | 0 (0.0%) | 0 (0.0%) |
| $2,500 to $2,999 | 0 (0.0%) | 0 (0.0%) |
| $3,000 or more | 15 (6.1%) | 0 (0.0%) |
| Total | 244 (100.0%) | 69 (100.0%) |
Physical Housing Characteristics in Sheffield
Housing Structures in Sheffield
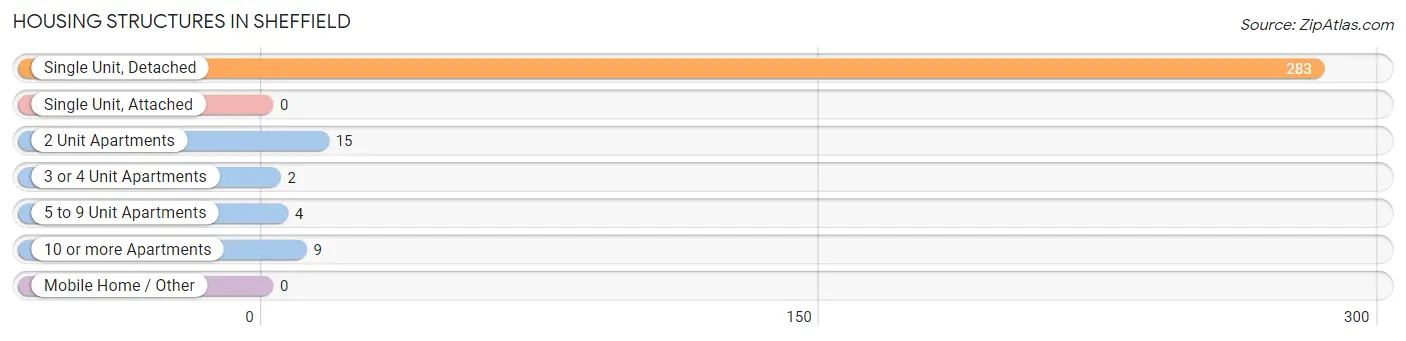
| Structure Type | # Housing Units | % Housing Units |
| Single Unit, Detached | 283 | 90.4% |
| Single Unit, Attached | 0 | 0.0% |
| 2 Unit Apartments | 15 | 4.8% |
| 3 or 4 Unit Apartments | 2 | 0.6% |
| 5 to 9 Unit Apartments | 4 | 1.3% |
| 10 or more Apartments | 9 | 2.9% |
| Mobile Home / Other | 0 | 0.0% |
| Total | 313 | 100.0% |
Housing Structures by Occupancy in Sheffield
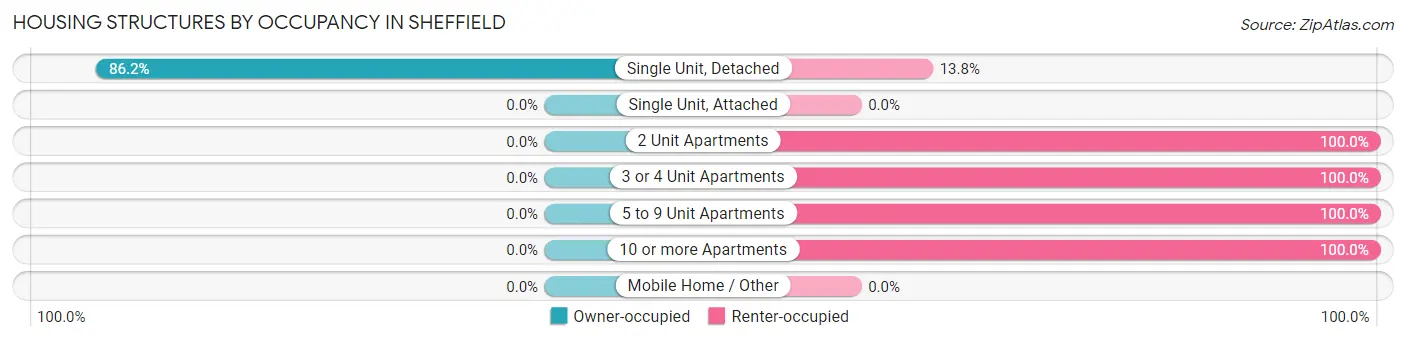
| Structure Type | Owner-occupied | Renter-occupied |
| Single Unit, Detached | 244 (86.2%) | 39 (13.8%) |
| Single Unit, Attached | 0 (0.0%) | 0 (0.0%) |
| 2 Unit Apartments | 0 (0.0%) | 15 (100.0%) |
| 3 or 4 Unit Apartments | 0 (0.0%) | 2 (100.0%) |
| 5 to 9 Unit Apartments | 0 (0.0%) | 4 (100.0%) |
| 10 or more Apartments | 0 (0.0%) | 9 (100.0%) |
| Mobile Home / Other | 0 (0.0%) | 0 (0.0%) |
| Total | 244 (78.0%) | 69 (22.0%) |
Housing Structures by Number of Rooms in Sheffield
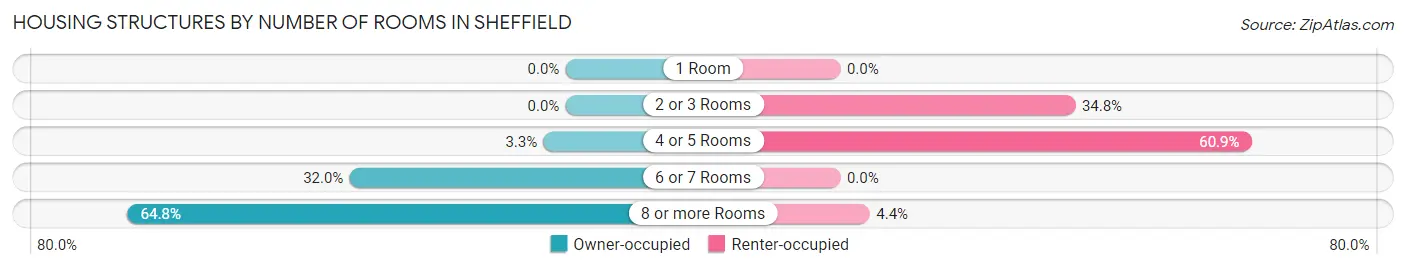
| Number of Rooms | Owner-occupied | Renter-occupied |
| 1 Room | 0 (0.0%) | 0 (0.0%) |
| 2 or 3 Rooms | 0 (0.0%) | 24 (34.8%) |
| 4 or 5 Rooms | 8 (3.3%) | 42 (60.9%) |
| 6 or 7 Rooms | 78 (32.0%) | 0 (0.0%) |
| 8 or more Rooms | 158 (64.7%) | 3 (4.3%) |
| Total | 244 (100.0%) | 69 (100.0%) |
Housing Structure by Heating Type in Sheffield
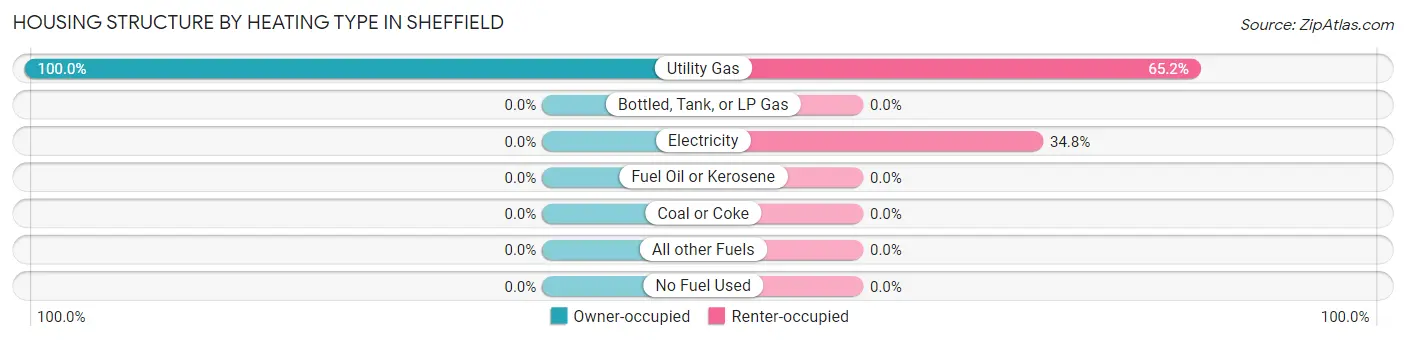
| Heating Type | Owner-occupied | Renter-occupied |
| Utility Gas | 244 (100.0%) | 45 (65.2%) |
| Bottled, Tank, or LP Gas | 0 (0.0%) | 0 (0.0%) |
| Electricity | 0 (0.0%) | 24 (34.8%) |
| Fuel Oil or Kerosene | 0 (0.0%) | 0 (0.0%) |
| Coal or Coke | 0 (0.0%) | 0 (0.0%) |
| All other Fuels | 0 (0.0%) | 0 (0.0%) |
| No Fuel Used | 0 (0.0%) | 0 (0.0%) |
| Total | 244 (100.0%) | 69 (100.0%) |
Household Vehicle Usage in Sheffield
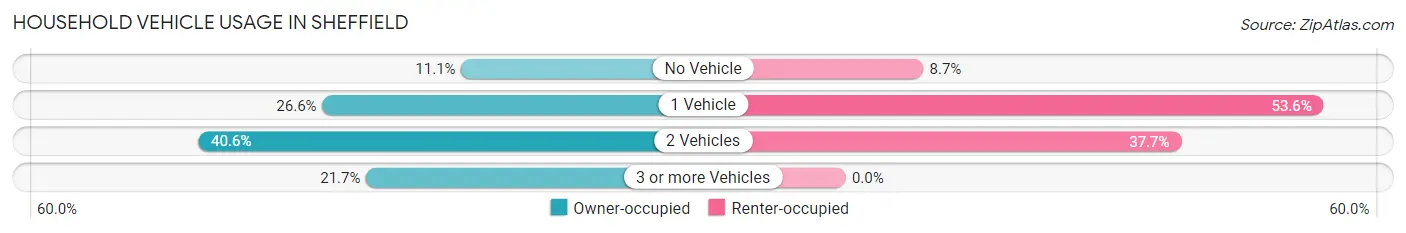
| Vehicles per Household | Owner-occupied | Renter-occupied |
| No Vehicle | 27 (11.1%) | 6 (8.7%) |
| 1 Vehicle | 65 (26.6%) | 37 (53.6%) |
| 2 Vehicles | 99 (40.6%) | 26 (37.7%) |
| 3 or more Vehicles | 53 (21.7%) | 0 (0.0%) |
| Total | 244 (100.0%) | 69 (100.0%) |
Real Estate & Mortgages in Sheffield
Real Estate and Mortgage Overview in Sheffield
| Characteristic | Without Mortgage | With Mortgage |
| Housing Units | 174 | 70 |
| Median Property Value | $131,700 | $156,500 |
| Median Household Income | $53,750 | $0 |
| Monthly Housing Costs | $494 | $15 |
| Real Estate Taxes | $1,096 | $0 |
Property Value by Mortgage Status in Sheffield
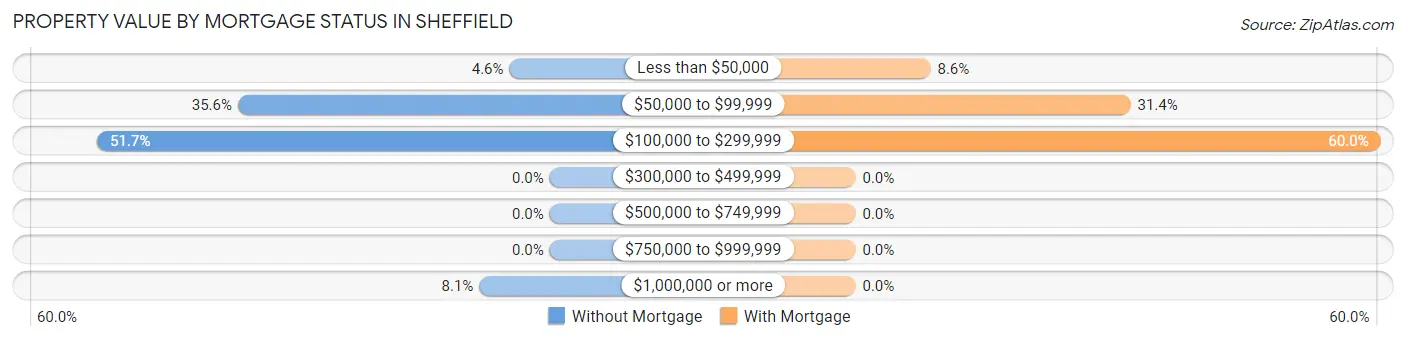
| Property Value | Without Mortgage | With Mortgage |
| Less than $50,000 | 8 (4.6%) | 6 (8.6%) |
| $50,000 to $99,999 | 62 (35.6%) | 22 (31.4%) |
| $100,000 to $299,999 | 90 (51.7%) | 42 (60.0%) |
| $300,000 to $499,999 | 0 (0.0%) | 0 (0.0%) |
| $500,000 to $749,999 | 0 (0.0%) | 0 (0.0%) |
| $750,000 to $999,999 | 0 (0.0%) | 0 (0.0%) |
| $1,000,000 or more | 14 (8.1%) | 0 (0.0%) |
| Total | 174 (100.0%) | 70 (100.0%) |
Household Income by Mortgage Status in Sheffield
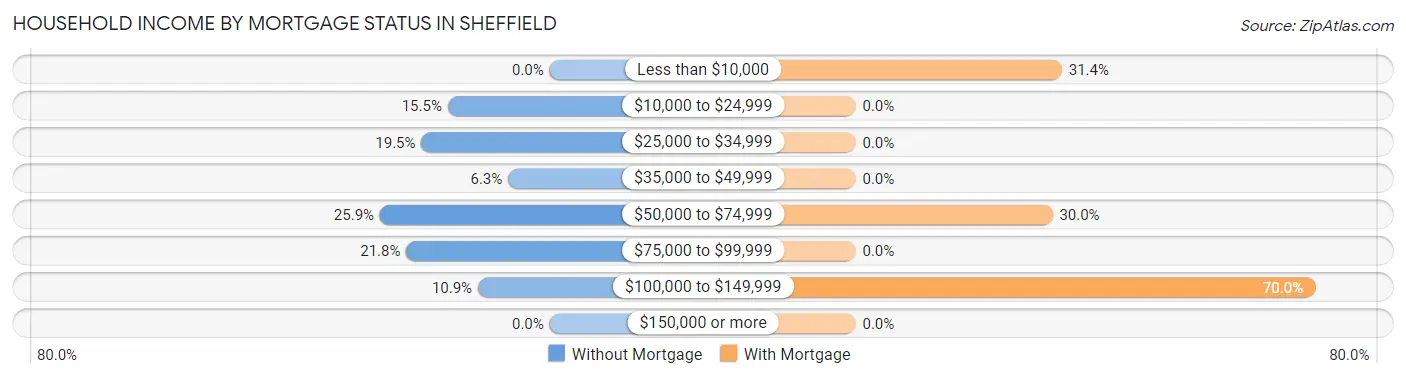
| Household Income | Without Mortgage | With Mortgage |
| Less than $10,000 | 0 (0.0%) | 22 (31.4%) |
| $10,000 to $24,999 | 27 (15.5%) | 0 (0.0%) |
| $25,000 to $34,999 | 34 (19.5%) | 0 (0.0%) |
| $35,000 to $49,999 | 11 (6.3%) | 0 (0.0%) |
| $50,000 to $74,999 | 45 (25.9%) | 21 (30.0%) |
| $75,000 to $99,999 | 38 (21.8%) | 0 (0.0%) |
| $100,000 to $149,999 | 19 (10.9%) | 49 (70.0%) |
| $150,000 or more | 0 (0.0%) | 0 (0.0%) |
| Total | 174 (100.0%) | 70 (100.0%) |
Property Value to Household Income Ratio in Sheffield
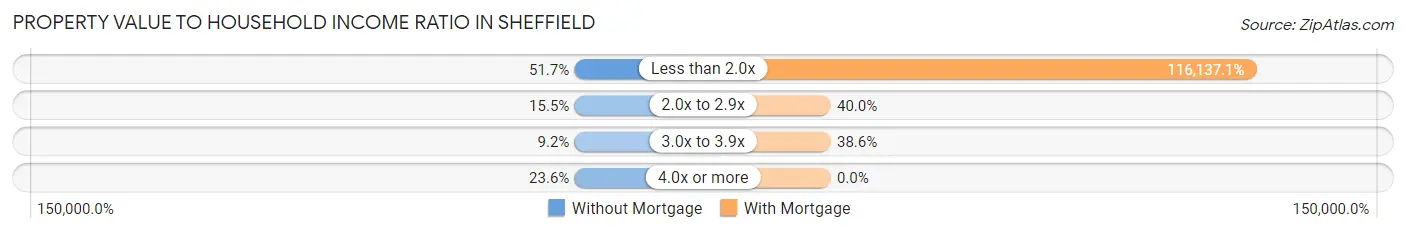
| Value-to-Income Ratio | Without Mortgage | With Mortgage |
| Less than 2.0x | 90 (51.7%) | 81,296 (116,137.1%) |
| 2.0x to 2.9x | 27 (15.5%) | 28 (40.0%) |
| 3.0x to 3.9x | 16 (9.2%) | 27 (38.6%) |
| 4.0x or more | 41 (23.6%) | 0 (0.0%) |
| Total | 174 (100.0%) | 70 (100.0%) |
Real Estate Taxes by Mortgage Status in Sheffield
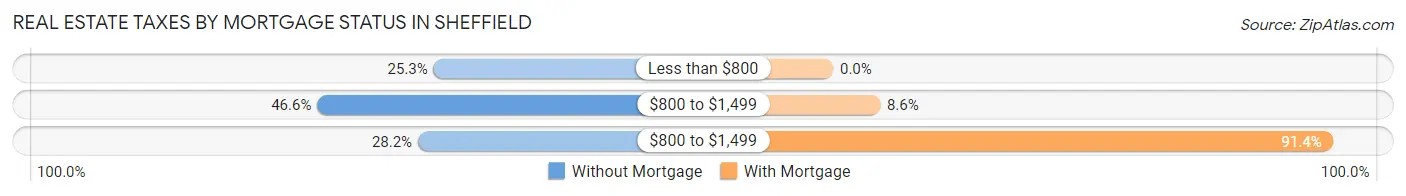
| Property Taxes | Without Mortgage | With Mortgage |
| Less than $800 | 44 (25.3%) | 0 (0.0%) |
| $800 to $1,499 | 81 (46.6%) | 6 (8.6%) |
| $800 to $1,499 | 49 (28.2%) | 64 (91.4%) |
| Total | 174 (100.0%) | 70 (100.0%) |
Health & Disability in Sheffield
Health Insurance Coverage by Age in Sheffield
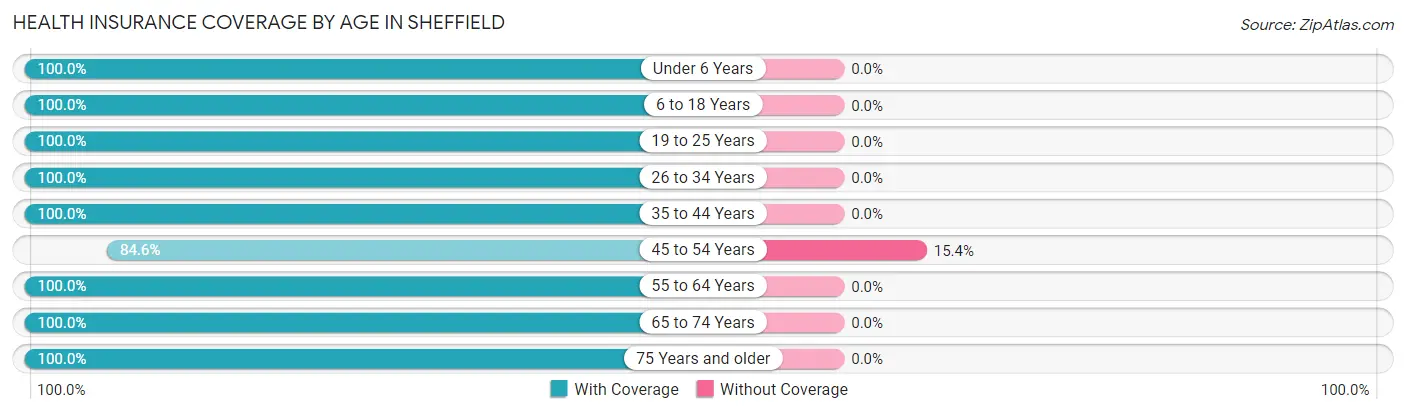
| Age Bracket | With Coverage | Without Coverage |
| Under 6 Years | 35 (100.0%) | 0 (0.0%) |
| 6 to 18 Years | 101 (100.0%) | 0 (0.0%) |
| 19 to 25 Years | 46 (100.0%) | 0 (0.0%) |
| 26 to 34 Years | 126 (100.0%) | 0 (0.0%) |
| 35 to 44 Years | 101 (100.0%) | 0 (0.0%) |
| 45 to 54 Years | 22 (84.6%) | 4 (15.4%) |
| 55 to 64 Years | 126 (100.0%) | 0 (0.0%) |
| 65 to 74 Years | 107 (100.0%) | 0 (0.0%) |
| 75 Years and older | 89 (100.0%) | 0 (0.0%) |
| Total | 753 (99.5%) | 4 (0.5%) |
Health Insurance Coverage by Citizenship Status in Sheffield
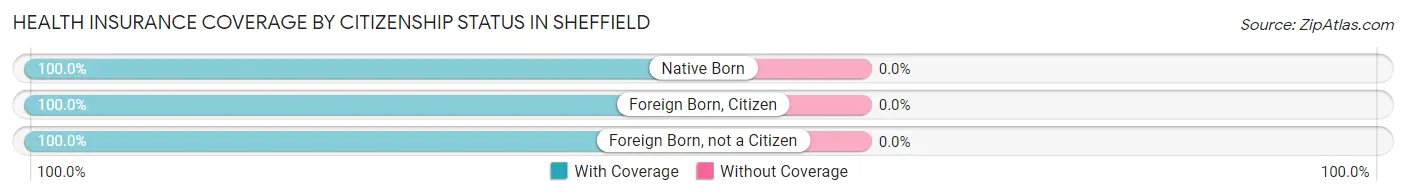
| Citizenship Status | With Coverage | Without Coverage |
| Native Born | 35 (100.0%) | 0 (0.0%) |
| Foreign Born, Citizen | 101 (100.0%) | 0 (0.0%) |
| Foreign Born, not a Citizen | 46 (100.0%) | 0 (0.0%) |
Health Insurance Coverage by Household Income in Sheffield
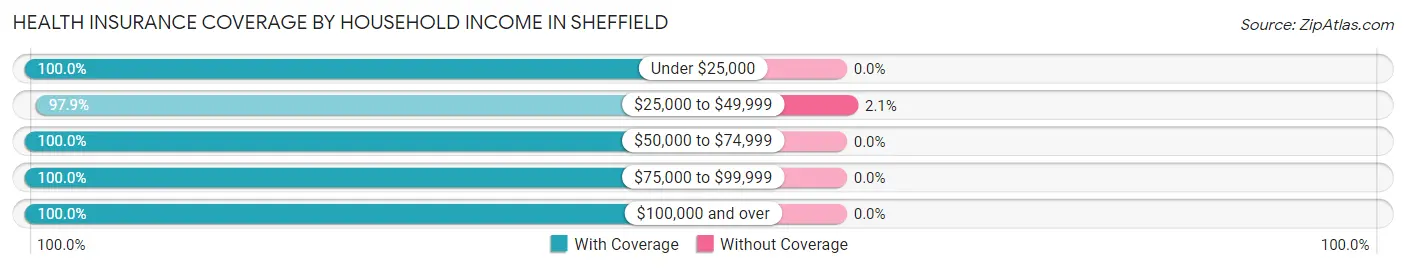
| Household Income | With Coverage | Without Coverage |
| Under $25,000 | 80 (100.0%) | 0 (0.0%) |
| $25,000 to $49,999 | 186 (97.9%) | 4 (2.1%) |
| $50,000 to $74,999 | 206 (100.0%) | 0 (0.0%) |
| $75,000 to $99,999 | 218 (100.0%) | 0 (0.0%) |
| $100,000 and over | 63 (100.0%) | 0 (0.0%) |
Public vs Private Health Insurance Coverage by Age in Sheffield
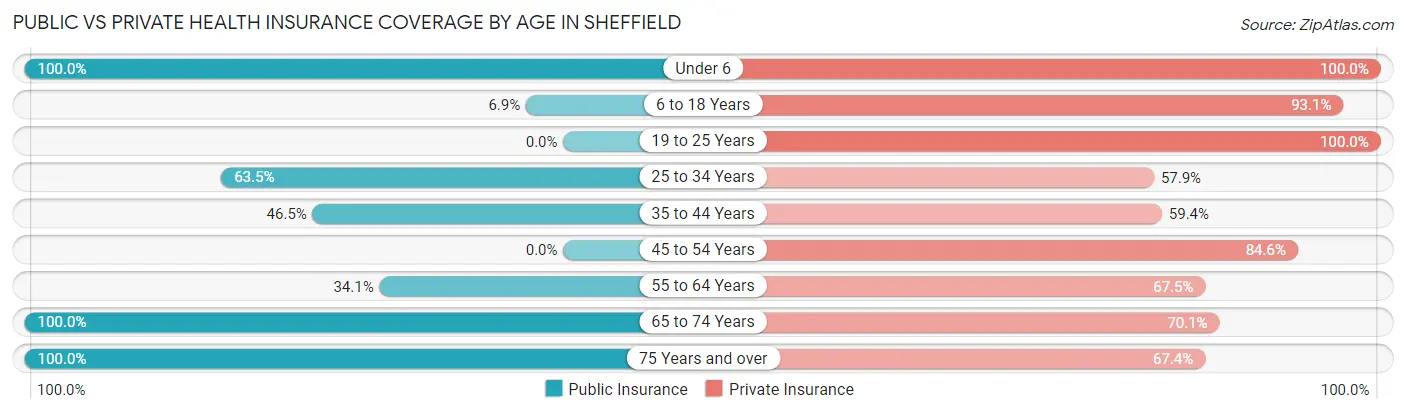
| Age Bracket | Public Insurance | Private Insurance |
| Under 6 | 35 (100.0%) | 35 (100.0%) |
| 6 to 18 Years | 7 (6.9%) | 94 (93.1%) |
| 19 to 25 Years | 0 (0.0%) | 46 (100.0%) |
| 25 to 34 Years | 80 (63.5%) | 73 (57.9%) |
| 35 to 44 Years | 47 (46.5%) | 60 (59.4%) |
| 45 to 54 Years | 0 (0.0%) | 22 (84.6%) |
| 55 to 64 Years | 43 (34.1%) | 85 (67.5%) |
| 65 to 74 Years | 107 (100.0%) | 75 (70.1%) |
| 75 Years and over | 89 (100.0%) | 60 (67.4%) |
| Total | 408 (53.9%) | 550 (72.7%) |
Disability Status by Sex by Age in Sheffield
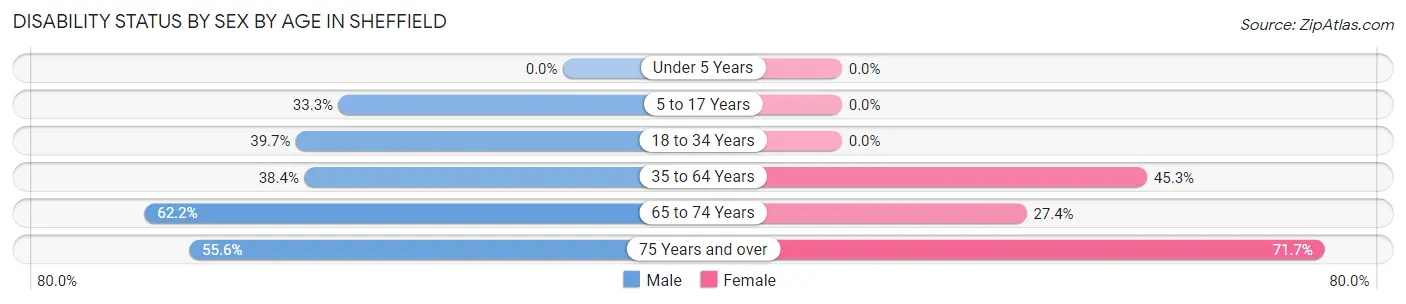
| Age Bracket | Male | Female |
| Under 5 Years | 0 (0.0%) | 0 (0.0%) |
| 5 to 17 Years | 25 (33.3%) | 0 (0.0%) |
| 18 to 34 Years | 46 (39.7%) | 0 (0.0%) |
| 35 to 64 Years | 48 (38.4%) | 58 (45.3%) |
| 65 to 74 Years | 28 (62.2%) | 17 (27.4%) |
| 75 Years and over | 20 (55.6%) | 38 (71.7%) |
Disability Class by Sex by Age in Sheffield
Disability Class: Hearing Difficulty
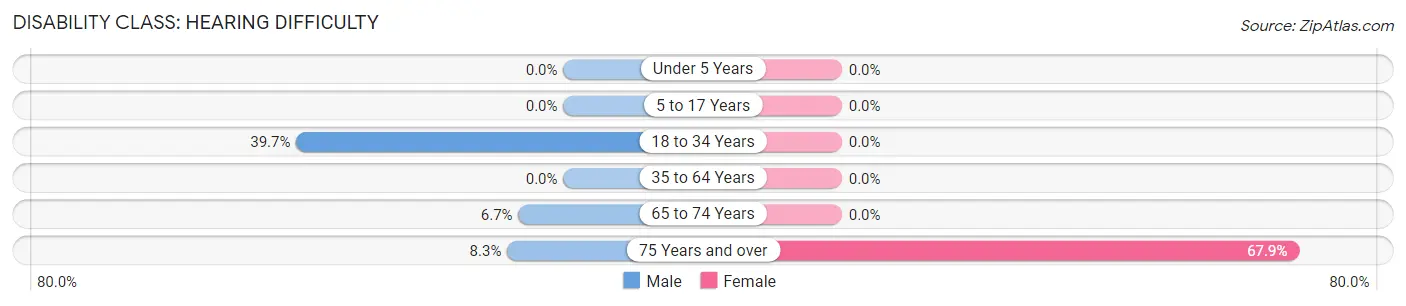
| Age Bracket | Male | Female |
| Under 5 Years | 0 (0.0%) | 0 (0.0%) |
| 5 to 17 Years | 0 (0.0%) | 0 (0.0%) |
| 18 to 34 Years | 46 (39.7%) | 0 (0.0%) |
| 35 to 64 Years | 0 (0.0%) | 0 (0.0%) |
| 65 to 74 Years | 3 (6.7%) | 0 (0.0%) |
| 75 Years and over | 3 (8.3%) | 36 (67.9%) |
Disability Class: Vision Difficulty
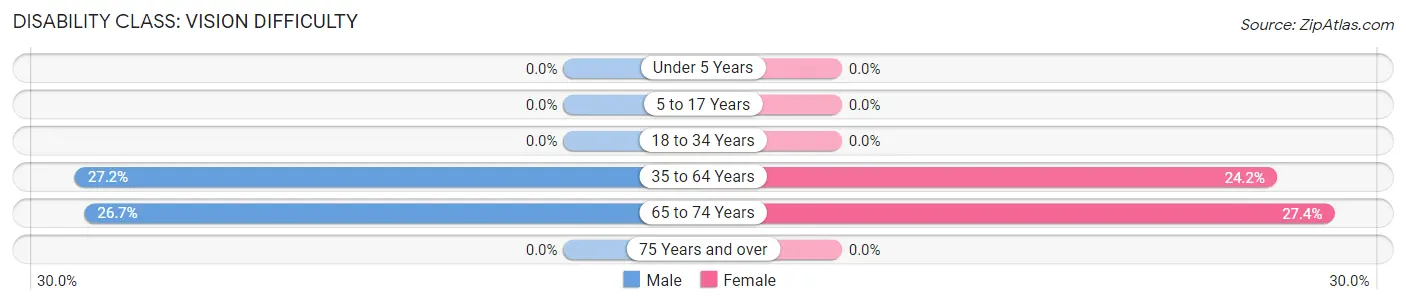
| Age Bracket | Male | Female |
| Under 5 Years | 0 (0.0%) | 0 (0.0%) |
| 5 to 17 Years | 0 (0.0%) | 0 (0.0%) |
| 18 to 34 Years | 0 (0.0%) | 0 (0.0%) |
| 35 to 64 Years | 34 (27.2%) | 31 (24.2%) |
| 65 to 74 Years | 12 (26.7%) | 17 (27.4%) |
| 75 Years and over | 0 (0.0%) | 0 (0.0%) |
Disability Class: Cognitive Difficulty
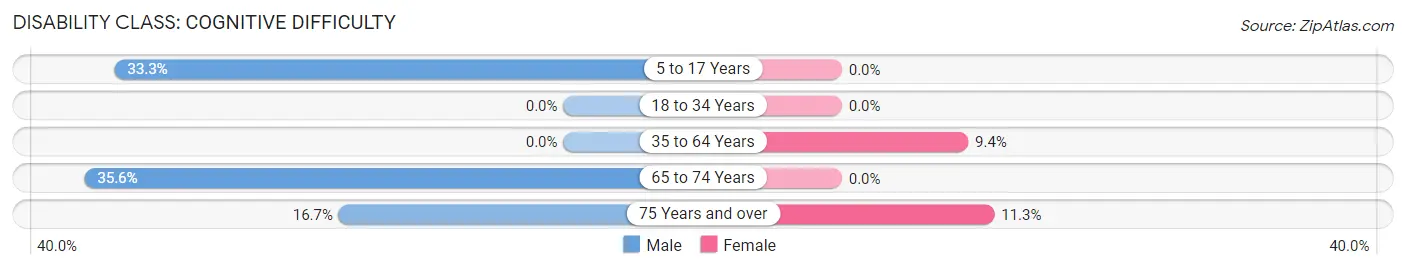
| Age Bracket | Male | Female |
| 5 to 17 Years | 25 (33.3%) | 0 (0.0%) |
| 18 to 34 Years | 0 (0.0%) | 0 (0.0%) |
| 35 to 64 Years | 0 (0.0%) | 12 (9.4%) |
| 65 to 74 Years | 16 (35.6%) | 0 (0.0%) |
| 75 Years and over | 6 (16.7%) | 6 (11.3%) |
Disability Class: Ambulatory Difficulty
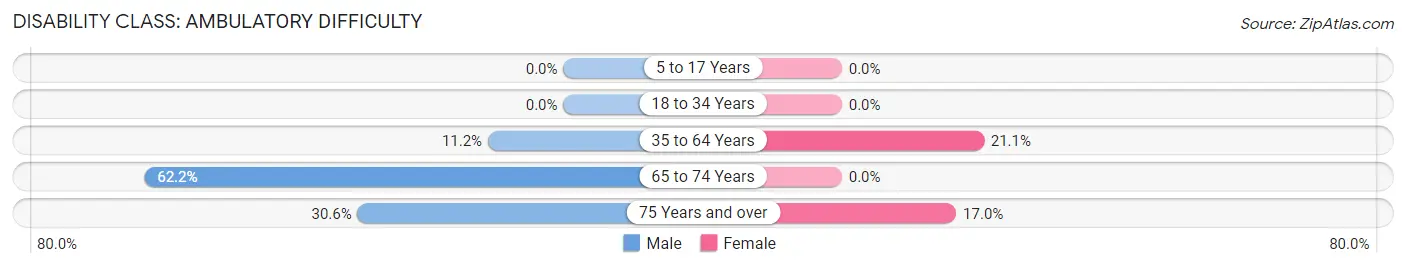
| Age Bracket | Male | Female |
| 5 to 17 Years | 0 (0.0%) | 0 (0.0%) |
| 18 to 34 Years | 0 (0.0%) | 0 (0.0%) |
| 35 to 64 Years | 14 (11.2%) | 27 (21.1%) |
| 65 to 74 Years | 28 (62.2%) | 0 (0.0%) |
| 75 Years and over | 11 (30.6%) | 9 (17.0%) |
Disability Class: Self-Care Difficulty
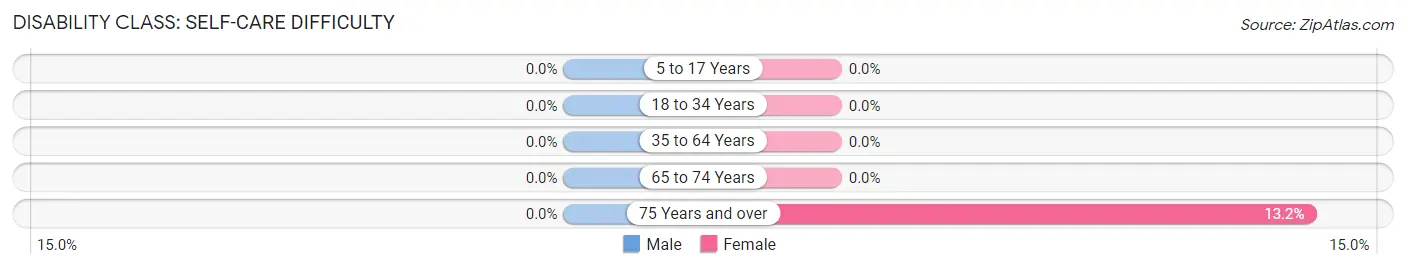
| Age Bracket | Male | Female |
| 5 to 17 Years | 0 (0.0%) | 0 (0.0%) |
| 18 to 34 Years | 0 (0.0%) | 0 (0.0%) |
| 35 to 64 Years | 0 (0.0%) | 0 (0.0%) |
| 65 to 74 Years | 0 (0.0%) | 0 (0.0%) |
| 75 Years and over | 0 (0.0%) | 7 (13.2%) |
Technology Access in Sheffield
Computing Device Access in Sheffield
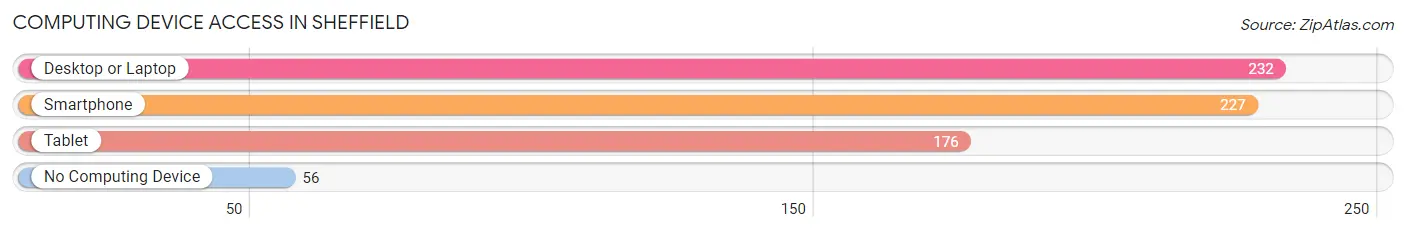
| Device Type | # Households | % Households |
| Desktop or Laptop | 232 | 74.1% |
| Smartphone | 227 | 72.5% |
| Tablet | 176 | 56.2% |
| No Computing Device | 56 | 17.9% |
| Total | 313 | 100.0% |
Internet Access in Sheffield
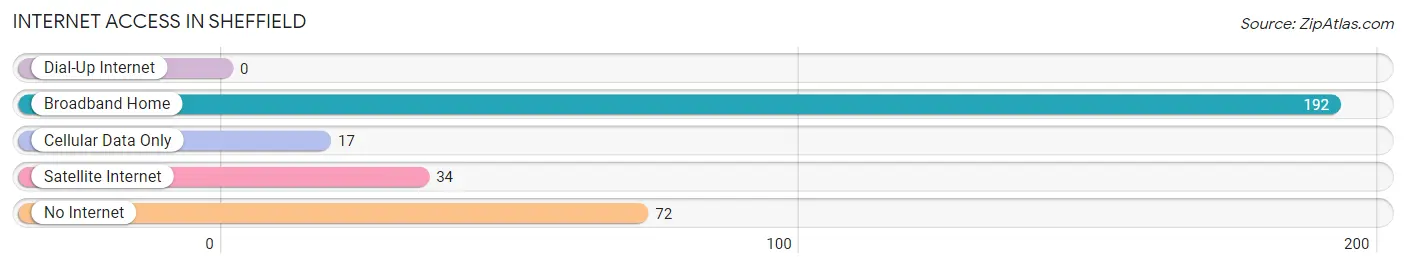
| Internet Type | # Households | % Households |
| Dial-Up Internet | 0 | 0.0% |
| Broadband Home | 192 | 61.3% |
| Cellular Data Only | 17 | 5.4% |
| Satellite Internet | 34 | 10.9% |
| No Internet | 72 | 23.0% |
| Total | 313 | 100.0% |
Sheffield Summary
Sheffield, Pennsylvania is a small borough located in Warren County, Pennsylvania. It is situated in the northwestern corner of the state, near the border of New York. The population of Sheffield was 1,845 as of the 2010 census.
History
The area that is now Sheffield was first settled in the late 1700s by a group of settlers from Connecticut. The town was originally known as "Sheffieldtown" and was incorporated in 1845. The town was named after Sheffield, England, which was the hometown of one of the original settlers.
The town was an important stop on the Underground Railroad, with many of the town's residents helping to hide and transport escaped slaves. The town was also home to a number of prominent abolitionists, including William Lloyd Garrison and Harriet Tubman.
Geography
Sheffield is located in the northwestern corner of Pennsylvania, near the border of New York. It is situated in the Allegheny Mountains, and is surrounded by the Allegheny National Forest. The town is located on the Allegheny River, and is approximately 30 miles from the city of Erie.
The town has a total area of 1.2 square miles, all of which is land. The town is located at an elevation of 1,845 feet above sea level.
Economy
The economy of Sheffield is largely based on tourism and outdoor recreation. The town is home to a number of popular attractions, including the Allegheny National Forest, the Allegheny River, and the Sheffield Historical Society.
The town is also home to a number of small businesses, including restaurants, shops, and lodging. The town is also home to a number of manufacturing companies, including a paper mill and a furniture factory.
Demographics
As of the 2010 census, the population of Sheffield was 1,845. The racial makeup of the town was 97.3% White, 0.7% African American, 0.2% Native American, 0.2% Asian, 0.2% from other races, and 1.4% from two or more races. Hispanic or Latino of any race were 0.7% of the population.
The median income for a household in the town was $37,500, and the median income for a family was $45,000. The per capita income for the town was $19,000. About 11.3% of families and 14.2% of the population were below the poverty line, including 18.2% of those under age 18 and 8.3% of those age 65 or over.
Common Questions
What is Per Capita Income in Sheffield?
Per Capita income in Sheffield is $25,063.
What is the Median Family Income in Sheffield?
Median Family Income in Sheffield is $63,152.
What is the Median Household income in Sheffield?
Median Household Income in Sheffield is $54,458.
What is Inequality or Gini Index in Sheffield?
Inequality or Gini Index in Sheffield is 0.30.
What is the Total Population of Sheffield?
Total Population of Sheffield is 757.
What is the Total Male Population of Sheffield?
Total Male Population of Sheffield is 397.
What is the Total Female Population of Sheffield?
Total Female Population of Sheffield is 360.
What is the Ratio of Males per 100 Females in Sheffield?
There are 110.28 Males per 100 Females in Sheffield.
What is the Ratio of Females per 100 Males in Sheffield?
There are 90.68 Females per 100 Males in Sheffield.
What is the Median Population Age in Sheffield?
Median Population Age in Sheffield is 43.4 Years.
What is the Average Family Size in Sheffield
Average Family Size in Sheffield is 3.0 People.
What is the Average Household Size in Sheffield
Average Household Size in Sheffield is 2.4 People.
How Large is the Labor Force in Sheffield?
There are 338 People in the Labor Forcein in Sheffield.
What is the Percentage of People in the Labor Force in Sheffield?
54.4% of People are in the Labor Force in Sheffield.