Russell, PA Map & Demographics
Russell Map
Russell Overview
$46,901
PER CAPITA INCOME
$107,500
AVG FAMILY INCOME
$97,375
AVG HOUSEHOLD INCOME
21.2%
WAGE / INCOME GAP [ % ]
78.8¢/ $1
WAGE / INCOME GAP [ $ ]
0.44
INEQUALITY / GINI INDEX
1,342
TOTAL POPULATION
711
MALE POPULATION
631
FEMALE POPULATION
112.68
MALES / 100 FEMALES
88.75
FEMALES / 100 MALES
49.5
MEDIAN AGE
3.0
AVG FAMILY SIZE
2.5
AVG HOUSEHOLD SIZE
720
LABOR FORCE [ PEOPLE ]
63.5%
PERCENT IN LABOR FORCE
4.6%
UNEMPLOYMENT RATE
Russell Zip Codes
Russell Area Codes
Income in Russell
Income Overview in Russell
Per Capita Income in Russell is $46,901, while median incomes of families and households are $107,500 and $97,375 respectively.
| Characteristic | Number | Measure |
| Per Capita Income | 1,342 | $46,901 |
| Median Family Income | 376 | $107,500 |
| Mean Family Income | 376 | $142,372 |
| Median Household Income | 545 | $97,375 |
| Mean Household Income | 545 | $114,288 |
| Income Deficit | 376 | $0 |
| Wage / Income Gap (%) | 1,342 | 21.23% |
| Wage / Income Gap ($) | 1,342 | 78.77¢ per $1 |
| Gini / Inequality Index | 1,342 | 0.44 |
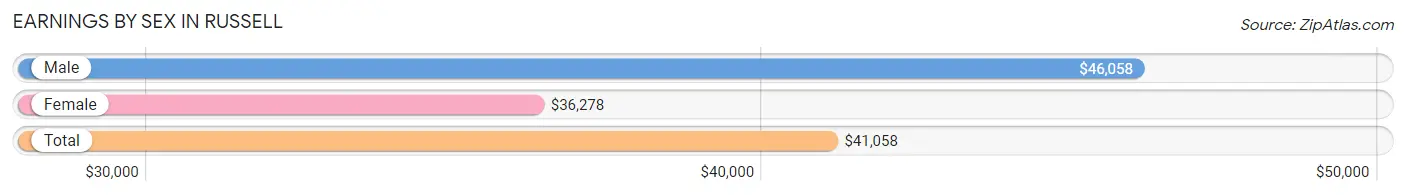
Earnings by Sex in Russell
Average Earnings in Russell are $41,058, $46,058 for men and $36,278 for women, a difference of 21.2%.
| Sex | Number | Average Earnings |
| Male | 405 (54.9%) | $46,058 |
| Female | 332 (45.1%) | $36,278 |
| Total | 737 (100.0%) | $41,058 |
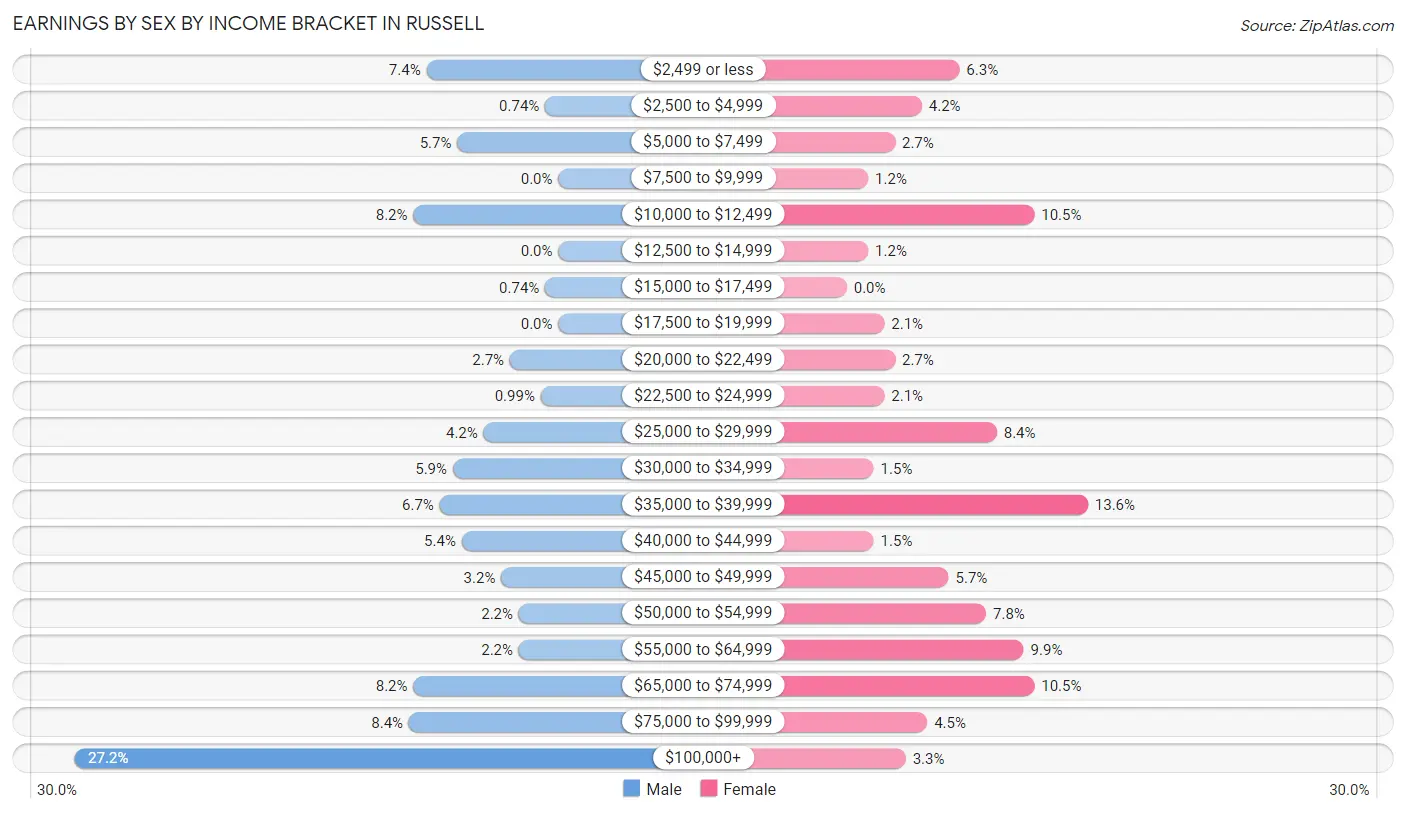
Earnings by Sex by Income Bracket in Russell
The most common earnings brackets in Russell are $100,000+ for men (110 | 27.2%) and $35,000 to $39,999 for women (45 | 13.6%).
| Income | Male | Female |
| $2,499 or less | 30 (7.4%) | 21 (6.3%) |
| $2,500 to $4,999 | 3 (0.7%) | 14 (4.2%) |
| $5,000 to $7,499 | 23 (5.7%) | 9 (2.7%) |
| $7,500 to $9,999 | 0 (0.0%) | 4 (1.2%) |
| $10,000 to $12,499 | 33 (8.2%) | 35 (10.5%) |
| $12,500 to $14,999 | 0 (0.0%) | 4 (1.2%) |
| $15,000 to $17,499 | 3 (0.7%) | 0 (0.0%) |
| $17,500 to $19,999 | 0 (0.0%) | 7 (2.1%) |
| $20,000 to $22,499 | 11 (2.7%) | 9 (2.7%) |
| $22,500 to $24,999 | 4 (1.0%) | 7 (2.1%) |
| $25,000 to $29,999 | 17 (4.2%) | 28 (8.4%) |
| $30,000 to $34,999 | 24 (5.9%) | 5 (1.5%) |
| $35,000 to $39,999 | 27 (6.7%) | 45 (13.6%) |
| $40,000 to $44,999 | 22 (5.4%) | 5 (1.5%) |
| $45,000 to $49,999 | 13 (3.2%) | 19 (5.7%) |
| $50,000 to $54,999 | 9 (2.2%) | 26 (7.8%) |
| $55,000 to $64,999 | 9 (2.2%) | 33 (9.9%) |
| $65,000 to $74,999 | 33 (8.2%) | 35 (10.5%) |
| $75,000 to $99,999 | 34 (8.4%) | 15 (4.5%) |
| $100,000+ | 110 (27.2%) | 11 (3.3%) |
| Total | 405 (100.0%) | 332 (100.0%) |
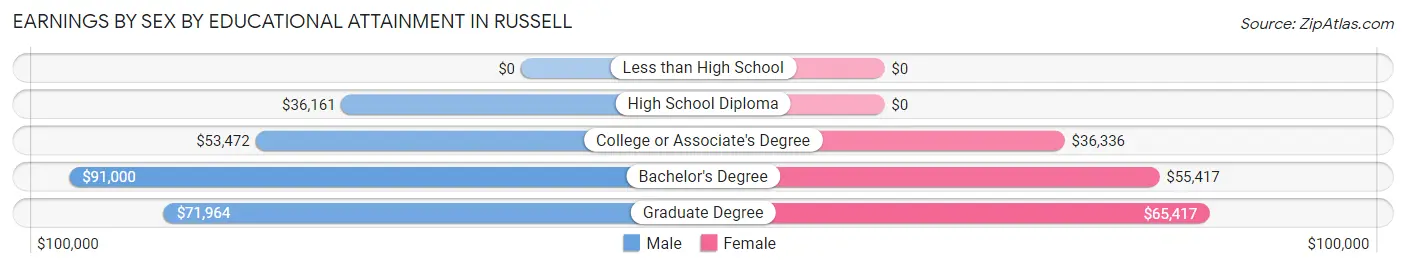
Earnings by Sex by Educational Attainment in Russell
Average earnings in Russell are $55,833 for men and $37,306 for women, a difference of 33.2%. Men with an educational attainment of bachelor's degree enjoy the highest average annual earnings of $91,000, while those with high school diploma education earn the least with $36,161. Women with an educational attainment of graduate degree earn the most with the average annual earnings of $65,417, while those with college or associate's degree education have the smallest earnings of $36,336.
| Educational Attainment | Male Income | Female Income |
| Less than High School | - | - |
| High School Diploma | $36,161 | $0 |
| College or Associate's Degree | $53,472 | $36,336 |
| Bachelor's Degree | $91,000 | $55,417 |
| Graduate Degree | $71,964 | $65,417 |
| Total | $55,833 | $37,306 |
Family Income in Russell
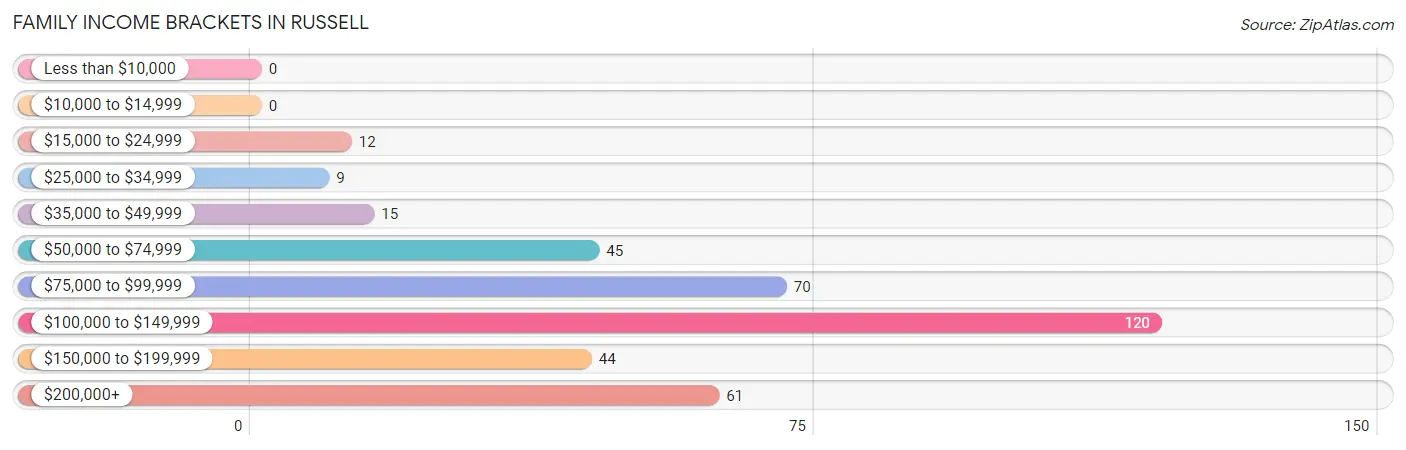
Family Income Brackets in Russell
According to the Russell family income data, there are 120 families falling into the $100,000 to $149,999 income range, which is the most common income bracket and makes up 31.9% of all families.
| Income Bracket | # Families | % Families |
| Less than $10,000 | 0 | 0.0% |
| $10,000 to $14,999 | 0 | 0.0% |
| $15,000 to $24,999 | 12 | 3.2% |
| $25,000 to $34,999 | 9 | 2.4% |
| $35,000 to $49,999 | 15 | 4.0% |
| $50,000 to $74,999 | 45 | 12.0% |
| $75,000 to $99,999 | 70 | 18.6% |
| $100,000 to $149,999 | 120 | 31.9% |
| $150,000 to $199,999 | 44 | 11.7% |
| $200,000+ | 61 | 16.2% |
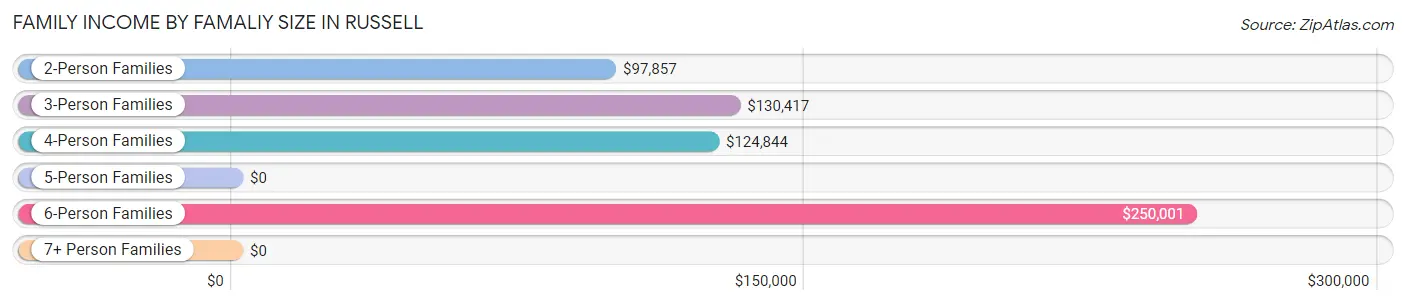
Family Income by Famaliy Size in Russell
6-person families (20 | 5.3%) account for the highest median family income in Russell with $250,001 per family, while 2-person families (224 | 59.6%) have the highest median income of $48,928 per family member.
| Income Bracket | # Families | Median Income |
| 2-Person Families | 224 (59.6%) | $97,857 |
| 3-Person Families | 67 (17.8%) | $130,417 |
| 4-Person Families | 45 (12.0%) | $124,844 |
| 5-Person Families | 20 (5.3%) | $0 |
| 6-Person Families | 20 (5.3%) | $250,001 |
| 7+ Person Families | 0 (0.0%) | $0 |
| Total | 376 (100.0%) | $107,500 |
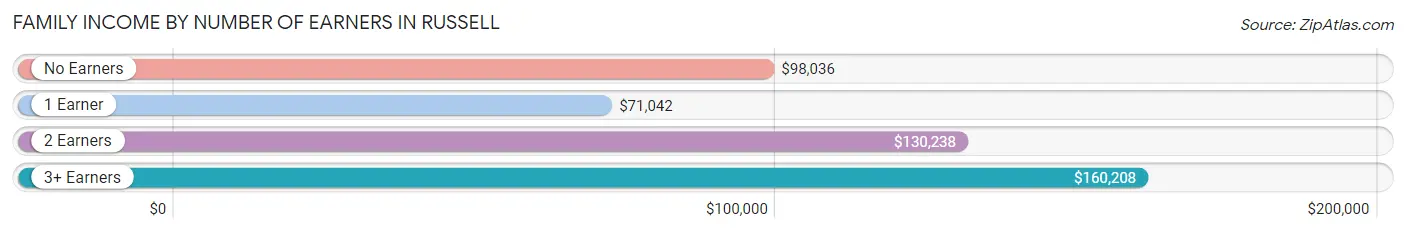
Family Income by Number of Earners in Russell
The median family income in Russell is $107,500, with families comprising 3+ earners (41) having the highest median family income of $160,208, while families with 1 earner (85) have the lowest median family income of $71,042, accounting for 10.9% and 22.6% of families, respectively.
| Number of Earners | # Families | Median Income |
| No Earners | 68 (18.1%) | $98,036 |
| 1 Earner | 85 (22.6%) | $71,042 |
| 2 Earners | 182 (48.4%) | $130,238 |
| 3+ Earners | 41 (10.9%) | $160,208 |
| Total | 376 (100.0%) | $107,500 |
Household Income in Russell
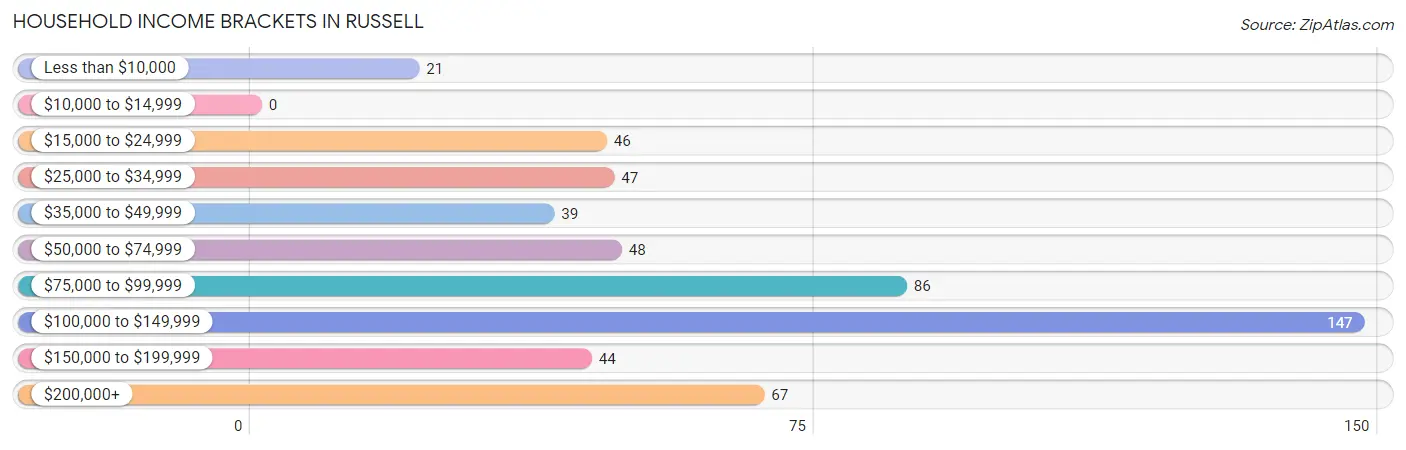
Household Income Brackets in Russell
With 147 households falling in the category, the $100,000 to $149,999 income range is the most frequent in Russell, accounting for 27.0% of all households.
| Income Bracket | # Households | % Households |
| Less than $10,000 | 21 | 3.9% |
| $10,000 to $14,999 | 0 | 0.0% |
| $15,000 to $24,999 | 46 | 8.4% |
| $25,000 to $34,999 | 47 | 8.6% |
| $35,000 to $49,999 | 39 | 7.2% |
| $50,000 to $74,999 | 48 | 8.8% |
| $75,000 to $99,999 | 86 | 15.8% |
| $100,000 to $149,999 | 147 | 27.0% |
| $150,000 to $199,999 | 44 | 8.1% |
| $200,000+ | 67 | 12.3% |
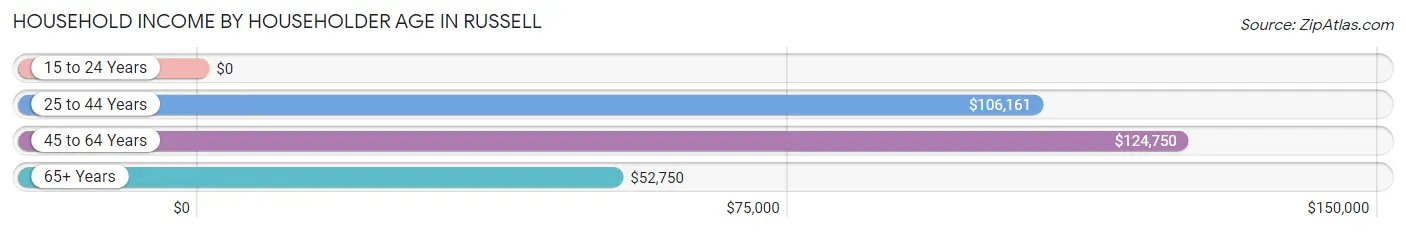
Household Income by Householder Age in Russell
The median household income in Russell is $97,375, with the highest median household income of $124,750 found in the 45 to 64 years age bracket for the primary householder. A total of 221 households (40.6%) fall into this category.
| Income Bracket | # Households | Median Income |
| 15 to 24 Years | 0 (0.0%) | $0 |
| 25 to 44 Years | 117 (21.5%) | $106,161 |
| 45 to 64 Years | 221 (40.6%) | $124,750 |
| 65+ Years | 207 (38.0%) | $52,750 |
| Total | 545 (100.0%) | $97,375 |
Poverty in Russell
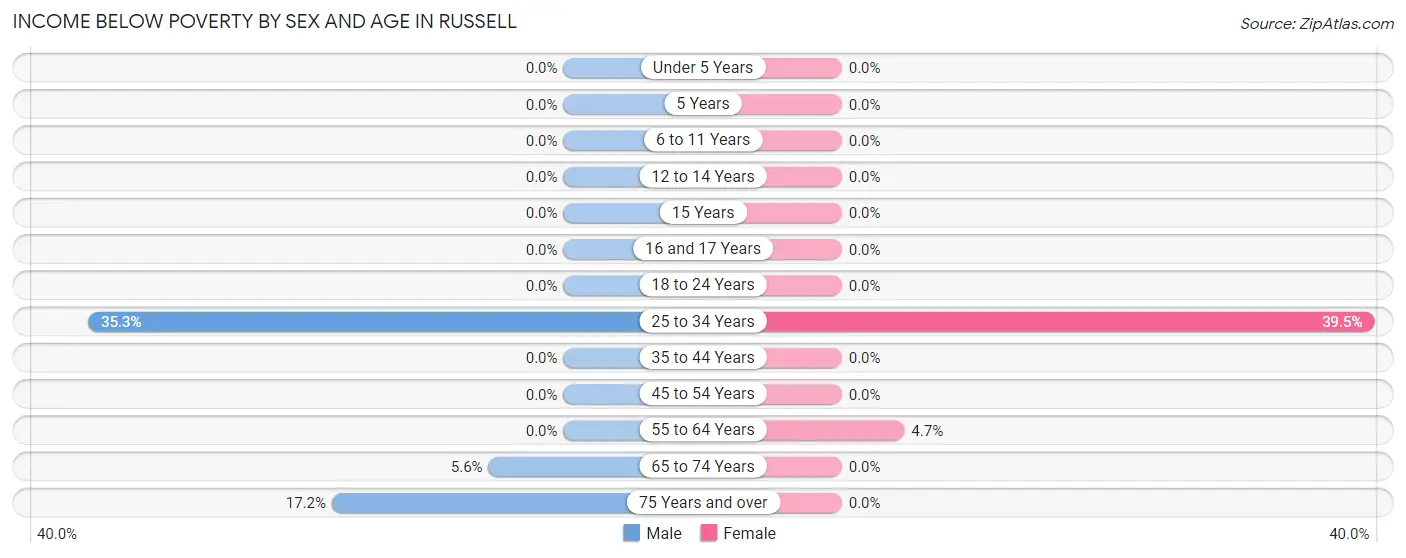
Income Below Poverty by Sex and Age in Russell
With 5.1% poverty level for males and 3.3% for females among the residents of Russell, 25 to 34 year old males and 25 to 34 year old females are the most vulnerable to poverty, with 18 males (35.3%) and 17 females (39.5%) in their respective age groups living below the poverty level.
| Age Bracket | Male | Female |
| Under 5 Years | 0 (0.0%) | 0 (0.0%) |
| 5 Years | 0 (0.0%) | 0 (0.0%) |
| 6 to 11 Years | 0 (0.0%) | 0 (0.0%) |
| 12 to 14 Years | 0 (0.0%) | 0 (0.0%) |
| 15 Years | 0 (0.0%) | 0 (0.0%) |
| 16 and 17 Years | 0 (0.0%) | 0 (0.0%) |
| 18 to 24 Years | 0 (0.0%) | 0 (0.0%) |
| 25 to 34 Years | 18 (35.3%) | 17 (39.5%) |
| 35 to 44 Years | 0 (0.0%) | 0 (0.0%) |
| 45 to 54 Years | 0 (0.0%) | 0 (0.0%) |
| 55 to 64 Years | 0 (0.0%) | 4 (4.6%) |
| 65 to 74 Years | 6 (5.6%) | 0 (0.0%) |
| 75 Years and over | 11 (17.2%) | 0 (0.0%) |
| Total | 35 (5.1%) | 21 (3.3%) |
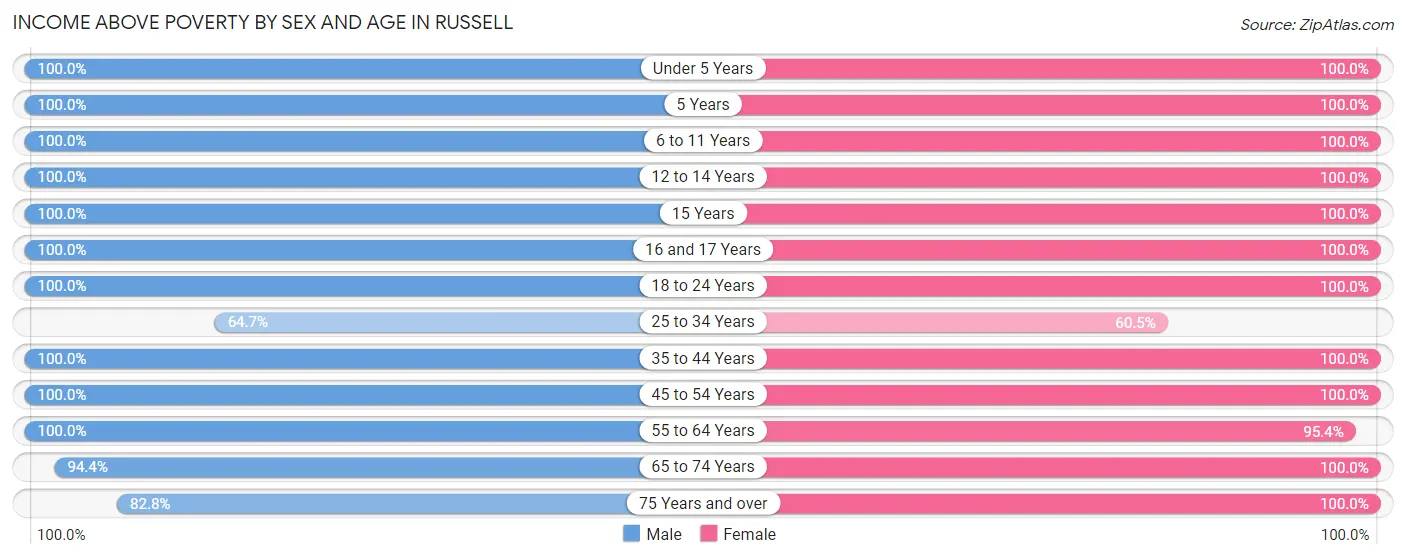
Income Above Poverty by Sex and Age in Russell
According to the poverty statistics in Russell, males aged under 5 years and females aged under 5 years are the age groups that are most secure financially, with 100.0% of males and 100.0% of females in these age groups living above the poverty line.
| Age Bracket | Male | Female |
| Under 5 Years | 14 (100.0%) | 19 (100.0%) |
| 5 Years | 6 (100.0%) | 9 (100.0%) |
| 6 to 11 Years | 39 (100.0%) | 39 (100.0%) |
| 12 to 14 Years | 12 (100.0%) | 40 (100.0%) |
| 15 Years | 6 (100.0%) | 4 (100.0%) |
| 16 and 17 Years | 6 (100.0%) | 28 (100.0%) |
| 18 to 24 Years | 63 (100.0%) | 28 (100.0%) |
| 25 to 34 Years | 33 (64.7%) | 26 (60.5%) |
| 35 to 44 Years | 76 (100.0%) | 73 (100.0%) |
| 45 to 54 Years | 161 (100.0%) | 90 (100.0%) |
| 55 to 64 Years | 85 (100.0%) | 82 (95.4%) |
| 65 to 74 Years | 102 (94.4%) | 126 (100.0%) |
| 75 Years and over | 53 (82.8%) | 46 (100.0%) |
| Total | 656 (94.9%) | 610 (96.7%) |
Income Below Poverty Among Married-Couple Families in Russell
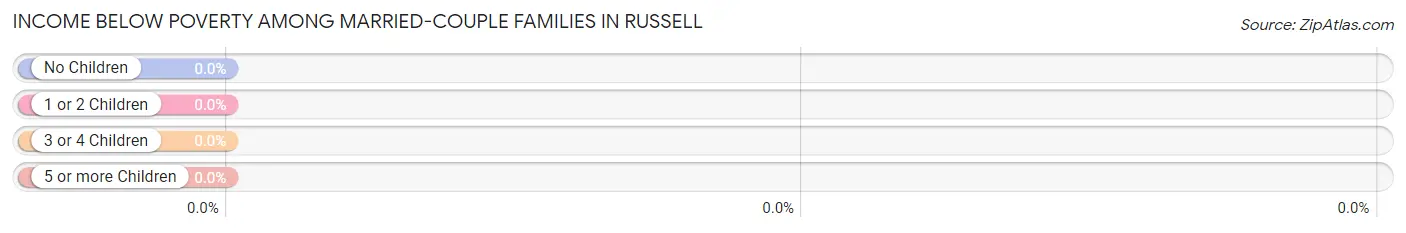
| Children | Above Poverty | Below Poverty |
| No Children | 261 (100.0%) | 0 (0.0%) |
| 1 or 2 Children | 69 (100.0%) | 0 (0.0%) |
| 3 or 4 Children | 21 (100.0%) | 0 (0.0%) |
| 5 or more Children | 0 (0.0%) | 0 (0.0%) |
| Total | 351 (100.0%) | 0 (0.0%) |
Income Below Poverty Among Single-Parent Households in Russell
| Children | Single Father | Single Mother |
| No Children | 0 (0.0%) | 0 (0.0%) |
| 1 or 2 Children | 0 (0.0%) | 0 (0.0%) |
| 3 or 4 Children | 0 (0.0%) | 0 (0.0%) |
| 5 or more Children | 0 (0.0%) | 0 (0.0%) |
| Total | 0 (0.0%) | 0 (0.0%) |
Income Below Poverty Among Married-Couple vs Single-Parent Households in Russell
| Children | Married-Couple Families | Single-Parent Households |
| No Children | 0 (0.0%) | 0 (0.0%) |
| 1 or 2 Children | 0 (0.0%) | 0 (0.0%) |
| 3 or 4 Children | 0 (0.0%) | 0 (0.0%) |
| 5 or more Children | 0 (0.0%) | 0 (0.0%) |
| Total | 0 (0.0%) | 0 (0.0%) |
Race in Russell
The most populous races in Russell are White / Caucasian (1,269 | 94.6%), Asian (29 | 2.2%), and Some other Race (28 | 2.1%).
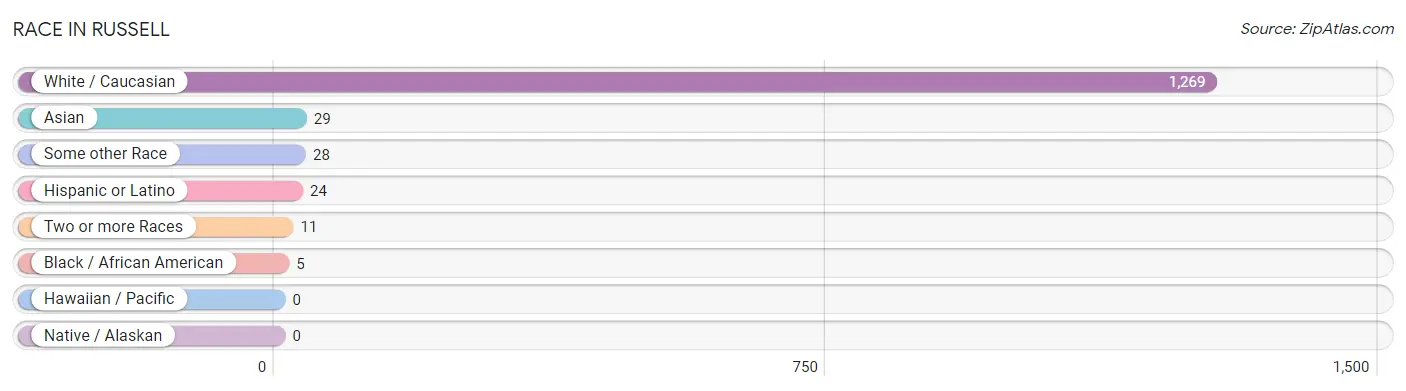
| Race | # Population | % Population |
| Asian | 29 | 2.2% |
| Black / African American | 5 | 0.4% |
| Hawaiian / Pacific | 0 | 0.0% |
| Hispanic or Latino | 24 | 1.8% |
| Native / Alaskan | 0 | 0.0% |
| White / Caucasian | 1,269 | 94.6% |
| Two or more Races | 11 | 0.8% |
| Some other Race | 28 | 2.1% |
| Total | 1,342 | 100.0% |
Ancestry in Russell
The most populous ancestries reported in Russell are German (434 | 32.3%), English (221 | 16.5%), Irish (201 | 15.0%), Swedish (110 | 8.2%), and American (101 | 7.5%), together accounting for 79.5% of all Russell residents.
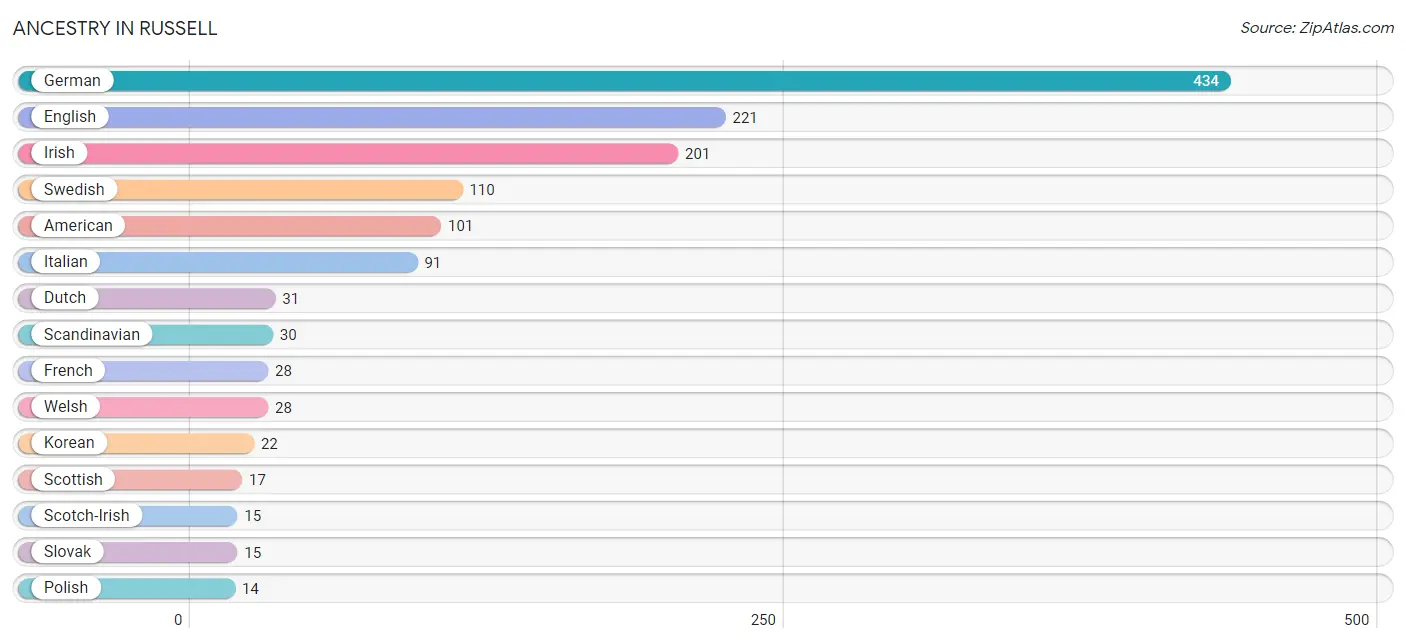
| Ancestry | # Population | % Population |
| American | 101 | 7.5% |
| British | 6 | 0.4% |
| Burmese | 7 | 0.5% |
| Colombian | 13 | 1.0% |
| Danish | 3 | 0.2% |
| Dutch | 31 | 2.3% |
| Eastern European | 3 | 0.2% |
| English | 221 | 16.5% |
| European | 11 | 0.8% |
| French | 28 | 2.1% |
| German | 434 | 32.3% |
| Hungarian | 3 | 0.2% |
| Irish | 201 | 15.0% |
| Italian | 91 | 6.8% |
| Korean | 22 | 1.6% |
| Mexican | 11 | 0.8% |
| Norwegian | 6 | 0.4% |
| Polish | 14 | 1.0% |
| Russian | 6 | 0.4% |
| Scandinavian | 30 | 2.2% |
| Scotch-Irish | 15 | 1.1% |
| Scottish | 17 | 1.3% |
| Slovak | 15 | 1.1% |
| South American | 13 | 1.0% |
| Swedish | 110 | 8.2% |
| Swiss | 4 | 0.3% |
| Ukrainian | 3 | 0.2% |
| Welsh | 28 | 2.1% | View All 28 Rows |
Immigrants in Russell
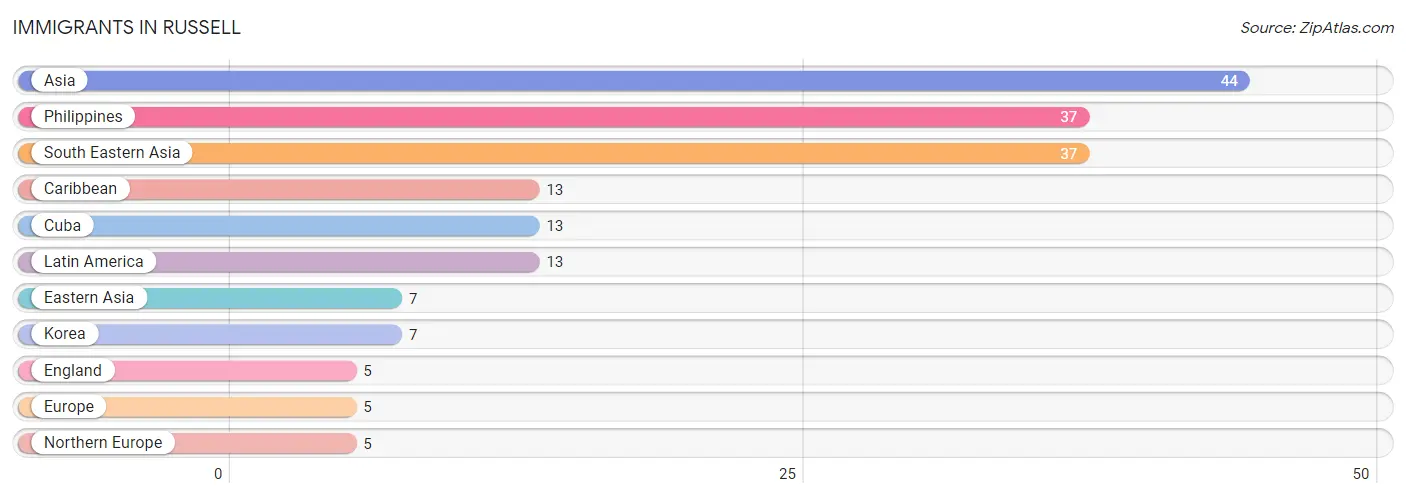
The most numerous immigrant groups reported in Russell came from Asia (44 | 3.3%), Philippines (37 | 2.8%), South Eastern Asia (37 | 2.8%), Caribbean (13 | 1.0%), and Cuba (13 | 1.0%), together accounting for 10.7% of all Russell residents.
| Immigration Origin | # Population | % Population |
| Asia | 44 | 3.3% |
| Caribbean | 13 | 1.0% |
| Cuba | 13 | 1.0% |
| Eastern Asia | 7 | 0.5% |
| England | 5 | 0.4% |
| Europe | 5 | 0.4% |
| Korea | 7 | 0.5% |
| Latin America | 13 | 1.0% |
| Northern Europe | 5 | 0.4% |
| Philippines | 37 | 2.8% |
| South Eastern Asia | 37 | 2.8% | View All 11 Rows |
Sex and Age in Russell
Sex and Age in Russell
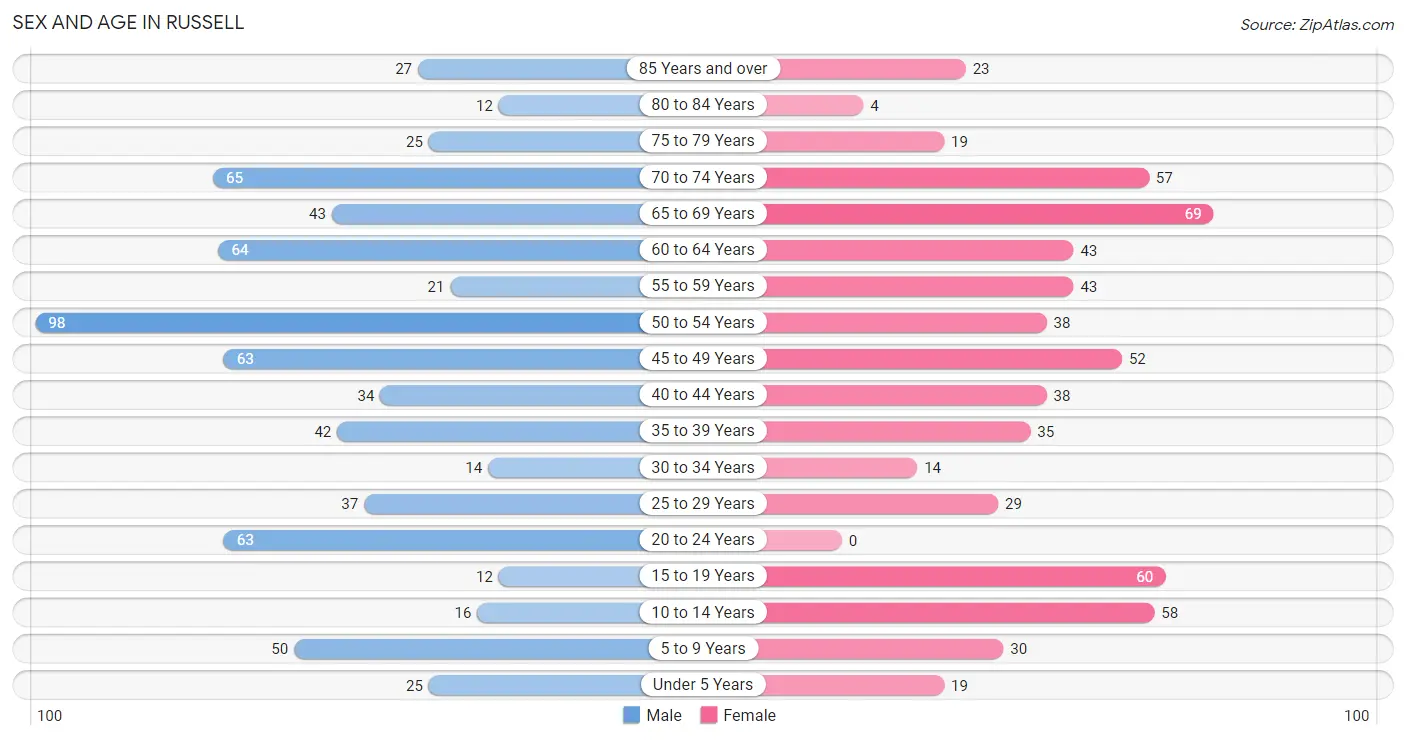
The most populous age groups in Russell are 50 to 54 Years (98 | 13.8%) for men and 65 to 69 Years (69 | 10.9%) for women.
| Age Bracket | Male | Female |
| Under 5 Years | 25 (3.5%) | 19 (3.0%) |
| 5 to 9 Years | 50 (7.0%) | 30 (4.8%) |
| 10 to 14 Years | 16 (2.2%) | 58 (9.2%) |
| 15 to 19 Years | 12 (1.7%) | 60 (9.5%) |
| 20 to 24 Years | 63 (8.9%) | 0 (0.0%) |
| 25 to 29 Years | 37 (5.2%) | 29 (4.6%) |
| 30 to 34 Years | 14 (2.0%) | 14 (2.2%) |
| 35 to 39 Years | 42 (5.9%) | 35 (5.6%) |
| 40 to 44 Years | 34 (4.8%) | 38 (6.0%) |
| 45 to 49 Years | 63 (8.9%) | 52 (8.2%) |
| 50 to 54 Years | 98 (13.8%) | 38 (6.0%) |
| 55 to 59 Years | 21 (2.9%) | 43 (6.8%) |
| 60 to 64 Years | 64 (9.0%) | 43 (6.8%) |
| 65 to 69 Years | 43 (6.0%) | 69 (10.9%) |
| 70 to 74 Years | 65 (9.1%) | 57 (9.0%) |
| 75 to 79 Years | 25 (3.5%) | 19 (3.0%) |
| 80 to 84 Years | 12 (1.7%) | 4 (0.6%) |
| 85 Years and over | 27 (3.8%) | 23 (3.6%) |
| Total | 711 (100.0%) | 631 (100.0%) |
Families and Households in Russell
Median Family Size in Russell
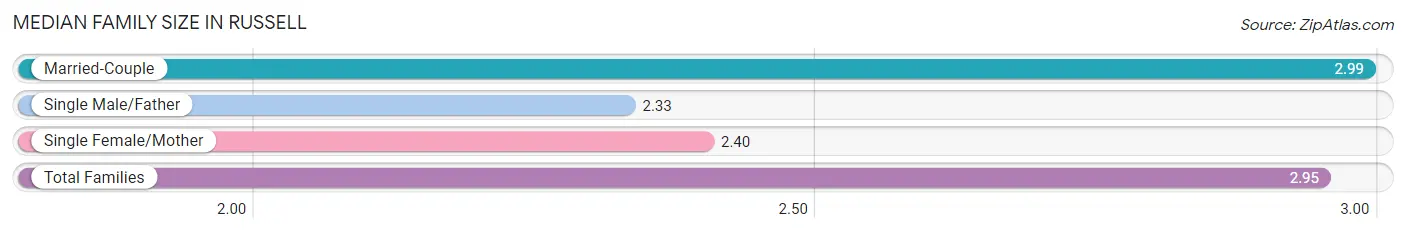
The median family size in Russell is 2.95 persons per family, with married-couple families (351 | 93.3%) accounting for the largest median family size of 2.99 persons per family. On the other hand, single male/father families (15 | 4.0%) represent the smallest median family size with 2.33 persons per family.
| Family Type | # Families | Family Size |
| Married-Couple | 351 (93.3%) | 2.99 |
| Single Male/Father | 15 (4.0%) | 2.33 |
| Single Female/Mother | 10 (2.7%) | 2.40 |
| Total Families | 376 (100.0%) | 2.95 |
Median Household Size in Russell
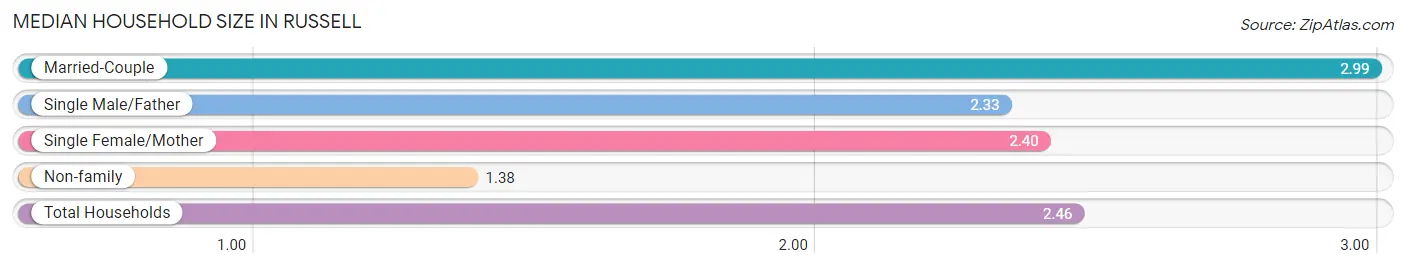
The median household size in Russell is 2.46 persons per household, with married-couple households (351 | 64.4%) accounting for the largest median household size of 2.99 persons per household. non-family households (169 | 31.0%) represent the smallest median household size with 1.38 persons per household.
| Household Type | # Households | Household Size |
| Married-Couple | 351 (64.4%) | 2.99 |
| Single Male/Father | 15 (2.8%) | 2.33 |
| Single Female/Mother | 10 (1.8%) | 2.40 |
| Non-family | 169 (31.0%) | 1.38 |
| Total Households | 545 (100.0%) | 2.46 |
Household Size by Marriage Status in Russell
Out of a total of 545 households in Russell, 376 (69.0%) are family households, while 169 (31.0%) are nonfamily households. The most numerous type of family households are 2-person households, comprising 224, and the most common type of nonfamily households are 1-person households, comprising 125.
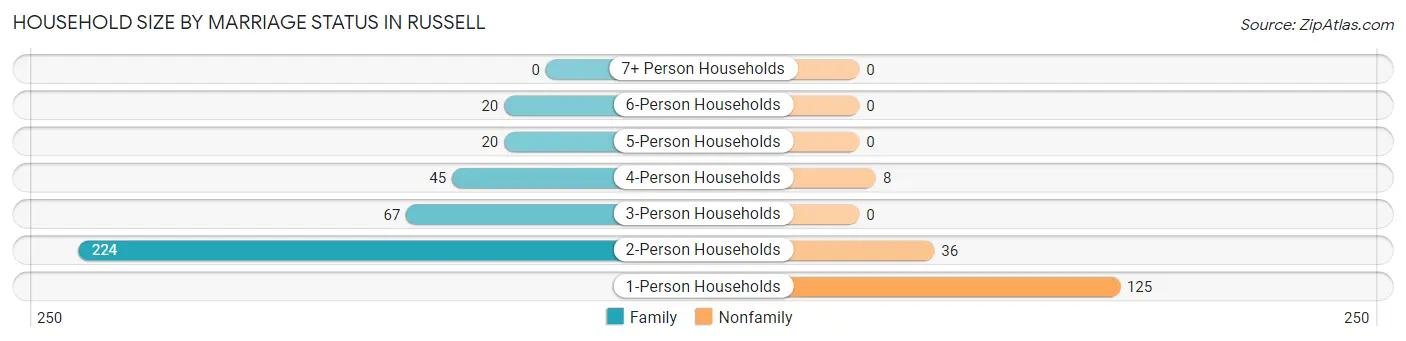
| Household Size | Family Households | Nonfamily Households |
| 1-Person Households | - | 125 (22.9%) |
| 2-Person Households | 224 (41.1%) | 36 (6.6%) |
| 3-Person Households | 67 (12.3%) | 0 (0.0%) |
| 4-Person Households | 45 (8.3%) | 8 (1.5%) |
| 5-Person Households | 20 (3.7%) | 0 (0.0%) |
| 6-Person Households | 20 (3.7%) | 0 (0.0%) |
| 7+ Person Households | 0 (0.0%) | 0 (0.0%) |
| Total | 376 (69.0%) | 169 (31.0%) |
Female Fertility in Russell
Fertility by Age in Russell
Average fertility rate in Russell is 25.0 births per 1,000 women. Women in the age bracket of 35 to 50 years have the highest fertility rate with 43.0 births per 1,000 women. Women in the age bracket of 35 to 50 years acount for 100.0% of all women with births.
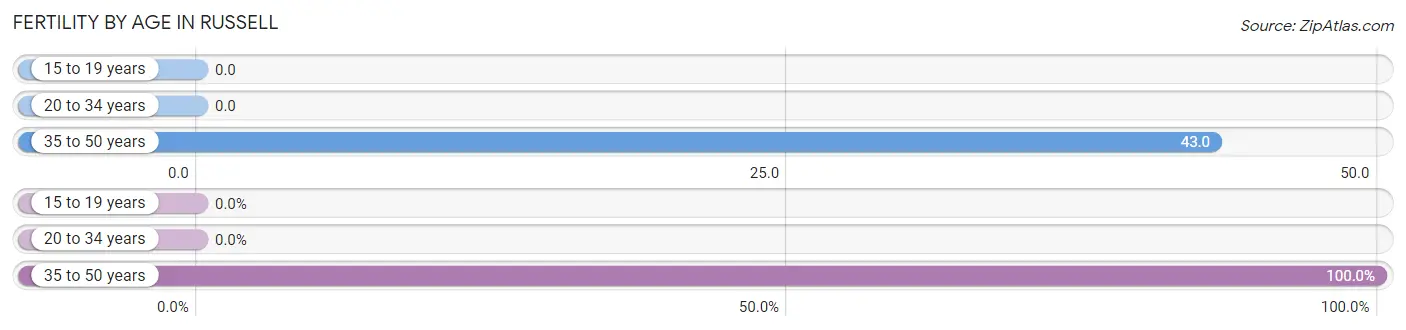
| Age Bracket | Women with Births | Births / 1,000 Women |
| 15 to 19 years | 0 (0.0%) | 0.0 |
| 20 to 34 years | 0 (0.0%) | 0.0 |
| 35 to 50 years | 6 (100.0%) | 43.0 |
| Total | 6 (100.0%) | 25.0 |
Fertility by Age by Marriage Status in Russell
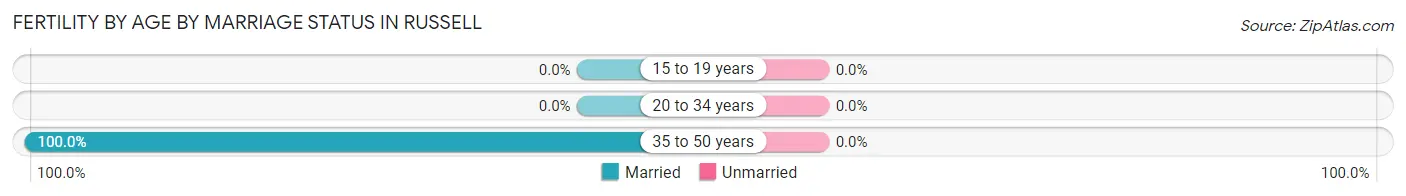
| Age Bracket | Married | Unmarried |
| 15 to 19 years | 0 (0.0%) | 0 (0.0%) |
| 20 to 34 years | 0 (0.0%) | 0 (0.0%) |
| 35 to 50 years | 6 (100.0%) | 0 (0.0%) |
| Total | 6 (100.0%) | 0 (0.0%) |
Fertility by Education in Russell
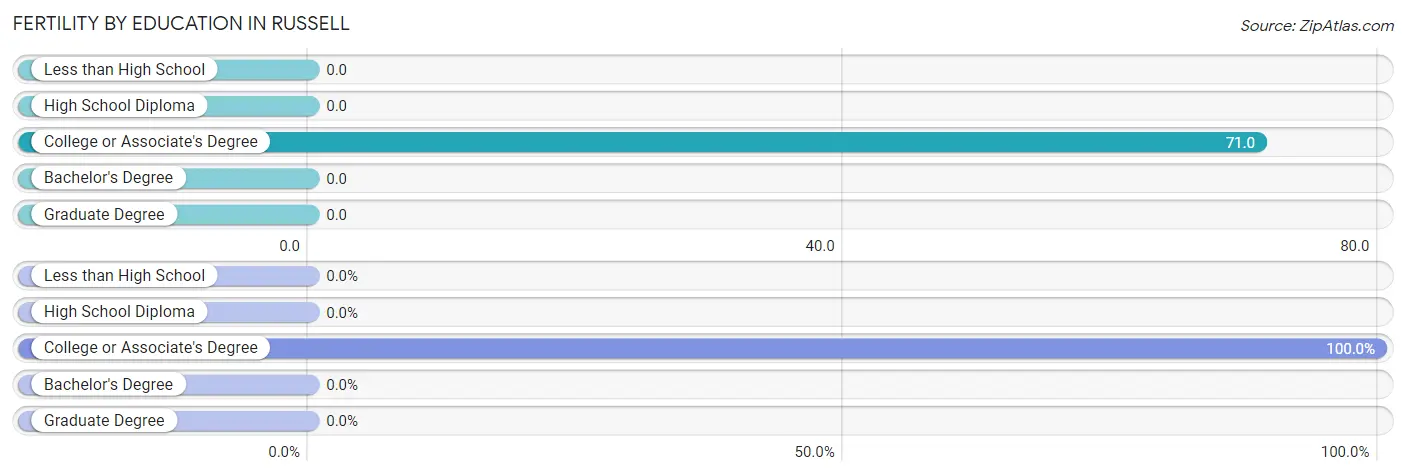
| Educational Attainment | Women with Births | Births / 1,000 Women |
| Less than High School | 0 (0.0%) | 0.0 |
| High School Diploma | 0 (0.0%) | 0.0 |
| College or Associate's Degree | 6 (100.0%) | 71.0 |
| Bachelor's Degree | 0 (0.0%) | 0.0 |
| Graduate Degree | 0 (0.0%) | 0.0 |
| Total | 6 (100.0%) | 25.0 |
Fertility by Education by Marriage Status in Russell
| Educational Attainment | Married | Unmarried |
| Less than High School | 0 (0.0%) | 0 (0.0%) |
| High School Diploma | 0 (0.0%) | 0 (0.0%) |
| College or Associate's Degree | 6 (100.0%) | 0 (0.0%) |
| Bachelor's Degree | 0 (0.0%) | 0 (0.0%) |
| Graduate Degree | 0 (0.0%) | 0 (0.0%) |
| Total | 6 (100.0%) | 0 (0.0%) |
Employment Characteristics in Russell
Employment by Class of Employer in Russell
Among the 668 employed individuals in Russell, private company employees (477 | 71.4%), local government employees (62 | 9.3%), and not-for-profit organizations (55 | 8.2%) make up the most common classes of employment.
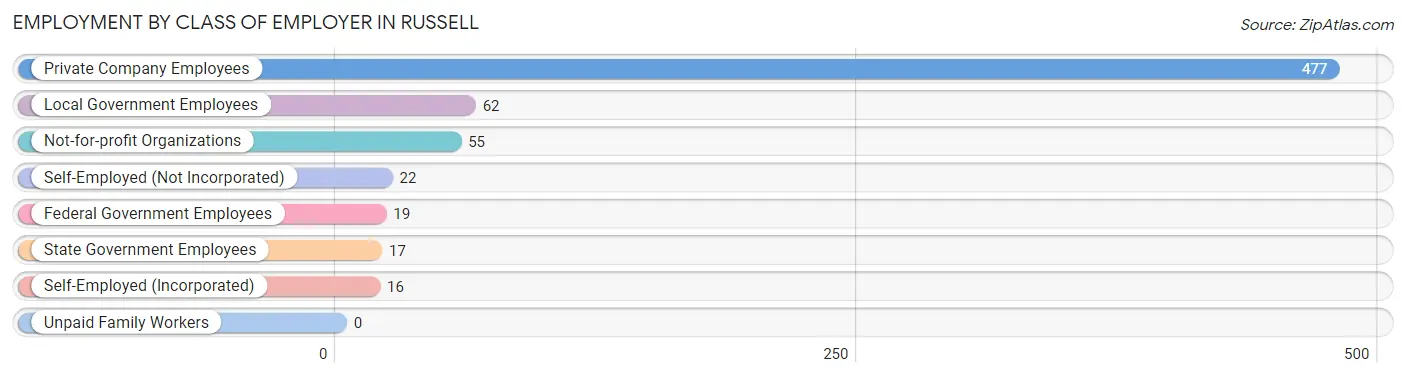
| Employer Class | # Employees | % Employees |
| Private Company Employees | 477 | 71.4% |
| Self-Employed (Incorporated) | 16 | 2.4% |
| Self-Employed (Not Incorporated) | 22 | 3.3% |
| Not-for-profit Organizations | 55 | 8.2% |
| Local Government Employees | 62 | 9.3% |
| State Government Employees | 17 | 2.5% |
| Federal Government Employees | 19 | 2.8% |
| Unpaid Family Workers | 0 | 0.0% |
| Total | 668 | 100.0% |
Employment Status by Age in Russell
According to the labor force statistics for Russell, out of the total population over 16 years of age (1,134), 63.5% or 720 individuals are in the labor force, with 4.6% or 33 of them unemployed. The age group with the highest labor force participation rate is 25 to 29 years, with 100.0% or 66 individuals in the labor force. Within the labor force, the 20 to 24 years age range has the highest percentage of unemployed individuals, with 43.9% or 25 of them being unemployed.
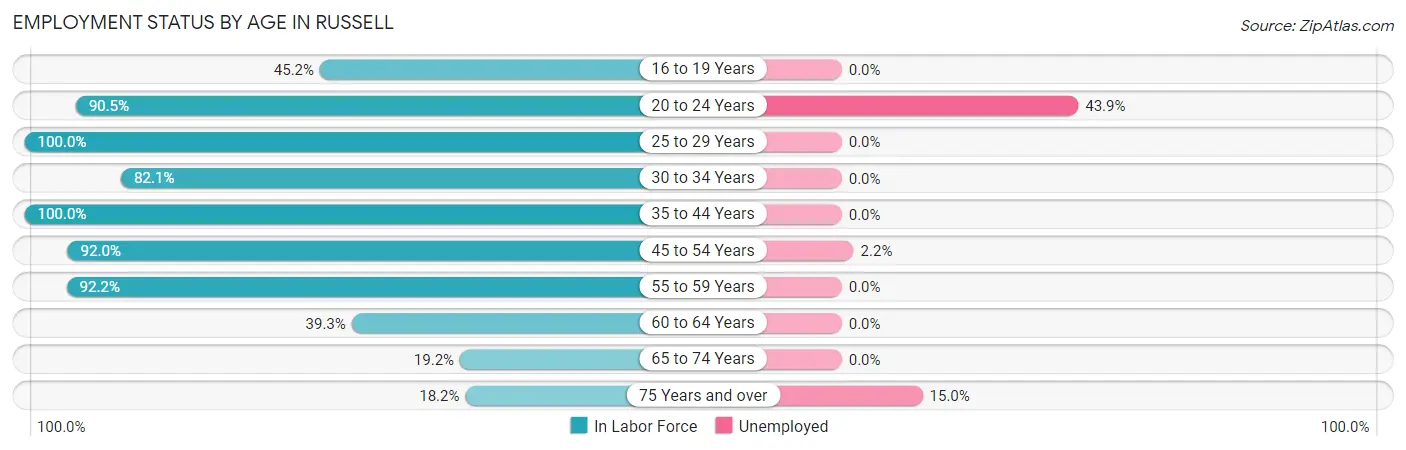
| Age Bracket | In Labor Force | Unemployed |
| 16 to 19 Years | 28 (45.2%) | 0 (0.0%) |
| 20 to 24 Years | 57 (90.5%) | 25 (43.9%) |
| 25 to 29 Years | 66 (100.0%) | 0 (0.0%) |
| 30 to 34 Years | 23 (82.1%) | 0 (0.0%) |
| 35 to 44 Years | 149 (100.0%) | 0 (0.0%) |
| 45 to 54 Years | 231 (92.0%) | 5 (2.2%) |
| 55 to 59 Years | 59 (92.2%) | 0 (0.0%) |
| 60 to 64 Years | 42 (39.3%) | 0 (0.0%) |
| 65 to 74 Years | 45 (19.2%) | 0 (0.0%) |
| 75 Years and over | 20 (18.2%) | 3 (15.0%) |
| Total | 720 (63.5%) | 33 (4.6%) |
Employment Status by Educational Attainment in Russell
According to labor force statistics for Russell, 85.7% of individuals (570) out of the total population between 25 and 64 years of age (665) are in the labor force, with 0.9% or 5 of them being unemployed. The group with the highest labor force participation rate are those with the educational attainment of less than high school, with 100.0% or 3 individuals in the labor force. Within the labor force, individuals with bachelor's degree or higher education have the highest percentage of unemployment, with 2.1% or 5 of them being unemployed.
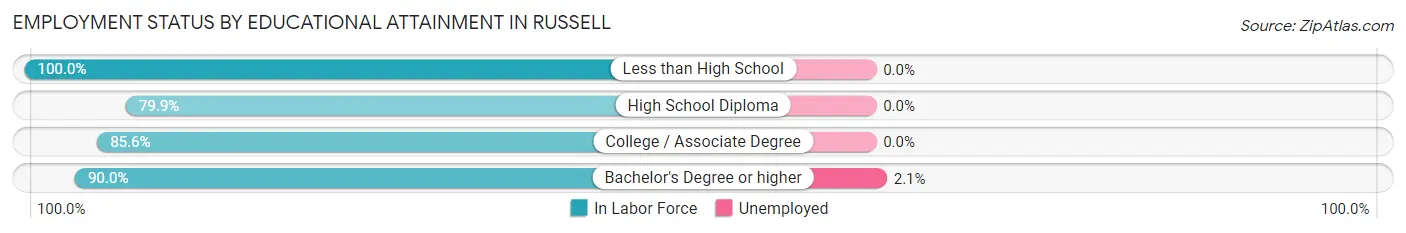
| Educational Attainment | In Labor Force | Unemployed |
| Less than High School | 3 (100.0%) | 0 (0.0%) |
| High School Diploma | 159 (79.9%) | 0 (0.0%) |
| College / Associate Degree | 173 (85.6%) | 0 (0.0%) |
| Bachelor's Degree or higher | 235 (90.0%) | 5 (2.1%) |
| Total | 570 (85.7%) | 6 (0.9%) |
Employment Occupations by Sex in Russell
Management, Business, Science and Arts Occupations
The most common Management, Business, Science and Arts occupations in Russell are Computers, Engineering & Science (70 | 10.2%), Management (63 | 9.2%), Community & Social Service (59 | 8.6%), Health Diagnosing & Treating (57 | 8.3%), and Business & Financial (45 | 6.6%).

Management, Business, Science and Arts Occupations by Sex
Within the Management, Business, Science and Arts occupations in Russell, the most male-oriented occupations are Legal Services & Support (100.0%), Management (80.9%), and Architecture & Engineering (76.5%), while the most female-oriented occupations are Arts, Media & Entertainment (100.0%), Education Instruction & Library (76.0%), and Health Diagnosing & Treating (66.7%).
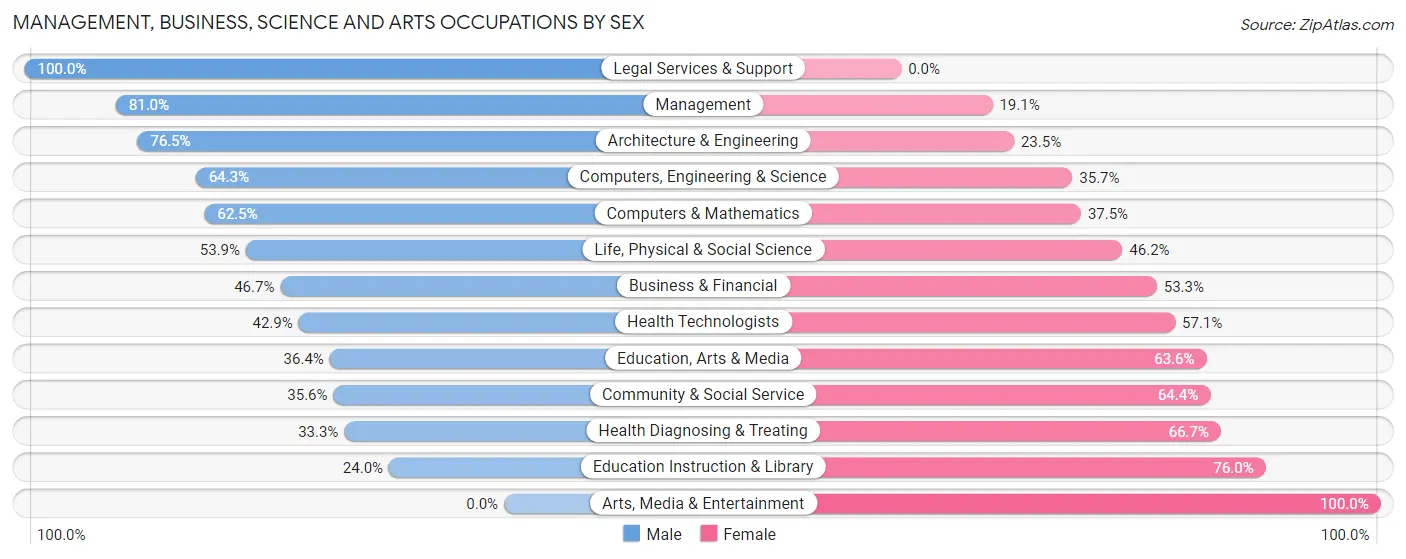
| Occupation | Male | Female |
| Management | 51 (80.9%) | 12 (19.1%) |
| Business & Financial | 21 (46.7%) | 24 (53.3%) |
| Computers, Engineering & Science | 45 (64.3%) | 25 (35.7%) |
| Computers & Mathematics | 25 (62.5%) | 15 (37.5%) |
| Architecture & Engineering | 13 (76.5%) | 4 (23.5%) |
| Life, Physical & Social Science | 7 (53.8%) | 6 (46.2%) |
| Community & Social Service | 21 (35.6%) | 38 (64.4%) |
| Education, Arts & Media | 8 (36.4%) | 14 (63.6%) |
| Legal Services & Support | 7 (100.0%) | 0 (0.0%) |
| Education Instruction & Library | 6 (24.0%) | 19 (76.0%) |
| Arts, Media & Entertainment | 0 (0.0%) | 5 (100.0%) |
| Health Diagnosing & Treating | 19 (33.3%) | 38 (66.7%) |
| Health Technologists | 12 (42.9%) | 16 (57.1%) |
| Total (Category) | 157 (53.4%) | 137 (46.6%) |
| Total (Overall) | 377 (54.9%) | 310 (45.1%) |
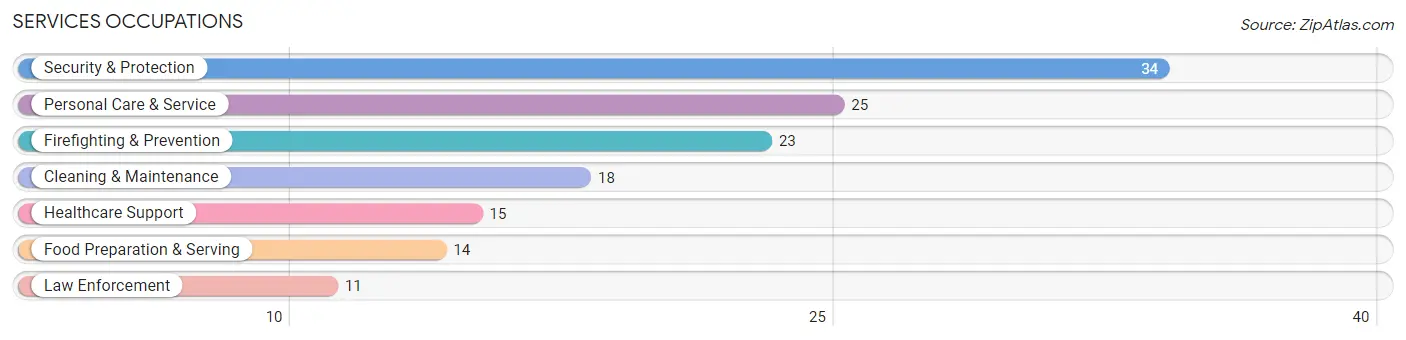
Services Occupations
The most common Services occupations in Russell are Security & Protection (34 | 5.0%), Personal Care & Service (25 | 3.6%), Firefighting & Prevention (23 | 3.4%), Cleaning & Maintenance (18 | 2.6%), and Healthcare Support (15 | 2.2%).
Services Occupations by Sex
Within the Services occupations in Russell, the most male-oriented occupations are Law Enforcement (100.0%), Cleaning & Maintenance (100.0%), and Security & Protection (50.0%), while the most female-oriented occupations are Healthcare Support (100.0%), Food Preparation & Serving (100.0%), and Personal Care & Service (100.0%).
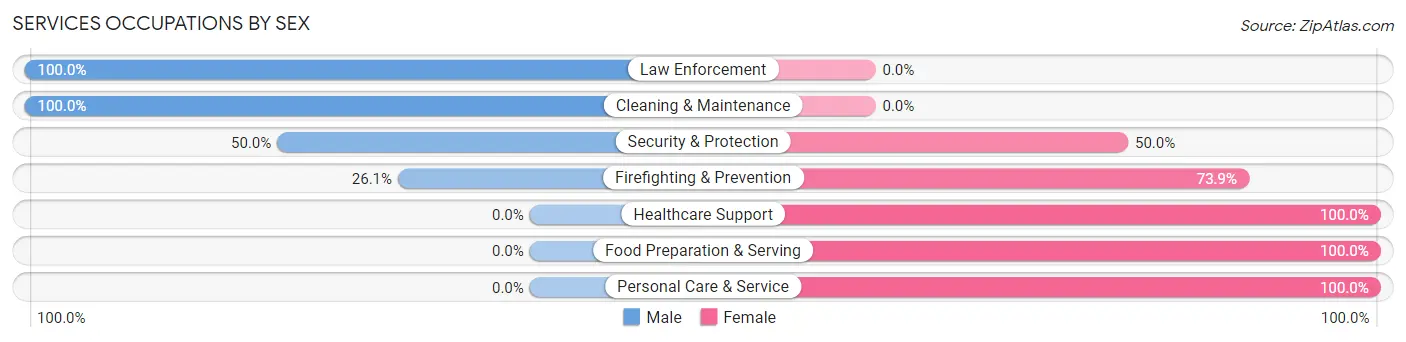
| Occupation | Male | Female |
| Healthcare Support | 0 (0.0%) | 15 (100.0%) |
| Security & Protection | 17 (50.0%) | 17 (50.0%) |
| Firefighting & Prevention | 6 (26.1%) | 17 (73.9%) |
| Law Enforcement | 11 (100.0%) | 0 (0.0%) |
| Food Preparation & Serving | 0 (0.0%) | 14 (100.0%) |
| Cleaning & Maintenance | 18 (100.0%) | 0 (0.0%) |
| Personal Care & Service | 0 (0.0%) | 25 (100.0%) |
| Total (Category) | 35 (33.0%) | 71 (67.0%) |
| Total (Overall) | 377 (54.9%) | 310 (45.1%) |
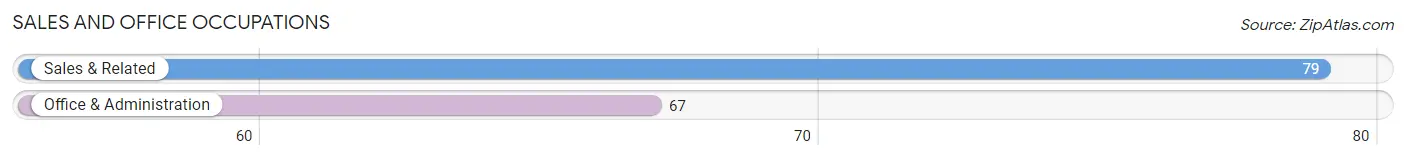
Sales and Office Occupations
The most common Sales and Office occupations in Russell are Sales & Related (79 | 11.5%), and Office & Administration (67 | 9.8%).
Sales and Office Occupations by Sex
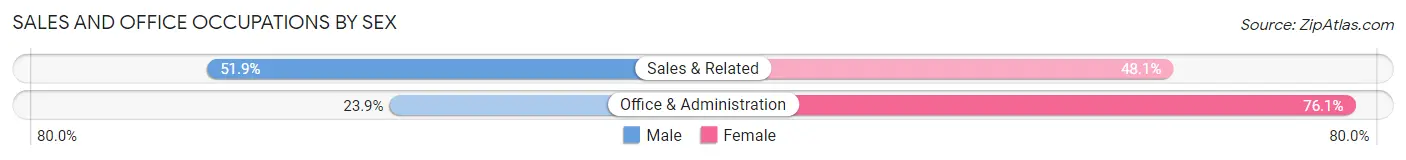
| Occupation | Male | Female |
| Sales & Related | 41 (51.9%) | 38 (48.1%) |
| Office & Administration | 16 (23.9%) | 51 (76.1%) |
| Total (Category) | 57 (39.0%) | 89 (61.0%) |
| Total (Overall) | 377 (54.9%) | 310 (45.1%) |
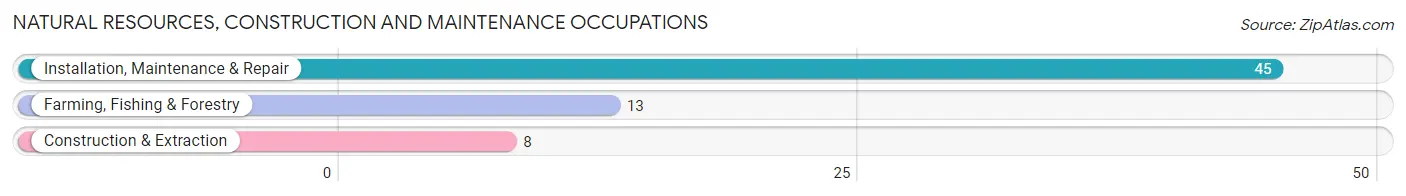
Natural Resources, Construction and Maintenance Occupations
The most common Natural Resources, Construction and Maintenance occupations in Russell are Installation, Maintenance & Repair (45 | 6.6%), Farming, Fishing & Forestry (13 | 1.9%), and Construction & Extraction (8 | 1.2%).
Natural Resources, Construction and Maintenance Occupations by Sex
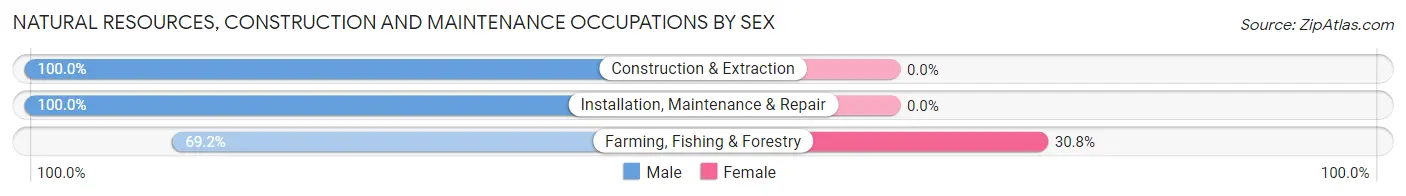
| Occupation | Male | Female |
| Farming, Fishing & Forestry | 9 (69.2%) | 4 (30.8%) |
| Construction & Extraction | 8 (100.0%) | 0 (0.0%) |
| Installation, Maintenance & Repair | 45 (100.0%) | 0 (0.0%) |
| Total (Category) | 62 (93.9%) | 4 (6.1%) |
| Total (Overall) | 377 (54.9%) | 310 (45.1%) |
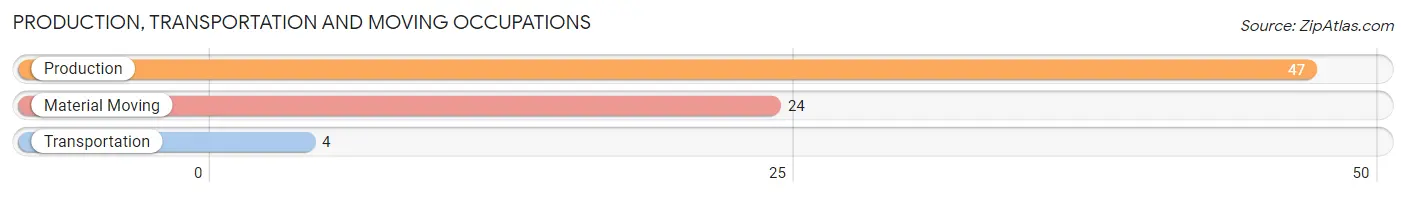
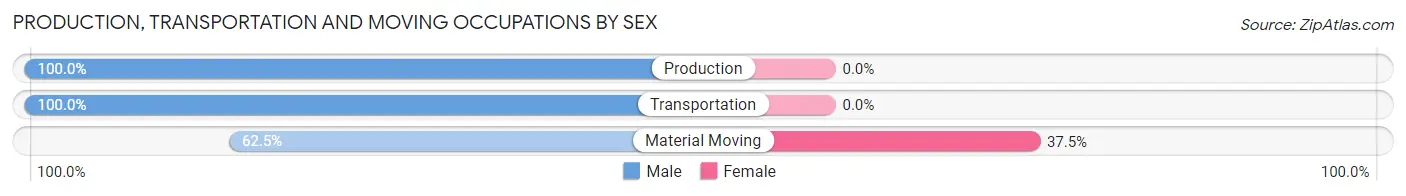
Production, Transportation and Moving Occupations
The most common Production, Transportation and Moving occupations in Russell are Production (47 | 6.8%), Material Moving (24 | 3.5%), and Transportation (4 | 0.6%).
Production, Transportation and Moving Occupations by Sex
| Occupation | Male | Female |
| Production | 47 (100.0%) | 0 (0.0%) |
| Transportation | 4 (100.0%) | 0 (0.0%) |
| Material Moving | 15 (62.5%) | 9 (37.5%) |
| Total (Category) | 66 (88.0%) | 9 (12.0%) |
| Total (Overall) | 377 (54.9%) | 310 (45.1%) |
Employment Industries by Sex in Russell
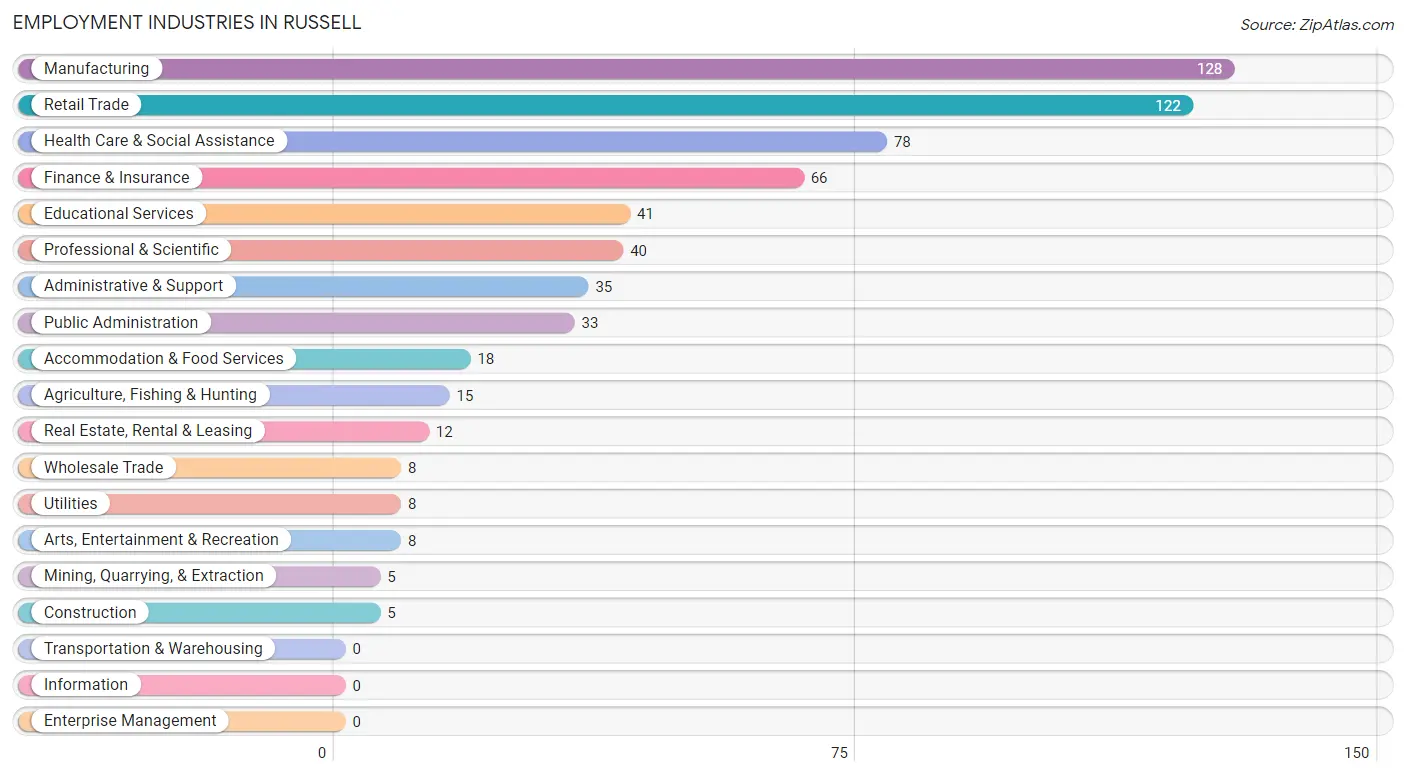
Employment Industries in Russell
The major employment industries in Russell include Manufacturing (128 | 18.6%), Retail Trade (122 | 17.8%), Health Care & Social Assistance (78 | 11.4%), Finance & Insurance (66 | 9.6%), and Educational Services (41 | 6.0%).
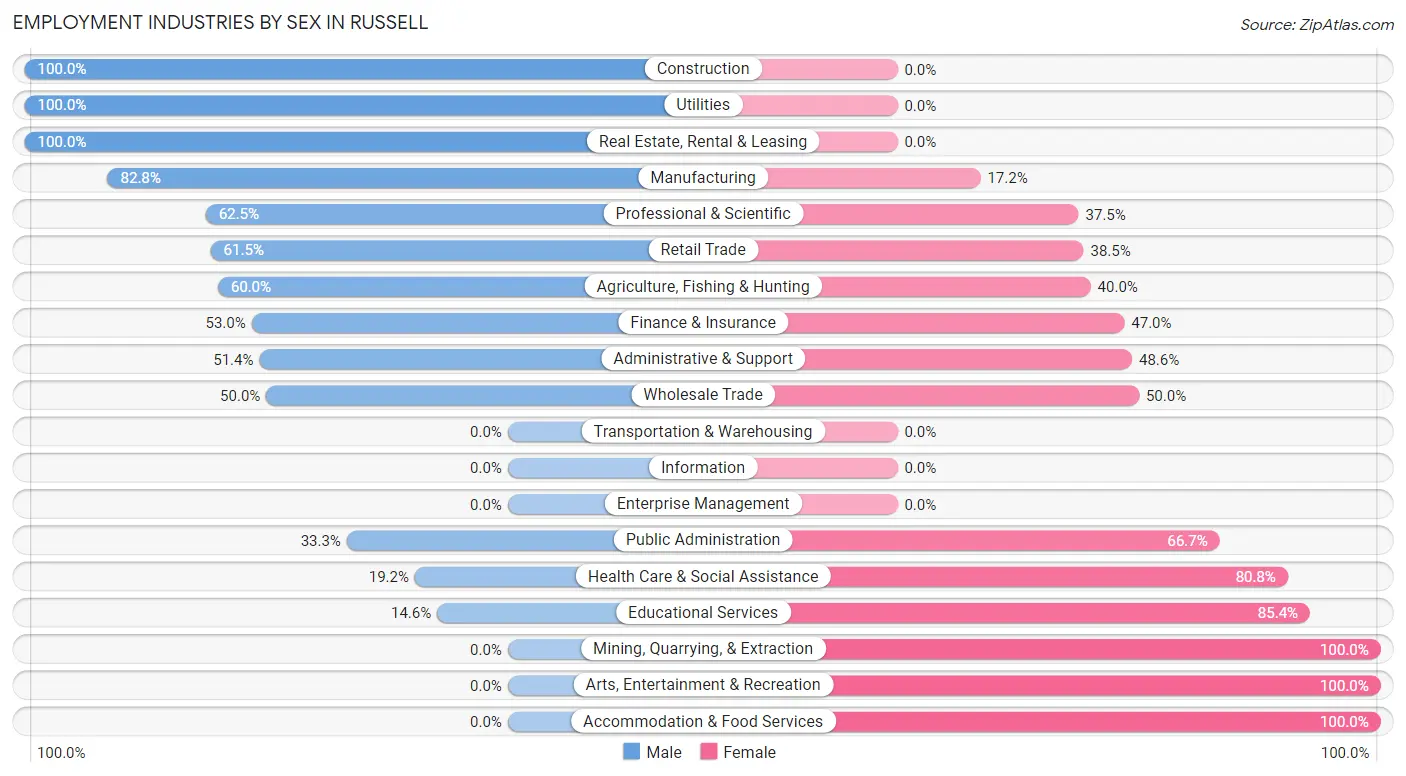
Employment Industries by Sex in Russell
The Russell industries that see more men than women are Construction (100.0%), Utilities (100.0%), and Real Estate, Rental & Leasing (100.0%), whereas the industries that tend to have a higher number of women are Mining, Quarrying, & Extraction (100.0%), Arts, Entertainment & Recreation (100.0%), and Accommodation & Food Services (100.0%).
| Industry | Male | Female |
| Agriculture, Fishing & Hunting | 9 (60.0%) | 6 (40.0%) |
| Mining, Quarrying, & Extraction | 0 (0.0%) | 5 (100.0%) |
| Construction | 5 (100.0%) | 0 (0.0%) |
| Manufacturing | 106 (82.8%) | 22 (17.2%) |
| Wholesale Trade | 4 (50.0%) | 4 (50.0%) |
| Retail Trade | 75 (61.5%) | 47 (38.5%) |
| Transportation & Warehousing | 0 (0.0%) | 0 (0.0%) |
| Utilities | 8 (100.0%) | 0 (0.0%) |
| Information | 0 (0.0%) | 0 (0.0%) |
| Finance & Insurance | 35 (53.0%) | 31 (47.0%) |
| Real Estate, Rental & Leasing | 12 (100.0%) | 0 (0.0%) |
| Professional & Scientific | 25 (62.5%) | 15 (37.5%) |
| Enterprise Management | 0 (0.0%) | 0 (0.0%) |
| Administrative & Support | 18 (51.4%) | 17 (48.6%) |
| Educational Services | 6 (14.6%) | 35 (85.4%) |
| Health Care & Social Assistance | 15 (19.2%) | 63 (80.8%) |
| Arts, Entertainment & Recreation | 0 (0.0%) | 8 (100.0%) |
| Accommodation & Food Services | 0 (0.0%) | 18 (100.0%) |
| Public Administration | 11 (33.3%) | 22 (66.7%) |
| Total | 377 (54.9%) | 310 (45.1%) |
Education in Russell
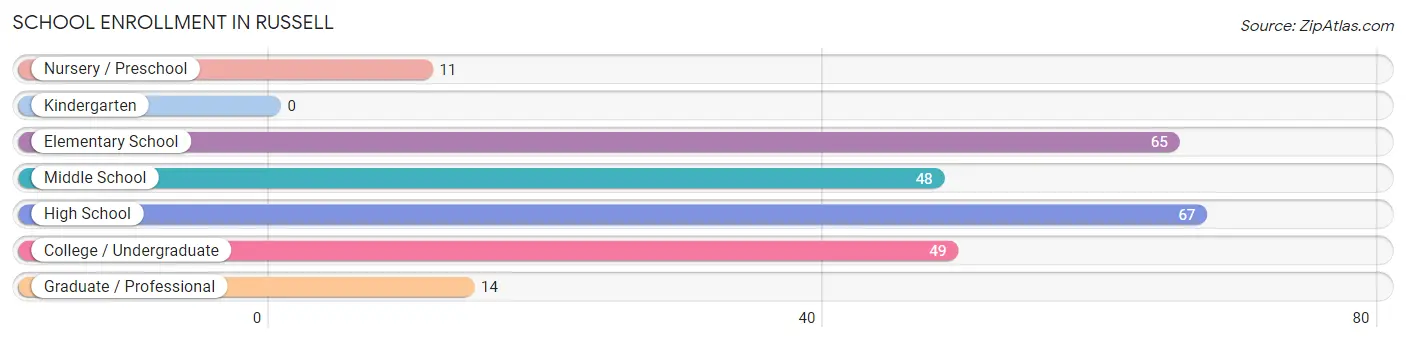
School Enrollment in Russell
The most common levels of schooling among the 254 students in Russell are high school (67 | 26.4%), elementary school (65 | 25.6%), and college / undergraduate (49 | 19.3%).
| School Level | # Students | % Students |
| Nursery / Preschool | 11 | 4.3% |
| Kindergarten | 0 | 0.0% |
| Elementary School | 65 | 25.6% |
| Middle School | 48 | 18.9% |
| High School | 67 | 26.4% |
| College / Undergraduate | 49 | 19.3% |
| Graduate / Professional | 14 | 5.5% |
| Total | 254 | 100.0% |
School Enrollment by Age by Funding Source in Russell
Out of a total of 254 students who are enrolled in schools in Russell, 51 (20.1%) attend a private institution, while the remaining 203 (79.9%) are enrolled in public schools. The age group of 20 to 24 year olds has the highest likelihood of being enrolled in private schools, with 17 (70.8% in the age bracket) enrolled. Conversely, the age group of 3 to 4 year olds has the lowest likelihood of being enrolled in a private school, with 11 (100.0% in the age bracket) attending a public institution.
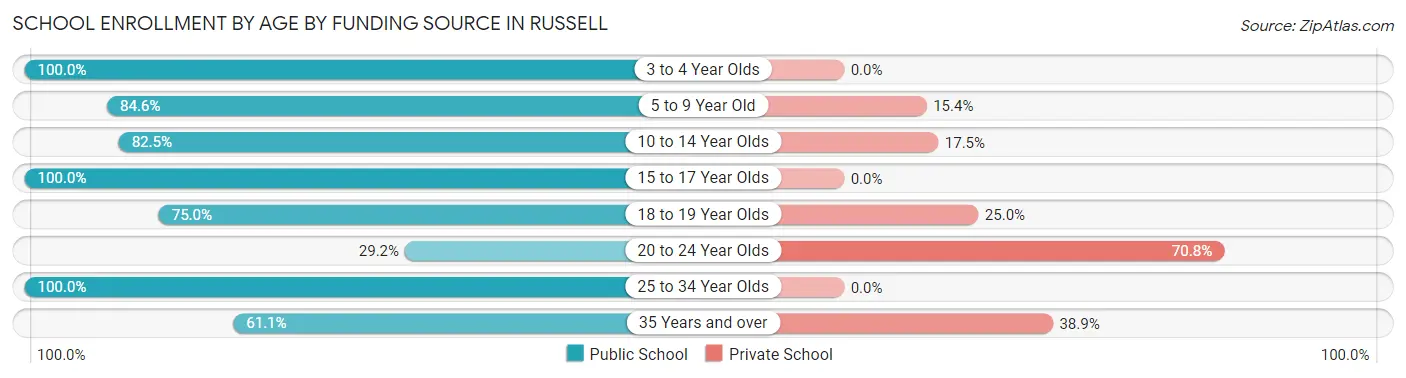
| Age Bracket | Public School | Private School |
| 3 to 4 Year Olds | 11 (100.0%) | 0 (0.0%) |
| 5 to 9 Year Old | 55 (84.6%) | 10 (15.4%) |
| 10 to 14 Year Olds | 47 (82.5%) | 10 (17.5%) |
| 15 to 17 Year Olds | 44 (100.0%) | 0 (0.0%) |
| 18 to 19 Year Olds | 21 (75.0%) | 7 (25.0%) |
| 20 to 24 Year Olds | 7 (29.2%) | 17 (70.8%) |
| 25 to 34 Year Olds | 7 (100.0%) | 0 (0.0%) |
| 35 Years and over | 11 (61.1%) | 7 (38.9%) |
| Total | 203 (79.9%) | 51 (20.1%) |
Educational Attainment by Field of Study in Russell
Education (109 | 27.8%), business (64 | 16.3%), science & technology (42 | 10.7%), engineering (36 | 9.2%), and arts & humanities (28 | 7.1%) are the most common fields of study among 392 individuals in Russell who have obtained a bachelor's degree or higher.
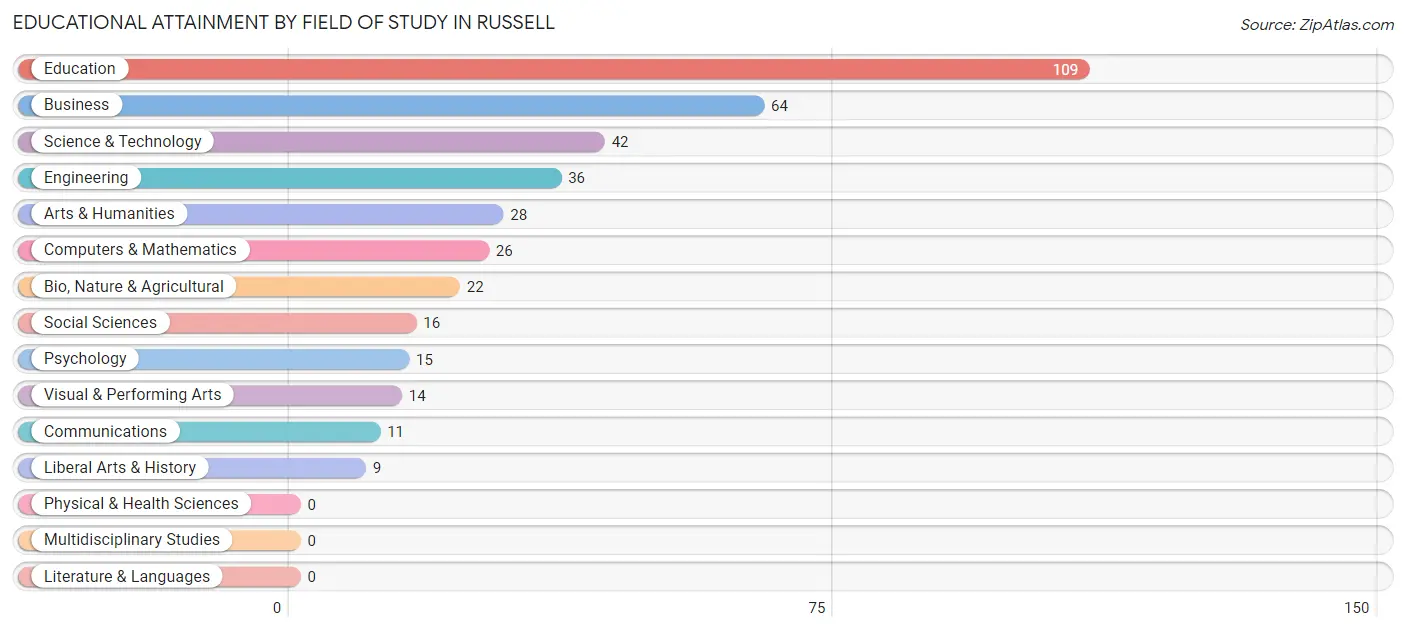
| Field of Study | # Graduates | % Graduates |
| Computers & Mathematics | 26 | 6.6% |
| Bio, Nature & Agricultural | 22 | 5.6% |
| Physical & Health Sciences | 0 | 0.0% |
| Psychology | 15 | 3.8% |
| Social Sciences | 16 | 4.1% |
| Engineering | 36 | 9.2% |
| Multidisciplinary Studies | 0 | 0.0% |
| Science & Technology | 42 | 10.7% |
| Business | 64 | 16.3% |
| Education | 109 | 27.8% |
| Literature & Languages | 0 | 0.0% |
| Liberal Arts & History | 9 | 2.3% |
| Visual & Performing Arts | 14 | 3.6% |
| Communications | 11 | 2.8% |
| Arts & Humanities | 28 | 7.1% |
| Total | 392 | 100.0% |
Transportation & Commute in Russell
Vehicle Availability by Sex in Russell
The most prevalent vehicle ownership categories in Russell are males with 2 vehicles (139, accounting for 37.9%) and females with 2 vehicles (107, making up 46.2%).
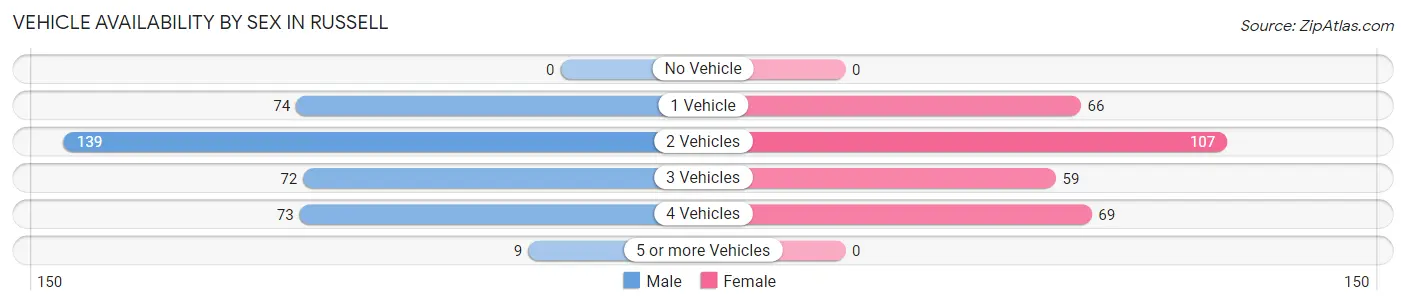
| Vehicles Available | Male | Female |
| No Vehicle | 0 (0.0%) | 0 (0.0%) |
| 1 Vehicle | 74 (20.2%) | 66 (21.9%) |
| 2 Vehicles | 139 (37.9%) | 107 (35.5%) |
| 3 Vehicles | 72 (19.6%) | 59 (19.6%) |
| 4 Vehicles | 73 (19.9%) | 69 (22.9%) |
| 5 or more Vehicles | 9 (2.5%) | 0 (0.0%) |
| Total | 367 (100.0%) | 301 (100.0%) |
Commute Time in Russell
The most frequently occuring commute durations in Russell are 15 to 19 minutes (175 commuters, 29.0%), 5 to 9 minutes (111 commuters, 18.4%), and 20 to 24 minutes (86 commuters, 14.2%).
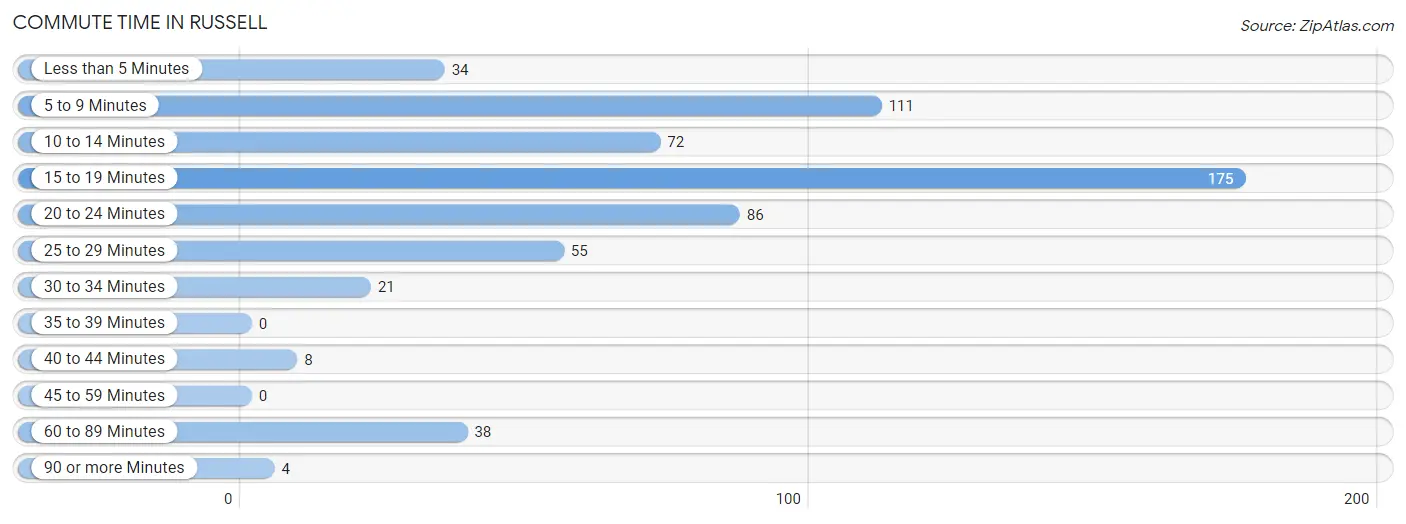
| Commute Time | # Commuters | % Commuters |
| Less than 5 Minutes | 34 | 5.6% |
| 5 to 9 Minutes | 111 | 18.4% |
| 10 to 14 Minutes | 72 | 11.9% |
| 15 to 19 Minutes | 175 | 29.0% |
| 20 to 24 Minutes | 86 | 14.2% |
| 25 to 29 Minutes | 55 | 9.1% |
| 30 to 34 Minutes | 21 | 3.5% |
| 35 to 39 Minutes | 0 | 0.0% |
| 40 to 44 Minutes | 8 | 1.3% |
| 45 to 59 Minutes | 0 | 0.0% |
| 60 to 89 Minutes | 38 | 6.3% |
| 90 or more Minutes | 4 | 0.7% |
Commute Time by Sex in Russell
The most common commute times in Russell are 15 to 19 minutes (101 commuters, 30.1%) for males and 15 to 19 minutes (74 commuters, 27.5%) for females.
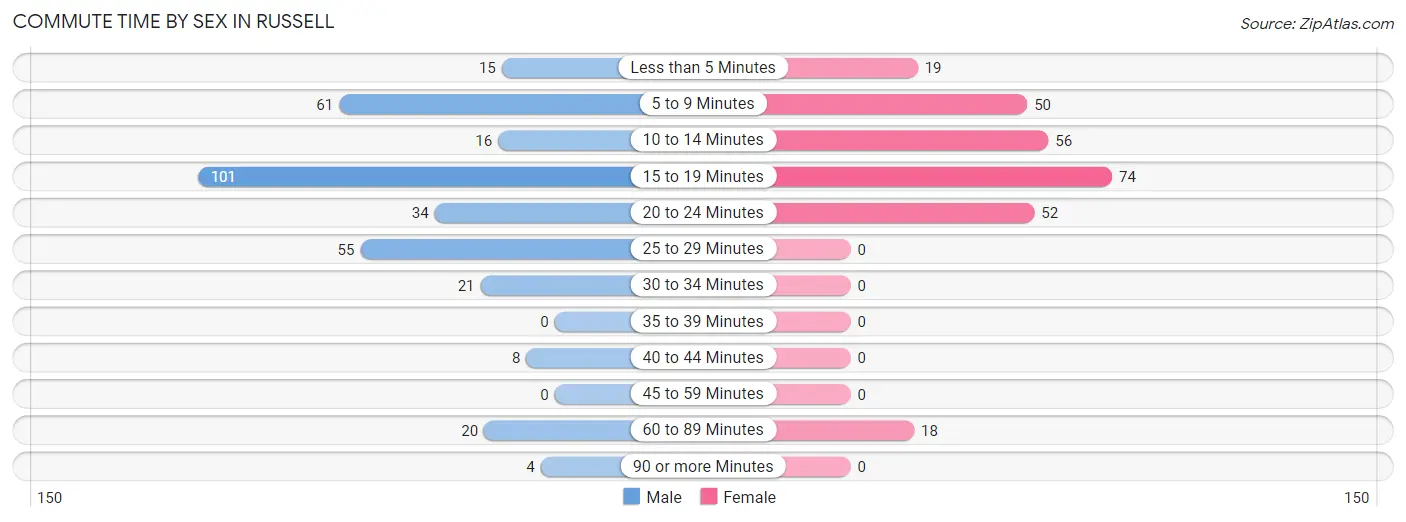
| Commute Time | Male | Female |
| Less than 5 Minutes | 15 (4.5%) | 19 (7.1%) |
| 5 to 9 Minutes | 61 (18.2%) | 50 (18.6%) |
| 10 to 14 Minutes | 16 (4.8%) | 56 (20.8%) |
| 15 to 19 Minutes | 101 (30.1%) | 74 (27.5%) |
| 20 to 24 Minutes | 34 (10.2%) | 52 (19.3%) |
| 25 to 29 Minutes | 55 (16.4%) | 0 (0.0%) |
| 30 to 34 Minutes | 21 (6.3%) | 0 (0.0%) |
| 35 to 39 Minutes | 0 (0.0%) | 0 (0.0%) |
| 40 to 44 Minutes | 8 (2.4%) | 0 (0.0%) |
| 45 to 59 Minutes | 0 (0.0%) | 0 (0.0%) |
| 60 to 89 Minutes | 20 (6.0%) | 18 (6.7%) |
| 90 or more Minutes | 4 (1.2%) | 0 (0.0%) |
Time of Departure to Work by Sex in Russell
The most frequent times of departure to work in Russell are 7:30 AM to 7:59 AM (92, 27.5%) for males and 7:00 AM to 7:29 AM (87, 32.3%) for females.
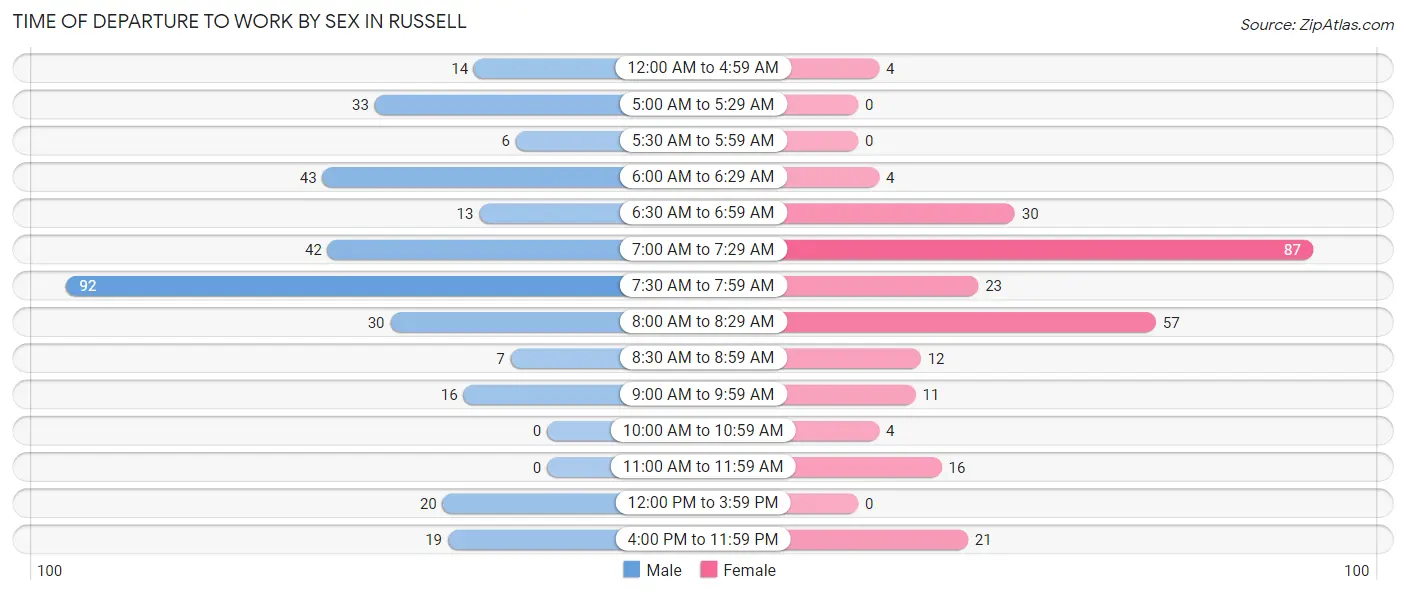
| Time of Departure | Male | Female |
| 12:00 AM to 4:59 AM | 14 (4.2%) | 4 (1.5%) |
| 5:00 AM to 5:29 AM | 33 (9.9%) | 0 (0.0%) |
| 5:30 AM to 5:59 AM | 6 (1.8%) | 0 (0.0%) |
| 6:00 AM to 6:29 AM | 43 (12.8%) | 4 (1.5%) |
| 6:30 AM to 6:59 AM | 13 (3.9%) | 30 (11.2%) |
| 7:00 AM to 7:29 AM | 42 (12.5%) | 87 (32.3%) |
| 7:30 AM to 7:59 AM | 92 (27.5%) | 23 (8.6%) |
| 8:00 AM to 8:29 AM | 30 (9.0%) | 57 (21.2%) |
| 8:30 AM to 8:59 AM | 7 (2.1%) | 12 (4.5%) |
| 9:00 AM to 9:59 AM | 16 (4.8%) | 11 (4.1%) |
| 10:00 AM to 10:59 AM | 0 (0.0%) | 4 (1.5%) |
| 11:00 AM to 11:59 AM | 0 (0.0%) | 16 (5.9%) |
| 12:00 PM to 3:59 PM | 20 (6.0%) | 0 (0.0%) |
| 4:00 PM to 11:59 PM | 19 (5.7%) | 21 (7.8%) |
| Total | 335 (100.0%) | 269 (100.0%) |
Housing Occupancy in Russell
Occupancy by Ownership in Russell
Of the total 545 dwellings in Russell, owner-occupied units account for 494 (90.6%), while renter-occupied units make up 51 (9.4%).
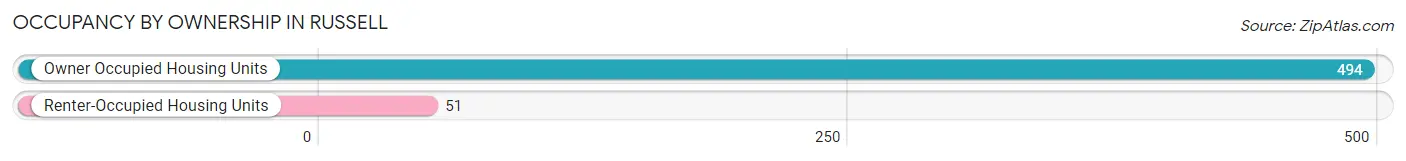
| Occupancy | # Housing Units | % Housing Units |
| Owner Occupied Housing Units | 494 | 90.6% |
| Renter-Occupied Housing Units | 51 | 9.4% |
| Total Occupied Housing Units | 545 | 100.0% |
Occupancy by Household Size in Russell
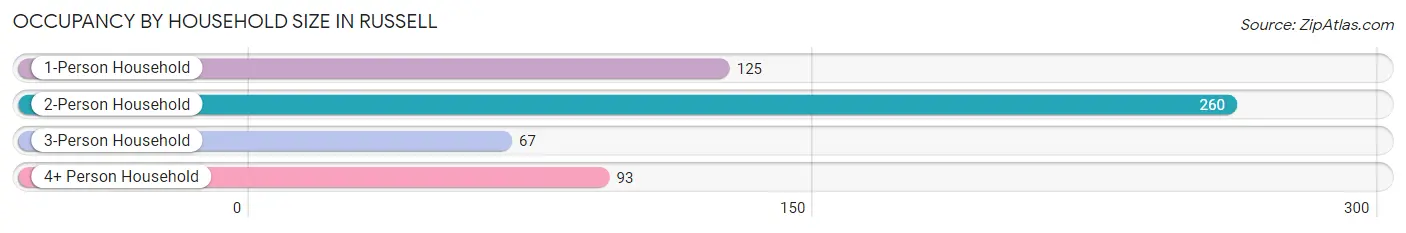
| Household Size | # Housing Units | % Housing Units |
| 1-Person Household | 125 | 22.9% |
| 2-Person Household | 260 | 47.7% |
| 3-Person Household | 67 | 12.3% |
| 4+ Person Household | 93 | 17.1% |
| Total Housing Units | 545 | 100.0% |
Occupancy by Ownership by Household Size in Russell
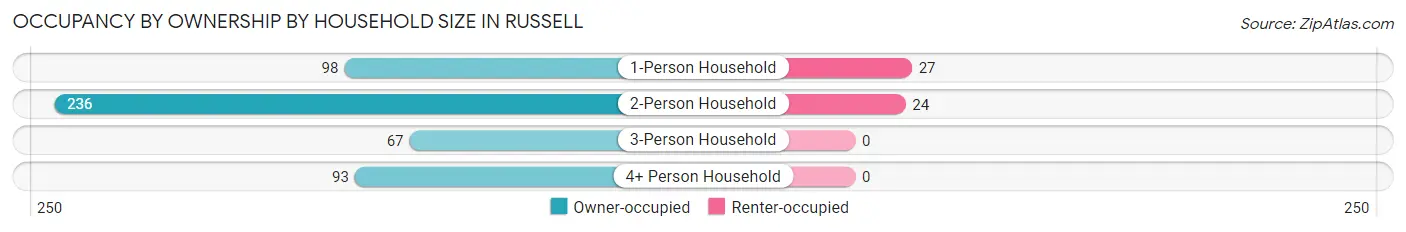
| Household Size | Owner-occupied | Renter-occupied |
| 1-Person Household | 98 (78.4%) | 27 (21.6%) |
| 2-Person Household | 236 (90.8%) | 24 (9.2%) |
| 3-Person Household | 67 (100.0%) | 0 (0.0%) |
| 4+ Person Household | 93 (100.0%) | 0 (0.0%) |
| Total Housing Units | 494 (90.6%) | 51 (9.4%) |
Occupancy by Educational Attainment in Russell
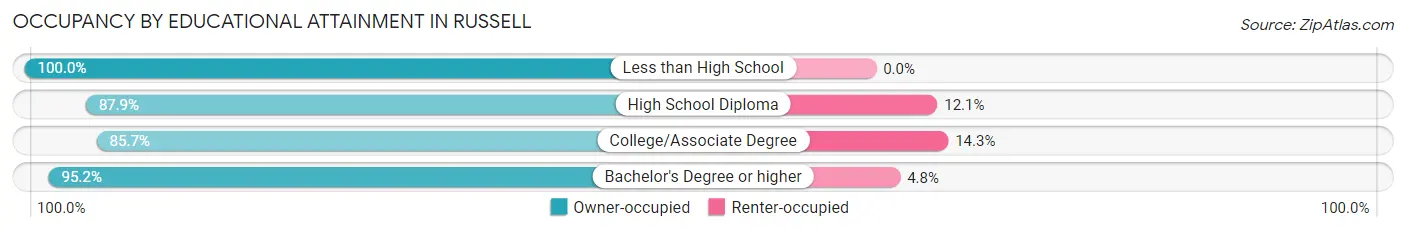
| Household Size | Owner-occupied | Renter-occupied |
| Less than High School | 14 (100.0%) | 0 (0.0%) |
| High School Diploma | 116 (87.9%) | 16 (12.1%) |
| College/Associate Degree | 144 (85.7%) | 24 (14.3%) |
| Bachelor's Degree or higher | 220 (95.2%) | 11 (4.8%) |
Occupancy by Age of Householder in Russell
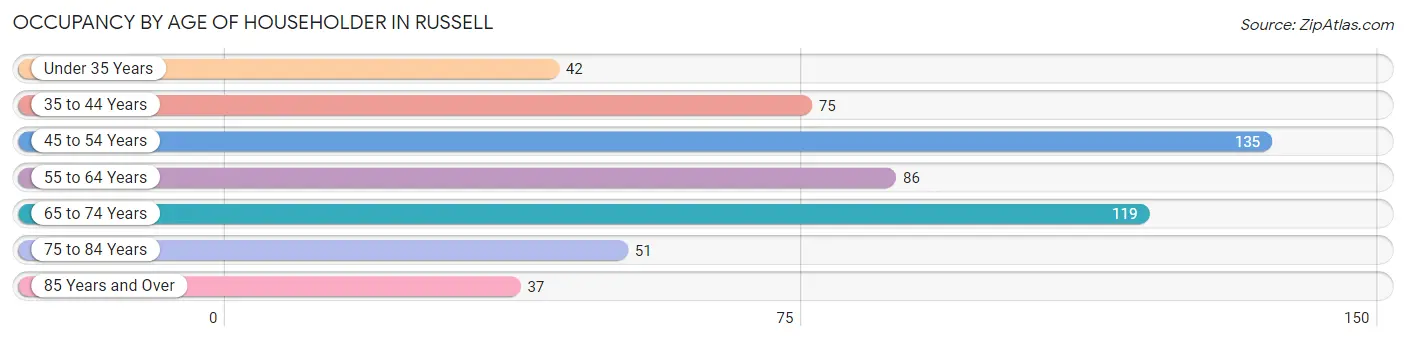
| Age Bracket | # Households | % Households |
| Under 35 Years | 42 | 7.7% |
| 35 to 44 Years | 75 | 13.8% |
| 45 to 54 Years | 135 | 24.8% |
| 55 to 64 Years | 86 | 15.8% |
| 65 to 74 Years | 119 | 21.8% |
| 75 to 84 Years | 51 | 9.4% |
| 85 Years and Over | 37 | 6.8% |
| Total | 545 | 100.0% |
Housing Finances in Russell
Median Income by Occupancy in Russell
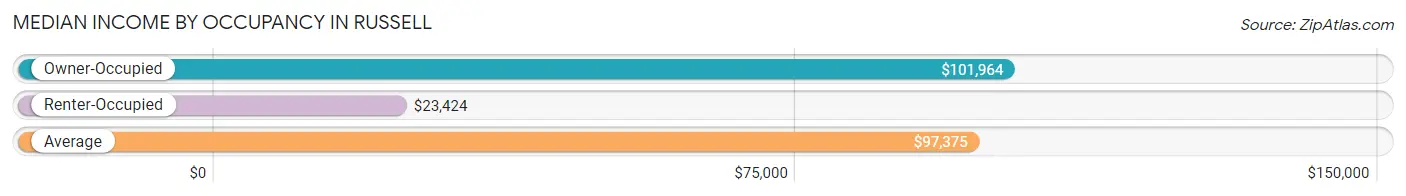
| Occupancy Type | # Households | Median Income |
| Owner-Occupied | 494 (90.6%) | $101,964 |
| Renter-Occupied | 51 (9.4%) | $23,424 |
| Average | 545 (100.0%) | $97,375 |
Occupancy by Householder Income Bracket in Russell
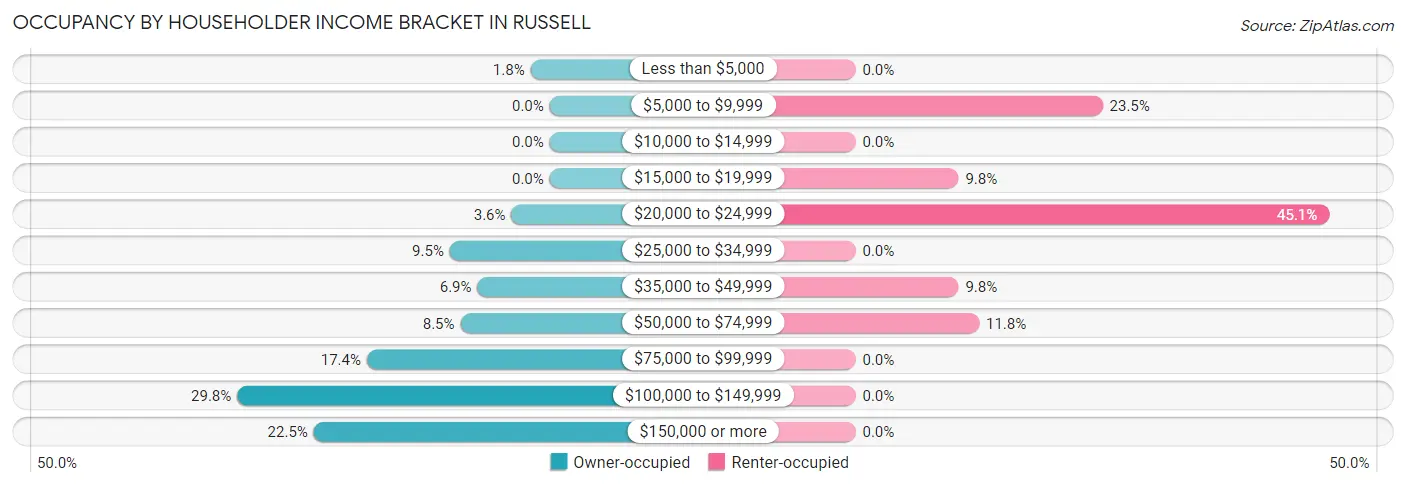
| Income Bracket | Owner-occupied | Renter-occupied |
| Less than $5,000 | 9 (1.8%) | 0 (0.0%) |
| $5,000 to $9,999 | 0 (0.0%) | 12 (23.5%) |
| $10,000 to $14,999 | 0 (0.0%) | 0 (0.0%) |
| $15,000 to $19,999 | 0 (0.0%) | 5 (9.8%) |
| $20,000 to $24,999 | 18 (3.6%) | 23 (45.1%) |
| $25,000 to $34,999 | 47 (9.5%) | 0 (0.0%) |
| $35,000 to $49,999 | 34 (6.9%) | 5 (9.8%) |
| $50,000 to $74,999 | 42 (8.5%) | 6 (11.8%) |
| $75,000 to $99,999 | 86 (17.4%) | 0 (0.0%) |
| $100,000 to $149,999 | 147 (29.8%) | 0 (0.0%) |
| $150,000 or more | 111 (22.5%) | 0 (0.0%) |
| Total | 494 (100.0%) | 51 (100.0%) |
Monthly Housing Cost Tiers in Russell
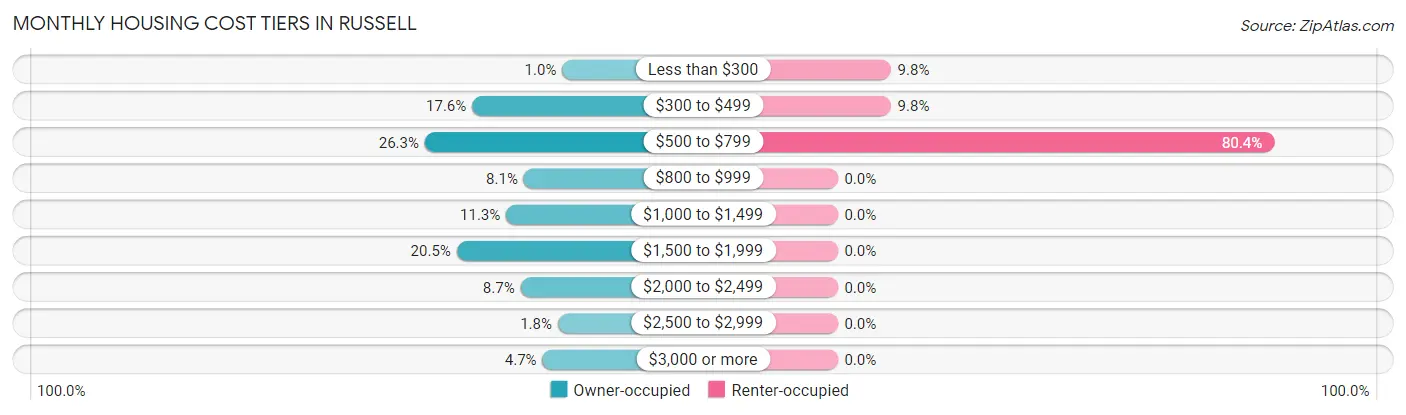
| Monthly Cost | Owner-occupied | Renter-occupied |
| Less than $300 | 5 (1.0%) | 5 (9.8%) |
| $300 to $499 | 87 (17.6%) | 5 (9.8%) |
| $500 to $799 | 130 (26.3%) | 41 (80.4%) |
| $800 to $999 | 40 (8.1%) | 0 (0.0%) |
| $1,000 to $1,499 | 56 (11.3%) | 0 (0.0%) |
| $1,500 to $1,999 | 101 (20.4%) | 0 (0.0%) |
| $2,000 to $2,499 | 43 (8.7%) | 0 (0.0%) |
| $2,500 to $2,999 | 9 (1.8%) | 0 (0.0%) |
| $3,000 or more | 23 (4.7%) | 0 (0.0%) |
| Total | 494 (100.0%) | 51 (100.0%) |
Physical Housing Characteristics in Russell
Housing Structures in Russell
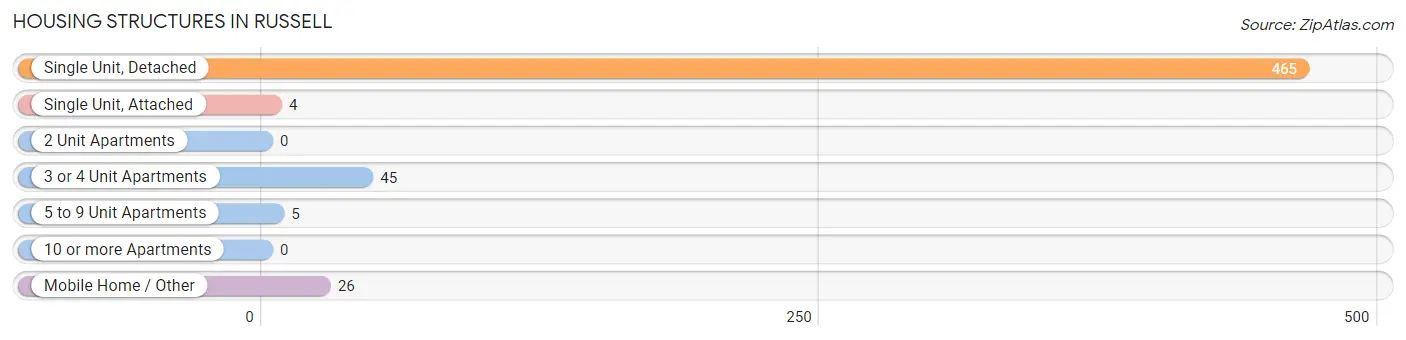
| Structure Type | # Housing Units | % Housing Units |
| Single Unit, Detached | 465 | 85.3% |
| Single Unit, Attached | 4 | 0.7% |
| 2 Unit Apartments | 0 | 0.0% |
| 3 or 4 Unit Apartments | 45 | 8.3% |
| 5 to 9 Unit Apartments | 5 | 0.9% |
| 10 or more Apartments | 0 | 0.0% |
| Mobile Home / Other | 26 | 4.8% |
| Total | 545 | 100.0% |
Housing Structures by Occupancy in Russell
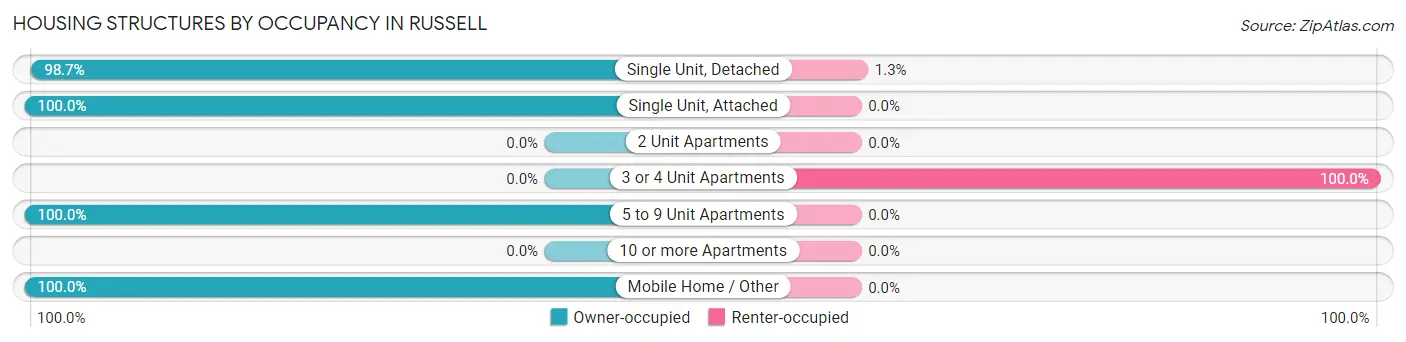
| Structure Type | Owner-occupied | Renter-occupied |
| Single Unit, Detached | 459 (98.7%) | 6 (1.3%) |
| Single Unit, Attached | 4 (100.0%) | 0 (0.0%) |
| 2 Unit Apartments | 0 (0.0%) | 0 (0.0%) |
| 3 or 4 Unit Apartments | 0 (0.0%) | 45 (100.0%) |
| 5 to 9 Unit Apartments | 5 (100.0%) | 0 (0.0%) |
| 10 or more Apartments | 0 (0.0%) | 0 (0.0%) |
| Mobile Home / Other | 26 (100.0%) | 0 (0.0%) |
| Total | 494 (90.6%) | 51 (9.4%) |
Housing Structures by Number of Rooms in Russell
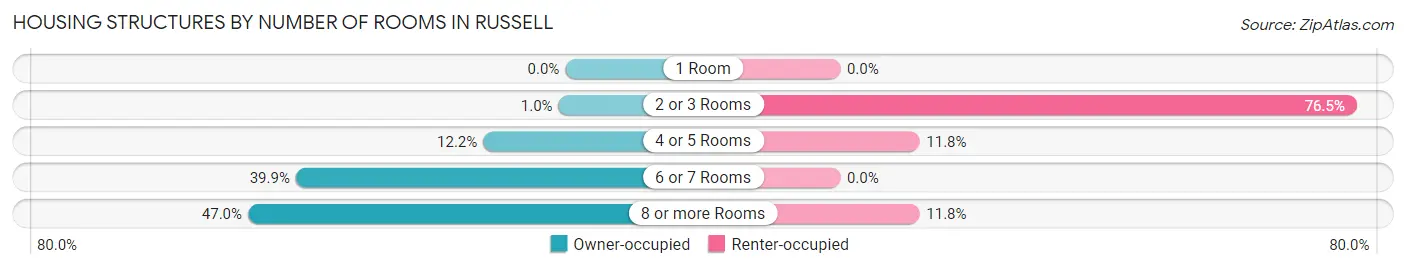
| Number of Rooms | Owner-occupied | Renter-occupied |
| 1 Room | 0 (0.0%) | 0 (0.0%) |
| 2 or 3 Rooms | 5 (1.0%) | 39 (76.5%) |
| 4 or 5 Rooms | 60 (12.1%) | 6 (11.8%) |
| 6 or 7 Rooms | 197 (39.9%) | 0 (0.0%) |
| 8 or more Rooms | 232 (47.0%) | 6 (11.8%) |
| Total | 494 (100.0%) | 51 (100.0%) |
Housing Structure by Heating Type in Russell
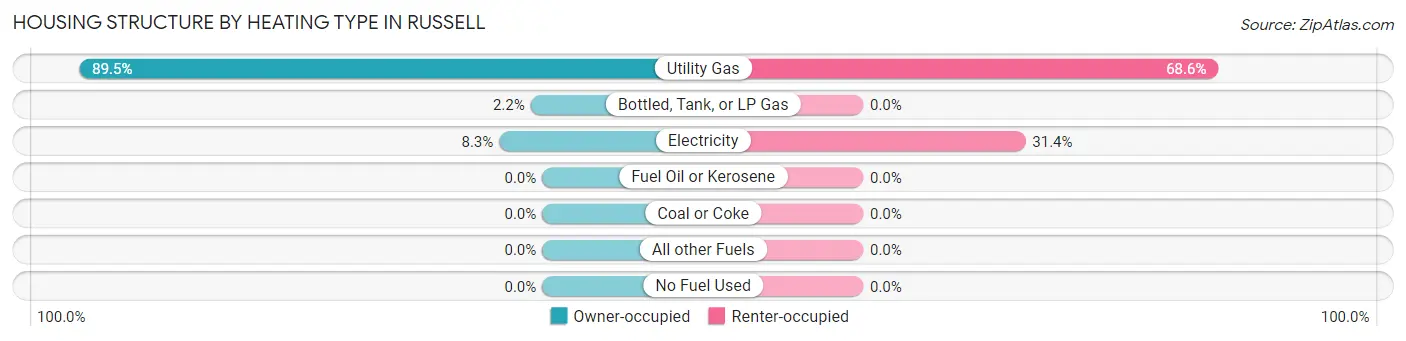
| Heating Type | Owner-occupied | Renter-occupied |
| Utility Gas | 442 (89.5%) | 35 (68.6%) |
| Bottled, Tank, or LP Gas | 11 (2.2%) | 0 (0.0%) |
| Electricity | 41 (8.3%) | 16 (31.4%) |
| Fuel Oil or Kerosene | 0 (0.0%) | 0 (0.0%) |
| Coal or Coke | 0 (0.0%) | 0 (0.0%) |
| All other Fuels | 0 (0.0%) | 0 (0.0%) |
| No Fuel Used | 0 (0.0%) | 0 (0.0%) |
| Total | 494 (100.0%) | 51 (100.0%) |
Household Vehicle Usage in Russell
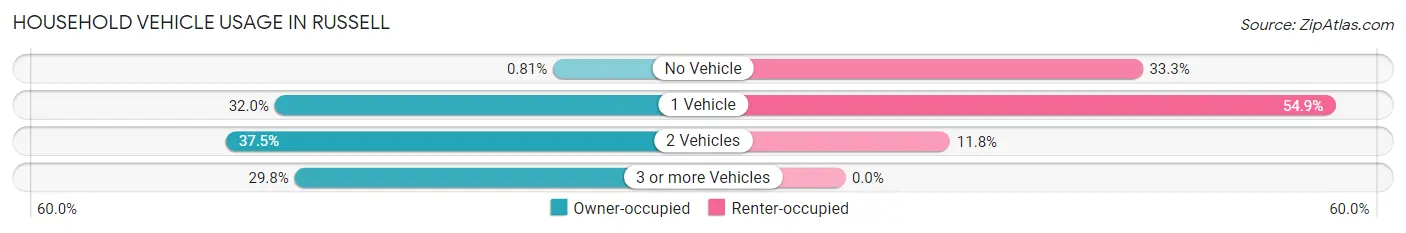
| Vehicles per Household | Owner-occupied | Renter-occupied |
| No Vehicle | 4 (0.8%) | 17 (33.3%) |
| 1 Vehicle | 158 (32.0%) | 28 (54.9%) |
| 2 Vehicles | 185 (37.4%) | 6 (11.8%) |
| 3 or more Vehicles | 147 (29.8%) | 0 (0.0%) |
| Total | 494 (100.0%) | 51 (100.0%) |
Real Estate & Mortgages in Russell
Real Estate and Mortgage Overview in Russell
| Characteristic | Without Mortgage | With Mortgage |
| Housing Units | 248 | 246 |
| Median Property Value | $173,800 | $229,500 |
| Median Household Income | $66,875 | $90 |
| Monthly Housing Costs | $540 | $23 |
| Real Estate Taxes | $2,529 | $0 |
Property Value by Mortgage Status in Russell
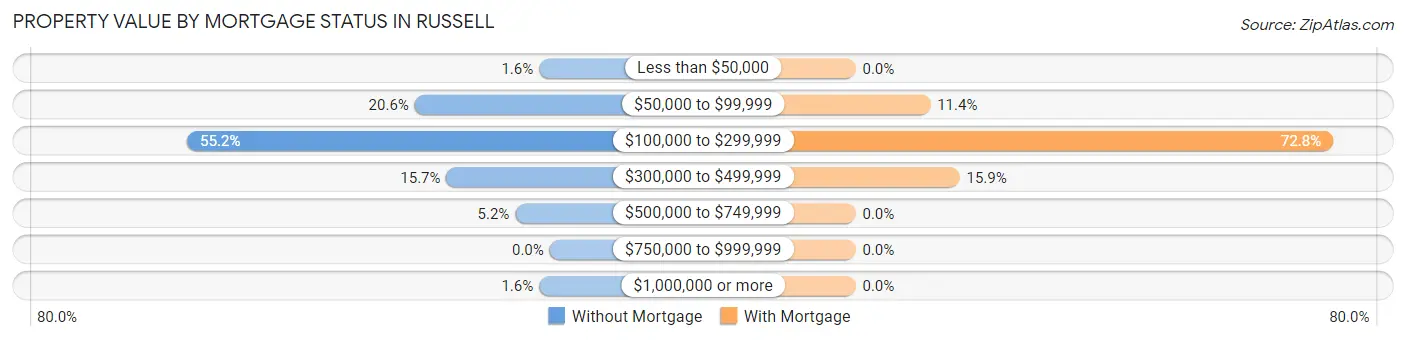
| Property Value | Without Mortgage | With Mortgage |
| Less than $50,000 | 4 (1.6%) | 0 (0.0%) |
| $50,000 to $99,999 | 51 (20.6%) | 28 (11.4%) |
| $100,000 to $299,999 | 137 (55.2%) | 179 (72.8%) |
| $300,000 to $499,999 | 39 (15.7%) | 39 (15.9%) |
| $500,000 to $749,999 | 13 (5.2%) | 0 (0.0%) |
| $750,000 to $999,999 | 0 (0.0%) | 0 (0.0%) |
| $1,000,000 or more | 4 (1.6%) | 0 (0.0%) |
| Total | 248 (100.0%) | 246 (100.0%) |
Household Income by Mortgage Status in Russell
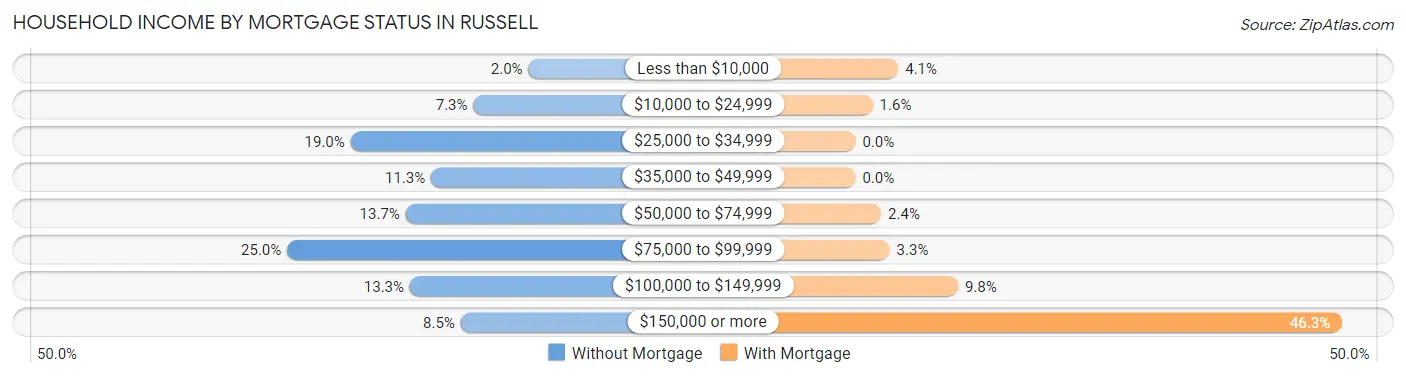
| Household Income | Without Mortgage | With Mortgage |
| Less than $10,000 | 5 (2.0%) | 10 (4.1%) |
| $10,000 to $24,999 | 18 (7.3%) | 4 (1.6%) |
| $25,000 to $34,999 | 47 (19.0%) | 0 (0.0%) |
| $35,000 to $49,999 | 28 (11.3%) | 0 (0.0%) |
| $50,000 to $74,999 | 34 (13.7%) | 6 (2.4%) |
| $75,000 to $99,999 | 62 (25.0%) | 8 (3.3%) |
| $100,000 to $149,999 | 33 (13.3%) | 24 (9.8%) |
| $150,000 or more | 21 (8.5%) | 114 (46.3%) |
| Total | 248 (100.0%) | 246 (100.0%) |
Property Value to Household Income Ratio in Russell
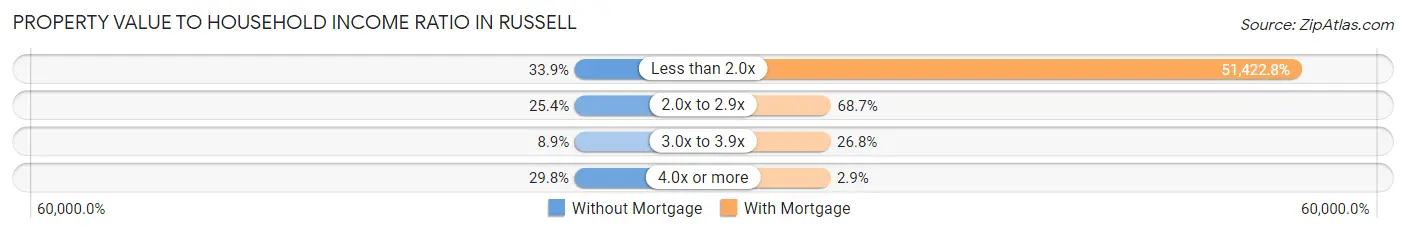
| Value-to-Income Ratio | Without Mortgage | With Mortgage |
| Less than 2.0x | 84 (33.9%) | 126,500 (51,422.8%) |
| 2.0x to 2.9x | 63 (25.4%) | 169 (68.7%) |
| 3.0x to 3.9x | 22 (8.9%) | 66 (26.8%) |
| 4.0x or more | 74 (29.8%) | 7 (2.9%) |
| Total | 248 (100.0%) | 246 (100.0%) |
Real Estate Taxes by Mortgage Status in Russell
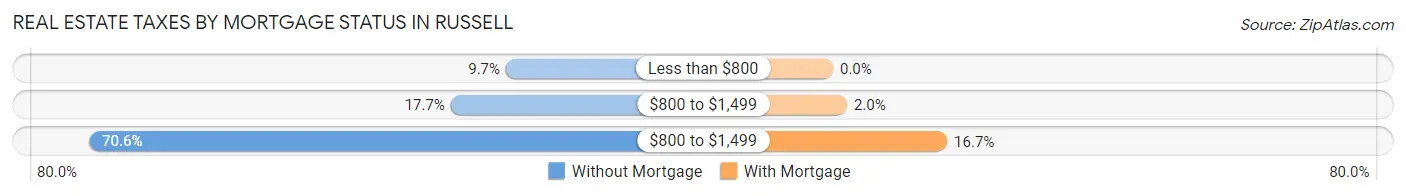
| Property Taxes | Without Mortgage | With Mortgage |
| Less than $800 | 24 (9.7%) | 0 (0.0%) |
| $800 to $1,499 | 44 (17.7%) | 5 (2.0%) |
| $800 to $1,499 | 175 (70.6%) | 41 (16.7%) |
| Total | 248 (100.0%) | 246 (100.0%) |
Health & Disability in Russell
Health Insurance Coverage by Age in Russell
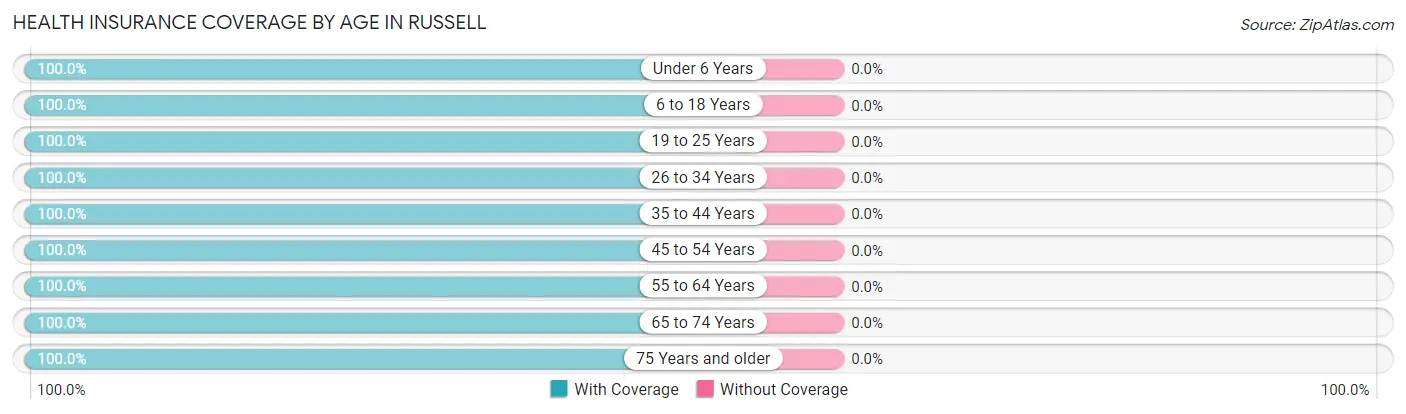
| Age Bracket | With Coverage | Without Coverage |
| Under 6 Years | 59 (100.0%) | 0 (0.0%) |
| 6 to 18 Years | 197 (100.0%) | 0 (0.0%) |
| 19 to 25 Years | 82 (100.0%) | 0 (0.0%) |
| 26 to 34 Years | 89 (100.0%) | 0 (0.0%) |
| 35 to 44 Years | 149 (100.0%) | 0 (0.0%) |
| 45 to 54 Years | 251 (100.0%) | 0 (0.0%) |
| 55 to 64 Years | 171 (100.0%) | 0 (0.0%) |
| 65 to 74 Years | 234 (100.0%) | 0 (0.0%) |
| 75 Years and older | 110 (100.0%) | 0 (0.0%) |
| Total | 1,342 (100.0%) | 0 (0.0%) |
Health Insurance Coverage by Citizenship Status in Russell
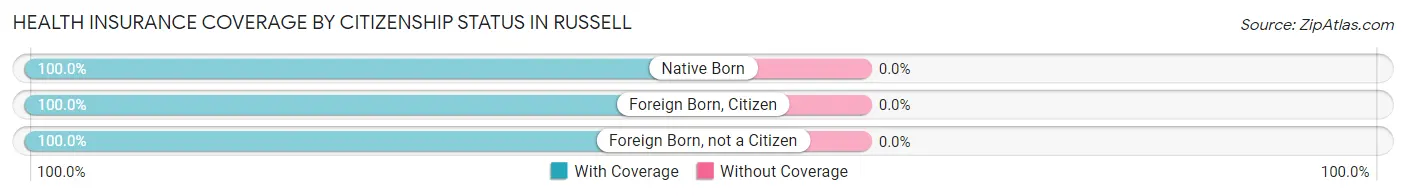
| Citizenship Status | With Coverage | Without Coverage |
| Native Born | 59 (100.0%) | 0 (0.0%) |
| Foreign Born, Citizen | 197 (100.0%) | 0 (0.0%) |
| Foreign Born, not a Citizen | 82 (100.0%) | 0 (0.0%) |
Health Insurance Coverage by Household Income in Russell
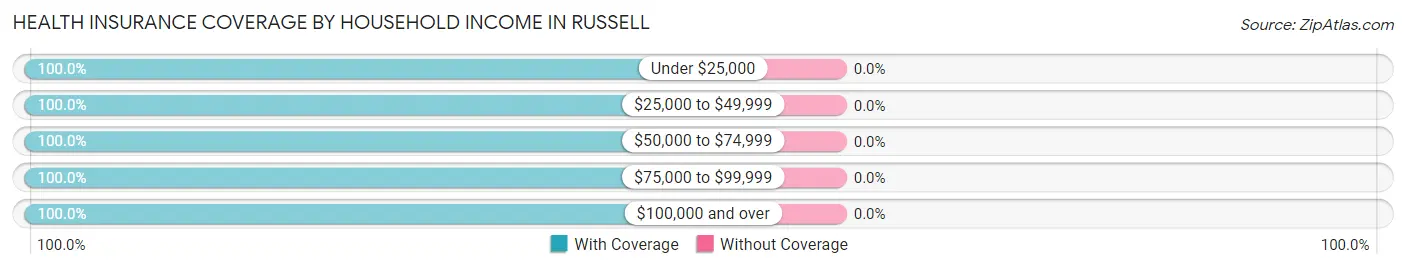
| Household Income | With Coverage | Without Coverage |
| Under $25,000 | 97 (100.0%) | 0 (0.0%) |
| $25,000 to $49,999 | 111 (100.0%) | 0 (0.0%) |
| $50,000 to $74,999 | 98 (100.0%) | 0 (0.0%) |
| $75,000 to $99,999 | 206 (100.0%) | 0 (0.0%) |
| $100,000 and over | 830 (100.0%) | 0 (0.0%) |
Public vs Private Health Insurance Coverage by Age in Russell
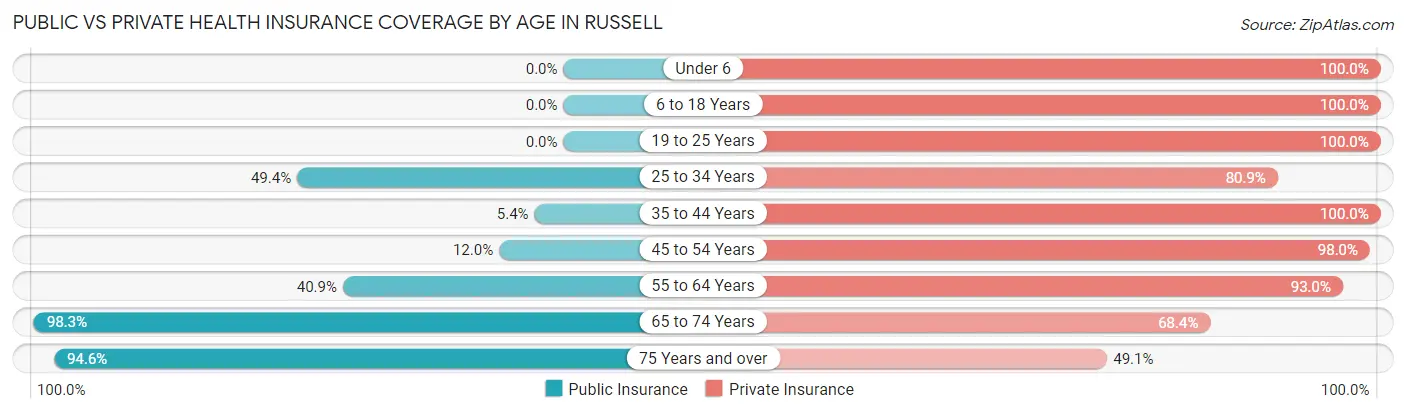
| Age Bracket | Public Insurance | Private Insurance |
| Under 6 | 0 (0.0%) | 59 (100.0%) |
| 6 to 18 Years | 0 (0.0%) | 197 (100.0%) |
| 19 to 25 Years | 0 (0.0%) | 82 (100.0%) |
| 25 to 34 Years | 44 (49.4%) | 72 (80.9%) |
| 35 to 44 Years | 8 (5.4%) | 149 (100.0%) |
| 45 to 54 Years | 30 (11.9%) | 246 (98.0%) |
| 55 to 64 Years | 70 (40.9%) | 159 (93.0%) |
| 65 to 74 Years | 230 (98.3%) | 160 (68.4%) |
| 75 Years and over | 104 (94.6%) | 54 (49.1%) |
| Total | 486 (36.2%) | 1,178 (87.8%) |
Disability Status by Sex by Age in Russell
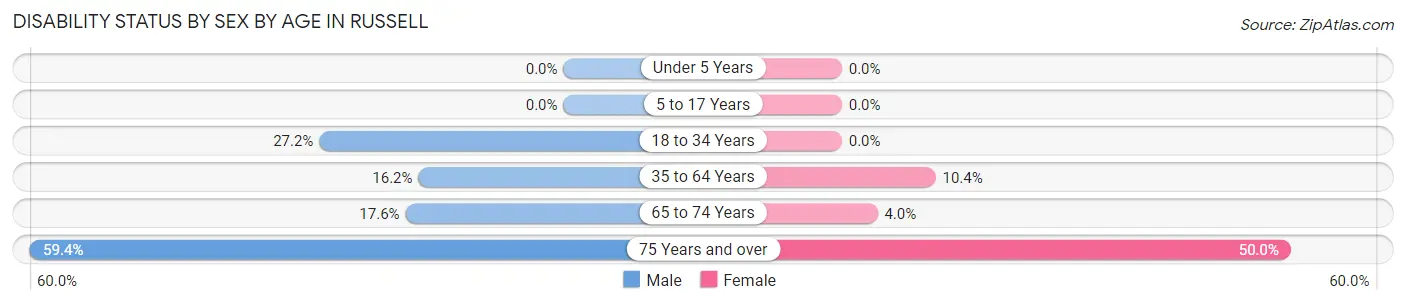
| Age Bracket | Male | Female |
| Under 5 Years | 0 (0.0%) | 0 (0.0%) |
| 5 to 17 Years | 0 (0.0%) | 0 (0.0%) |
| 18 to 34 Years | 31 (27.2%) | 0 (0.0%) |
| 35 to 64 Years | 52 (16.2%) | 26 (10.4%) |
| 65 to 74 Years | 19 (17.6%) | 5 (4.0%) |
| 75 Years and over | 38 (59.4%) | 23 (50.0%) |
Disability Class by Sex by Age in Russell
Disability Class: Hearing Difficulty
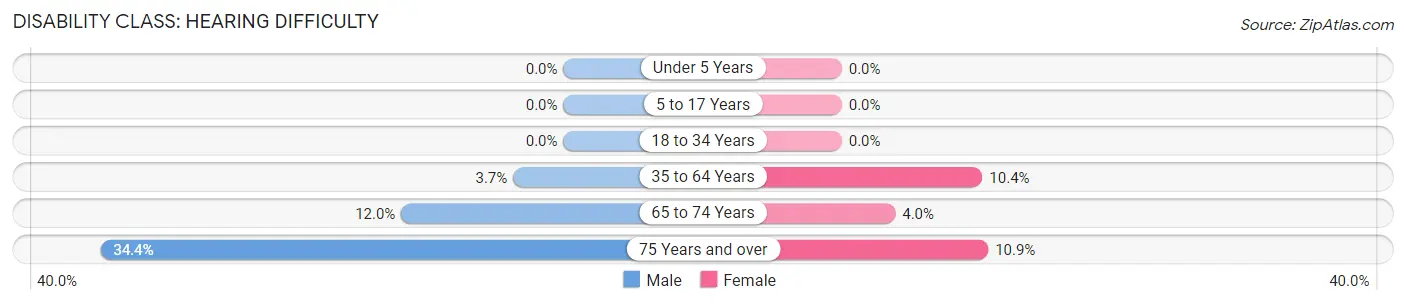
| Age Bracket | Male | Female |
| Under 5 Years | 0 (0.0%) | 0 (0.0%) |
| 5 to 17 Years | 0 (0.0%) | 0 (0.0%) |
| 18 to 34 Years | 0 (0.0%) | 0 (0.0%) |
| 35 to 64 Years | 12 (3.7%) | 26 (10.4%) |
| 65 to 74 Years | 13 (12.0%) | 5 (4.0%) |
| 75 Years and over | 22 (34.4%) | 5 (10.9%) |
Disability Class: Vision Difficulty
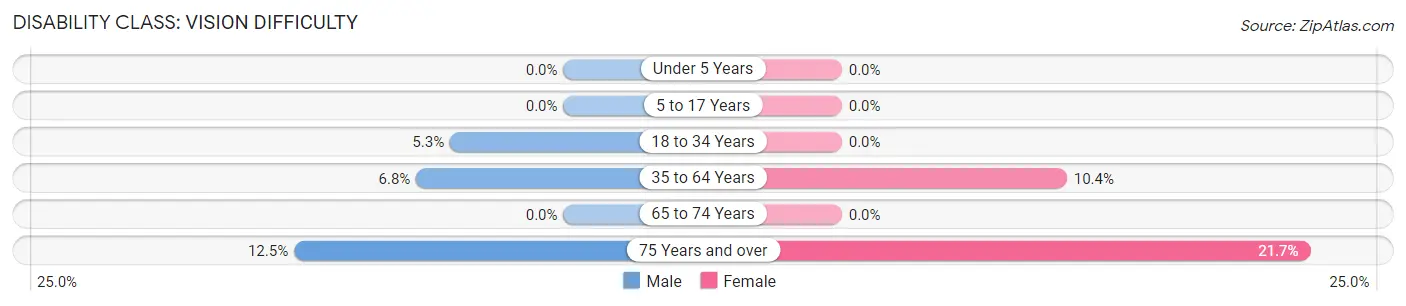
| Age Bracket | Male | Female |
| Under 5 Years | 0 (0.0%) | 0 (0.0%) |
| 5 to 17 Years | 0 (0.0%) | 0 (0.0%) |
| 18 to 34 Years | 6 (5.3%) | 0 (0.0%) |
| 35 to 64 Years | 22 (6.8%) | 26 (10.4%) |
| 65 to 74 Years | 0 (0.0%) | 0 (0.0%) |
| 75 Years and over | 8 (12.5%) | 10 (21.7%) |
Disability Class: Cognitive Difficulty
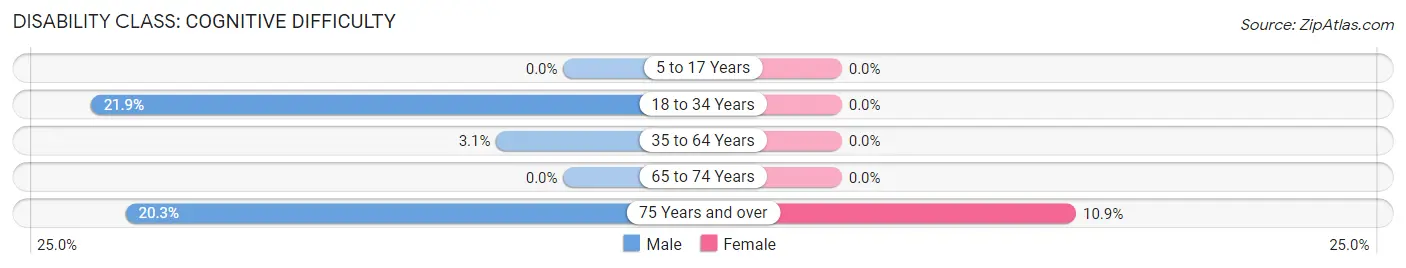
| Age Bracket | Male | Female |
| 5 to 17 Years | 0 (0.0%) | 0 (0.0%) |
| 18 to 34 Years | 25 (21.9%) | 0 (0.0%) |
| 35 to 64 Years | 10 (3.1%) | 0 (0.0%) |
| 65 to 74 Years | 0 (0.0%) | 0 (0.0%) |
| 75 Years and over | 13 (20.3%) | 5 (10.9%) |
Disability Class: Ambulatory Difficulty
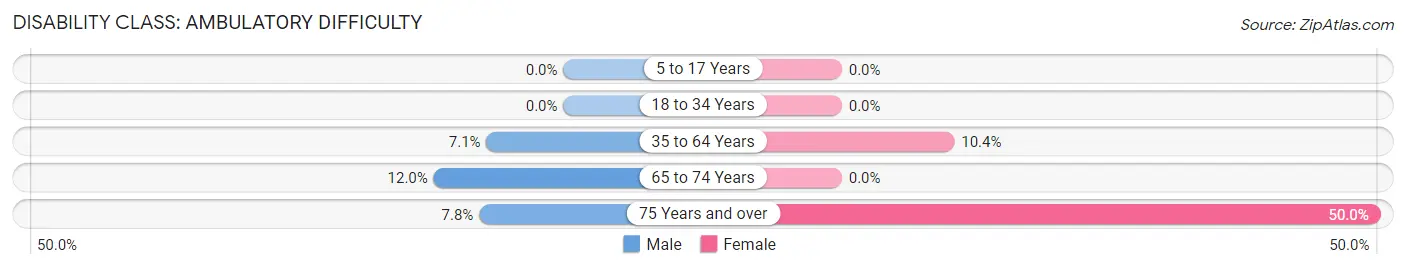
| Age Bracket | Male | Female |
| 5 to 17 Years | 0 (0.0%) | 0 (0.0%) |
| 18 to 34 Years | 0 (0.0%) | 0 (0.0%) |
| 35 to 64 Years | 23 (7.1%) | 26 (10.4%) |
| 65 to 74 Years | 13 (12.0%) | 0 (0.0%) |
| 75 Years and over | 5 (7.8%) | 23 (50.0%) |
Disability Class: Self-Care Difficulty
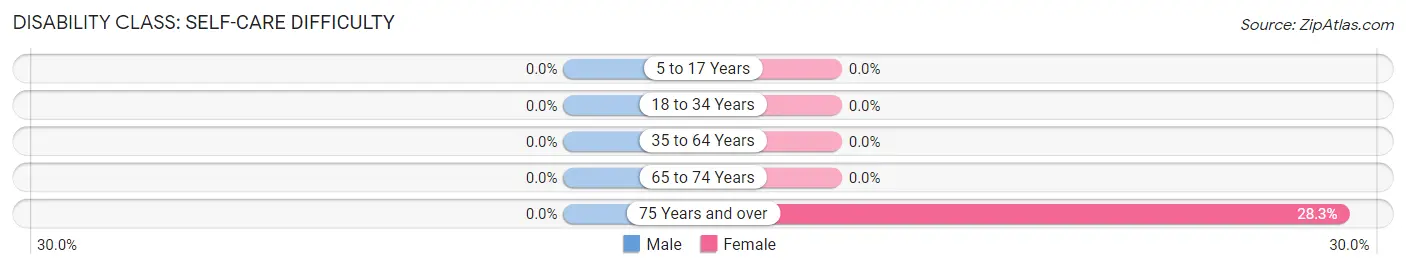
| Age Bracket | Male | Female |
| 5 to 17 Years | 0 (0.0%) | 0 (0.0%) |
| 18 to 34 Years | 0 (0.0%) | 0 (0.0%) |
| 35 to 64 Years | 0 (0.0%) | 0 (0.0%) |
| 65 to 74 Years | 0 (0.0%) | 0 (0.0%) |
| 75 Years and over | 0 (0.0%) | 13 (28.3%) |
Technology Access in Russell
Computing Device Access in Russell
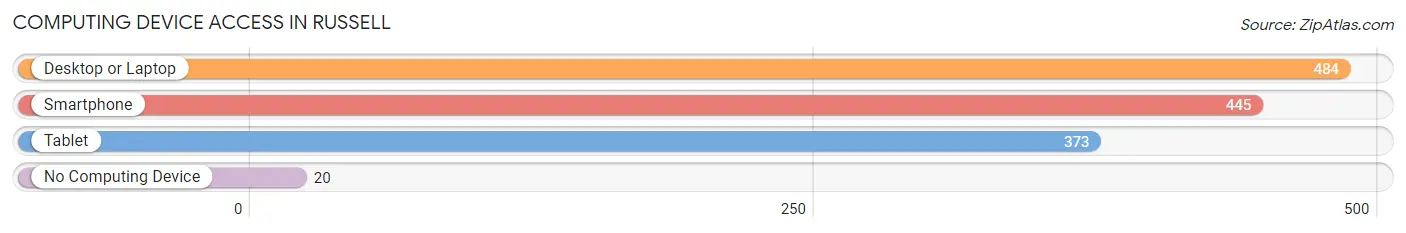
| Device Type | # Households | % Households |
| Desktop or Laptop | 484 | 88.8% |
| Smartphone | 445 | 81.7% |
| Tablet | 373 | 68.4% |
| No Computing Device | 20 | 3.7% |
| Total | 545 | 100.0% |
Internet Access in Russell
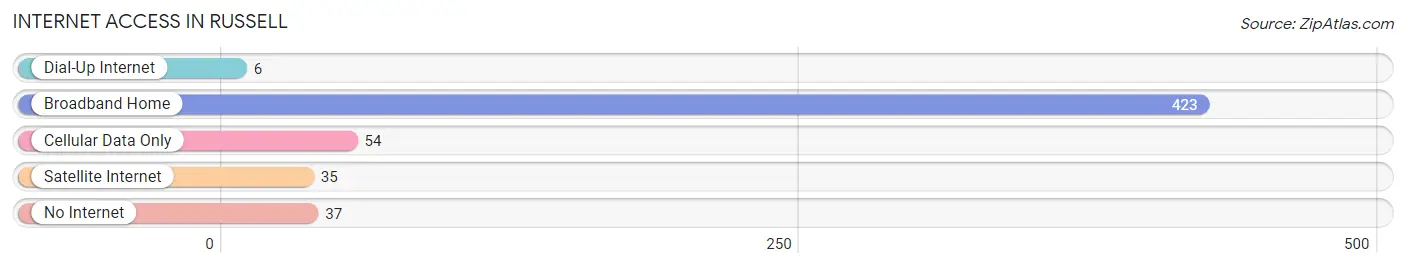
| Internet Type | # Households | % Households |
| Dial-Up Internet | 6 | 1.1% |
| Broadband Home | 423 | 77.6% |
| Cellular Data Only | 54 | 9.9% |
| Satellite Internet | 35 | 6.4% |
| No Internet | 37 | 6.8% |
| Total | 545 | 100.0% |
Russell Summary
Russell, Pennsylvania is a borough located in Warren County, Pennsylvania. It is situated in the northwestern corner of the state, near the border of New York. The population of Russell was 1,845 at the 2010 census.
History
The area that is now Russell was first settled in the late 1700s by a group of settlers from Connecticut. The town was originally known as "Connecticut Settlement" and was later renamed "Russell" after a local landowner, William Russell. The town was officially incorporated in 1837.
In the late 1800s, Russell was a thriving lumber town. The town was home to several sawmills and lumber companies, which provided employment for many of the town's residents. The lumber industry declined in the early 1900s, and the town's economy shifted to agriculture.
Geography
Russell is located in northwestern Pennsylvania, near the border of New York. The borough is situated in the Allegheny Plateau region of the state. The terrain is mostly hilly and forested, with some areas of flat land. The town is located in the Allegheny River watershed.
The climate in Russell is humid continental, with cold winters and warm summers. The average annual temperature is around 50°F (10°C). The average annual precipitation is around 40 inches (101 cm).
Economy
The economy of Russell is largely based on agriculture and tourism. The town is home to several farms, which produce a variety of crops, including corn, soybeans, hay, and wheat. The town is also home to several wineries, which attract tourists from all over the region.
In addition to agriculture and tourism, Russell is home to several small businesses, including restaurants, retail stores, and service providers. The town is also home to a few manufacturing companies, which produce a variety of products, including furniture, clothing, and automotive parts.
Demographics
As of the 2010 census, the population of Russell was 1,845. The racial makeup of the town was 97.3% White, 0.7% African American, 0.2% Native American, 0.2% Asian, 0.2% from other races, and 1.4% from two or more races. Hispanic or Latino of any race were 0.7% of the population.
The median household income in Russell was $37,917, and the median family income was $45,938. The per capita income was $19,945. About 11.2% of families and 14.2% of the population were below the poverty line, including 19.2% of those under age 18 and 8.2% of those age 65 or over.
Common Questions
What is Per Capita Income in Russell?
Per Capita income in Russell is $46,901.
What is the Median Family Income in Russell?
Median Family Income in Russell is $107,500.
What is the Median Household income in Russell?
Median Household Income in Russell is $97,375.
What is Income or Wage Gap in Russell?
Income or Wage Gap in Russell is 21.2%.
Women in Russell earn 78.8 cents for every dollar earned by a man.
What is Inequality or Gini Index in Russell?
Inequality or Gini Index in Russell is 0.44.
What is the Total Population of Russell?
Total Population of Russell is 1,342.
What is the Total Male Population of Russell?
Total Male Population of Russell is 711.
What is the Total Female Population of Russell?
Total Female Population of Russell is 631.
What is the Ratio of Males per 100 Females in Russell?
There are 112.68 Males per 100 Females in Russell.
What is the Ratio of Females per 100 Males in Russell?
There are 88.75 Females per 100 Males in Russell.
What is the Median Population Age in Russell?
Median Population Age in Russell is 49.5 Years.
What is the Average Family Size in Russell
Average Family Size in Russell is 3.0 People.
What is the Average Household Size in Russell
Average Household Size in Russell is 2.5 People.
How Large is the Labor Force in Russell?
There are 720 People in the Labor Forcein in Russell.
What is the Percentage of People in the Labor Force in Russell?
63.5% of People are in the Labor Force in Russell.
What is the Unemployment Rate in Russell?
Unemployment Rate in Russell is 4.6%.