Robinson, PA Map & Demographics
Robinson Map
Robinson Overview
$26,738
PER CAPITA INCOME
$85,167
AVG FAMILY INCOME
$47,083
AVG HOUSEHOLD INCOME
49.1%
WAGE / INCOME GAP [ % ]
50.9¢/ $1
WAGE / INCOME GAP [ $ ]
0.35
INEQUALITY / GINI INDEX
496
TOTAL POPULATION
261
MALE POPULATION
235
FEMALE POPULATION
111.06
MALES / 100 FEMALES
90.04
FEMALES / 100 MALES
39.4
MEDIAN AGE
3.0
AVG FAMILY SIZE
2.2
AVG HOUSEHOLD SIZE
178
LABOR FORCE [ PEOPLE ]
45.6%
PERCENT IN LABOR FORCE
3.4%
UNEMPLOYMENT RATE
Robinson Zip Codes
Robinson Area Codes
Income in Robinson
Income Overview in Robinson
Per Capita Income in Robinson is $26,738, while median incomes of families and households are $85,167 and $47,083 respectively.
| Characteristic | Number | Measure |
| Per Capita Income | 496 | $26,738 |
| Median Family Income | 128 | $85,167 |
| Mean Family Income | 128 | $79,185 |
| Median Household Income | 220 | $47,083 |
| Mean Household Income | 220 | $60,457 |
| Income Deficit | 128 | $0 |
| Wage / Income Gap (%) | 496 | 49.05% |
| Wage / Income Gap ($) | 496 | 50.95¢ per $1 |
| Gini / Inequality Index | 496 | 0.35 |
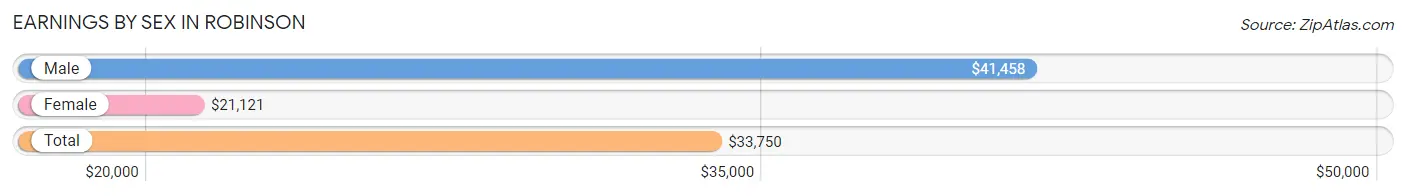
Earnings by Sex in Robinson
Average Earnings in Robinson are $33,750, $41,458 for men and $21,121 for women, a difference of 49.0%.
| Sex | Number | Average Earnings |
| Male | 83 (45.9%) | $41,458 |
| Female | 98 (54.1%) | $21,121 |
| Total | 181 (100.0%) | $33,750 |
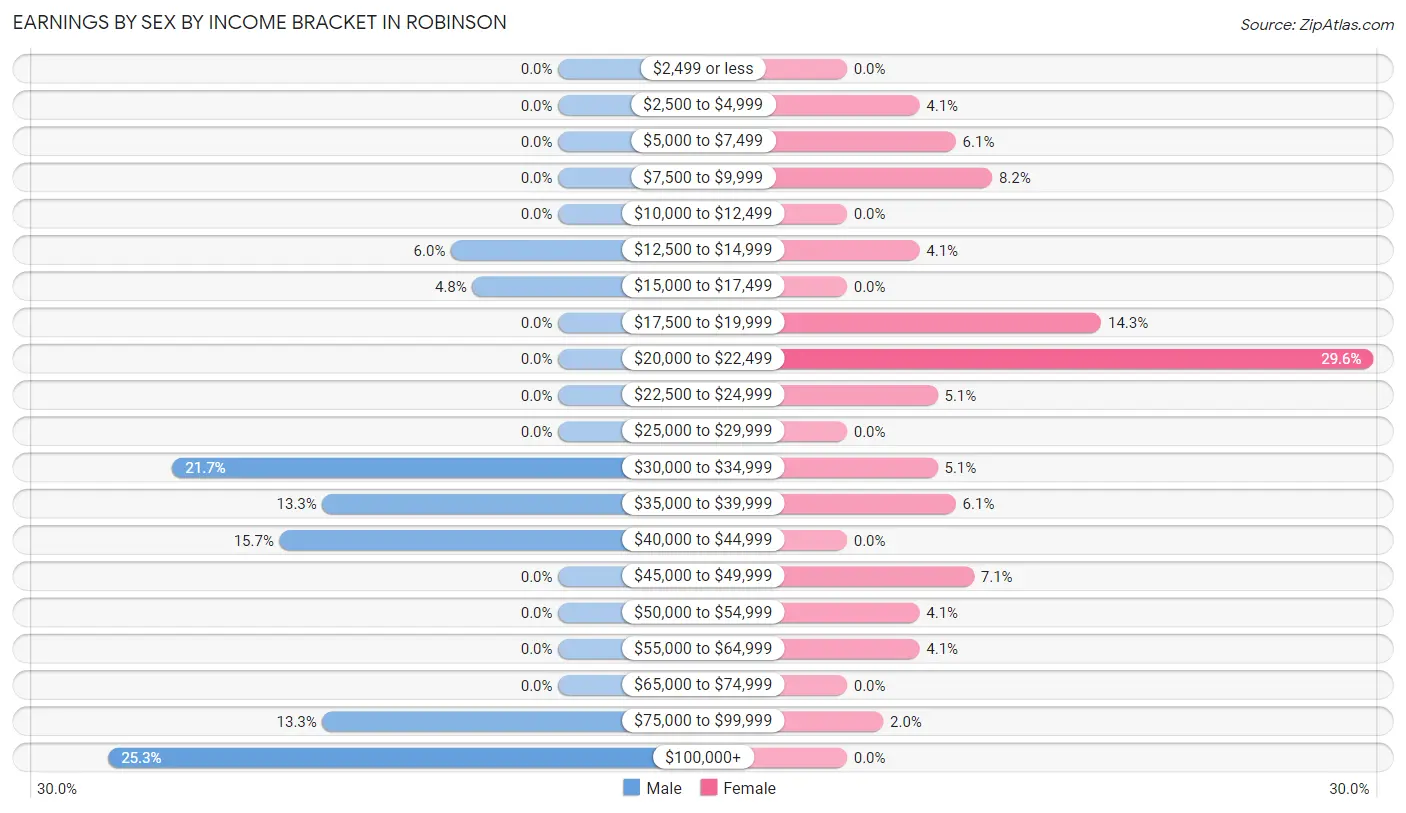
Earnings by Sex by Income Bracket in Robinson
The most common earnings brackets in Robinson are $100,000+ for men (21 | 25.3%) and $20,000 to $22,499 for women (29 | 29.6%).
| Income | Male | Female |
| $2,499 or less | 0 (0.0%) | 0 (0.0%) |
| $2,500 to $4,999 | 0 (0.0%) | 4 (4.1%) |
| $5,000 to $7,499 | 0 (0.0%) | 6 (6.1%) |
| $7,500 to $9,999 | 0 (0.0%) | 8 (8.2%) |
| $10,000 to $12,499 | 0 (0.0%) | 0 (0.0%) |
| $12,500 to $14,999 | 5 (6.0%) | 4 (4.1%) |
| $15,000 to $17,499 | 4 (4.8%) | 0 (0.0%) |
| $17,500 to $19,999 | 0 (0.0%) | 14 (14.3%) |
| $20,000 to $22,499 | 0 (0.0%) | 29 (29.6%) |
| $22,500 to $24,999 | 0 (0.0%) | 5 (5.1%) |
| $25,000 to $29,999 | 0 (0.0%) | 0 (0.0%) |
| $30,000 to $34,999 | 18 (21.7%) | 5 (5.1%) |
| $35,000 to $39,999 | 11 (13.3%) | 6 (6.1%) |
| $40,000 to $44,999 | 13 (15.7%) | 0 (0.0%) |
| $45,000 to $49,999 | 0 (0.0%) | 7 (7.1%) |
| $50,000 to $54,999 | 0 (0.0%) | 4 (4.1%) |
| $55,000 to $64,999 | 0 (0.0%) | 4 (4.1%) |
| $65,000 to $74,999 | 0 (0.0%) | 0 (0.0%) |
| $75,000 to $99,999 | 11 (13.3%) | 2 (2.0%) |
| $100,000+ | 21 (25.3%) | 0 (0.0%) |
| Total | 83 (100.0%) | 98 (100.0%) |
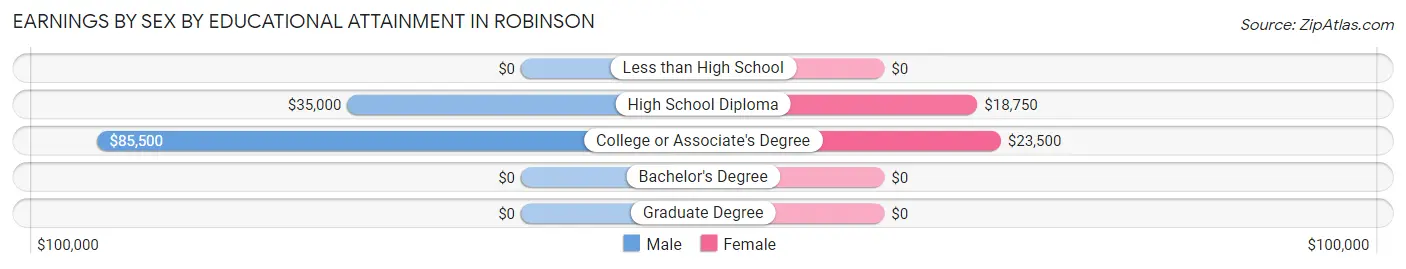
Earnings by Sex by Educational Attainment in Robinson
Average earnings in Robinson are $41,458 for men and $20,625 for women, a difference of 50.2%. Men with an educational attainment of college or associate's degree enjoy the highest average annual earnings of $85,500, while those with high school diploma education earn the least with $35,000. Women with an educational attainment of college or associate's degree earn the most with the average annual earnings of $23,500, while those with high school diploma education have the smallest earnings of $18,750.
| Educational Attainment | Male Income | Female Income |
| Less than High School | - | - |
| High School Diploma | $35,000 | $18,750 |
| College or Associate's Degree | $85,500 | $23,500 |
| Bachelor's Degree | - | - |
| Graduate Degree | - | - |
| Total | $41,458 | $20,625 |
Family Income in Robinson
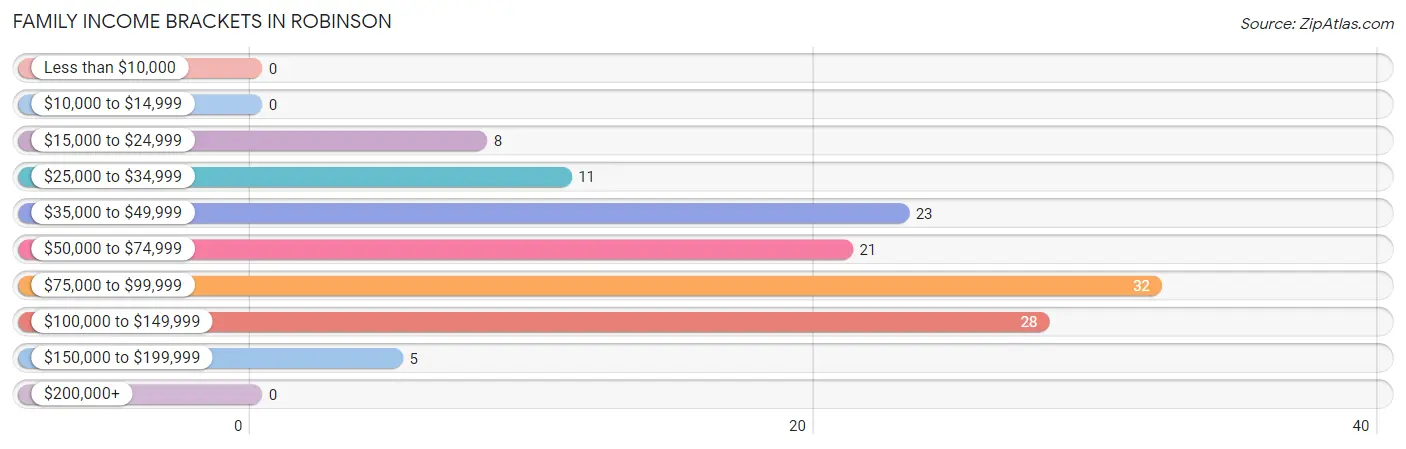
Family Income Brackets in Robinson
According to the Robinson family income data, there are 32 families falling into the $75,000 to $99,999 income range, which is the most common income bracket and makes up 25.0% of all families.
| Income Bracket | # Families | % Families |
| Less than $10,000 | 0 | 0.0% |
| $10,000 to $14,999 | 0 | 0.0% |
| $15,000 to $24,999 | 8 | 6.3% |
| $25,000 to $34,999 | 11 | 8.6% |
| $35,000 to $49,999 | 23 | 18.0% |
| $50,000 to $74,999 | 21 | 16.4% |
| $75,000 to $99,999 | 32 | 25.0% |
| $100,000 to $149,999 | 28 | 21.9% |
| $150,000 to $199,999 | 5 | 3.9% |
| $200,000+ | 0 | 0.0% |
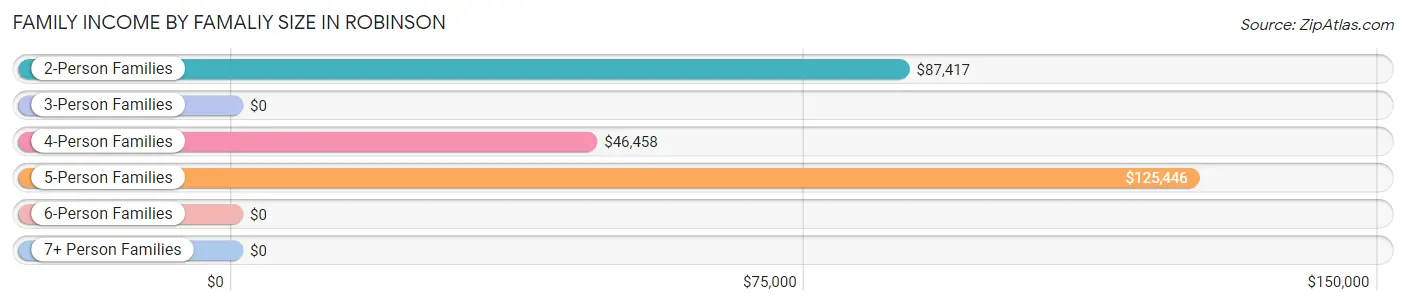
Family Income by Famaliy Size in Robinson
5-person families (23 | 18.0%) account for the highest median family income in Robinson with $125,446 per family, while 2-person families (73 | 57.0%) have the highest median income of $43,708 per family member.
| Income Bracket | # Families | Median Income |
| 2-Person Families | 73 (57.0%) | $87,417 |
| 3-Person Families | 17 (13.3%) | $0 |
| 4-Person Families | 15 (11.7%) | $46,458 |
| 5-Person Families | 23 (18.0%) | $125,446 |
| 6-Person Families | 0 (0.0%) | $0 |
| 7+ Person Families | 0 (0.0%) | $0 |
| Total | 128 (100.0%) | $85,167 |
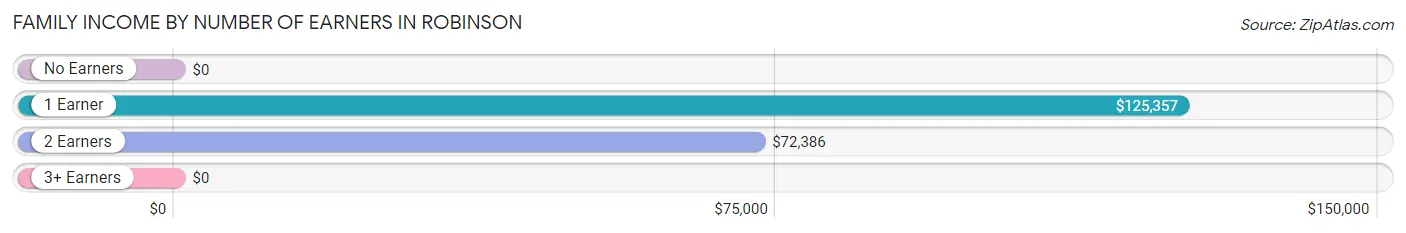
Family Income by Number of Earners in Robinson
| Number of Earners | # Families | Median Income |
| No Earners | 53 (41.4%) | $0 |
| 1 Earner | 24 (18.8%) | $125,357 |
| 2 Earners | 51 (39.8%) | $72,386 |
| 3+ Earners | 0 (0.0%) | $0 |
| Total | 128 (100.0%) | $85,167 |
Household Income in Robinson
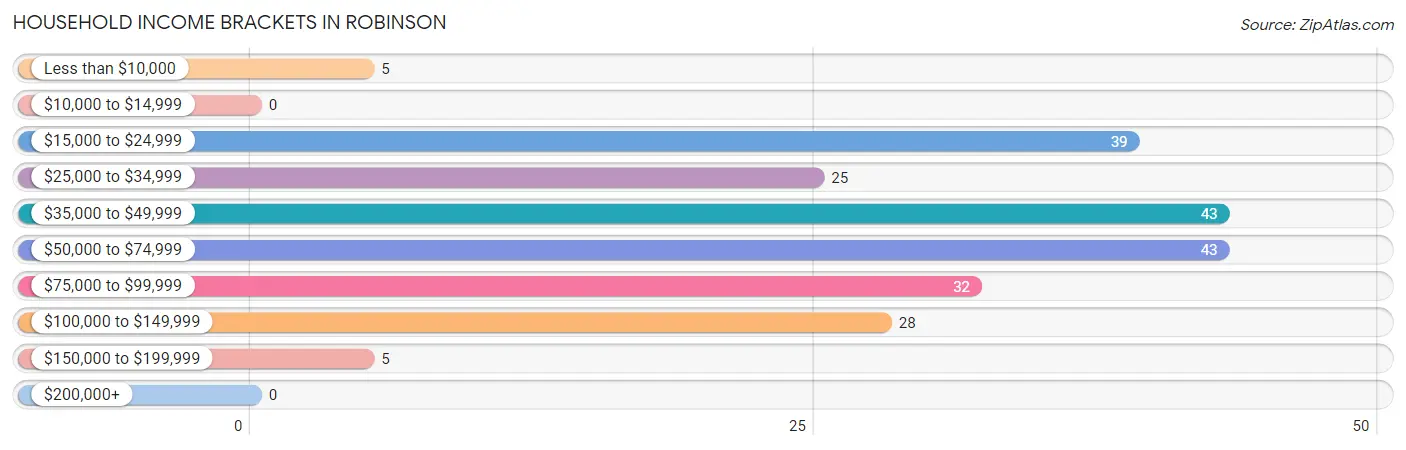
Household Income Brackets in Robinson
With 43 households falling in the category, the $35,000 to $49,999 income range is the most frequent in Robinson, accounting for 19.6% of all households.
| Income Bracket | # Households | % Households |
| Less than $10,000 | 5 | 2.3% |
| $10,000 to $14,999 | 0 | 0.0% |
| $15,000 to $24,999 | 39 | 17.7% |
| $25,000 to $34,999 | 25 | 11.4% |
| $35,000 to $49,999 | 43 | 19.5% |
| $50,000 to $74,999 | 43 | 19.5% |
| $75,000 to $99,999 | 32 | 14.5% |
| $100,000 to $149,999 | 28 | 12.7% |
| $150,000 to $199,999 | 5 | 2.3% |
| $200,000+ | 0 | 0.0% |
Household Income by Householder Age in Robinson
The median household income in Robinson is $47,083, with the highest median household income of $56,957 found in the 25 to 44 years age bracket for the primary householder. A total of 76 households (34.5%) fall into this category.
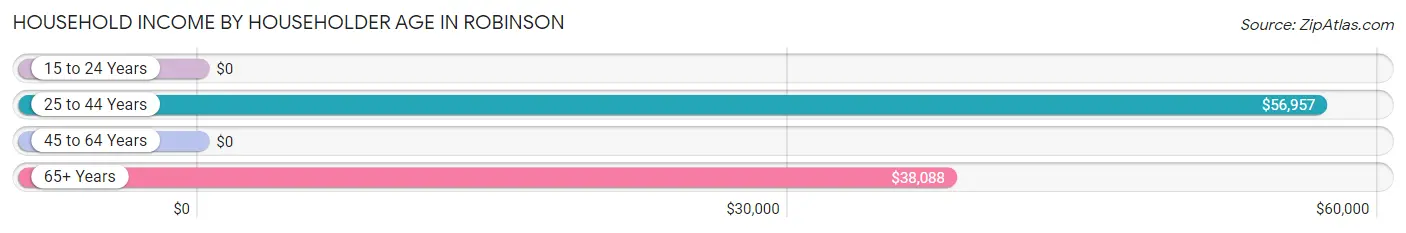
| Income Bracket | # Households | Median Income |
| 15 to 24 Years | 0 (0.0%) | $0 |
| 25 to 44 Years | 76 (34.5%) | $56,957 |
| 45 to 64 Years | 52 (23.6%) | $0 |
| 65+ Years | 92 (41.8%) | $38,088 |
| Total | 220 (100.0%) | $47,083 |
Poverty in Robinson
Income Below Poverty by Sex and Age in Robinson
With 9.2% poverty level for males and 9.8% for females among the residents of Robinson, under 5 year old males and 5 year old females are the most vulnerable to poverty, with 10 males (100.0%) and 5 females (100.0%) in their respective age groups living below the poverty level.
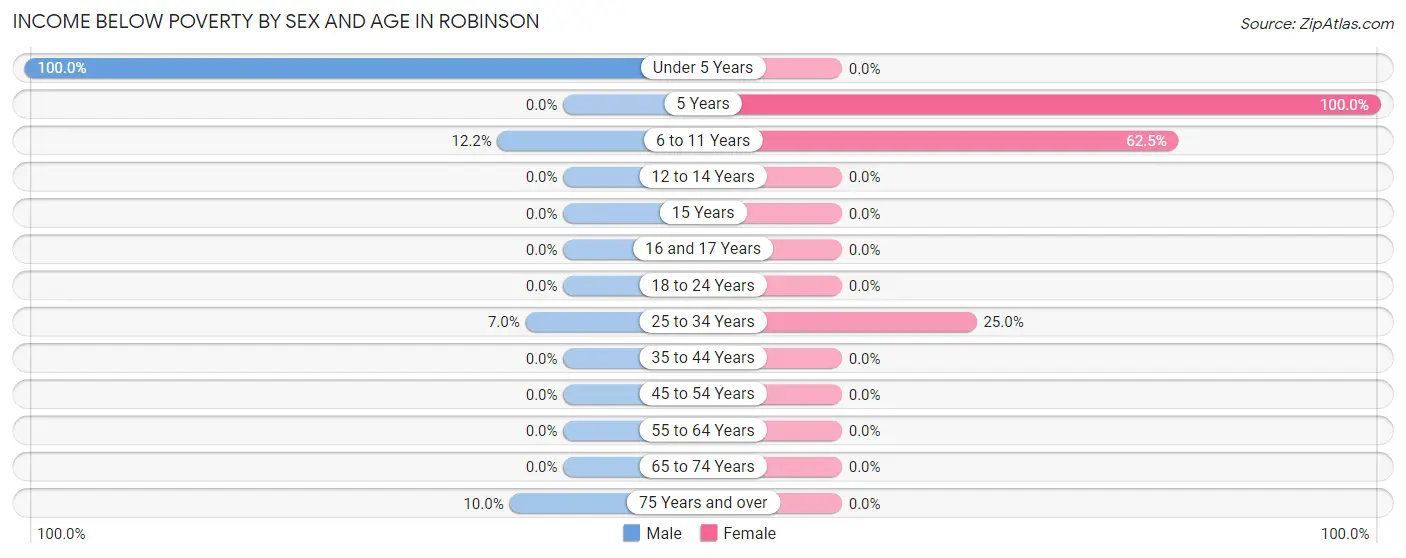
| Age Bracket | Male | Female |
| Under 5 Years | 10 (100.0%) | 0 (0.0%) |
| 5 Years | 0 (0.0%) | 5 (100.0%) |
| 6 to 11 Years | 5 (12.2%) | 10 (62.5%) |
| 12 to 14 Years | 0 (0.0%) | 0 (0.0%) |
| 15 Years | 0 (0.0%) | 0 (0.0%) |
| 16 and 17 Years | 0 (0.0%) | 0 (0.0%) |
| 18 to 24 Years | 0 (0.0%) | 0 (0.0%) |
| 25 to 34 Years | 4 (7.0%) | 8 (25.0%) |
| 35 to 44 Years | 0 (0.0%) | 0 (0.0%) |
| 45 to 54 Years | 0 (0.0%) | 0 (0.0%) |
| 55 to 64 Years | 0 (0.0%) | 0 (0.0%) |
| 65 to 74 Years | 0 (0.0%) | 0 (0.0%) |
| 75 Years and over | 5 (10.0%) | 0 (0.0%) |
| Total | 24 (9.2%) | 23 (9.8%) |
Income Above Poverty by Sex and Age in Robinson
According to the poverty statistics in Robinson, males aged 5 years and females aged 15 years are the age groups that are most secure financially, with 100.0% of males and 100.0% of females in these age groups living above the poverty line.
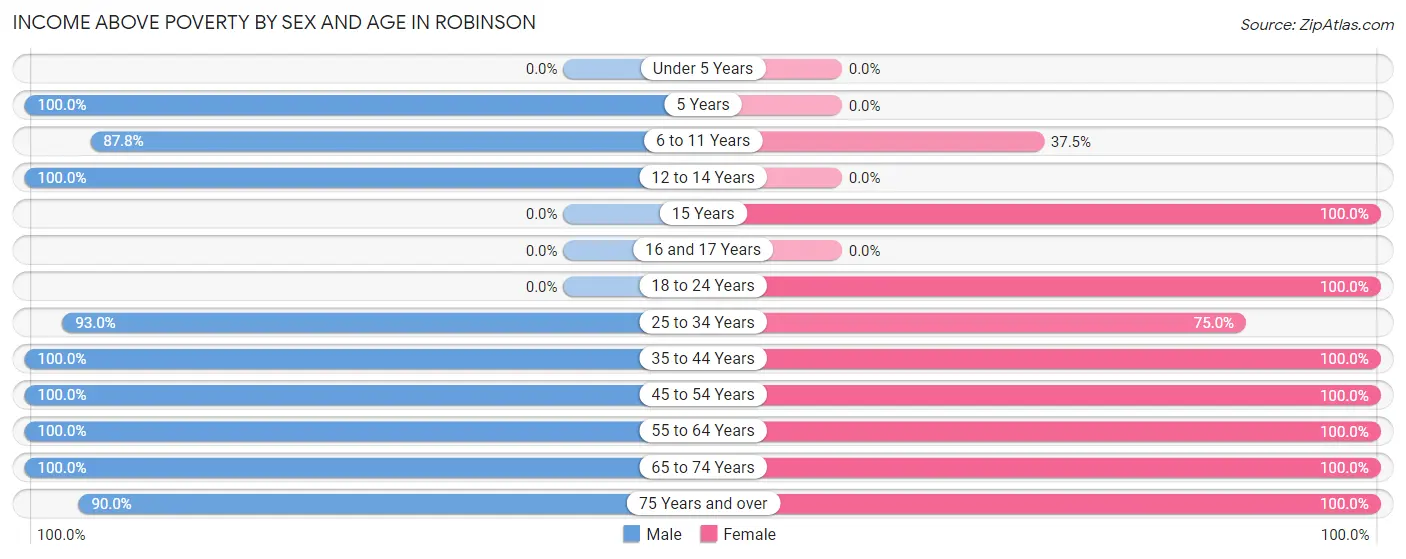
| Age Bracket | Male | Female |
| Under 5 Years | 0 (0.0%) | 0 (0.0%) |
| 5 Years | 10 (100.0%) | 0 (0.0%) |
| 6 to 11 Years | 36 (87.8%) | 6 (37.5%) |
| 12 to 14 Years | 18 (100.0%) | 0 (0.0%) |
| 15 Years | 0 (0.0%) | 6 (100.0%) |
| 16 and 17 Years | 0 (0.0%) | 0 (0.0%) |
| 18 to 24 Years | 0 (0.0%) | 23 (100.0%) |
| 25 to 34 Years | 53 (93.0%) | 24 (75.0%) |
| 35 to 44 Years | 31 (100.0%) | 30 (100.0%) |
| 45 to 54 Years | 12 (100.0%) | 4 (100.0%) |
| 55 to 64 Years | 20 (100.0%) | 38 (100.0%) |
| 65 to 74 Years | 12 (100.0%) | 36 (100.0%) |
| 75 Years and over | 45 (90.0%) | 45 (100.0%) |
| Total | 237 (90.8%) | 212 (90.2%) |
Income Below Poverty Among Married-Couple Families in Robinson
The poverty statistics for married-couple families in Robinson show that 3.4% or 4 of the total 117 families live below the poverty line. Families with 3 or 4 children have the highest poverty rate of 22.2%, comprising of 4 families. On the other hand, families with no children have the lowest poverty rate of 0.0%, which includes 0 families.
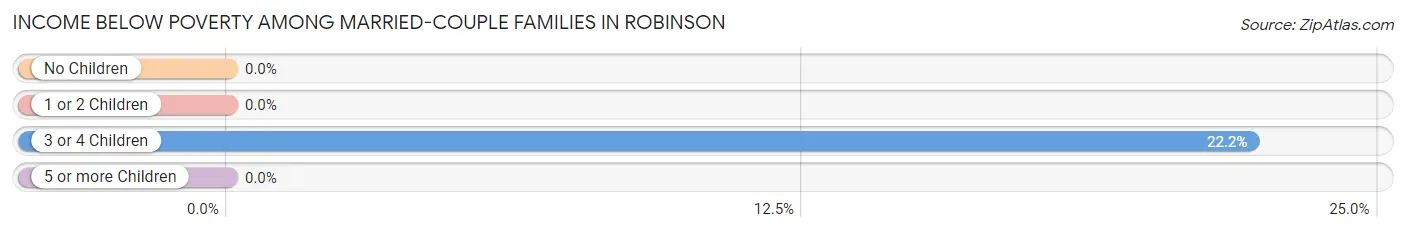
| Children | Above Poverty | Below Poverty |
| No Children | 77 (100.0%) | 0 (0.0%) |
| 1 or 2 Children | 22 (100.0%) | 0 (0.0%) |
| 3 or 4 Children | 14 (77.8%) | 4 (22.2%) |
| 5 or more Children | 0 (0.0%) | 0 (0.0%) |
| Total | 113 (96.6%) | 4 (3.4%) |
Income Below Poverty Among Single-Parent Households in Robinson
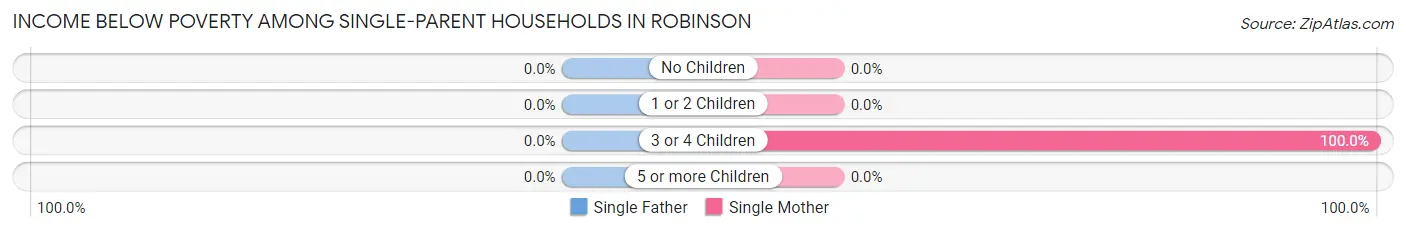
| Children | Single Father | Single Mother |
| No Children | 0 (0.0%) | 0 (0.0%) |
| 1 or 2 Children | 0 (0.0%) | 0 (0.0%) |
| 3 or 4 Children | 0 (0.0%) | 4 (100.0%) |
| 5 or more Children | 0 (0.0%) | 0 (0.0%) |
| Total | 0 (0.0%) | 4 (66.7%) |
Income Below Poverty Among Married-Couple vs Single-Parent Households in Robinson
The poverty data for Robinson shows that 4 of the married-couple family households (3.4%) and 4 of the single-parent households (36.4%) are living below the poverty level. Within the married-couple family households, those with 3 or 4 children have the highest poverty rate, with 4 households (22.2%) falling below the poverty line. Among the single-parent households, those with 3 or 4 children have the highest poverty rate, with 4 household (100.0%) living below poverty.
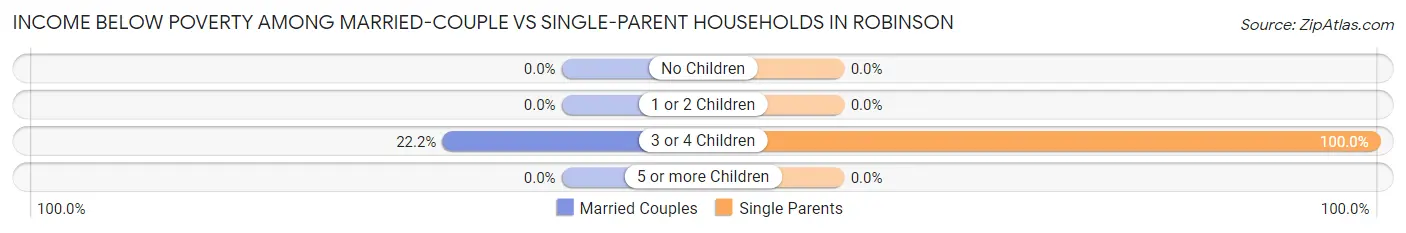
| Children | Married-Couple Families | Single-Parent Households |
| No Children | 0 (0.0%) | 0 (0.0%) |
| 1 or 2 Children | 0 (0.0%) | 0 (0.0%) |
| 3 or 4 Children | 4 (22.2%) | 4 (100.0%) |
| 5 or more Children | 0 (0.0%) | 0 (0.0%) |
| Total | 4 (3.4%) | 4 (36.4%) |
Race in Robinson
The most populous races in Robinson are White / Caucasian (476 | 96.0%), Two or more Races (17 | 3.4%), and Black / African American (3 | 0.6%).
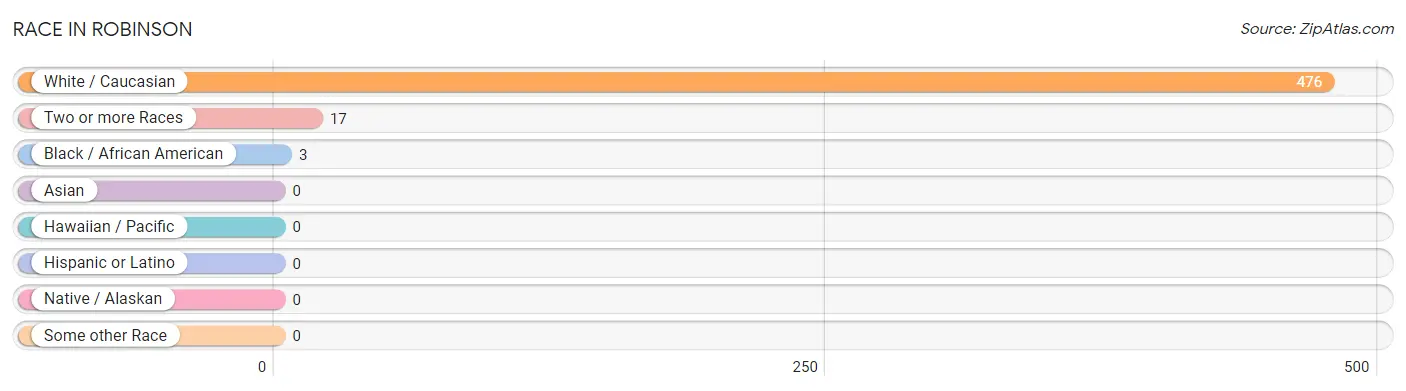
| Race | # Population | % Population |
| Asian | 0 | 0.0% |
| Black / African American | 3 | 0.6% |
| Hawaiian / Pacific | 0 | 0.0% |
| Hispanic or Latino | 0 | 0.0% |
| Native / Alaskan | 0 | 0.0% |
| White / Caucasian | 476 | 96.0% |
| Two or more Races | 17 | 3.4% |
| Some other Race | 0 | 0.0% |
| Total | 496 | 100.0% |
Ancestry in Robinson
The most populous ancestries reported in Robinson are German (228 | 46.0%), Italian (93 | 18.8%), English (62 | 12.5%), Irish (41 | 8.3%), and Pennsylvania German (30 | 6.0%), together accounting for 91.5% of all Robinson residents.
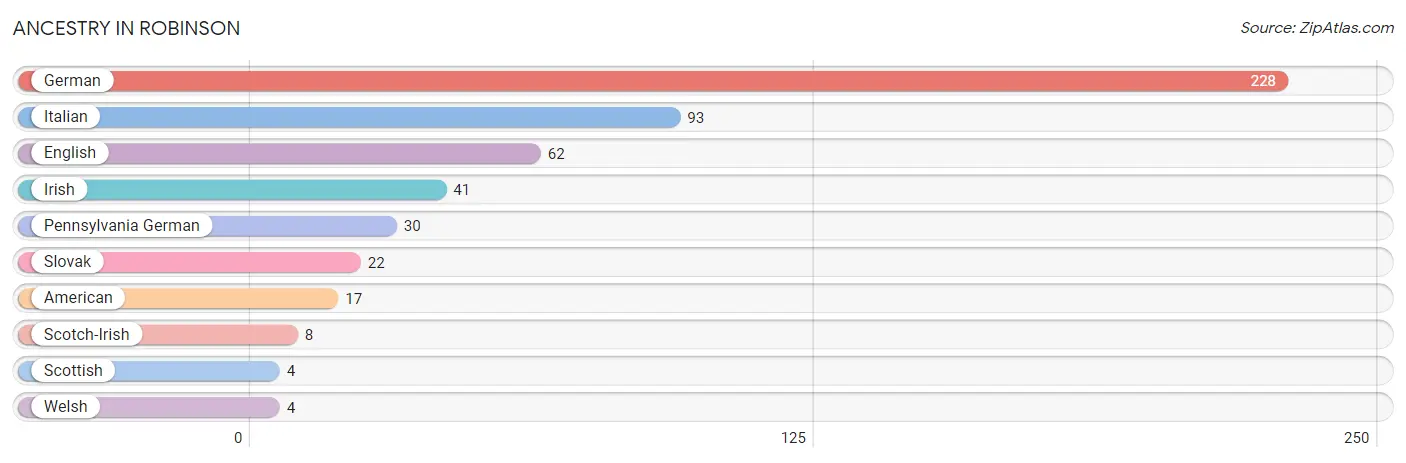
| Ancestry | # Population | % Population |
| American | 17 | 3.4% |
| English | 62 | 12.5% |
| German | 228 | 46.0% |
| Irish | 41 | 8.3% |
| Italian | 93 | 18.8% |
| Pennsylvania German | 30 | 6.0% |
| Scotch-Irish | 8 | 1.6% |
| Scottish | 4 | 0.8% |
| Slovak | 22 | 4.4% |
| Welsh | 4 | 0.8% | View All 10 Rows |
Immigrants in Robinson

| Immigration Origin | # Population | % Population | View All 0 Rows |
Sex and Age in Robinson
Sex and Age in Robinson
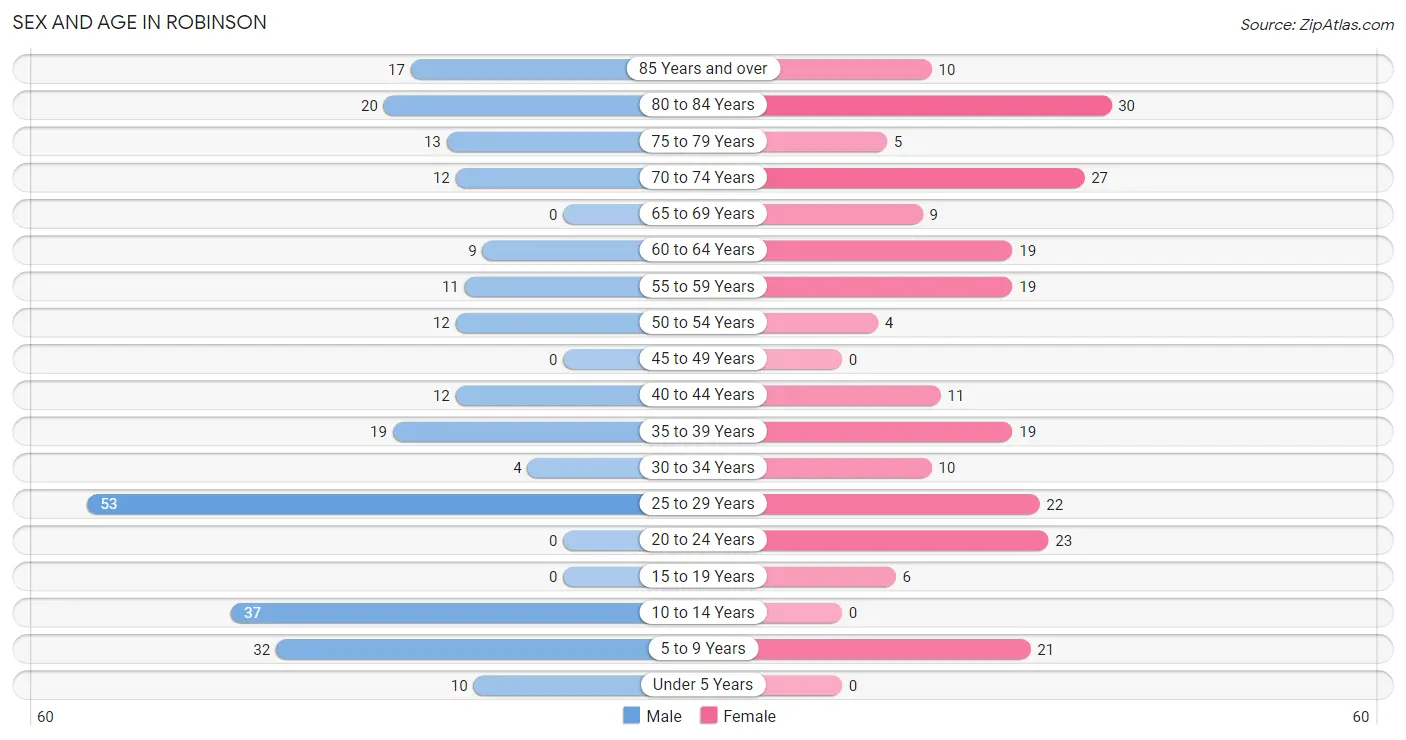
The most populous age groups in Robinson are 25 to 29 Years (53 | 20.3%) for men and 80 to 84 Years (30 | 12.8%) for women.
| Age Bracket | Male | Female |
| Under 5 Years | 10 (3.8%) | 0 (0.0%) |
| 5 to 9 Years | 32 (12.3%) | 21 (8.9%) |
| 10 to 14 Years | 37 (14.2%) | 0 (0.0%) |
| 15 to 19 Years | 0 (0.0%) | 6 (2.5%) |
| 20 to 24 Years | 0 (0.0%) | 23 (9.8%) |
| 25 to 29 Years | 53 (20.3%) | 22 (9.4%) |
| 30 to 34 Years | 4 (1.5%) | 10 (4.3%) |
| 35 to 39 Years | 19 (7.3%) | 19 (8.1%) |
| 40 to 44 Years | 12 (4.6%) | 11 (4.7%) |
| 45 to 49 Years | 0 (0.0%) | 0 (0.0%) |
| 50 to 54 Years | 12 (4.6%) | 4 (1.7%) |
| 55 to 59 Years | 11 (4.2%) | 19 (8.1%) |
| 60 to 64 Years | 9 (3.5%) | 19 (8.1%) |
| 65 to 69 Years | 0 (0.0%) | 9 (3.8%) |
| 70 to 74 Years | 12 (4.6%) | 27 (11.5%) |
| 75 to 79 Years | 13 (5.0%) | 5 (2.1%) |
| 80 to 84 Years | 20 (7.7%) | 30 (12.8%) |
| 85 Years and over | 17 (6.5%) | 10 (4.3%) |
| Total | 261 (100.0%) | 235 (100.0%) |
Families and Households in Robinson
Median Family Size in Robinson
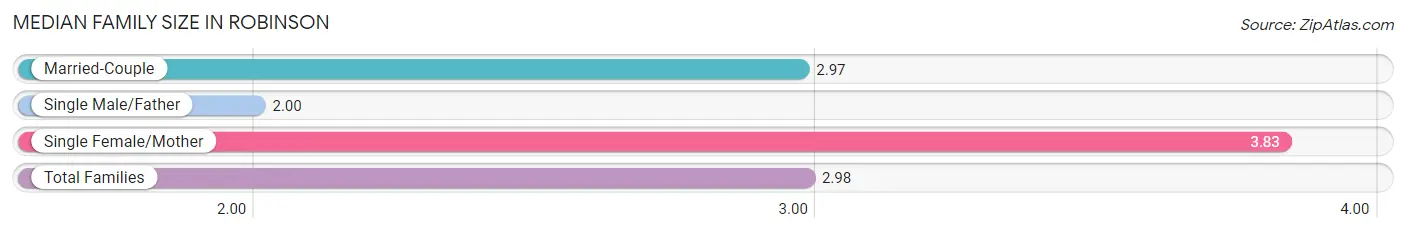
The median family size in Robinson is 2.98 persons per family, with single female/mother families (6 | 4.7%) accounting for the largest median family size of 3.83 persons per family. On the other hand, single male/father families (5 | 3.9%) represent the smallest median family size with 2.00 persons per family.
| Family Type | # Families | Family Size |
| Married-Couple | 117 (91.4%) | 2.97 |
| Single Male/Father | 5 (3.9%) | 2.00 |
| Single Female/Mother | 6 (4.7%) | 3.83 |
| Total Families | 128 (100.0%) | 2.98 |
Median Household Size in Robinson
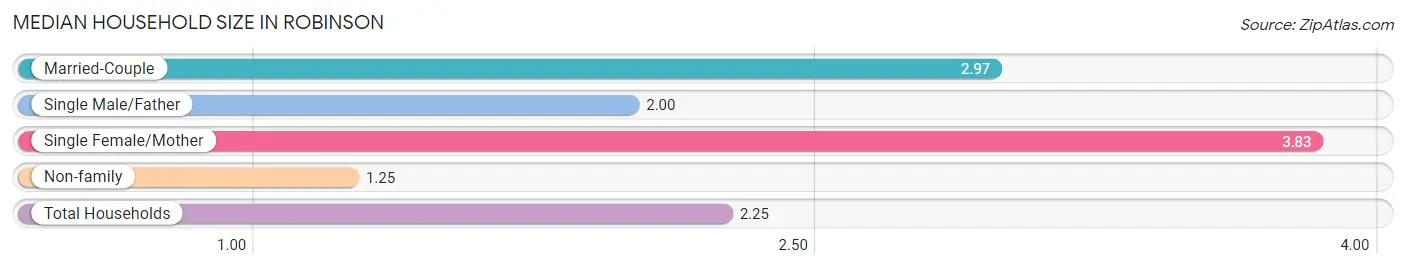
The median household size in Robinson is 2.25 persons per household, with single female/mother households (6 | 2.7%) accounting for the largest median household size of 3.83 persons per household. non-family households (92 | 41.8%) represent the smallest median household size with 1.25 persons per household.
| Household Type | # Households | Household Size |
| Married-Couple | 117 (53.2%) | 2.97 |
| Single Male/Father | 5 (2.3%) | 2.00 |
| Single Female/Mother | 6 (2.7%) | 3.83 |
| Non-family | 92 (41.8%) | 1.25 |
| Total Households | 220 (100.0%) | 2.25 |
Household Size by Marriage Status in Robinson
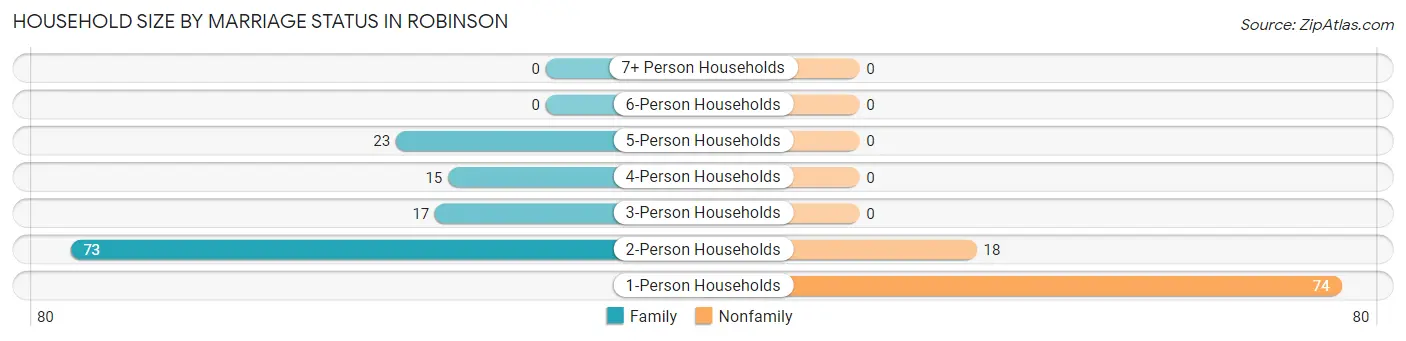
Out of a total of 220 households in Robinson, 128 (58.2%) are family households, while 92 (41.8%) are nonfamily households. The most numerous type of family households are 2-person households, comprising 73, and the most common type of nonfamily households are 1-person households, comprising 74.
| Household Size | Family Households | Nonfamily Households |
| 1-Person Households | - | 74 (33.6%) |
| 2-Person Households | 73 (33.2%) | 18 (8.2%) |
| 3-Person Households | 17 (7.7%) | 0 (0.0%) |
| 4-Person Households | 15 (6.8%) | 0 (0.0%) |
| 5-Person Households | 23 (10.4%) | 0 (0.0%) |
| 6-Person Households | 0 (0.0%) | 0 (0.0%) |
| 7+ Person Households | 0 (0.0%) | 0 (0.0%) |
| Total | 128 (58.2%) | 92 (41.8%) |
Female Fertility in Robinson
Fertility by Age in Robinson
| Age Bracket | Women with Births | Births / 1,000 Women |
| 15 to 19 years | 0 (0.0%) | 0.0 |
| 20 to 34 years | 0 (0.0%) | 0.0 |
| 35 to 50 years | 0 (0.0%) | 0.0 |
| Total | 0 (0.0%) | 0.0 |
Fertility by Age by Marriage Status in Robinson
| Age Bracket | Married | Unmarried |
| 15 to 19 years | 0 (0.0%) | 0 (0.0%) |
| 20 to 34 years | 0 (0.0%) | 0 (0.0%) |
| 35 to 50 years | 0 (0.0%) | 0 (0.0%) |
| Total | 0 (0.0%) | 0 (0.0%) |
Fertility by Education in Robinson
| Educational Attainment | Women with Births | Births / 1,000 Women |
| Less than High School | 0 (0.0%) | 0.0 |
| High School Diploma | 0 (0.0%) | 0.0 |
| College or Associate's Degree | 0 (0.0%) | 0.0 |
| Bachelor's Degree | 0 (0.0%) | 0.0 |
| Graduate Degree | 0 (0.0%) | 0.0 |
| Total | 0 (0.0%) | 0.0 |
Fertility by Education by Marriage Status in Robinson
| Educational Attainment | Married | Unmarried |
| Less than High School | 0 (0.0%) | 0 (0.0%) |
| High School Diploma | 0 (0.0%) | 0 (0.0%) |
| College or Associate's Degree | 0 (0.0%) | 0 (0.0%) |
| Bachelor's Degree | 0 (0.0%) | 0 (0.0%) |
| Graduate Degree | 0 (0.0%) | 0 (0.0%) |
| Total | 0 (0.0%) | 0 (0.0%) |
Employment Characteristics in Robinson
Employment by Class of Employer in Robinson
Among the 172 employed individuals in Robinson, private company employees (141 | 82.0%), not-for-profit organizations (13 | 7.6%), and self-employed (not incorporated) (8 | 4.6%) make up the most common classes of employment.
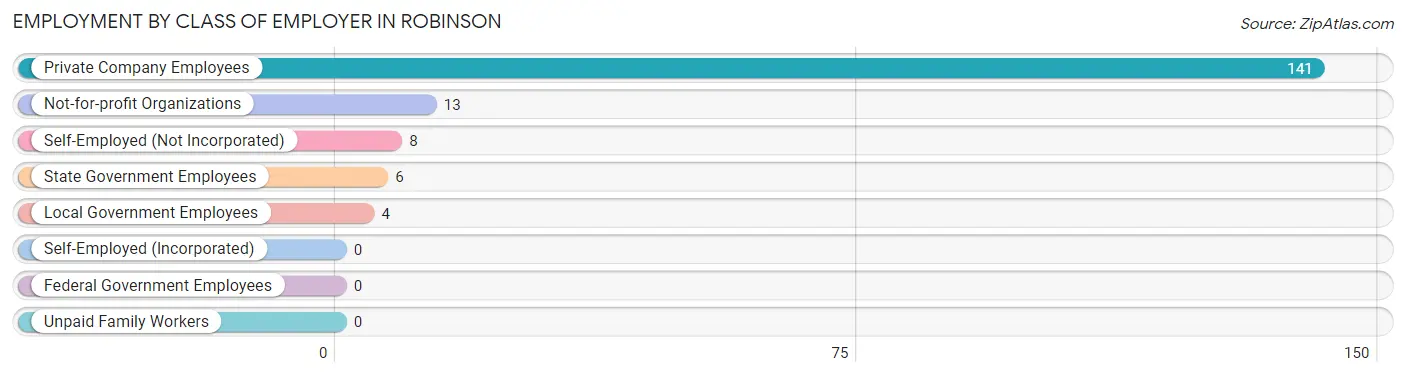
| Employer Class | # Employees | % Employees |
| Private Company Employees | 141 | 82.0% |
| Self-Employed (Incorporated) | 0 | 0.0% |
| Self-Employed (Not Incorporated) | 8 | 4.6% |
| Not-for-profit Organizations | 13 | 7.6% |
| Local Government Employees | 4 | 2.3% |
| State Government Employees | 6 | 3.5% |
| Federal Government Employees | 0 | 0.0% |
| Unpaid Family Workers | 0 | 0.0% |
| Total | 172 | 100.0% |
Employment Status by Age in Robinson
According to the labor force statistics for Robinson, out of the total population over 16 years of age (390), 45.6% or 178 individuals are in the labor force, with 3.4% or 6 of them unemployed. The age group with the highest labor force participation rate is 20 to 24 years, with 100.0% or 23 individuals in the labor force. Within the labor force, the 55 to 59 years age range has the highest percentage of unemployed individuals, with 35.3% or 6 of them being unemployed.
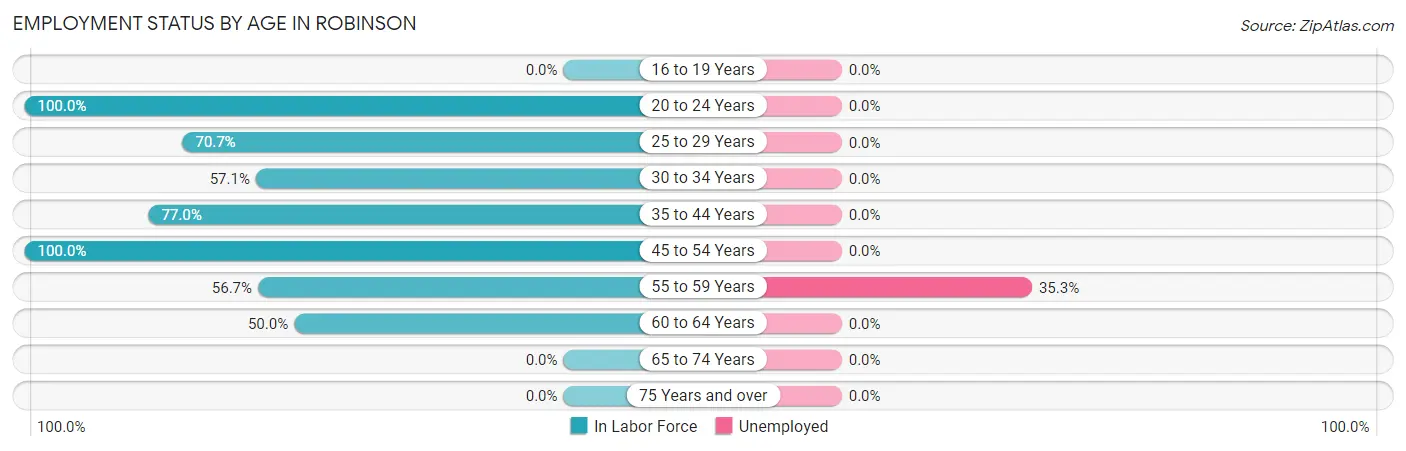
| Age Bracket | In Labor Force | Unemployed |
| 16 to 19 Years | 0 (0.0%) | 0 (0.0%) |
| 20 to 24 Years | 23 (100.0%) | 0 (0.0%) |
| 25 to 29 Years | 53 (70.7%) | 0 (0.0%) |
| 30 to 34 Years | 8 (57.1%) | 0 (0.0%) |
| 35 to 44 Years | 47 (77.0%) | 0 (0.0%) |
| 45 to 54 Years | 16 (100.0%) | 0 (0.0%) |
| 55 to 59 Years | 17 (56.7%) | 6 (35.3%) |
| 60 to 64 Years | 14 (50.0%) | 0 (0.0%) |
| 65 to 74 Years | 0 (0.0%) | 0 (0.0%) |
| 75 Years and over | 0 (0.0%) | 0 (0.0%) |
| Total | 178 (45.6%) | 6 (3.4%) |
Employment Status by Educational Attainment in Robinson
According to labor force statistics for Robinson, 69.2% of individuals (155) out of the total population between 25 and 64 years of age (224) are in the labor force, with 3.9% or 6 of them being unemployed. The group with the highest labor force participation rate are those with the educational attainment of less than high school, with 100.0% or 9 individuals in the labor force. Within the labor force, individuals with bachelor's degree or higher education have the highest percentage of unemployment, with 27.3% or 6 of them being unemployed.
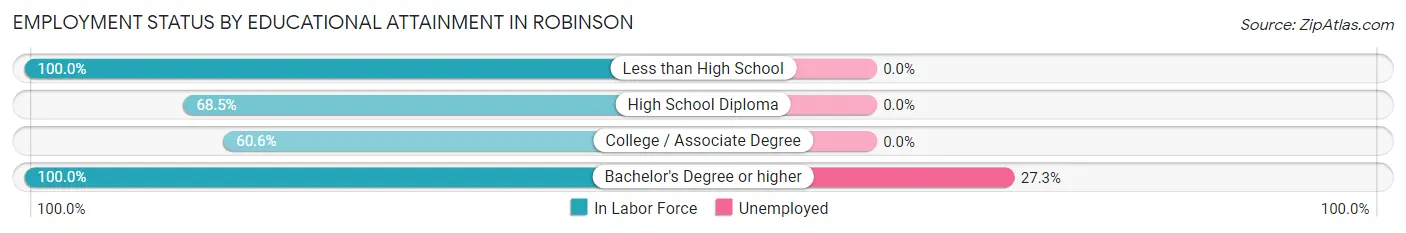
| Educational Attainment | In Labor Force | Unemployed |
| Less than High School | 9 (100.0%) | 0 (0.0%) |
| High School Diploma | 61 (68.5%) | 0 (0.0%) |
| College / Associate Degree | 63 (60.6%) | 0 (0.0%) |
| Bachelor's Degree or higher | 22 (100.0%) | 6 (27.3%) |
| Total | 155 (69.2%) | 9 (3.9%) |
Employment Occupations by Sex in Robinson
Management, Business, Science and Arts Occupations
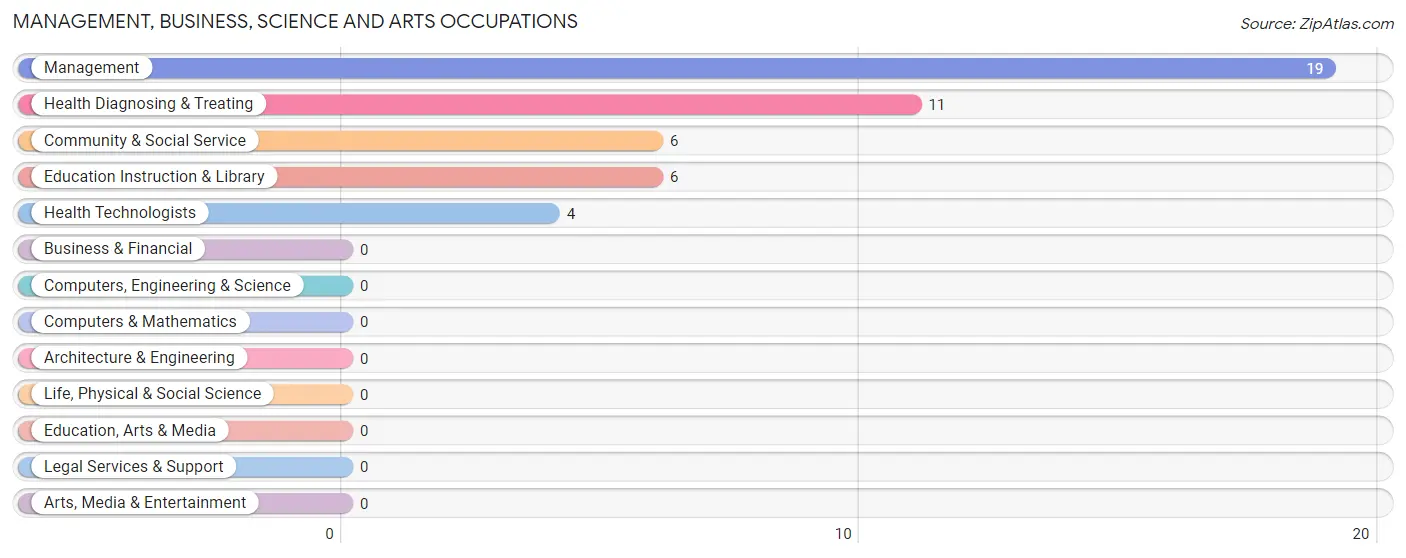
The most common Management, Business, Science and Arts occupations in Robinson are Management (19 | 11.1%), Health Diagnosing & Treating (11 | 6.4%), Community & Social Service (6 | 3.5%), Education Instruction & Library (6 | 3.5%), and Health Technologists (4 | 2.3%).
Management, Business, Science and Arts Occupations by Sex
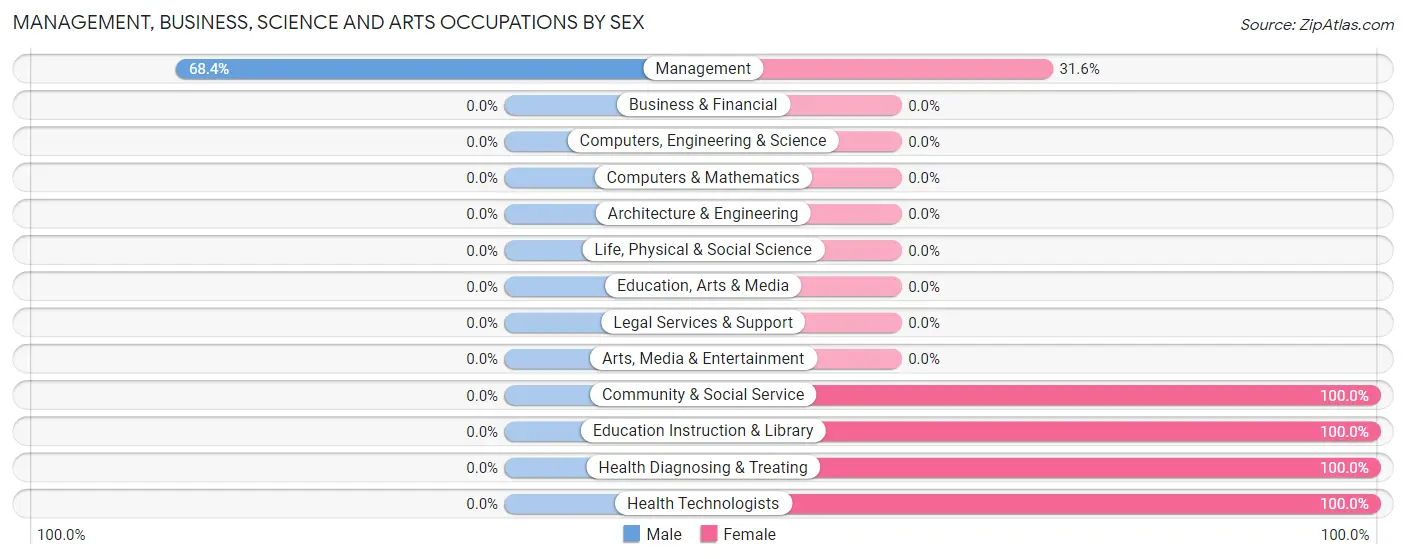
| Occupation | Male | Female |
| Management | 13 (68.4%) | 6 (31.6%) |
| Business & Financial | 0 (0.0%) | 0 (0.0%) |
| Computers, Engineering & Science | 0 (0.0%) | 0 (0.0%) |
| Computers & Mathematics | 0 (0.0%) | 0 (0.0%) |
| Architecture & Engineering | 0 (0.0%) | 0 (0.0%) |
| Life, Physical & Social Science | 0 (0.0%) | 0 (0.0%) |
| Community & Social Service | 0 (0.0%) | 6 (100.0%) |
| Education, Arts & Media | 0 (0.0%) | 0 (0.0%) |
| Legal Services & Support | 0 (0.0%) | 0 (0.0%) |
| Education Instruction & Library | 0 (0.0%) | 6 (100.0%) |
| Arts, Media & Entertainment | 0 (0.0%) | 0 (0.0%) |
| Health Diagnosing & Treating | 0 (0.0%) | 11 (100.0%) |
| Health Technologists | 0 (0.0%) | 4 (100.0%) |
| Total (Category) | 13 (36.1%) | 23 (63.9%) |
| Total (Overall) | 83 (48.3%) | 89 (51.7%) |
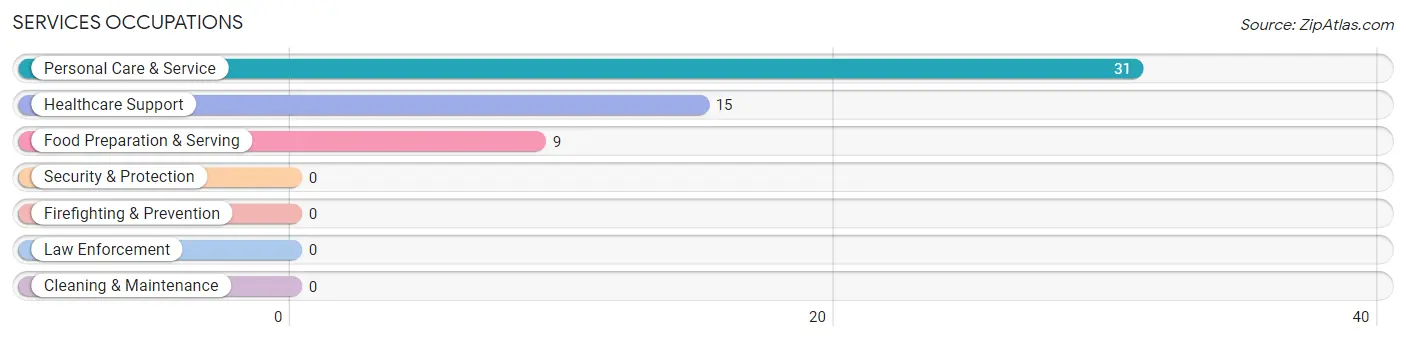
Services Occupations
The most common Services occupations in Robinson are Personal Care & Service (31 | 18.0%), Healthcare Support (15 | 8.7%), and Food Preparation & Serving (9 | 5.2%).
Services Occupations by Sex
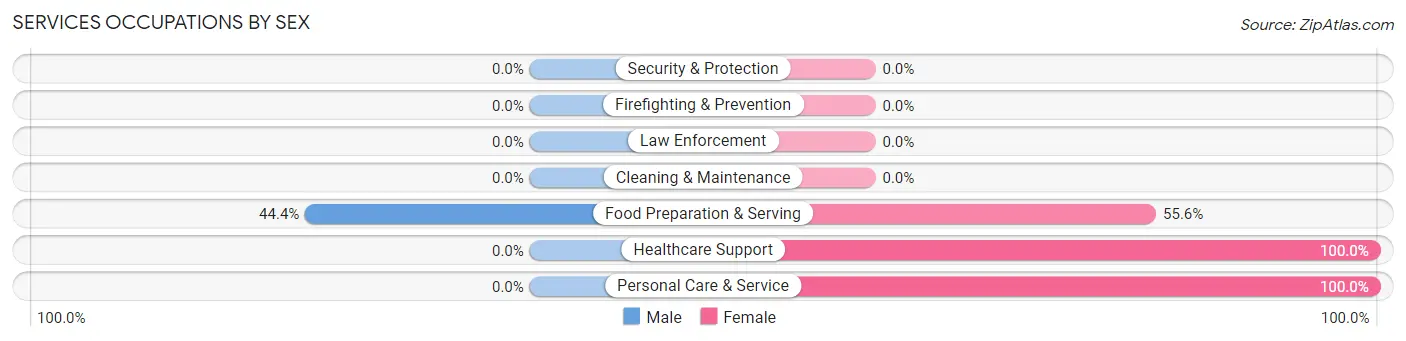
| Occupation | Male | Female |
| Healthcare Support | 0 (0.0%) | 15 (100.0%) |
| Security & Protection | 0 (0.0%) | 0 (0.0%) |
| Firefighting & Prevention | 0 (0.0%) | 0 (0.0%) |
| Law Enforcement | 0 (0.0%) | 0 (0.0%) |
| Food Preparation & Serving | 4 (44.4%) | 5 (55.6%) |
| Cleaning & Maintenance | 0 (0.0%) | 0 (0.0%) |
| Personal Care & Service | 0 (0.0%) | 31 (100.0%) |
| Total (Category) | 4 (7.3%) | 51 (92.7%) |
| Total (Overall) | 83 (48.3%) | 89 (51.7%) |
Sales and Office Occupations
The most common Sales and Office occupations in Robinson are Office & Administration (17 | 9.9%), and Sales & Related (5 | 2.9%).
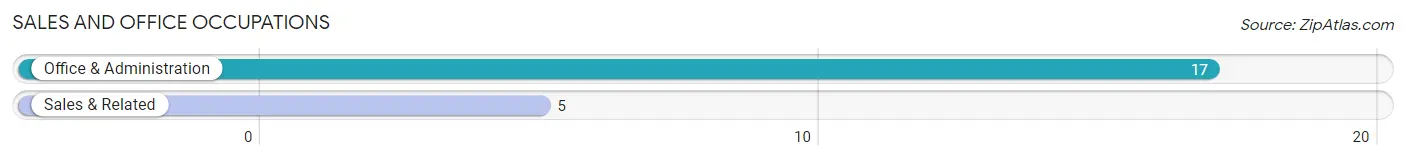
Sales and Office Occupations by Sex
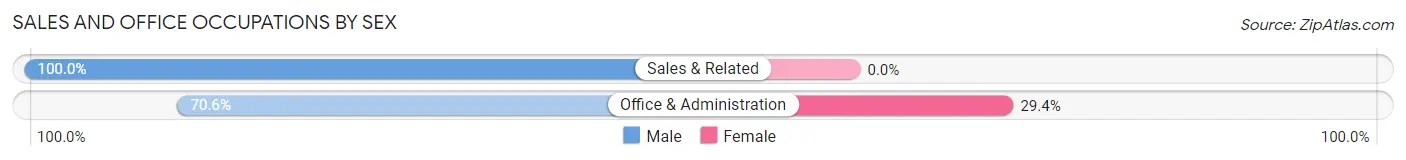
| Occupation | Male | Female |
| Sales & Related | 5 (100.0%) | 0 (0.0%) |
| Office & Administration | 12 (70.6%) | 5 (29.4%) |
| Total (Category) | 17 (77.3%) | 5 (22.7%) |
| Total (Overall) | 83 (48.3%) | 89 (51.7%) |
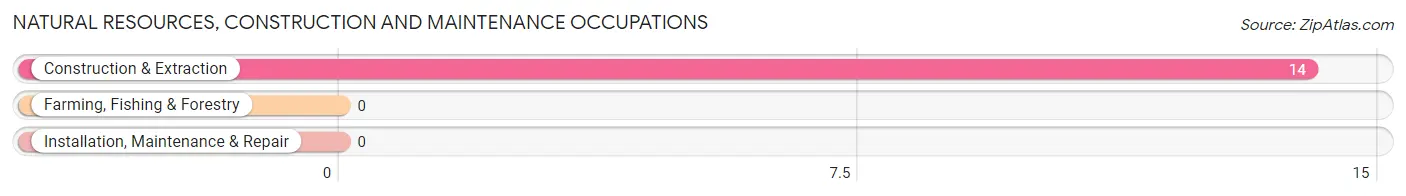
Natural Resources, Construction and Maintenance Occupations
The most common Natural Resources, Construction and Maintenance occupations in Robinson are , and Construction & Extraction (14 | 8.1%).
Natural Resources, Construction and Maintenance Occupations by Sex
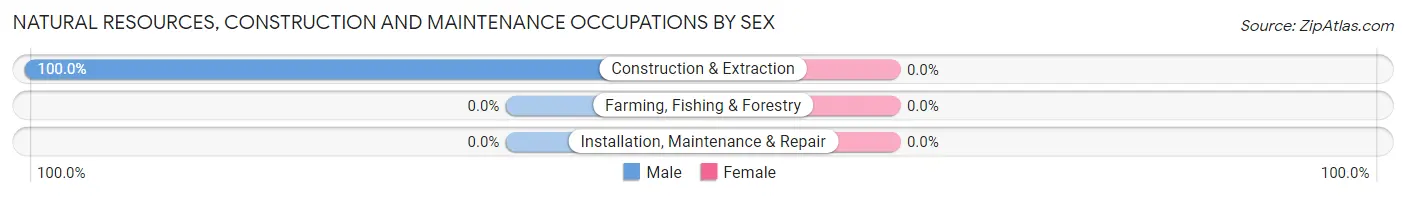
| Occupation | Male | Female |
| Farming, Fishing & Forestry | 0 (0.0%) | 0 (0.0%) |
| Construction & Extraction | 14 (100.0%) | 0 (0.0%) |
| Installation, Maintenance & Repair | 0 (0.0%) | 0 (0.0%) |
| Total (Category) | 14 (100.0%) | 0 (0.0%) |
| Total (Overall) | 83 (48.3%) | 89 (51.7%) |
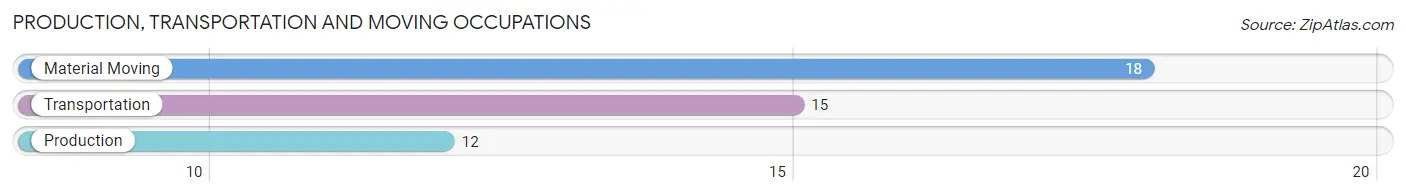
Production, Transportation and Moving Occupations
The most common Production, Transportation and Moving occupations in Robinson are Material Moving (18 | 10.5%), Transportation (15 | 8.7%), and Production (12 | 7.0%).
Production, Transportation and Moving Occupations by Sex
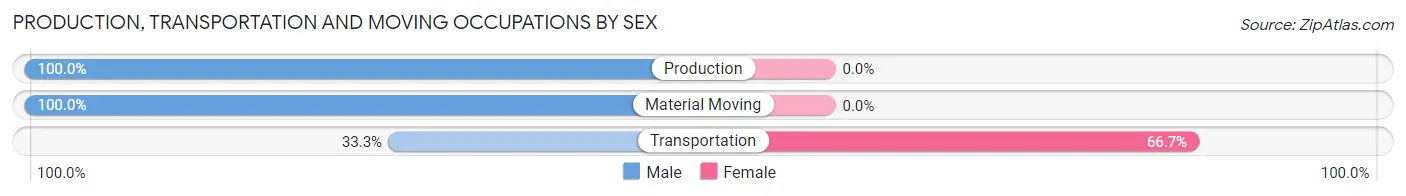
| Occupation | Male | Female |
| Production | 12 (100.0%) | 0 (0.0%) |
| Transportation | 5 (33.3%) | 10 (66.7%) |
| Material Moving | 18 (100.0%) | 0 (0.0%) |
| Total (Category) | 35 (77.8%) | 10 (22.2%) |
| Total (Overall) | 83 (48.3%) | 89 (51.7%) |
Employment Industries by Sex in Robinson
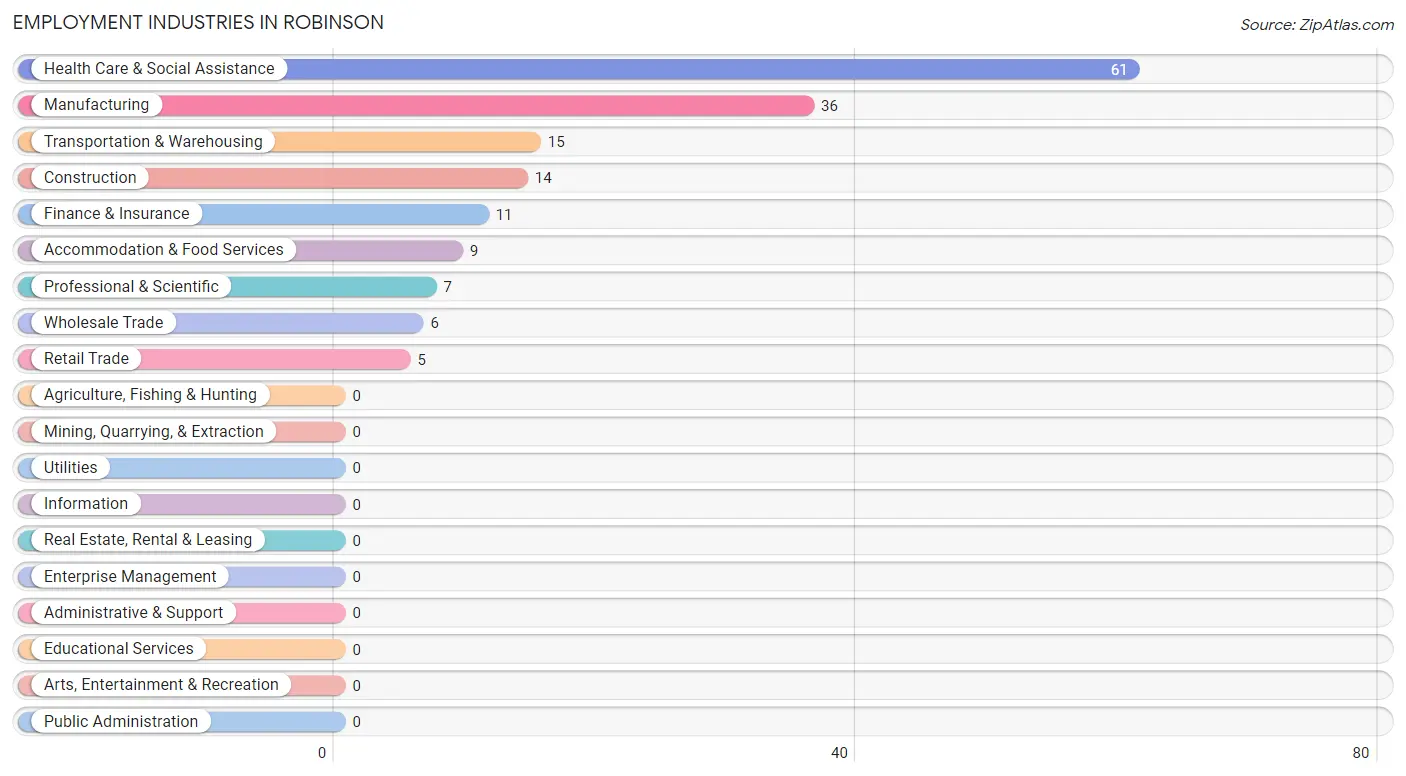
Employment Industries in Robinson
The major employment industries in Robinson include Health Care & Social Assistance (61 | 35.5%), Manufacturing (36 | 20.9%), Transportation & Warehousing (15 | 8.7%), Construction (14 | 8.1%), and Finance & Insurance (11 | 6.4%).
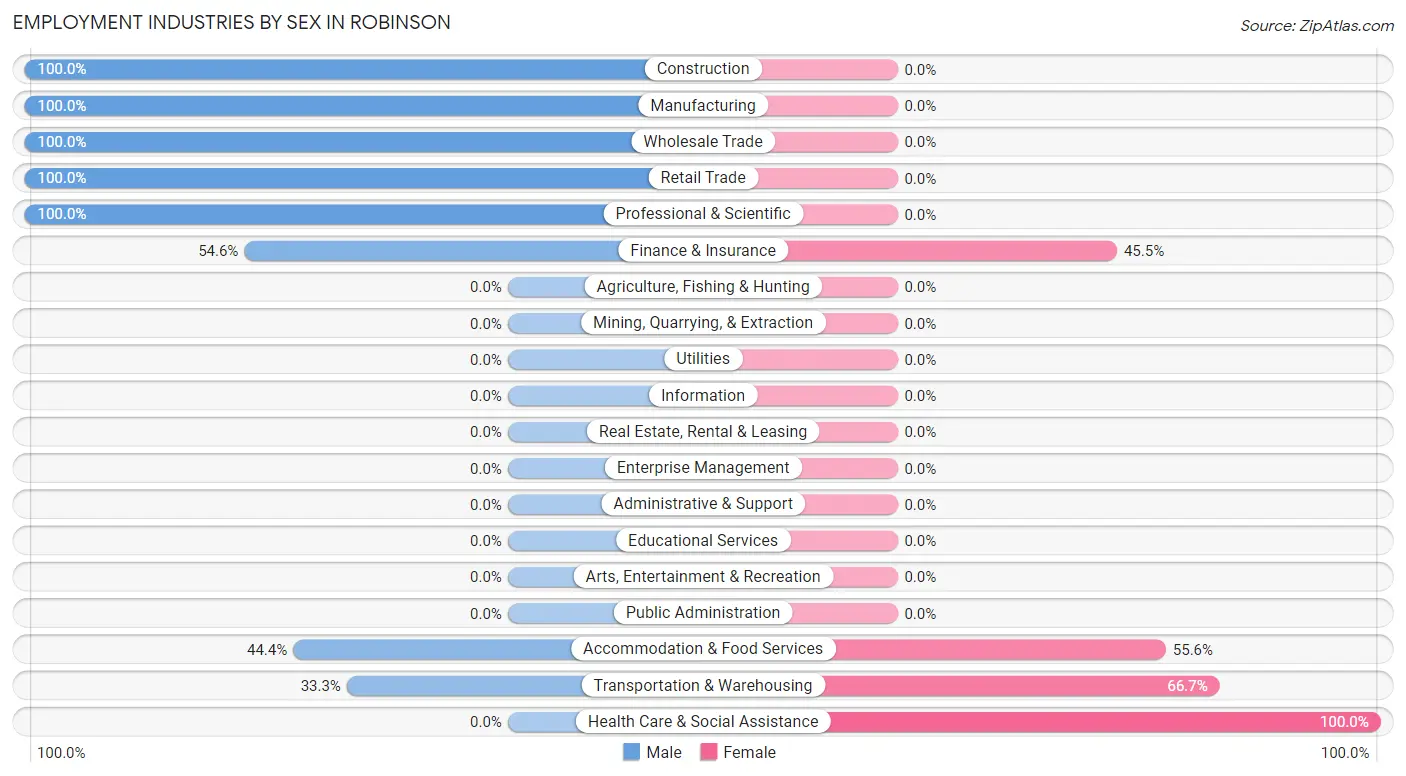
Employment Industries by Sex in Robinson
The Robinson industries that see more men than women are Construction (100.0%), Manufacturing (100.0%), and Wholesale Trade (100.0%), whereas the industries that tend to have a higher number of women are Health Care & Social Assistance (100.0%), Transportation & Warehousing (66.7%), and Accommodation & Food Services (55.6%).
| Industry | Male | Female |
| Agriculture, Fishing & Hunting | 0 (0.0%) | 0 (0.0%) |
| Mining, Quarrying, & Extraction | 0 (0.0%) | 0 (0.0%) |
| Construction | 14 (100.0%) | 0 (0.0%) |
| Manufacturing | 36 (100.0%) | 0 (0.0%) |
| Wholesale Trade | 6 (100.0%) | 0 (0.0%) |
| Retail Trade | 5 (100.0%) | 0 (0.0%) |
| Transportation & Warehousing | 5 (33.3%) | 10 (66.7%) |
| Utilities | 0 (0.0%) | 0 (0.0%) |
| Information | 0 (0.0%) | 0 (0.0%) |
| Finance & Insurance | 6 (54.5%) | 5 (45.5%) |
| Real Estate, Rental & Leasing | 0 (0.0%) | 0 (0.0%) |
| Professional & Scientific | 7 (100.0%) | 0 (0.0%) |
| Enterprise Management | 0 (0.0%) | 0 (0.0%) |
| Administrative & Support | 0 (0.0%) | 0 (0.0%) |
| Educational Services | 0 (0.0%) | 0 (0.0%) |
| Health Care & Social Assistance | 0 (0.0%) | 61 (100.0%) |
| Arts, Entertainment & Recreation | 0 (0.0%) | 0 (0.0%) |
| Accommodation & Food Services | 4 (44.4%) | 5 (55.6%) |
| Public Administration | 0 (0.0%) | 0 (0.0%) |
| Total | 83 (48.3%) | 89 (51.7%) |
Education in Robinson
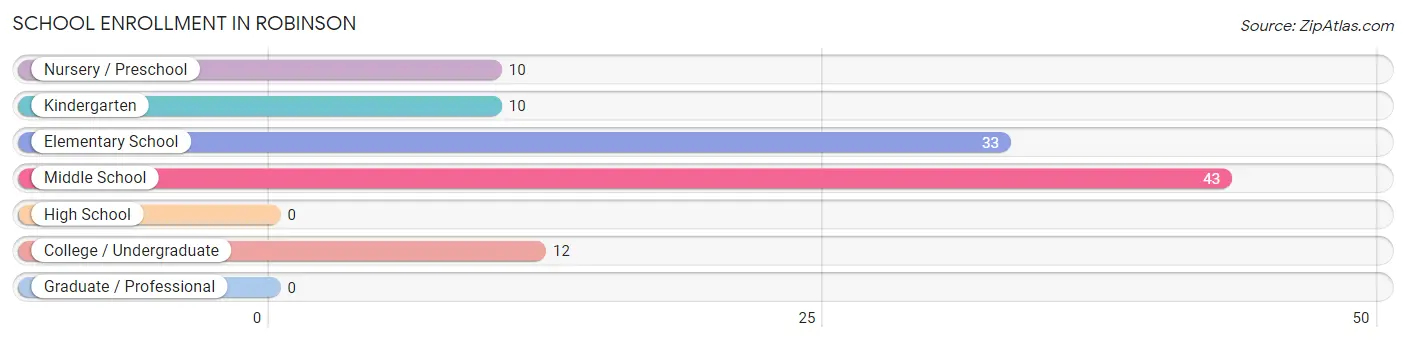
School Enrollment in Robinson
The most common levels of schooling among the 108 students in Robinson are middle school (43 | 39.8%), elementary school (33 | 30.6%), and college / undergraduate (12 | 11.1%).
| School Level | # Students | % Students |
| Nursery / Preschool | 10 | 9.3% |
| Kindergarten | 10 | 9.3% |
| Elementary School | 33 | 30.6% |
| Middle School | 43 | 39.8% |
| High School | 0 | 0.0% |
| College / Undergraduate | 12 | 11.1% |
| Graduate / Professional | 0 | 0.0% |
| Total | 108 | 100.0% |
School Enrollment by Age by Funding Source in Robinson
Out of a total of 108 students who are enrolled in schools in Robinson, 5 (4.6%) attend a private institution, while the remaining 103 (95.4%) are enrolled in public schools. The age group of 35 years and over has the highest likelihood of being enrolled in private schools, with 5 (100.0% in the age bracket) enrolled. Conversely, the age group of 5 to 9 year old has the lowest likelihood of being enrolled in a private school, with 53 (100.0% in the age bracket) attending a public institution.
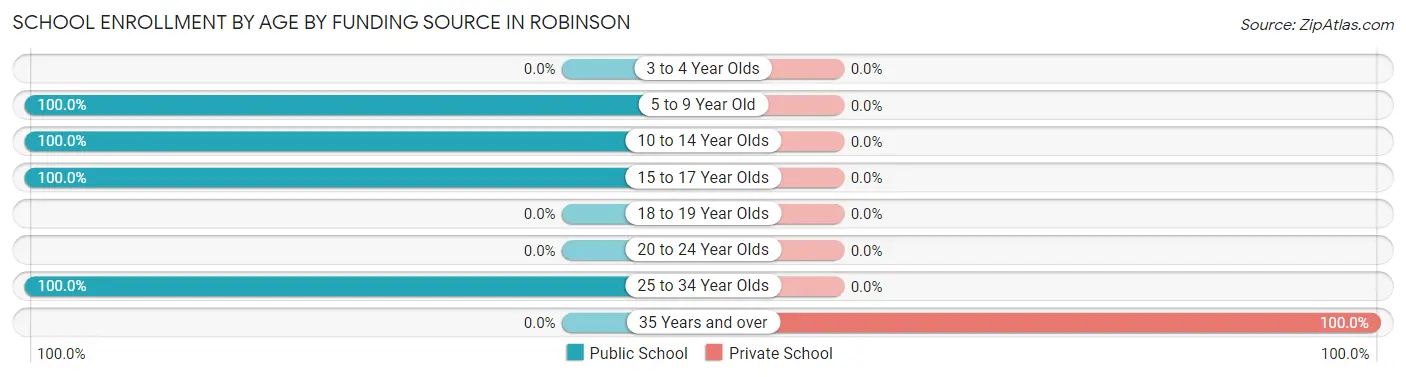
| Age Bracket | Public School | Private School |
| 3 to 4 Year Olds | 0 (0.0%) | 0 (0.0%) |
| 5 to 9 Year Old | 53 (100.0%) | 0 (0.0%) |
| 10 to 14 Year Olds | 37 (100.0%) | 0 (0.0%) |
| 15 to 17 Year Olds | 6 (100.0%) | 0 (0.0%) |
| 18 to 19 Year Olds | 0 (0.0%) | 0 (0.0%) |
| 20 to 24 Year Olds | 0 (0.0%) | 0 (0.0%) |
| 25 to 34 Year Olds | 7 (100.0%) | 0 (0.0%) |
| 35 Years and over | 0 (0.0%) | 5 (100.0%) |
| Total | 103 (95.4%) | 5 (4.6%) |
Educational Attainment by Field of Study in Robinson
Computers & mathematics (7 | 19.4%), bio, nature & agricultural (7 | 19.4%), visual & performing arts (7 | 19.4%), business (6 | 16.7%), and education (5 | 13.9%) are the most common fields of study among 36 individuals in Robinson who have obtained a bachelor's degree or higher.
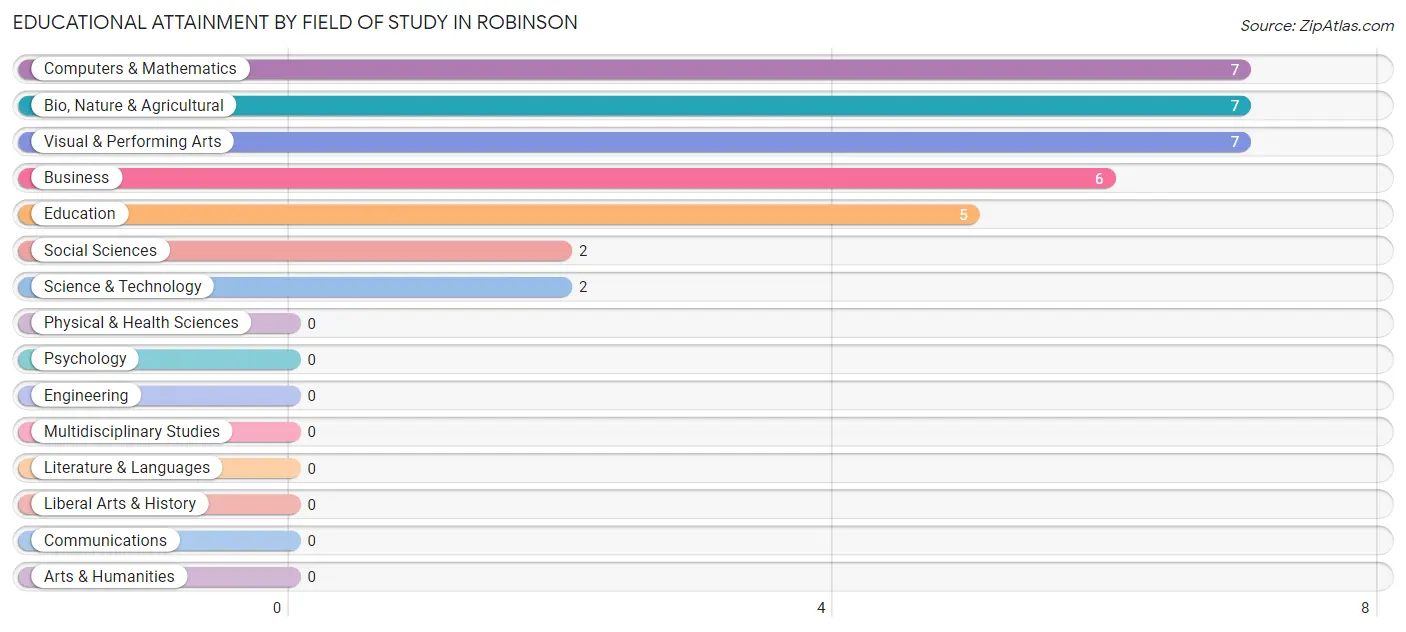
| Field of Study | # Graduates | % Graduates |
| Computers & Mathematics | 7 | 19.4% |
| Bio, Nature & Agricultural | 7 | 19.4% |
| Physical & Health Sciences | 0 | 0.0% |
| Psychology | 0 | 0.0% |
| Social Sciences | 2 | 5.6% |
| Engineering | 0 | 0.0% |
| Multidisciplinary Studies | 0 | 0.0% |
| Science & Technology | 2 | 5.6% |
| Business | 6 | 16.7% |
| Education | 5 | 13.9% |
| Literature & Languages | 0 | 0.0% |
| Liberal Arts & History | 0 | 0.0% |
| Visual & Performing Arts | 7 | 19.4% |
| Communications | 0 | 0.0% |
| Arts & Humanities | 0 | 0.0% |
| Total | 36 | 100.0% |
Transportation & Commute in Robinson
Vehicle Availability by Sex in Robinson
The most prevalent vehicle ownership categories in Robinson are males with 2 vehicles (61, accounting for 73.5%) and females with 2 vehicles (54, making up 68.5%).
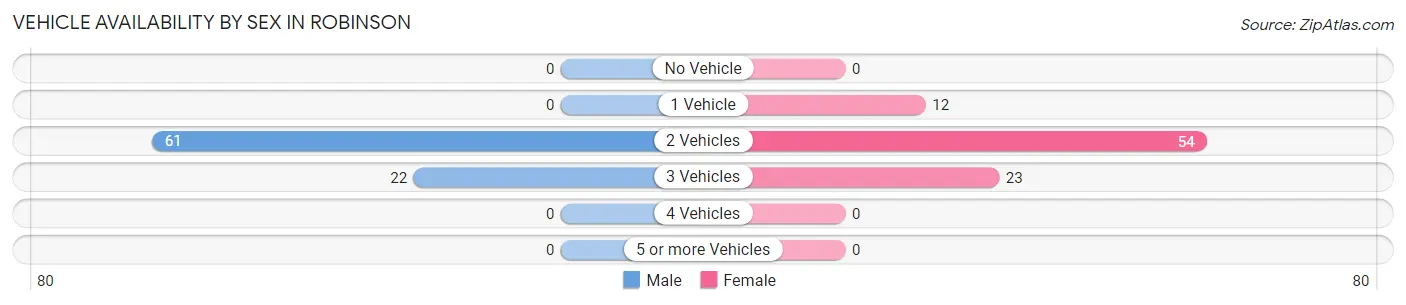
| Vehicles Available | Male | Female |
| No Vehicle | 0 (0.0%) | 0 (0.0%) |
| 1 Vehicle | 0 (0.0%) | 12 (13.5%) |
| 2 Vehicles | 61 (73.5%) | 54 (60.7%) |
| 3 Vehicles | 22 (26.5%) | 23 (25.8%) |
| 4 Vehicles | 0 (0.0%) | 0 (0.0%) |
| 5 or more Vehicles | 0 (0.0%) | 0 (0.0%) |
| Total | 83 (100.0%) | 89 (100.0%) |
Commute Time in Robinson
The most frequently occuring commute durations in Robinson are 30 to 34 minutes (47 commuters, 28.7%), 45 to 59 minutes (25 commuters, 15.2%), and 20 to 24 minutes (24 commuters, 14.6%).
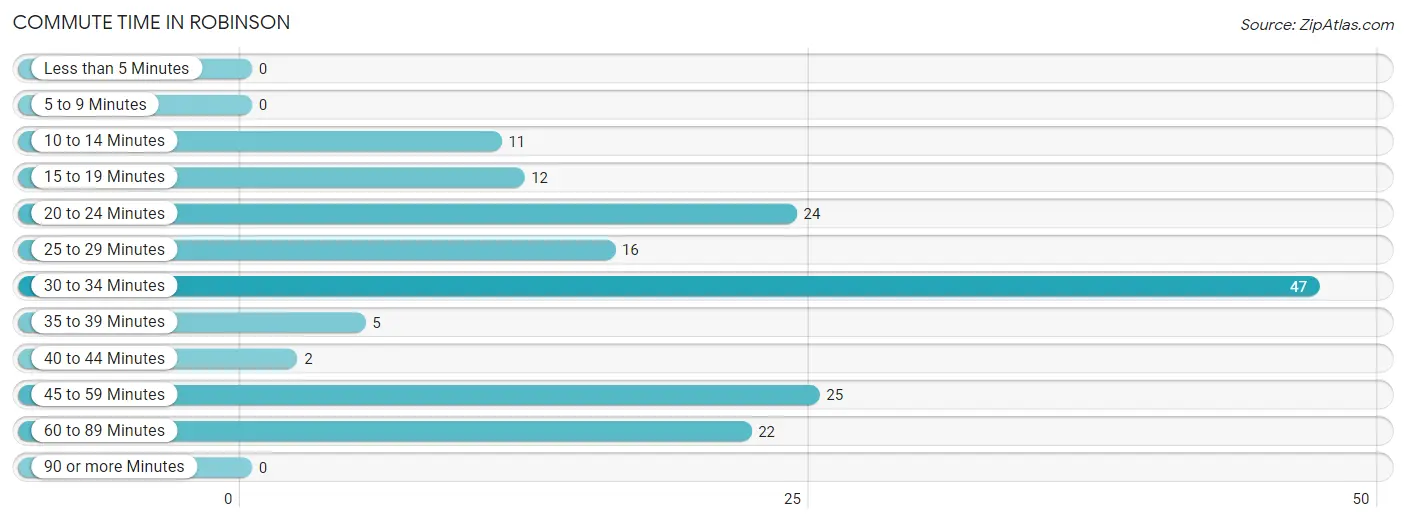
| Commute Time | # Commuters | % Commuters |
| Less than 5 Minutes | 0 | 0.0% |
| 5 to 9 Minutes | 0 | 0.0% |
| 10 to 14 Minutes | 11 | 6.7% |
| 15 to 19 Minutes | 12 | 7.3% |
| 20 to 24 Minutes | 24 | 14.6% |
| 25 to 29 Minutes | 16 | 9.8% |
| 30 to 34 Minutes | 47 | 28.7% |
| 35 to 39 Minutes | 5 | 3.0% |
| 40 to 44 Minutes | 2 | 1.2% |
| 45 to 59 Minutes | 25 | 15.2% |
| 60 to 89 Minutes | 22 | 13.4% |
| 90 or more Minutes | 0 | 0.0% |
Commute Time by Sex in Robinson
The most common commute times in Robinson are 60 to 89 minutes (22 commuters, 26.5%) for males and 30 to 34 minutes (41 commuters, 50.6%) for females.
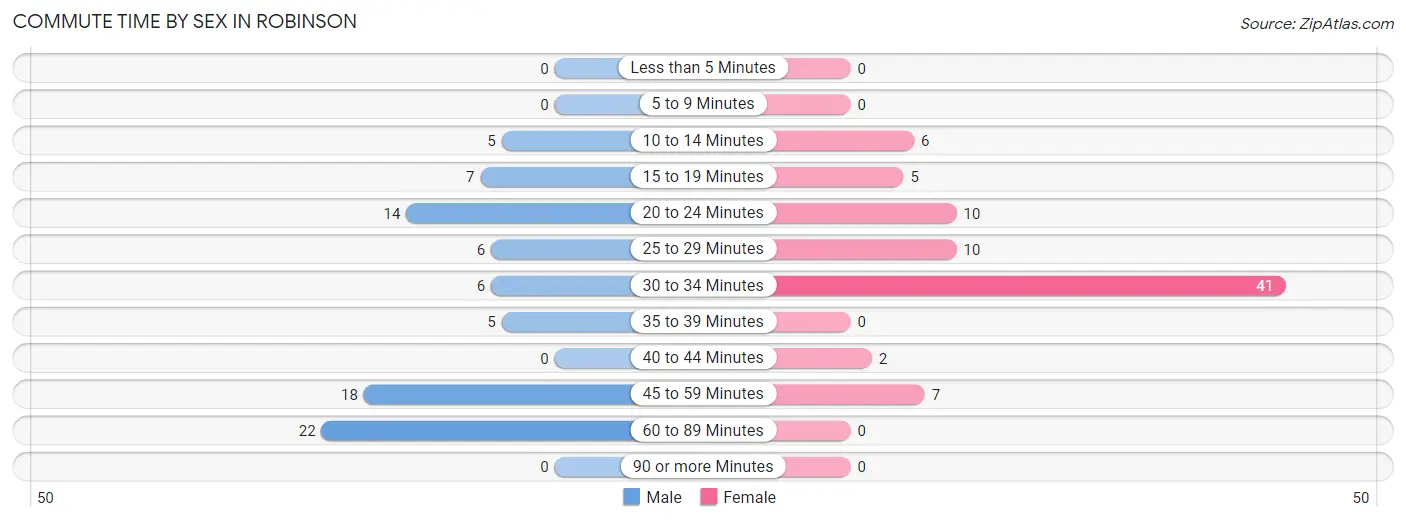
| Commute Time | Male | Female |
| Less than 5 Minutes | 0 (0.0%) | 0 (0.0%) |
| 5 to 9 Minutes | 0 (0.0%) | 0 (0.0%) |
| 10 to 14 Minutes | 5 (6.0%) | 6 (7.4%) |
| 15 to 19 Minutes | 7 (8.4%) | 5 (6.2%) |
| 20 to 24 Minutes | 14 (16.9%) | 10 (12.3%) |
| 25 to 29 Minutes | 6 (7.2%) | 10 (12.3%) |
| 30 to 34 Minutes | 6 (7.2%) | 41 (50.6%) |
| 35 to 39 Minutes | 5 (6.0%) | 0 (0.0%) |
| 40 to 44 Minutes | 0 (0.0%) | 2 (2.5%) |
| 45 to 59 Minutes | 18 (21.7%) | 7 (8.6%) |
| 60 to 89 Minutes | 22 (26.5%) | 0 (0.0%) |
| 90 or more Minutes | 0 (0.0%) | 0 (0.0%) |
Time of Departure to Work by Sex in Robinson
The most frequent times of departure to work in Robinson are 10:00 AM to 10:59 AM (22, 26.5%) for males and 6:30 AM to 6:59 AM (27, 33.3%) for females.
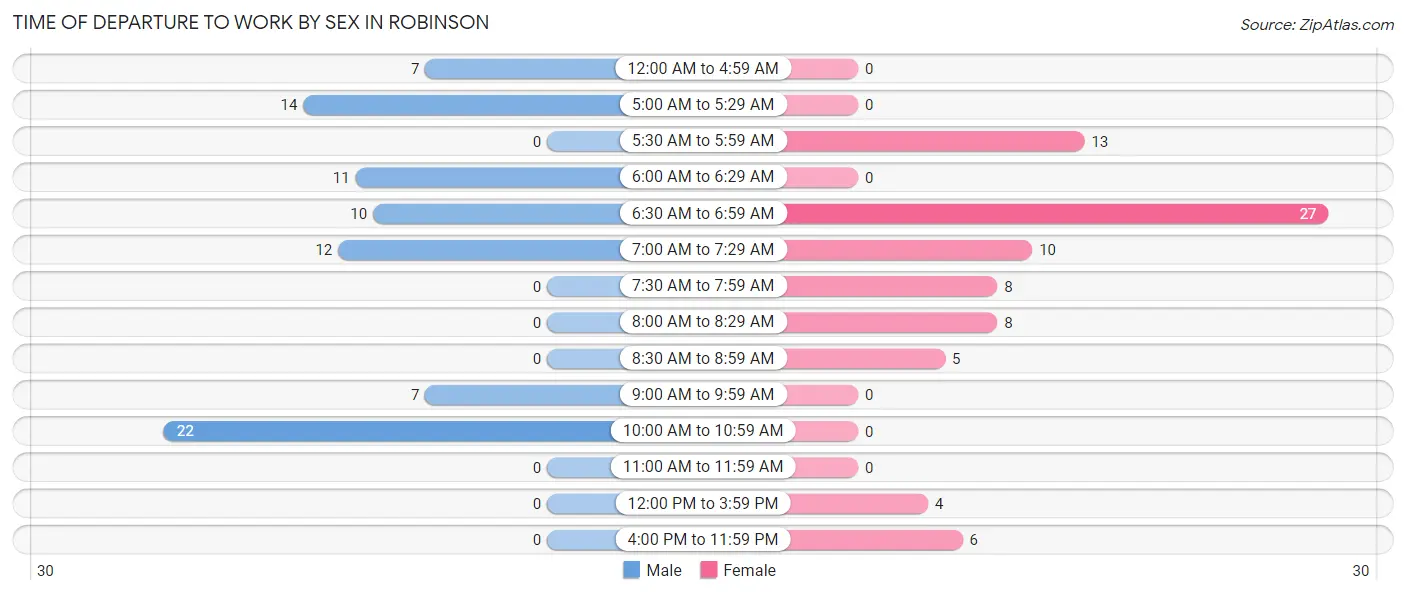
| Time of Departure | Male | Female |
| 12:00 AM to 4:59 AM | 7 (8.4%) | 0 (0.0%) |
| 5:00 AM to 5:29 AM | 14 (16.9%) | 0 (0.0%) |
| 5:30 AM to 5:59 AM | 0 (0.0%) | 13 (16.1%) |
| 6:00 AM to 6:29 AM | 11 (13.3%) | 0 (0.0%) |
| 6:30 AM to 6:59 AM | 10 (12.0%) | 27 (33.3%) |
| 7:00 AM to 7:29 AM | 12 (14.5%) | 10 (12.3%) |
| 7:30 AM to 7:59 AM | 0 (0.0%) | 8 (9.9%) |
| 8:00 AM to 8:29 AM | 0 (0.0%) | 8 (9.9%) |
| 8:30 AM to 8:59 AM | 0 (0.0%) | 5 (6.2%) |
| 9:00 AM to 9:59 AM | 7 (8.4%) | 0 (0.0%) |
| 10:00 AM to 10:59 AM | 22 (26.5%) | 0 (0.0%) |
| 11:00 AM to 11:59 AM | 0 (0.0%) | 0 (0.0%) |
| 12:00 PM to 3:59 PM | 0 (0.0%) | 4 (4.9%) |
| 4:00 PM to 11:59 PM | 0 (0.0%) | 6 (7.4%) |
| Total | 83 (100.0%) | 81 (100.0%) |
Housing Occupancy in Robinson
Occupancy by Ownership in Robinson
Of the total 220 dwellings in Robinson, owner-occupied units account for 183 (83.2%), while renter-occupied units make up 37 (16.8%).
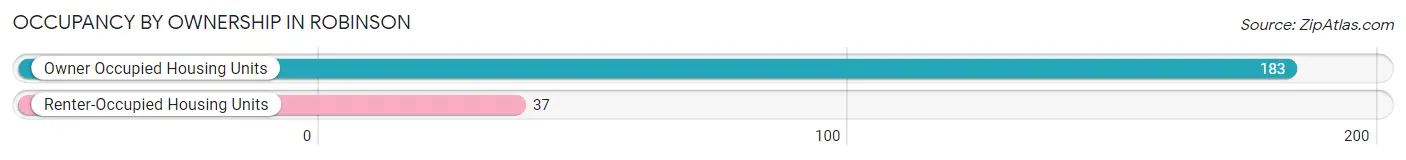
| Occupancy | # Housing Units | % Housing Units |
| Owner Occupied Housing Units | 183 | 83.2% |
| Renter-Occupied Housing Units | 37 | 16.8% |
| Total Occupied Housing Units | 220 | 100.0% |
Occupancy by Household Size in Robinson
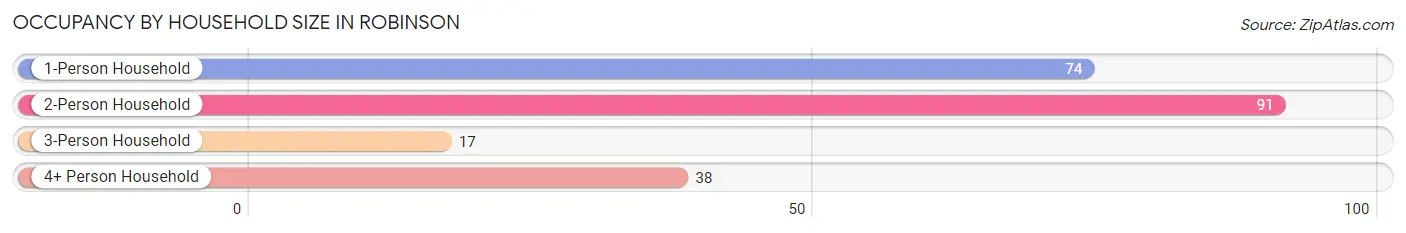
| Household Size | # Housing Units | % Housing Units |
| 1-Person Household | 74 | 33.6% |
| 2-Person Household | 91 | 41.4% |
| 3-Person Household | 17 | 7.7% |
| 4+ Person Household | 38 | 17.3% |
| Total Housing Units | 220 | 100.0% |
Occupancy by Ownership by Household Size in Robinson
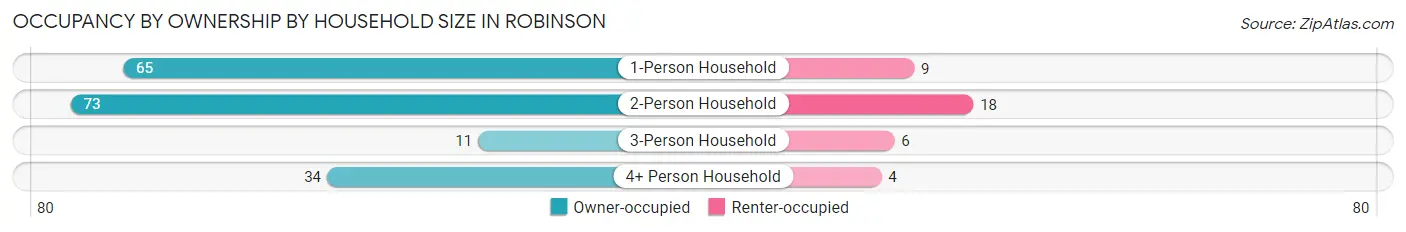
| Household Size | Owner-occupied | Renter-occupied |
| 1-Person Household | 65 (87.8%) | 9 (12.2%) |
| 2-Person Household | 73 (80.2%) | 18 (19.8%) |
| 3-Person Household | 11 (64.7%) | 6 (35.3%) |
| 4+ Person Household | 34 (89.5%) | 4 (10.5%) |
| Total Housing Units | 183 (83.2%) | 37 (16.8%) |
Occupancy by Educational Attainment in Robinson
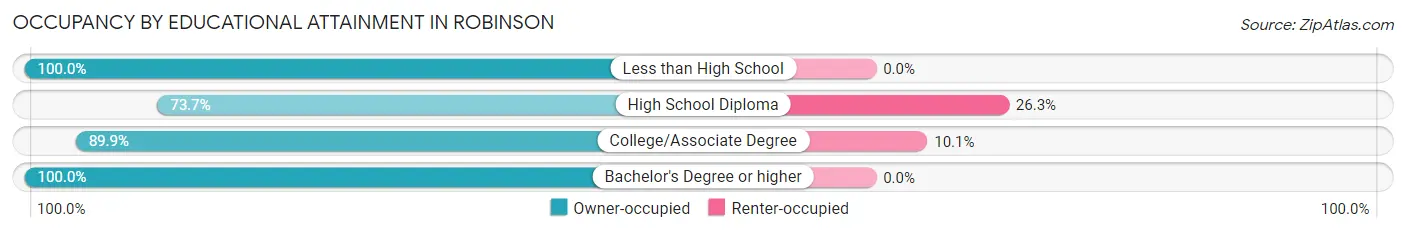
| Household Size | Owner-occupied | Renter-occupied |
| Less than High School | 10 (100.0%) | 0 (0.0%) |
| High School Diploma | 84 (73.7%) | 30 (26.3%) |
| College/Associate Degree | 62 (89.9%) | 7 (10.1%) |
| Bachelor's Degree or higher | 27 (100.0%) | 0 (0.0%) |
Occupancy by Age of Householder in Robinson
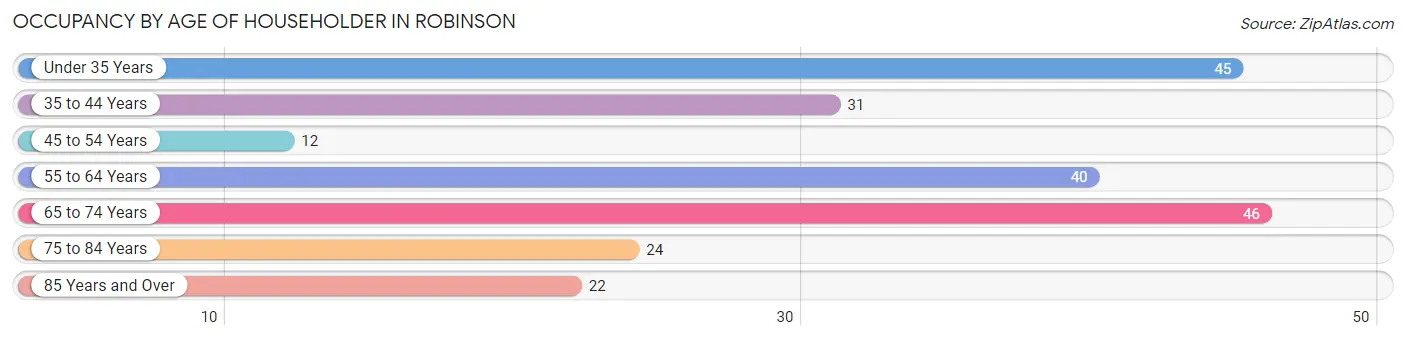
| Age Bracket | # Households | % Households |
| Under 35 Years | 45 | 20.4% |
| 35 to 44 Years | 31 | 14.1% |
| 45 to 54 Years | 12 | 5.4% |
| 55 to 64 Years | 40 | 18.2% |
| 65 to 74 Years | 46 | 20.9% |
| 75 to 84 Years | 24 | 10.9% |
| 85 Years and Over | 22 | 10.0% |
| Total | 220 | 100.0% |
Housing Finances in Robinson
Median Income by Occupancy in Robinson
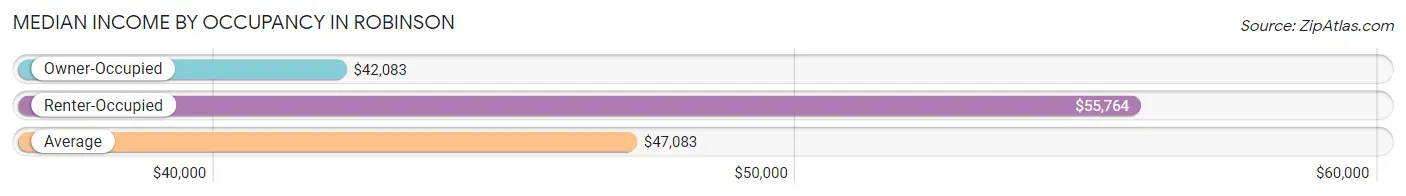
| Occupancy Type | # Households | Median Income |
| Owner-Occupied | 183 (83.2%) | $42,083 |
| Renter-Occupied | 37 (16.8%) | $55,764 |
| Average | 220 (100.0%) | $47,083 |
Occupancy by Householder Income Bracket in Robinson
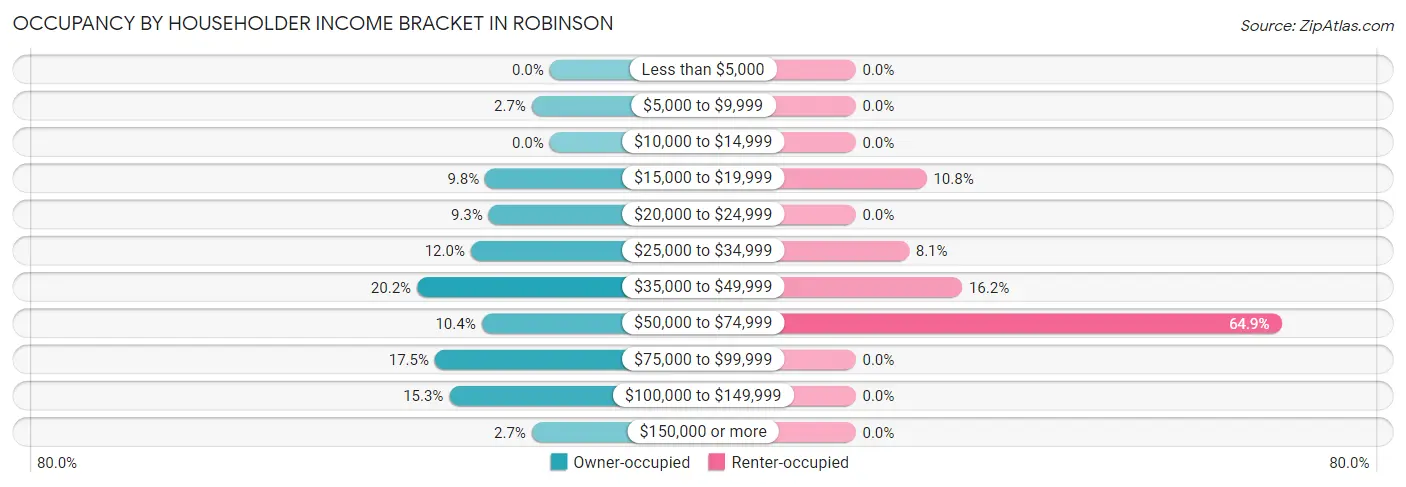
| Income Bracket | Owner-occupied | Renter-occupied |
| Less than $5,000 | 0 (0.0%) | 0 (0.0%) |
| $5,000 to $9,999 | 5 (2.7%) | 0 (0.0%) |
| $10,000 to $14,999 | 0 (0.0%) | 0 (0.0%) |
| $15,000 to $19,999 | 18 (9.8%) | 4 (10.8%) |
| $20,000 to $24,999 | 17 (9.3%) | 0 (0.0%) |
| $25,000 to $34,999 | 22 (12.0%) | 3 (8.1%) |
| $35,000 to $49,999 | 37 (20.2%) | 6 (16.2%) |
| $50,000 to $74,999 | 19 (10.4%) | 24 (64.9%) |
| $75,000 to $99,999 | 32 (17.5%) | 0 (0.0%) |
| $100,000 to $149,999 | 28 (15.3%) | 0 (0.0%) |
| $150,000 or more | 5 (2.7%) | 0 (0.0%) |
| Total | 183 (100.0%) | 37 (100.0%) |
Monthly Housing Cost Tiers in Robinson
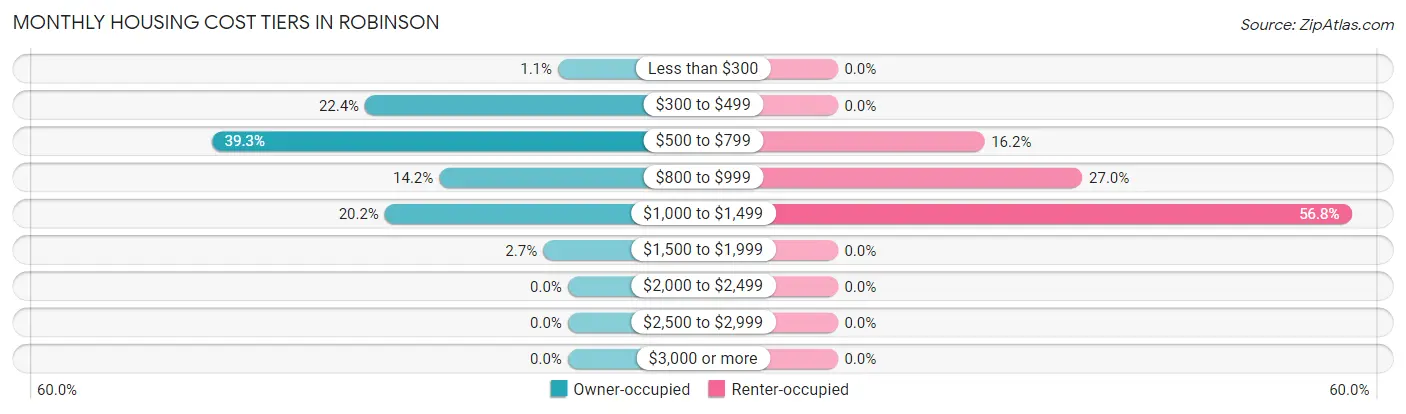
| Monthly Cost | Owner-occupied | Renter-occupied |
| Less than $300 | 2 (1.1%) | 0 (0.0%) |
| $300 to $499 | 41 (22.4%) | 0 (0.0%) |
| $500 to $799 | 72 (39.3%) | 6 (16.2%) |
| $800 to $999 | 26 (14.2%) | 10 (27.0%) |
| $1,000 to $1,499 | 37 (20.2%) | 21 (56.8%) |
| $1,500 to $1,999 | 5 (2.7%) | 0 (0.0%) |
| $2,000 to $2,499 | 0 (0.0%) | 0 (0.0%) |
| $2,500 to $2,999 | 0 (0.0%) | 0 (0.0%) |
| $3,000 or more | 0 (0.0%) | 0 (0.0%) |
| Total | 183 (100.0%) | 37 (100.0%) |
Physical Housing Characteristics in Robinson
Housing Structures in Robinson
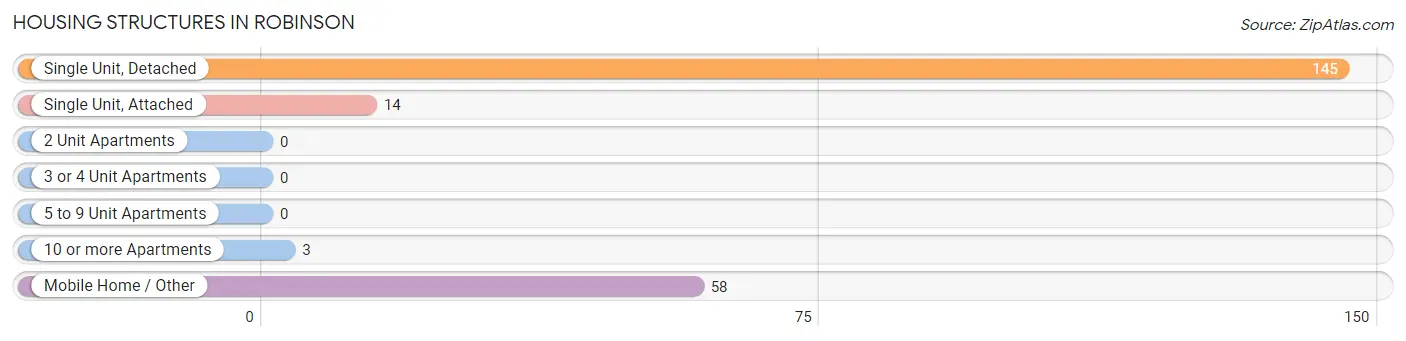
| Structure Type | # Housing Units | % Housing Units |
| Single Unit, Detached | 145 | 65.9% |
| Single Unit, Attached | 14 | 6.4% |
| 2 Unit Apartments | 0 | 0.0% |
| 3 or 4 Unit Apartments | 0 | 0.0% |
| 5 to 9 Unit Apartments | 0 | 0.0% |
| 10 or more Apartments | 3 | 1.4% |
| Mobile Home / Other | 58 | 26.4% |
| Total | 220 | 100.0% |
Housing Structures by Occupancy in Robinson
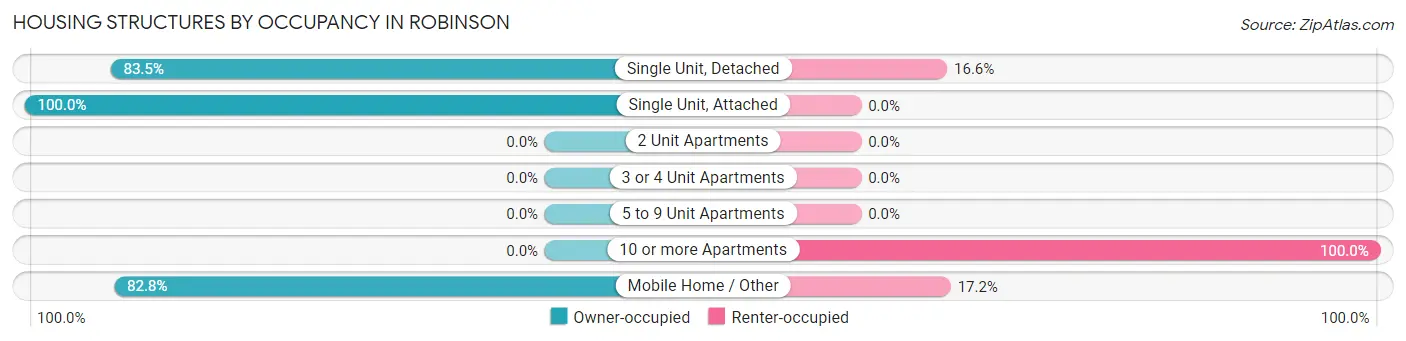
| Structure Type | Owner-occupied | Renter-occupied |
| Single Unit, Detached | 121 (83.5%) | 24 (16.6%) |
| Single Unit, Attached | 14 (100.0%) | 0 (0.0%) |
| 2 Unit Apartments | 0 (0.0%) | 0 (0.0%) |
| 3 or 4 Unit Apartments | 0 (0.0%) | 0 (0.0%) |
| 5 to 9 Unit Apartments | 0 (0.0%) | 0 (0.0%) |
| 10 or more Apartments | 0 (0.0%) | 3 (100.0%) |
| Mobile Home / Other | 48 (82.8%) | 10 (17.2%) |
| Total | 183 (83.2%) | 37 (16.8%) |
Housing Structures by Number of Rooms in Robinson
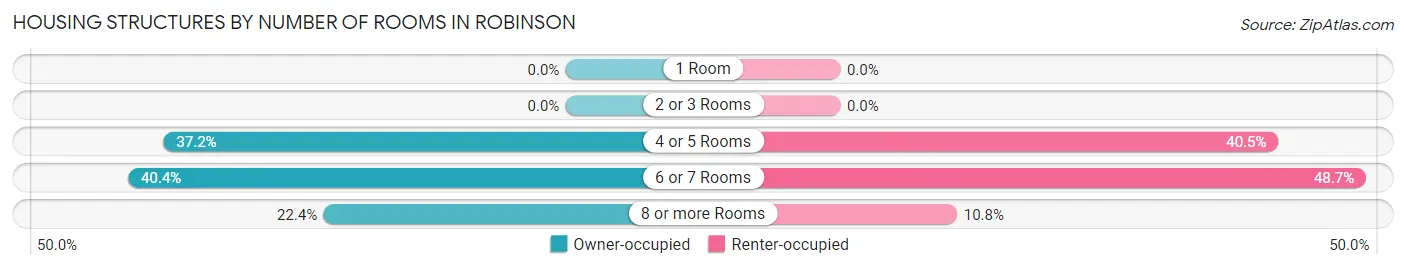
| Number of Rooms | Owner-occupied | Renter-occupied |
| 1 Room | 0 (0.0%) | 0 (0.0%) |
| 2 or 3 Rooms | 0 (0.0%) | 0 (0.0%) |
| 4 or 5 Rooms | 68 (37.2%) | 15 (40.5%) |
| 6 or 7 Rooms | 74 (40.4%) | 18 (48.6%) |
| 8 or more Rooms | 41 (22.4%) | 4 (10.8%) |
| Total | 183 (100.0%) | 37 (100.0%) |
Housing Structure by Heating Type in Robinson
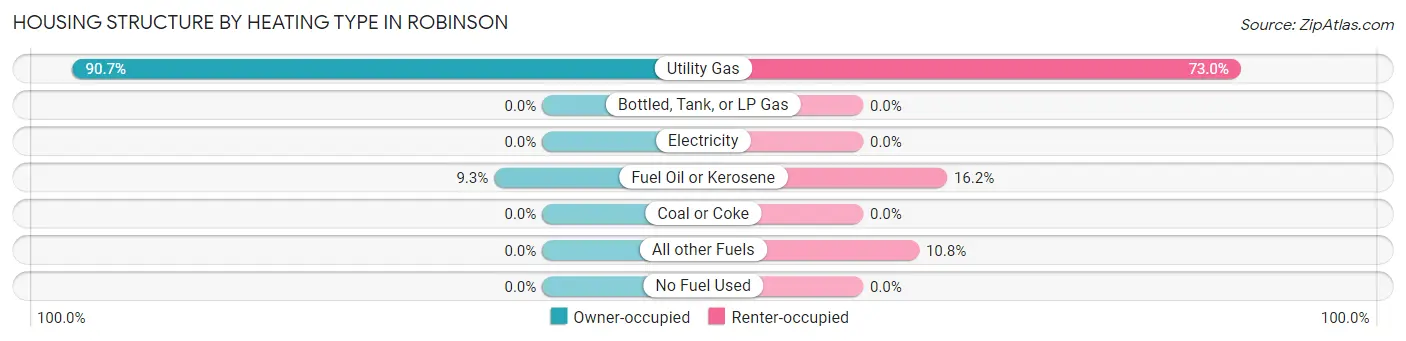
| Heating Type | Owner-occupied | Renter-occupied |
| Utility Gas | 166 (90.7%) | 27 (73.0%) |
| Bottled, Tank, or LP Gas | 0 (0.0%) | 0 (0.0%) |
| Electricity | 0 (0.0%) | 0 (0.0%) |
| Fuel Oil or Kerosene | 17 (9.3%) | 6 (16.2%) |
| Coal or Coke | 0 (0.0%) | 0 (0.0%) |
| All other Fuels | 0 (0.0%) | 4 (10.8%) |
| No Fuel Used | 0 (0.0%) | 0 (0.0%) |
| Total | 183 (100.0%) | 37 (100.0%) |
Household Vehicle Usage in Robinson
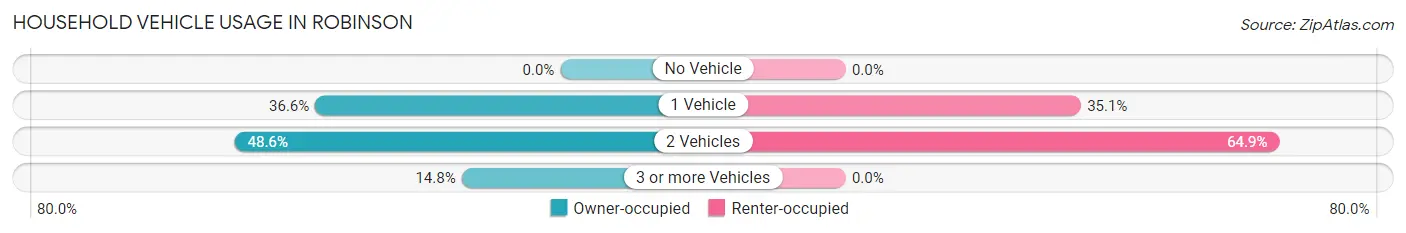
| Vehicles per Household | Owner-occupied | Renter-occupied |
| No Vehicle | 0 (0.0%) | 0 (0.0%) |
| 1 Vehicle | 67 (36.6%) | 13 (35.1%) |
| 2 Vehicles | 89 (48.6%) | 24 (64.9%) |
| 3 or more Vehicles | 27 (14.7%) | 0 (0.0%) |
| Total | 183 (100.0%) | 37 (100.0%) |
Real Estate & Mortgages in Robinson
Real Estate and Mortgage Overview in Robinson
| Characteristic | Without Mortgage | With Mortgage |
| Housing Units | 85 | 98 |
| Median Property Value | $45,200 | $63,300 |
| Median Household Income | $39,191 | $0 |
| Monthly Housing Costs | $497 | $0 |
| Real Estate Taxes | $1,387 | $0 |
Property Value by Mortgage Status in Robinson
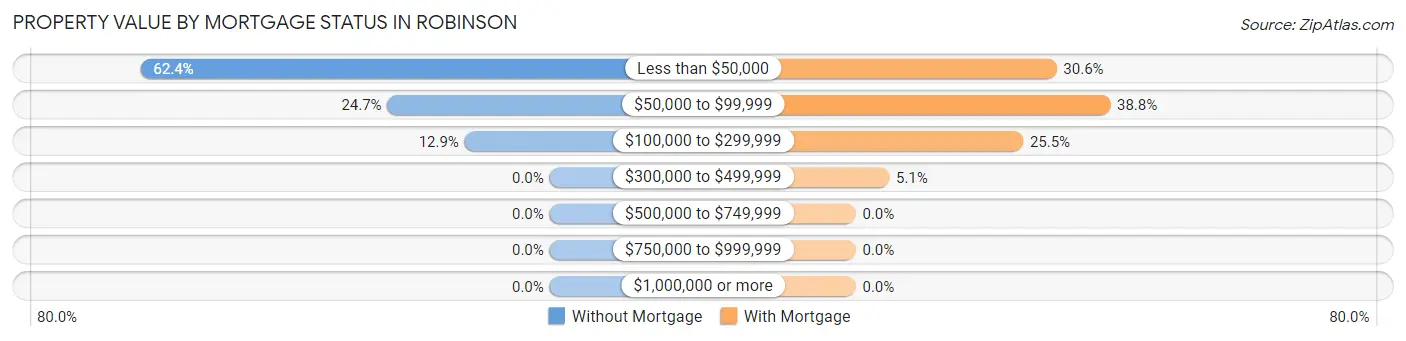
| Property Value | Without Mortgage | With Mortgage |
| Less than $50,000 | 53 (62.4%) | 30 (30.6%) |
| $50,000 to $99,999 | 21 (24.7%) | 38 (38.8%) |
| $100,000 to $299,999 | 11 (12.9%) | 25 (25.5%) |
| $300,000 to $499,999 | 0 (0.0%) | 5 (5.1%) |
| $500,000 to $749,999 | 0 (0.0%) | 0 (0.0%) |
| $750,000 to $999,999 | 0 (0.0%) | 0 (0.0%) |
| $1,000,000 or more | 0 (0.0%) | 0 (0.0%) |
| Total | 85 (100.0%) | 98 (100.0%) |
Household Income by Mortgage Status in Robinson
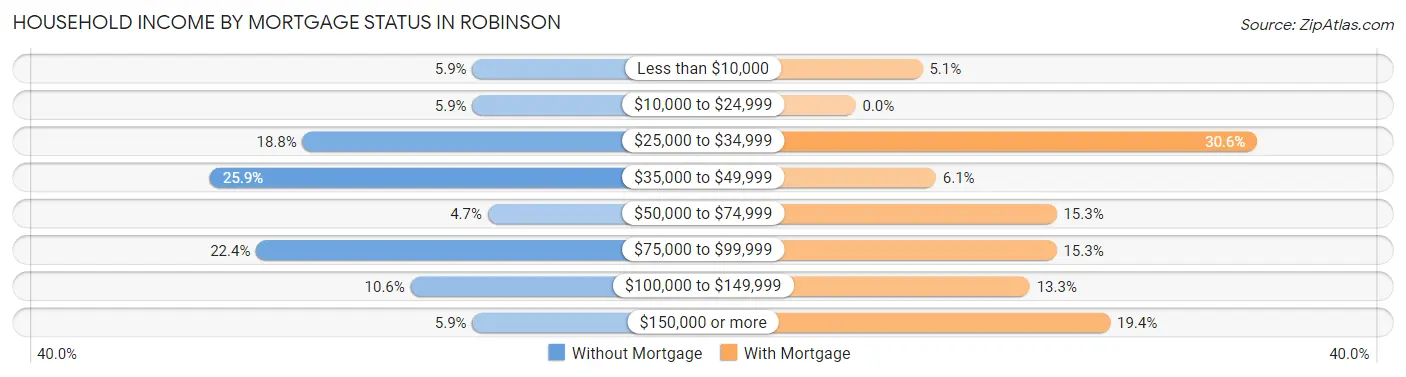
| Household Income | Without Mortgage | With Mortgage |
| Less than $10,000 | 5 (5.9%) | 5 (5.1%) |
| $10,000 to $24,999 | 5 (5.9%) | 0 (0.0%) |
| $25,000 to $34,999 | 16 (18.8%) | 30 (30.6%) |
| $35,000 to $49,999 | 22 (25.9%) | 6 (6.1%) |
| $50,000 to $74,999 | 4 (4.7%) | 15 (15.3%) |
| $75,000 to $99,999 | 19 (22.4%) | 15 (15.3%) |
| $100,000 to $149,999 | 9 (10.6%) | 13 (13.3%) |
| $150,000 or more | 5 (5.9%) | 19 (19.4%) |
| Total | 85 (100.0%) | 98 (100.0%) |
Property Value to Household Income Ratio in Robinson
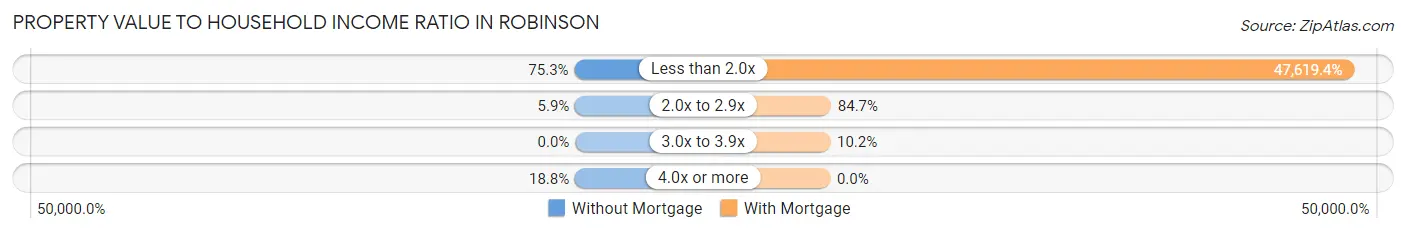
| Value-to-Income Ratio | Without Mortgage | With Mortgage |
| Less than 2.0x | 64 (75.3%) | 46,667 (47,619.4%) |
| 2.0x to 2.9x | 5 (5.9%) | 83 (84.7%) |
| 3.0x to 3.9x | 0 (0.0%) | 10 (10.2%) |
| 4.0x or more | 16 (18.8%) | 0 (0.0%) |
| Total | 85 (100.0%) | 98 (100.0%) |
Real Estate Taxes by Mortgage Status in Robinson
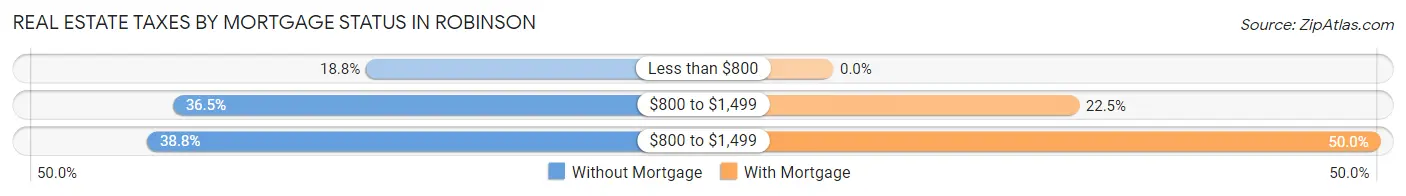
| Property Taxes | Without Mortgage | With Mortgage |
| Less than $800 | 16 (18.8%) | 0 (0.0%) |
| $800 to $1,499 | 31 (36.5%) | 22 (22.5%) |
| $800 to $1,499 | 33 (38.8%) | 49 (50.0%) |
| Total | 85 (100.0%) | 98 (100.0%) |
Health & Disability in Robinson
Health Insurance Coverage by Age in Robinson
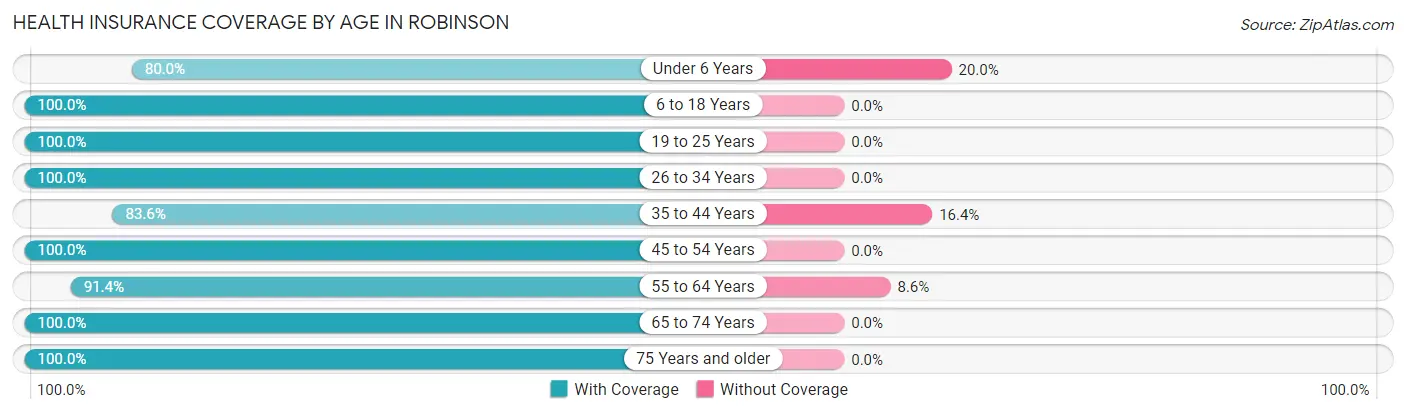
| Age Bracket | With Coverage | Without Coverage |
| Under 6 Years | 20 (80.0%) | 5 (20.0%) |
| 6 to 18 Years | 81 (100.0%) | 0 (0.0%) |
| 19 to 25 Years | 29 (100.0%) | 0 (0.0%) |
| 26 to 34 Years | 83 (100.0%) | 0 (0.0%) |
| 35 to 44 Years | 51 (83.6%) | 10 (16.4%) |
| 45 to 54 Years | 16 (100.0%) | 0 (0.0%) |
| 55 to 64 Years | 53 (91.4%) | 5 (8.6%) |
| 65 to 74 Years | 48 (100.0%) | 0 (0.0%) |
| 75 Years and older | 95 (100.0%) | 0 (0.0%) |
| Total | 476 (96.0%) | 20 (4.0%) |
Health Insurance Coverage by Citizenship Status in Robinson
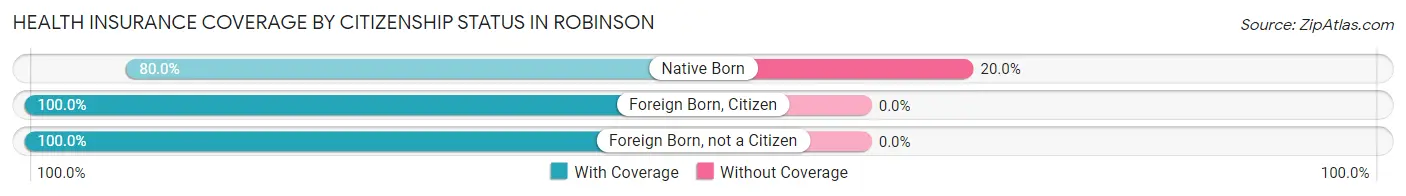
| Citizenship Status | With Coverage | Without Coverage |
| Native Born | 20 (80.0%) | 5 (20.0%) |
| Foreign Born, Citizen | 81 (100.0%) | 0 (0.0%) |
| Foreign Born, not a Citizen | 29 (100.0%) | 0 (0.0%) |
Health Insurance Coverage by Household Income in Robinson
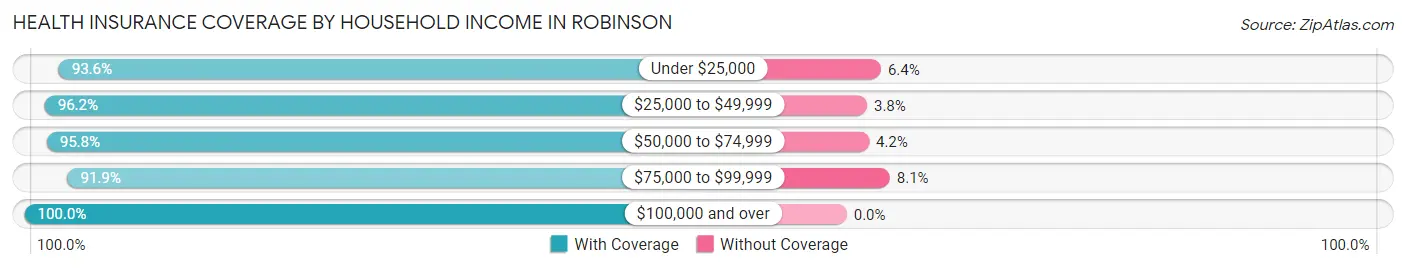
| Household Income | With Coverage | Without Coverage |
| Under $25,000 | 73 (93.6%) | 5 (6.4%) |
| $25,000 to $49,999 | 127 (96.2%) | 5 (3.8%) |
| $50,000 to $74,999 | 115 (95.8%) | 5 (4.2%) |
| $75,000 to $99,999 | 57 (91.9%) | 5 (8.1%) |
| $100,000 and over | 104 (100.0%) | 0 (0.0%) |
Public vs Private Health Insurance Coverage by Age in Robinson
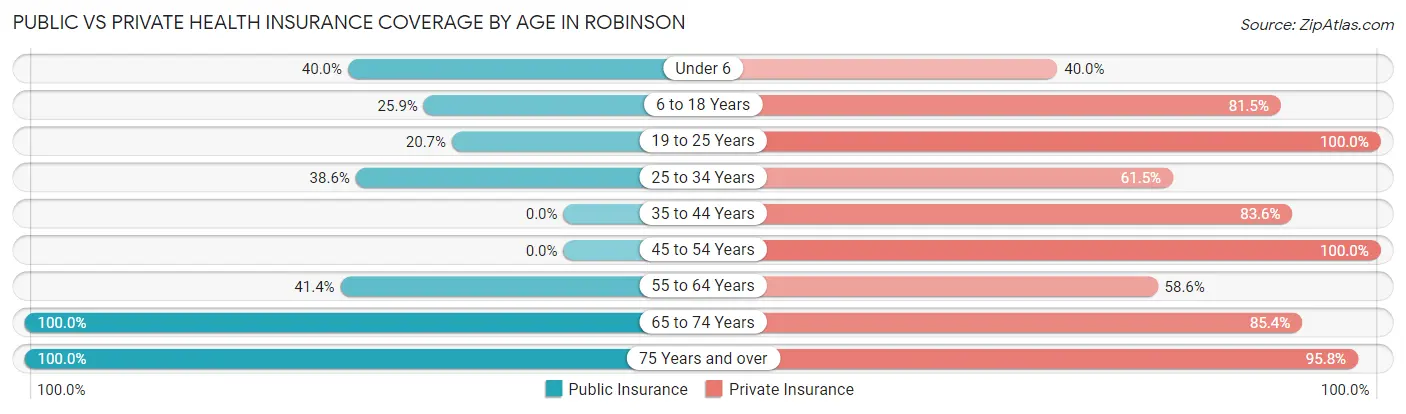
| Age Bracket | Public Insurance | Private Insurance |
| Under 6 | 10 (40.0%) | 10 (40.0%) |
| 6 to 18 Years | 21 (25.9%) | 66 (81.5%) |
| 19 to 25 Years | 6 (20.7%) | 29 (100.0%) |
| 25 to 34 Years | 32 (38.6%) | 51 (61.5%) |
| 35 to 44 Years | 0 (0.0%) | 51 (83.6%) |
| 45 to 54 Years | 0 (0.0%) | 16 (100.0%) |
| 55 to 64 Years | 24 (41.4%) | 34 (58.6%) |
| 65 to 74 Years | 48 (100.0%) | 41 (85.4%) |
| 75 Years and over | 95 (100.0%) | 91 (95.8%) |
| Total | 236 (47.6%) | 389 (78.4%) |
Disability Status by Sex by Age in Robinson
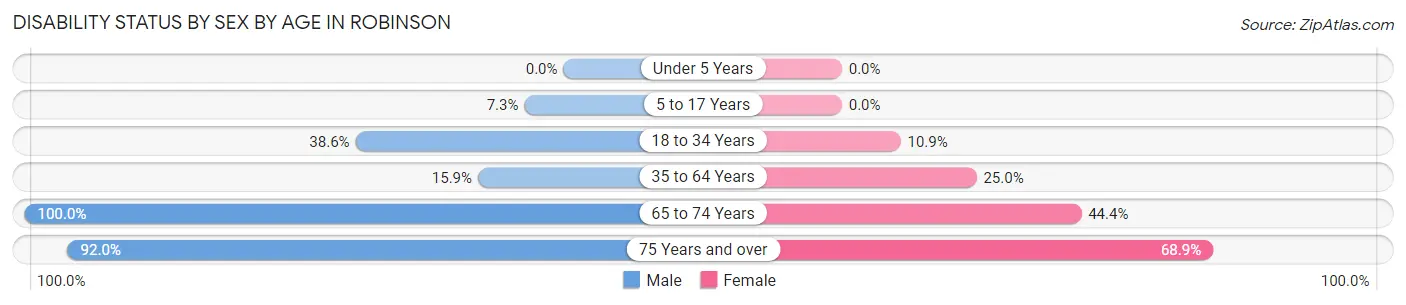
| Age Bracket | Male | Female |
| Under 5 Years | 0 (0.0%) | 0 (0.0%) |
| 5 to 17 Years | 5 (7.2%) | 0 (0.0%) |
| 18 to 34 Years | 22 (38.6%) | 6 (10.9%) |
| 35 to 64 Years | 10 (15.9%) | 18 (25.0%) |
| 65 to 74 Years | 12 (100.0%) | 16 (44.4%) |
| 75 Years and over | 46 (92.0%) | 31 (68.9%) |
Disability Class by Sex by Age in Robinson
Disability Class: Hearing Difficulty
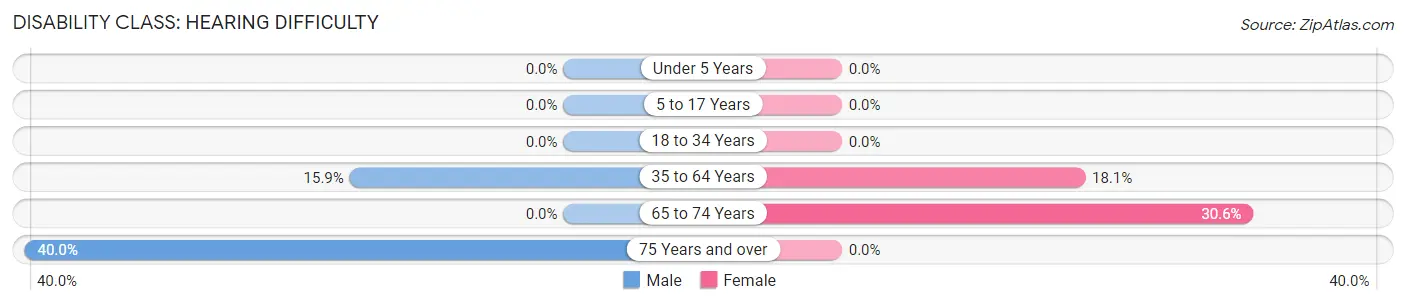
| Age Bracket | Male | Female |
| Under 5 Years | 0 (0.0%) | 0 (0.0%) |
| 5 to 17 Years | 0 (0.0%) | 0 (0.0%) |
| 18 to 34 Years | 0 (0.0%) | 0 (0.0%) |
| 35 to 64 Years | 10 (15.9%) | 13 (18.1%) |
| 65 to 74 Years | 0 (0.0%) | 11 (30.6%) |
| 75 Years and over | 20 (40.0%) | 0 (0.0%) |
Disability Class: Vision Difficulty
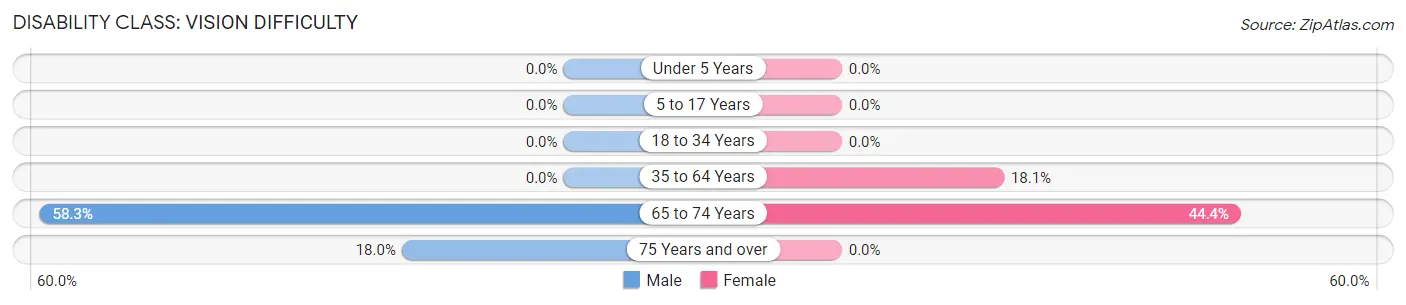
| Age Bracket | Male | Female |
| Under 5 Years | 0 (0.0%) | 0 (0.0%) |
| 5 to 17 Years | 0 (0.0%) | 0 (0.0%) |
| 18 to 34 Years | 0 (0.0%) | 0 (0.0%) |
| 35 to 64 Years | 0 (0.0%) | 13 (18.1%) |
| 65 to 74 Years | 7 (58.3%) | 16 (44.4%) |
| 75 Years and over | 9 (18.0%) | 0 (0.0%) |
Disability Class: Cognitive Difficulty
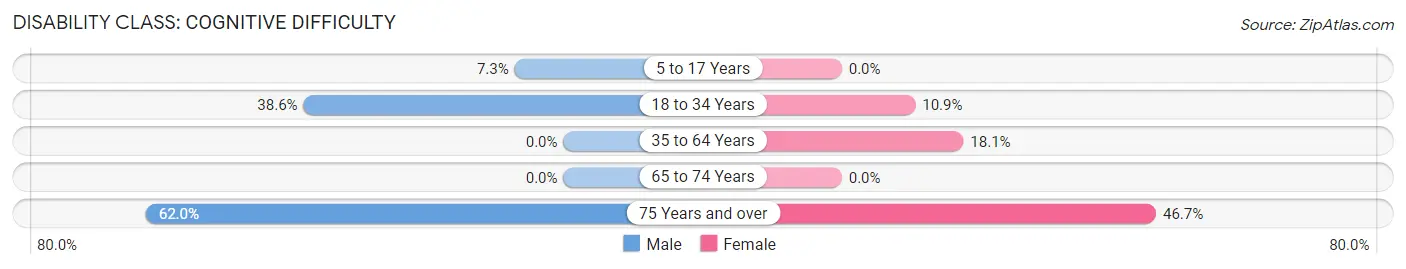
| Age Bracket | Male | Female |
| 5 to 17 Years | 5 (7.2%) | 0 (0.0%) |
| 18 to 34 Years | 22 (38.6%) | 6 (10.9%) |
| 35 to 64 Years | 0 (0.0%) | 13 (18.1%) |
| 65 to 74 Years | 0 (0.0%) | 0 (0.0%) |
| 75 Years and over | 31 (62.0%) | 21 (46.7%) |
Disability Class: Ambulatory Difficulty
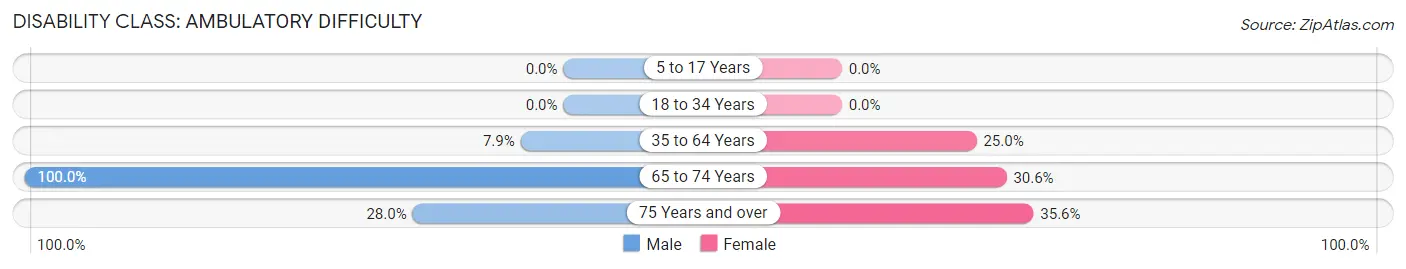
| Age Bracket | Male | Female |
| 5 to 17 Years | 0 (0.0%) | 0 (0.0%) |
| 18 to 34 Years | 0 (0.0%) | 0 (0.0%) |
| 35 to 64 Years | 5 (7.9%) | 18 (25.0%) |
| 65 to 74 Years | 12 (100.0%) | 11 (30.6%) |
| 75 Years and over | 14 (28.0%) | 16 (35.6%) |
Disability Class: Self-Care Difficulty
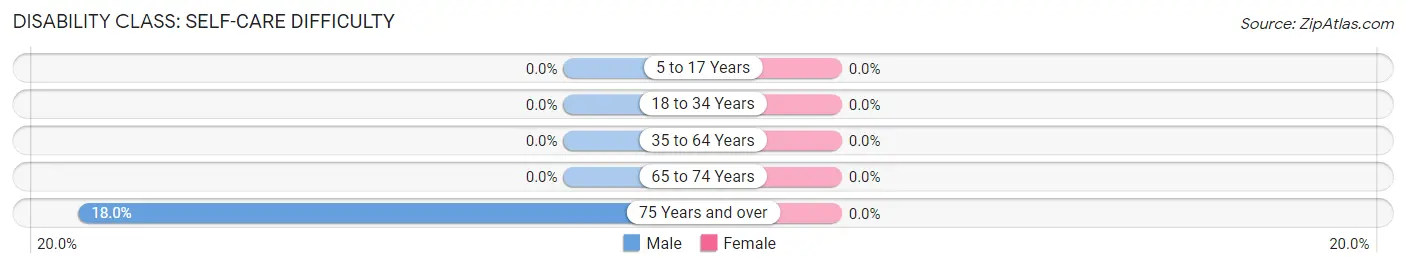
| Age Bracket | Male | Female |
| 5 to 17 Years | 0 (0.0%) | 0 (0.0%) |
| 18 to 34 Years | 0 (0.0%) | 0 (0.0%) |
| 35 to 64 Years | 0 (0.0%) | 0 (0.0%) |
| 65 to 74 Years | 0 (0.0%) | 0 (0.0%) |
| 75 Years and over | 9 (18.0%) | 0 (0.0%) |
Technology Access in Robinson
Computing Device Access in Robinson
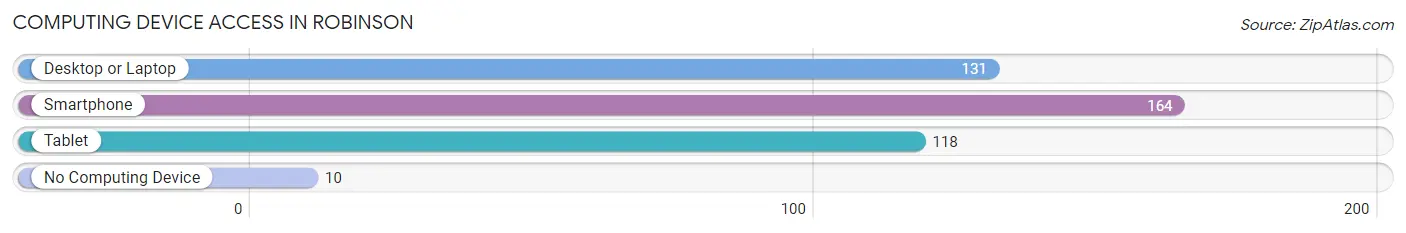
| Device Type | # Households | % Households |
| Desktop or Laptop | 131 | 59.6% |
| Smartphone | 164 | 74.6% |
| Tablet | 118 | 53.6% |
| No Computing Device | 10 | 4.5% |
| Total | 220 | 100.0% |
Internet Access in Robinson
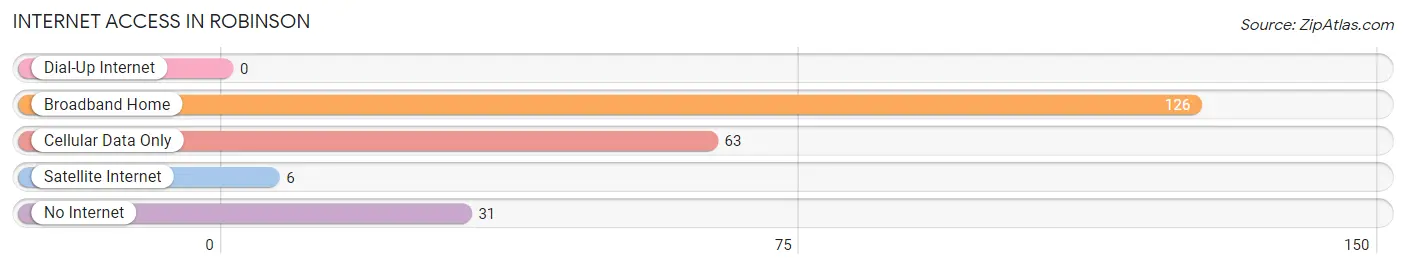
| Internet Type | # Households | % Households |
| Dial-Up Internet | 0 | 0.0% |
| Broadband Home | 126 | 57.3% |
| Cellular Data Only | 63 | 28.6% |
| Satellite Internet | 6 | 2.7% |
| No Internet | 31 | 14.1% |
| Total | 220 | 100.0% |
Robinson Summary
Robinson is a borough located in Allegheny County, Pennsylvania. It is a suburb of Pittsburgh and is part of the Pittsburgh Metropolitan Statistical Area. The population of Robinson was 8,385 at the 2010 census.
History
Robinson was founded in 1851 by William Robinson, a farmer from Ireland. The area was originally known as Robinson's Crossroads, and was later renamed Robinson's Station. The borough was officially incorporated in 1872.
Robinson was a rural farming community until the 1950s, when the population began to grow rapidly due to the expansion of the Pittsburgh metropolitan area. The population of Robinson has continued to grow since then, and the borough is now a thriving suburban community.
Geography
Robinson is located in western Allegheny County, approximately 10 miles west of downtown Pittsburgh. The borough is bordered by the boroughs of Ingram and Crafton to the north, Kennedy Township to the east, and Scott Township to the south and west.
Robinson is situated on a plateau, with an elevation of 1,000 feet above sea level. The borough is located in the Allegheny Plateau region of Pennsylvania, and is characterized by rolling hills and valleys. The borough is drained by the Robinson Run, which flows into the Ohio River.
Economy
Robinson is a primarily residential community, and the majority of its residents are employed in the nearby Pittsburgh metropolitan area. The borough is home to several small businesses, including restaurants, retail stores, and professional services.
Robinson is also home to the Robinson Town Centre, a shopping mall that opened in 2002. The mall is anchored by several major retailers, including Macy's, JCPenney, and Dick's Sporting Goods.
Demographics
As of the 2010 census, Robinson had a population of 8,385. The racial makeup of the borough was 94.3% White, 2.3% African American, 0.2% Native American, 1.3% Asian, 0.1% Pacific Islander, 0.7% from other races, and 1.2% from two or more races. Hispanic or Latino of any race were 1.7% of the population.
The median household income in Robinson was $50,945, and the median family income was $60,945. The per capita income was $25,945. About 4.3% of families and 5.7% of the population were below the poverty line, including 7.2% of those under age 18 and 4.2% of those age 65 or over.
Common Questions
What is Per Capita Income in Robinson?
Per Capita income in Robinson is $26,738.
What is the Median Family Income in Robinson?
Median Family Income in Robinson is $85,167.
What is the Median Household income in Robinson?
Median Household Income in Robinson is $47,083.
What is Income or Wage Gap in Robinson?
Income or Wage Gap in Robinson is 49.1%.
Women in Robinson earn 50.9 cents for every dollar earned by a man.
What is Inequality or Gini Index in Robinson?
Inequality or Gini Index in Robinson is 0.35.
What is the Total Population of Robinson?
Total Population of Robinson is 496.
What is the Total Male Population of Robinson?
Total Male Population of Robinson is 261.
What is the Total Female Population of Robinson?
Total Female Population of Robinson is 235.
What is the Ratio of Males per 100 Females in Robinson?
There are 111.06 Males per 100 Females in Robinson.
What is the Ratio of Females per 100 Males in Robinson?
There are 90.04 Females per 100 Males in Robinson.
What is the Median Population Age in Robinson?
Median Population Age in Robinson is 39.4 Years.
What is the Average Family Size in Robinson
Average Family Size in Robinson is 3.0 People.
What is the Average Household Size in Robinson
Average Household Size in Robinson is 2.2 People.
How Large is the Labor Force in Robinson?
There are 178 People in the Labor Forcein in Robinson.
What is the Percentage of People in the Labor Force in Robinson?
45.6% of People are in the Labor Force in Robinson.
What is the Unemployment Rate in Robinson?
Unemployment Rate in Robinson is 3.4%.